FACOLTA’ DI INGEGNERIA
CORSO DI LAUREA IN INGEGNERIA CIVILE
Ingegneria Civile,Chimica, Ambientale e dei Materiali
TESI DI LAUREA in
Advanced Structural Mechanics
“In-Plane Cyclic Behavior of Substandard Confined Masonry:
Full-Scale Experiments, Finite-Elements Modeling and
Incremental Dynamic Analysis.”
CANDIDATO Marco Cavigli
RELATORE:
Dott. Ing. Alessandro Marzani
CORELATORI:
Dott. Ing. Nicola Buratti Dott. Ing. Fabio Matta
Anno Accademico 2012/13
i
Contents
Acknowledgement ………..iii
1. Introduction ...………1
1.1 Objectives ……….……….1
1.2 Back Ground and Literature Review ……….………2
1.2.1 Confined Masonry………....2
1.2.2 Failure Modes ………...3
1.2.2.1 Diagonal Shear Failure ……….4
1.2.2.2 Sliding Shear Failure ………5
1.2.2.3 In-Plane bending Failure ………...6
1.2.3 Confined Masonry Buildings, Seismic behavior ………6
1.2.4 Seismic Design ………8
1.2.5 Numerical Modeling ………..………10
2. Mechanical Characterization of the Materials ……….12
2.1 Introduction ……….12
2.2 Specimens Dimensions and material (Walls, Units, Mortar, Frame) ………..13
2.2.1 Wall Dimensions ………...13
2.2.2 Blocks (Units) ………13
2.2.3 Mortar ………14
2.2.4 Concrete ……….15
2.2.5 Steel Reinforcement ………..16
2.3 Mechanical Characterization of the Materials ……….17
2.3.1 Compression Test on Single Blocks (ASTM C140)…..………18
2.3.2 Compression Test on two-block prisms (ASTM C1314) ………..…18
2.3.3 Compression Test on concrete cylinders (ASTM C39) ………19
2.3.4 Compression test on mortar cylinders (ASTM C109) ……….20
2.3.5 Flexural test on blocks and mortar prisms (ASTM C348) ………21
2.3.6 Shear tests on mortar joints (BS EN 1052-3:2003) ………...22
2.3.7 Flexural test on mortar joints (ASTM E754) ………23
2.3.8 Compression test on small masonry walls (BS EN 1052-1:1999) ………24
3. Experimental Program ………...……25
“In-Plane Cyclic Behavior of Substandard Confined Masonry: Full-Scale Experiments, Finite-Element Modeling and Incremental Dynamic Analysis”
Contents
ii
3.2 In-Plane Cyclic Shear-Compression Tests ……….29
3.3 Experimental results ………30
3.4 Digital Image Correlation results and Crack Pattern ……….………..33
4. Numerical Modeling ………....37
4.1 Hypothesis ………...…38
4.2 Frame Modeling ………..………39
4.3 Confined Masonry wall Modeling ………...………40
4.3.1 Strut curve parameters ………41
4.3.2 Shear curve parameters ………..………42
4.3.3 Panel thickness ………...………43
4.3.4 Out of plane failure drift ………43
4.3.5 Strut Area 1 ………43
4.3.6 Strut Area 2 ………44
4.3.7 Equivalent contact length ………...………44
4.3.8 Horizontal and vertical offsets ……….………..44
4.3.9 Proportion of stiffness assigned to shear ………44
4.3.10 Specific weight γ ………..………45
4.4 Numerical results ………..………...46
5. Validation of the Model and Results of Analyses ………46
5.1 Comparison between analytical and experimental results ………..46
5.2 Definition of “q” factor for elementary Archetype ……….48
5.3 Conclusions ……….……49
6. Evaluation of q factor for Confined Masonry Building ………...50
6.1 Houses Archetypes ……….51
6.2 Accelerograms ……....……….52
6.3 Incremental Dynamic Analysis ………..……….53
6.4 Push Over Test ………58
6.5 Results ……….61
7. Conclusions ………..66
iii
Acknowledgement
The research work reported in this Thesis was conducted in part in the Department of Civil and Environment Engineering, University of South Carolina, USA, under the supervision of Dr Fabio Matta and the special help of Dr Enrico Garbin, and in part in the Department of Civil Engineering, University of Bologna, Italy under the supervision of Dr Alessandro Marzani and Dr Nicola Buratti. I wish to express them my deepest gratitude for their invaluable guidance and continuous support.
A special thanks goes to Graduate Research Assistant Rahim Ghorbani, that left me able to work with him in his research.
My gratitude for human support and their friendship in USA goes to PhD Aaron Larosche and PhD Jese Mangual, and in Italy to Ing. Federico Conconi, Ing. Paolo Azzena and Dott. Luca Venturi. You are special persons.
Thanks to my roommates and friends Laura, Giancarlo, Alberto, Andres, Alessandra, Sara and Giovanni.
A special thank for their peerless support goes to Giorgia and Lucilla.
The best acknowledgements go to my family, Mauro, Francesca and Domenico. Thank you, you are my power.
“In-Plane Cyclic Behavior of Substandard Confined Masonry: Full-Scale Experiments, Finite-Element Modeling and Incremental Dynamic Analysis”
Contents
1
1. Introduction
1.1 Objectives
The issue of the seismic performance and safety of existing masonry structures is characterized by numerous uncertainties and as in our case by a real lack of sufficient knowledge.
The aim of this work is to understand the seismic behavior of “Sub standard Confined Masonry Structures”, characterized by substandard materials and poor design knowledge, with the scope to reduce the design’s uncertainty and the number of victims involved in the seismic event.
In fact this technique is used in zones of high seismic hazard and the scope of this work it is to define, through a rational basis, the “Seismic Performance Factors” that, when properly implemented in the seismic design process, will result in equivalent safety against collapse in an earthquake, comparable to the inherent safety against collapse intended by current seismic codes, for building with different seismic-force-resisting systems [1].
This aim was been achieved through the following steps:
• investigation of materials, design and construction practices that result in substandard confined masonry structures;
• experimentation of three full scale walls with the aim to characterize the in plane behavior;
• development of an efficient FE model capable of predicting the behavior of the CM walls;
• validation of the FE model (elementary archetype);
• development of three houses’ models based on the elementary archetype;
• testing the houses’ models with 10 different type of unscaled accelerograms through the Incremental Dynamic Analysis;
• implementation of Push Over Test;
• validation of the Capacity Curve using the dynamics tests results;
“In-Plane Cyclic Behavior of Substandard Confined Masonry: Full-Scale Experiments, Finite-Element Modeling and Incremental Dynamic Analysis”
Chapter 1
2 1.2 Back ground and literature review
1.2.1 Confined Masonry
The construction of confined masonries starts in 1908, after the Messina earthquake, becoming one of the most popular and inexpensive structural construction system used for housing.
This construction is common for low-rise residential buildings and individual houses in many areas of Latin America, Indian subcontinent and Asia as well as some parts of Europe.
In these buildings masonry shear walls are often the only structural element assumed to provide resistance to gravitational and seismic lateral loads. It consists basically of masonry panels confined by vertical and horizontal elements usually of reinforced concrete. The horizontal members are called bond-beams and vertical members are called tie-columns.
Tie-columns have a square section whose dimensions are usually equal to the wall thickness. In respect to the bond beams, their width is the wall thickness and the depth is usually equal to 20-25 cm (8-10 in).
The crucial point is that this technique has evolved essentially through an informal process based on experience, and that it has been incorporated in formal construction through code requirements and design procedures that are mostly rationalizations of the established practice, even after having been validated by structural mechanics principles and experimental evidence.
In spite of masonry experimental research programs conducted in many countries, the behavior of confined masonry shear walls is still not very well know.
3 1.2.2 Failure Modes
In order to investigate the Seismic behavior of Masonry Structures, a comprehensive literature review was conducted [3-4-5-6-10]. The first things we have to define is “Failure Mode”, that is the core of the structural design of buildings. A failure mode is a mechanism by which a component in a building stop to be able to resist the loads applied on it.
The goal of structural design is identifying the possible mechanism that could bring about failure, predicting the force or deformation that failure by this mechanism will occur, and determining if this force or deformation capacity is larger than expected demands on the structure. There are two general types of failure modes: non-structural failure modes and structural failure modes. For the first modes, they result only in collapse of the failed component itself. This happens because non structural elements do not support other members. For a structural point of view, such elements are only required to resists the forces applied to them directly, such as self-weight or inertial force. Structural failure modes involve the failure of structural members, or members that are relied upon to support other components of the building. If a structural failure mode occurs, the result is collapse of part or all the building.
As shown in picture 2, we have tree typical distributions of forces: vertical, in plane lateral forces and out of plane lateral forces.
From the damaging observation, after a seismic event, it is possible to define two different categories in which divide the seismic behavior of Masonry structure: the first mode we consider the collapse’s kinematics connected with the out of plane behavior of masonry walls (rocking) and the second mode’s mechanisms that involve the in-plane behavior of masonry walls, damaged typically for shear or flexure.
“In-Plane Cyclic Behavior of Substandard Confined Masonry: Full-Scale Experiments, Finite-Element Modeling and Incremental Dynamic Analysis”
Chapter 1
4 And it is just the second mode that have a relevant role under seismic action as will be explained in 1.2.4. In fact also in code [8-9] the seismic-force-resisting element considered in the analysis are those work in their plane. The typical mechanisms for the second mode are shown in picture 3.
In plane failures occur in walls parallel to the direction of earthquake shaking. Generally resisting forces in the in-plane direction is an efficient way for a structure to transfer lateral forces to the foundation and that it is the way in which the masonry structures works.
Three failure modes can result from confined masonry walls carrying lateral loads in-plane: diagonal shear failure, sliding shear failure and in-plane bending failure.
1.2.2.1 Diagonal Shear Failure
It is a typical in plane mechanism observed in well-proportioned confined masonry structures. Several approaches can be used to idealize the force transfer that brings about diagonal shear failure. One of them it is illustrated in figure 4, in which the force transfer is achieved through a compression strut and a tension tie.
Figure 4 Shear Failure [10-11] Figure 3 Failure Mechanisms [7]
5 Referred to the literature it is possible to assume that the width of the diagonal strut it is equal to one third of its length and its thickness it is the same of the panel.
As diagonal cracking increases, the compression strut becomes less effective in transferring compressive force. To compensate, the tie columns work to distribute the horizontal inertial force off the main diagonal, in effect widening the compression strut.
Increasing the load increase also the number of struts inside masonry and for a certain point of view we can image it like in figure 5:
Figure 5 Increasing of Struts [11]
1.2.2.2 Sliding Shear Failure
In this type of failure, a horizontal crack forms in the mortar joint across a portion or the entire length of the panel and then it extends into the tie columns. Once the tie columns have failed in shear, failure occurs by the wall sliding along the horizontal joint. It happens only if the resistance of the mortar joint is very weak.
“In-Plane Cyclic Behavior of Substandard Confined Masonry: Full-Scale Experiments, Finite-Element Modeling and Incremental Dynamic Analysis”
Chapter 1
6 1.2.2.3 In-Plane Bending Failure
Horizontal and vertical loads cause compression stresses at one end of the wall and tensile stresses at the other. Assuming the tie column does not participate, the wall fails when the tension strength of the mortar at the tension end is exceeded, causing the wall to tip over.
Figure 7 Bending Failure [10]
1.2.3 Confined Masonry Buildings, Seismic Behavior
It is really important to understand how this structures work to resist earthquake forces.
Earthquake introduces stress into buildings by accelerating and displacing the base of the building. Since no lateral forces are applied to the building above the ground, the walls, floors and roof stay in their original positions. The foundation, however, wants to drag the rest of the building along with it since everything is connected together. To do so, the structural elements must apply forces on the superstructure to get it move with the foundation.
The forces applied by the structural elements works to overcome the inertia, or resistance to change the initial conditions of the superstructure, and hence are referred to as inertial forces. The inertia of a component of a building is directly proportional to its mass. Thus, much heavier will be a wall,
7 a floor etc., and larger will be the force that must be developed in the structural elements to make it move with the foundation.
To make easier to understand the seismic response of a structure, instead of consider earthquake loads as ground displacements and acceleration, sometimes we can consider the base of the structure to remain still, and apply equivalent lateral loads on the building equal to the inertial forces caused by ground motion. The two systems are structurally equivalent, but the latter is usually easier to understand and interpret. Figure 4 illustrates the two ways of conceptualizing earthquake loads.
Figure 8 Idealization of earthquake demands [10]
We have to underline that the magnitude and direction of seismic loads continually change during the seismic event. In seismic design have to be determine the maximum demands in each direction and designing the structure to resists them.
The equivalent lateral force visualization of earthquake loads will be used to explain how a confined masonry structure transmits earthquake forces to the foundation. Referring to Figure 5 below, the inertial forces on a CM building are concentrated where most of the mass is: at the floor and roof levels, and in the masonry walls themselves. The red arrows show the inertial forces on each component applied to the component’s center of mass, the blue arrows illustrate how the inertial forces transfer to supporting elements, and the green arrows represent forces on components transferred from other components [10].
“In-Plane Cyclic Behavior of Substandard Confined Masonry: Full-Scale Experiments, Finite-Element Modeling and Incremental Dynamic Analysis”
Chapter 1
8
Figure 9 Inertial Loads in CM [10]
Analyzing the members of the simple structures in figure 5, it is possible to understand that the masonry walls perpendicular to the direction of shaking are much weaker and more flexible than the wall parallel to the direction of shaking. So these elements transfer their inertial forces to the much stiffer elements bordering the walls. The roof and the floor transmit the inertial forces from their own mass, along with the forces transferred to them from the walls perpendicular to the direction of shaking, to the walls parallel to the direction of shaking. To do so, roofs and floors deform in plane (since all deformations are parallel to the plane of the roof or floor) as a diaphragm, and as a result, are referred to as diaphragm elements. The walls parallel to the direction of shaking have the responsibility of transferring inertial forces from their own mass, the diaphragms and the walls perpendicular to shaking down to the foundation, where it is transmitted to the surrounding soil. These walls perform this function by deforming in-plane in shear and bending (second mode).
1.2.4 Seismic Design
In reference to the Italian Code NTC2008 and American Code ASCE 7, the seismic design it is related to the seismic behavior of the structure we want to design.
In other words the point it is if the structure can dissipate energy or not.
If the structure can’t dissipate energy we have to design in an linear-elastic way, in which the design load it is the linear-elastic load that come from the analysis. In the other case, it is possible to reduce
9 the response spectrum of the structure and design it with a less load instead of the elastic load, reducing the cost of the structure.
As an example it is shown in figure 10 a diagram in which it is clear the difference between design in linear-elastic hypothesis or design with an elastic-plastic behavior:
Figure 10 Elastic Behavior vs Elastic-Plastic Behavior
Seismic codes are developed with the intent of ensuring serviceability requirements during frequent moderate earthquakes and life safety during a major earthquake. Therefore, in the latter case extensive damage to the structure may be acceptable so long as collapse is prevented.
Design seismic forces are obtained by reducing a linear elastic response spectra by a response modification factor R (Ve/V)[9] or using q (structure factor) [8] and member forces are determined through linear elastic analysis[12].
In addition, a displacement amplification factor Cd is used to compute the expected maximum
“In-Plane Cyclic Behavior of Substandard Confined Masonry: Full-Scale Experiments, Finite-Element Modeling and Incremental Dynamic Analysis”
Chapter 1
10
Figure 11 Seismic Performance Factor described by NEHRP
Usually R and Cd recommended by the codes depend on the period of the structure, the structural
system type and the structural ductility.
1.2.5 Numerical Modeling
The different techniques proposed in the literature for idealizing this structural type can be divided into two groups, namely, local or micro-models and simplified or macro-models. The first group involves the models in which the structure is divided into numerous elements to take account of the local effects in detail, whereas the second group includes simplified models based on a physical understanding of the behavior of the CM wall. In the later case, a few elements are used to represent the effect of the element as a whole. It is evident from experimental observations that these structures exhibit a highly nonlinear elastic behavior, and the most important factors contributing to the non linear behavior arise from material non linearity. These factors can be summarized as follows:
• Infill Panel: cracking and crushing of the masonry, stiffness and strength degradation.
• Surrounding Frame: cracking of the concrete, yielding of he reinforcing bars, local bond slip.
• Panel-Frame Interfaces: degradation of the bond –friction mechanism, variation of the contact length.
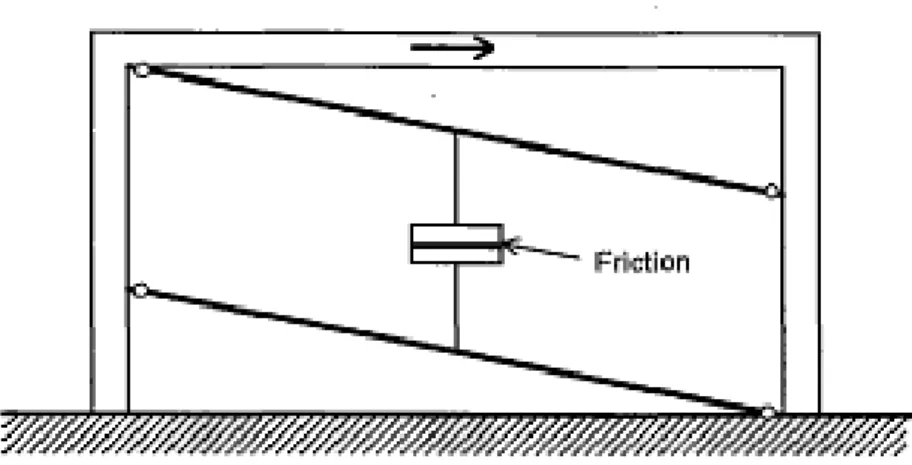
11 After the considerations done before, and a comprehensive literature review, the seismic behavior of Confined Masonry structures it is modeled through macro modeling in which it was supposed that the wall under seismic action will act with a strut and tie mechanism whit considering also the friction between the masonry units. Figure 10 illustrate it.
Figure 8 CM Modeling
The diagonal strut model is widely accepted as a simple and rational way to describe the influence of the masonry inside the frame.
“In-Plane Cyclic Behavior of Substandard Confined Masonry: Full-Scale Experiments, Finite-Element Modeling and Incremental Dynamic Analysis”
Chapter 2
12
2. Mechanical Characterization of the Materials
2.1 Introduction
In order to investigate the materials, design and construction practice that result in substandard confined masonry structures, a comprehensive literature review was done.
In Confined Masonry, as we explained before, we have an unreinforced masonry wall panel surrounded by horizontal and vertical “confining” members called bond beams and tie columns. The masonry wall panel consists of units bonded with mortar and confining elements constructed of reinforced concrete (RC). In some cases the units in a masonry walls are toothed at tie column locations to create better interlock between the wall and tie column. In a CM system, the masonry wall panel assume the role to transmit all lateral and gravity loads to the buildings foundation. The bond beams and tie columns work to hold the wall together under earthquake. The RC confining elements improve the connections between wall-roof-floor enabling the structure to better act together as a unit during a seismic event, that it is what we call box behaviour, that it is really important to make the structure able to resist a lateral action.
The important features in CM structures are the materials quality and the detailing used in the design as shown in Figure 11.
Figure 11 Typical Design and construction practice Concrete
quality
Bed joints (mortar quality, joint thickness) Butt joints
(often missing)
Quality of clay bricks or concrete masonry units Anchorage detailing
Wall edge (toothed preferable to smooth) Plain reinforcing bars in confining elements Corner joint detailing
2.2 Specimens Dimensions and material
Confined masonry walls are made of units, “confining” elements and bonding materials like mortar. What we want to do now it is to define what are the standard dimensions and typologies of material used in substandard CM walls to define a full scale specimen that can represent the real
behavior of that element. The point
type of construction, characterized from a really substandard materials and also desig using a restrict number of specimens.
2.2.1 Wall Dimensions
The height of the walls is inside a range between 2.20
m (6.2-13 ft). The column depth is usually equal to the wall thickness, between The depth of the confining beam varies betwee
between 15-20 cm (6-8 in) in function of the wall thickness.
2.2.2 Blocks (Units)
There are a lot of masonry units that are used in CM. We can divi
materials, geometry and distribution of cores. We can have concrete blocks, solid concrete bricks, clay blocks and clay bricks (each one solid or hollow). The most common are hollow concrete blocks with a net area about 55%
the construction site, and that means that the choose of the materials it is correlated to the materials they have.
Specimens Dimensions and material (Walls, Units, Mortar, Frame)
are made of units, “confining” elements and bonding materials like mortar. What we want to do now it is to define what are the standard dimensions and typologies of material
to define a full scale specimen that can represent the real
he point was to design a test that was able objectively to represent this type of construction, characterized from a really substandard materials and also desig
using a restrict number of specimens.
The height of the walls is inside a range between 2.20-2.50 m (7.2-8.2 ft). The length between 2 13 ft). The column depth is usually equal to the wall thickness, between
The depth of the confining beam varies between a range of 20-25 cm (8-8 in) in function of the wall thickness.
There are a lot of masonry units that are used in CM. We can divide them in respect to the materials, geometry and distribution of cores. We can have concrete blocks, solid concrete bricks, clay blocks and clay bricks (each one solid or hollow). The most common are hollow concrete blocks with a net area about 55%-60% of the gross cross section. They are also typically made near , and that means that the choose of the materials it is correlated to the materials
Figure 12 Types of masonry units [2]
13 are made of units, “confining” elements and bonding materials like mortar. What we want to do now it is to define what are the standard dimensions and typologies of material to define a full scale specimen that can represent the real physical a test that was able objectively to represent this type of construction, characterized from a really substandard materials and also design approach,
8.2 ft). The length between 2-4 13 ft). The column depth is usually equal to the wall thickness, between 15-20 cm (6-8 in). -10 in), and its width
de them in respect to the materials, geometry and distribution of cores. We can have concrete blocks, solid concrete bricks, clay blocks and clay bricks (each one solid or hollow). The most common are hollow concrete the gross cross section. They are also typically made near , and that means that the choose of the materials it is correlated to the materials
“In-Plane Cyclic Behavior of Substandard Confined Masonry: Full Incremental Dynamic Analysis”
Chapter 2
Below there is a table in which we can
2.2.3 Mortar
Portland cement and lime mortar are the most used. Their compressive strength ranging between 5-10 MPa (730-1450 psi). The bed joints thickness varies between 1
builders the head joints are not considered important so their thickness change between 0 0.375 in).
Plane Cyclic Behavior of Substandard Confined Masonry: Full-Scale Experiments, Finite
Below there is a table in which we can see the strength of the different types of units.
Table 1 Strentgh in masonry units [14]
Portland cement and lime mortar are the most used. Their compressive strength ranging between The bed joints thickness varies between 1-2.5 cm (0.375
builders the head joints are not considered important so their thickness change between 0
Figure 1 Thick of mortar bed joints
Scale Experiments, Finite-Element Modeling and
14 see the strength of the different types of units.
Portland cement and lime mortar are the most used. Their compressive strength ranging between 2.5 cm (0.375-1.0 in). For the builders the head joints are not considered important so their thickness change between 0-1 cm
(0-2.2.4 Concrete
The concrete it is casted in place, so it isn’t typically compacted. The use of round and smooth aggregates in conjunction with smooth bars and ties determine the presence of large voids and poor bond with the steel. The compressive strength of ty
Mpa (1150-1750psi).
The poor compression strength in units, mortar and concrete is due to lower quantity of filler. As we can see to the below figures, poor materials used in confined masonries are combined wi accuracy to the design details.
Figure 12 Unconsolidated concrete at the interface with masonry
in place, so it isn’t typically compacted. The use of round and smooth aggregates in conjunction with smooth bars and ties determine the presence of large voids and poor bond with the steel. The compressive strength of typical substandard concrete varies between
The poor compression strength in units, mortar and concrete is due to lower quantity of filler. As we can see to the below figures, poor materials used in confined masonries are combined wi
Figure 12 Unconsolidated concrete at the interface with masonry
Figure 13 Lack of bond
15 in place, so it isn’t typically compacted. The use of round and smooth aggregates in conjunction with smooth bars and ties determine the presence of large voids and poor pical substandard concrete varies between 8-12
The poor compression strength in units, mortar and concrete is due to lower quantity of filler. As we can see to the below figures, poor materials used in confined masonries are combined with no
“In-Plane Cyclic Behavior of Substandard Confined Masonry: Full Incremental Dynamic Analysis”
Chapter 2
2.2.5 Steel Reinforcement
The longitudinal reinforcement of beams and pillars typically consist in strength of about 280-420 Mpa (40610
decrease in spacing at the column or beam and no bends.
(c)
In fact, as we can see from picture
steel tie, and not deformed steel bars (picture d failure mechanisms of the walls.
Plane Cyclic Behavior of Substandard Confined Masonry: Full-Scale Experiments, Finite
The longitudinal reinforcement of beams and pillars typically consist in four bars with a tensile 420 Mpa (40610-61000 psi). The ties are smooth bar equally spaced with no decrease in spacing at the column or beam and no bends.
(a)
(c) (d)
picture (a) and (b) they made open stirrups with large spacing between steel tie, and not deformed steel bars (picture d-e) it inducing buckling of the longitudinal bars and
Scale Experiments, Finite-Element Modeling and
16 four bars with a tensile 61000 psi). The ties are smooth bar equally spaced with no
(b)
(e)
they made open stirrups with large spacing between e) it inducing buckling of the longitudinal bars and
2.3 Mechanical Characterization of the Materials
As we explain before, the goal of the first part of the work was to be able to design and construct a limited number of full scale specimens that were able to
of building CM structures. Once defined from the litera
dimension and strength of the constituents, we started to produce them
mechanical properties and define the constitutive models of the materials used, American Codes [9], the following experiments were performed
2.3.1 Compression Test on single blo
To define the compressive strength of the concrete units six tests were carried out. A single block was instrumented with four 0.5 cm (0.2 in) displacement transduce gage and one 445 kN (100 Kip) load cell. In figure 14 it is illustrated the test.
2.3 Mechanical Characterization of the Materials
As we explain before, the goal of the first part of the work was to be able to design and construct a limited number of full scale specimens that were able to represent what is done in common practice of building CM structures. Once defined from the literature review what were the range of dimension and strength of the constituents, we started to produce them. In order to characterize the mechanical properties and define the constitutive models of the materials used,
llowing experiments were performed.
Compression Test on single blocks (ASTM C140)
To define the compressive strength of the concrete units six tests were carried out. A single block was instrumented with four 0.5 cm (0.2 in) displacement transduce
and one 445 kN (100 Kip) load cell. In figure 14 it is illustrated the test.
Figure 14 Test Set Up
17 As we explain before, the goal of the first part of the work was to be able to design and construct a represent what is done in common practice ture review what were the range of In order to characterize the mechanical properties and define the constitutive models of the materials used, following the
To define the compressive strength of the concrete units six tests were carried out.
“In-Plane Cyclic Behavior of Substandard Confined Masonry: Full Incremental Dynamic Analysis”
Chapter 2
Below the average results are rep
Specimen Comp. Strength (MPa) on net
Block #1 Block #2 Block #3 Block #4 Block #5 Block #6 Average stdev COV %
2.3.2 Compression Test on two-Three tests were carried out on two
displacement transducers, two horizontal 0.5 cm (0.2 in) displacement transducers (100 kip) load cell.
Plane Cyclic Behavior of Substandard Confined Masonry: Full-Scale Experiments, Finite
are reported. The net cross section area is 39141.21204 mm
Table 2 ASTM C140 Results
Comp. Strength (MPa) on net area Modulus of Elasticity (MPa) Poisson's ratio 7.37 4670.70 6.97 4390.40 6.82 6874.80 7.38 5493.30 0.87 7.59 6128.00 0.62 7.01 7077.50 0.77 7.19 5772.45 0.75 0.30 1117.73 4.164 19.363
-block prisms (ASTM C1314)
on two-blocks prisms instrumented with four vertical 0.5 cm (2in) transducers, two horizontal 0.5 cm (0.2 in) displacement transducers
Figure 15 Test Instrumentation
Scale Experiments, Finite-Element Modeling and
18 The net cross section area is 39141.21204 mm2.
Poisson's ratio - - - 0.87 0.62 0.77 0.75
blocks prisms instrumented with four vertical 0.5 cm (2in) transducers, two horizontal 0.5 cm (0.2 in) displacement transducers and one 445 kN
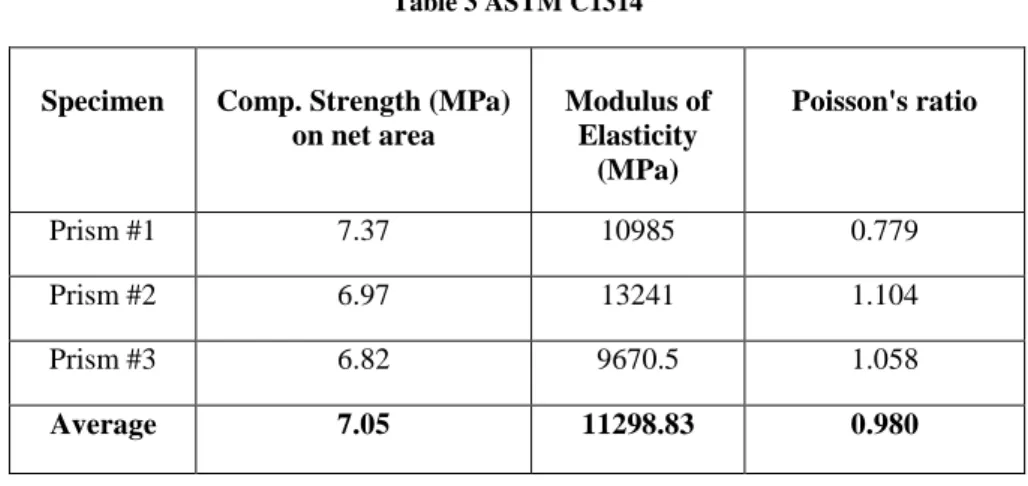
19 Average results are reported in table 3.
Table 3 ASTM C1314
Specimen Comp. Strength (MPa) on net area Modulus of Elasticity (MPa) Poisson's ratio Prism #1 7.37 10985 0.779 Prism #2 6.97 13241 1.104 Prism #3 6.82 9670.5 1.058 Average 7.05 11298.83 0.980
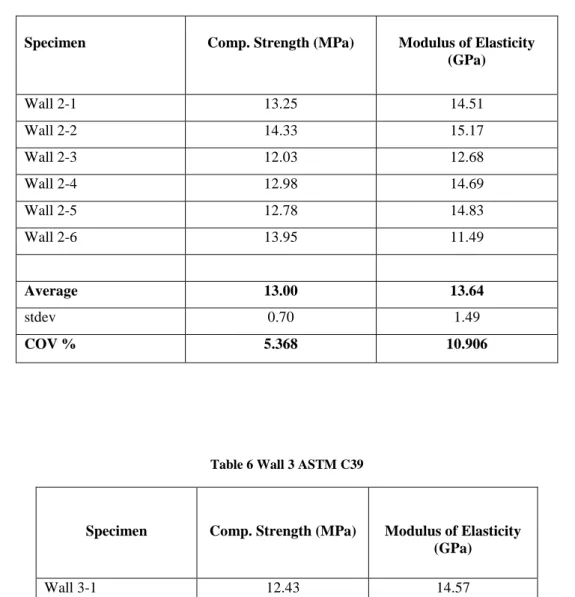
2.3.3 Compression Test on concrete cylinders (ASTM C39)
This test was very important to know if the cement used to cast bond beams and tie column was representative of what often used in developing areas. Six concrete cylinders 10x20 cm (4x8 in) with a cross section of 8107.08056 mm2 were taken from each wall.
Table 4 Wall 1 ASTM C39
Specimen Comp. Strength (MPa) Modulus of Elasticity (GPa)
Wall 1-1 9.13 12.53 Wall 1-2 11.78 11.14 Wall 1-3 9.38 11.18 Wall 1-4 11.85 11.67 Wall 1-5 12.34 9.43 Wall 1-6 9.10 12.49 Average 10.60 11.41 stdev 1.54 1.15 COV % 14.564 10.039
“In-Plane Cyclic Behavior of Substandard Confined Masonry: Full-Scale Experiments, Finite-Element Modeling and Incremental Dynamic Analysis”
Chapter 2
20
Table 5 Wall 2 ASTM C39
Specimen Comp. Strength (MPa) Modulus of Elasticity
(GPa) Wall 2-1 13.25 14.51 Wall 2-2 14.33 15.17 Wall 2-3 12.03 12.68 Wall 2-4 12.98 14.69 Wall 2-5 12.78 14.83 Wall 2-6 13.95 11.49 Average 13.00 13.64 stdev 0.70 1.49 COV % 5.368 10.906
Table 6 Wall 3 ASTM C39
Specimen Comp. Strength (MPa) Modulus of Elasticity
(GPa) Wall 3-1 12.43 14.57 Wall 3-2 12.50 12.66 Wall 3-3 13.40 14.38 Average 12.78 13.87
2.3.4 Compression test on mortar cylinders (ASTM C109)
Six tests were carried out on mortar cylinders sampled during the construction of walls and instrumented with three vertical 0.5 cm (0.2in ) displacement transducers and tested in a 0.14 MPa (20 psi) load cell. The specimens dimensions were 7.5x15 cm (3x6 in).
21
Table 7 ASTM C 109
Specimen Comp. Strength (MPa) Modulus of Elasticity (GPa)
Type N #1 8.513 11.050 Type N #2 9.575 12.076 Type N #3 8.075 12.251 Type N #4 7.459 - Type N #5 7.599 - Type N #6 7.537 10.692 Type N #7 9.690 12.751 Type N #8 8.293 10.444 Average 8.34 11.54 stdev 0.88 0.94 COV % 10.547 8.144
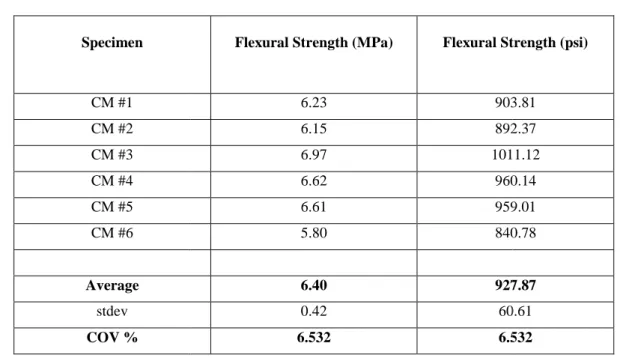
2.3.5 Flexural test on blocks and mortar prisms (ASTM C348)
Three point bending test was used to define the flexural strength of mortar and blocks.
Table 8 ASTM C348 Blocks Prisms
Specimen Flexural Strength
(MPa) Flexural Strength (psi) #1 1.63 236.85 #2 1.83 265.52 #3 1.61 233.15 #4 1.53 221.72 #5 1.81 262.37 #6 1.82 263.33 Average 1.70 247.16 stdev 0.13 18.87 COV % 7.634 7.634
“In-Plane Cyclic Behavior of Substandard Confined Masonry: Full Incremental Dynamic Analysis”
Chapter 2 Specimen CM #1 CM #2 CM #3 CM #4 CM #5 CM #6 Average stdev COV %
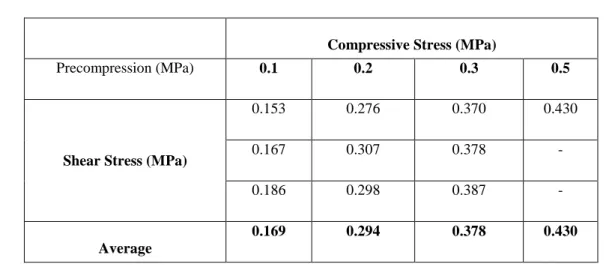
2.3.6 Shear tests on mortar joints (BS EN 1052
This test was performed with three units of CM under three different precompression levels to define the cohesion and friction coefficient of the mortar joints.
Plane Cyclic Behavior of Substandard Confined Masonry: Full-Scale Experiments, Finite
Table 9 ASTM C348 Mortar Prisms
Flexural Strength (MPa) Flexural Strength
6.23 903.81 6.15 892.37 6.97 1011.12 6.62 960.14 6.61 959.01 5.80 840.78 6.40 927.87 0.42 60.61 6.532 6.532
2.3.6 Shear tests on mortar joints (BS EN 1052-3:2003)
performed with three units of CM under three different precompression levels to define the cohesion and friction coefficient of the mortar joints.
Figure 16 Test Set Up
Scale Experiments, Finite-Element Modeling and
22
Flexural Strength (psi)
903.81 892.37 1011.12 960.14 959.01 840.78 927.87 60.61 6.532
23
Table 10 BS EN 1052-3:2003
Compressive Stress (MPa)
Precompression (MPa) 0.1 0.2 0.3 0.5
Shear Stress (MPa)
0.153 0.276 0.370 0.430
0.167 0.307 0.378 -
0.186 0.298 0.387 -
Average
0.169 0.294 0.378 0.430
2.3.7 Flexural test on mortar joints (ASTM E754)
Four point bending tests in five seven-blocks specimens were carried out to obtain the modulus of rupture of masonry.
Table 11 ASTM E754
Specimen Modulus of rupture (MPa) Modulus of rupture
(psi) Prism #1 0.16 23.24 Prism #2 0.16 22.98 Prism #3 0.21 30.60 Prism #4 0.19 27.52 Prism #5 0.10 14.25 Average 0.18 26.08 stdev 0.03 3.66 COV % 14.029 14.029
“In-Plane Cyclic Behavior of Substandard Confined Masonry: Full-Scale Experiments, Finite-Element Modeling and Incremental Dynamic Analysis”
Chapter 2
24 2.3.8 Compression test on small masonry walls (BS EN 1052-1:1999)
To have a better idea about the compression behavior of masonry, compression tests on small walls were conducted. The smalls walls were built with ten masonries units and instrumented with two vertical 10 cm (4in) potentiometers, one 5 cm (2in) horizontal displacement transducers one 445 kN (100 kip) load cell and one pressure transducer to measure the maximum vertical load and pressure. The results are on line with the average of substandard confined masonry units.
Table 12 BS EN 1052-1:1999
Specimen Comp. Strength
(MPa) on net area
Modulus of Elasticity (GPa) Wall #1 4.52 7.359 Wall #2 3.69 8.179 Wall #3 4.71 7.621 Average 4.31 7.72
3. Experimental Program
The experimental program was intended to define the in
walls subject to a cyclic displacement. The goal was to make a test that
objectively this type of technique, characterized from highly substandard materials and design approach, using a restrict number of specimens. Once defined the constituents properties and sure that were inside substandard range, three
tested.
Experimental Program
The experimental program was intended to define the in-plane behaviour of Confined Masonry walls subject to a cyclic displacement. The goal was to make a test that
objectively this type of technique, characterized from highly substandard materials and design approach, using a restrict number of specimens. Once defined the constituents properties and sure that were inside substandard range, three types of confined masonry walls were designed
Figure 17 Experimental Program
25 plane behaviour of Confined Masonry walls subject to a cyclic displacement. The goal was to make a test that was able to represent objectively this type of technique, characterized from highly substandard materials and design approach, using a restrict number of specimens. Once defined the constituents properties and sure types of confined masonry walls were designed, built and
“In-Plane Cyclic Behavior of Substandard Confined Masonry: Full-Scale Experiments, Finite-Element Modeling and Incremental Dynamic Analysis”
Chapter 3
26 Below in figure 18 it is illustrated the scheme for shear compression test of cantilever wall. The benchmark from where it is started the test design:
Figure 18 Example of the Test Scheme
3.1 Test set up, instrumentations and procedure
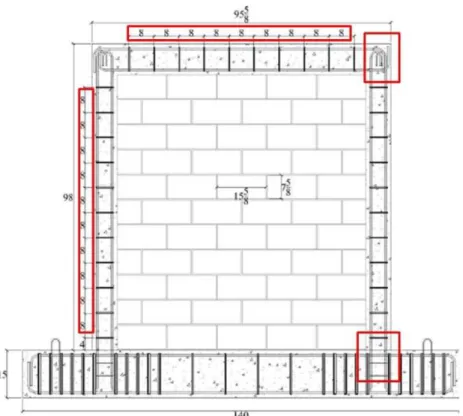
Three Confined Masonry walls made of 40x20 cm (15.625x7.625 in) concrete blocks, cement mortar and reinforced concrete frame were built. They were designed to contain inside strain gauges, potentiometers, displace transducers and a side was treated with white cement paint to contain dots for digital image correlation.
27
Figure 19 Type 1 No Detail
“In-Plane Cyclic Behavior of Substandard Confined Masonry: Incremental Dynamic Analysis”
Chapter 3
As it is underlined in figure 19, type one specimen represent a lack of engineering knowledge like anchorage length and distance between tie
That specimen was instrumented with twelve strain gauges, seven displacement trans five potentiometers.
Figure 21 shows the instruments positions:
Type one specimen was used as benchmark specimen. Below in figures 22 (a) and (b) represent respectively specimens.
Type two specimen was retrofitted using longitudinal aluminum bars with the scope to increase wall confinement and consequentially the
displacement transducers, five potentiometers and additional strain gauges to measure the aluminum strain.
Plane Cyclic Behavior of Substandard Confined Masonry: Full-Scale Experiments, Finite
, type one specimen represent a lack of engineering knowledge like anchorage length and distance between tie bars .
That specimen was instrumented with twelve strain gauges, seven displacement trans
instruments positions:
Figure 21 Set Up Type 1 Specimen
Type one specimen was used as benchmark specimen.
represent respectively the set up for type two and type
specimen was retrofitted using longitudinal aluminum bars with the scope to increase wall confinement and consequentially the system strength. It was instrumented with
potentiometers and additional strain gauges to measure the aluminum Scale Experiments, Finite-Element Modeling and
28 , type one specimen represent a lack of engineering knowledge like
That specimen was instrumented with twelve strain gauges, seven displacement transducers and
and type three
specimen was retrofitted using longitudinal aluminum bars with the scope to increase the strength. It was instrumented with seven
Type three wall represented the same physical conditions of the type one but with engineering details. It is a good way to start building in growing countries subject of seismic hazard.
Figures 24 shows the other side of specimens that was prepared for the digital image correlation.
3.2 In-Plane Cyclic Shear-Compression Tests
Three specimens for evaluating the seismic behavior of Confined Masonry walls were sized 250x243x20 cm (98x95.625x7.625 in) and tested under cyclic
Type three wall represented the same physical conditions of the type one but with engineering good way to start building in growing countries subject of seismic hazard.
Figures 24 shows the other side of specimens that was prepared for the digital image correlation.
(a)
Figure 22 (a) Type two (b) Type three
(a)
Figure 23 (a) Painted (b) Ready for DIC
Compression Tests
Three specimens for evaluating the seismic behavior of Confined Masonry walls were sized 250x243x20 cm (98x95.625x7.625 in) and tested under cyclic load.
29 Type three wall represented the same physical conditions of the type one but with engineering
good way to start building in growing countries subject of seismic hazard.
Figures 24 shows the other side of specimens that was prepared for the digital image correlation.
(b)
(b)
“In-Plane Cyclic Behavior of Substandard Confined Masonry: Full-Scale Experiments, Finite-Element Modeling and Incremental Dynamic Analysis”
Chapter 3
30 Confined masonry walls were tested with a cantilever-type boundary condition, with fixed base and top end free to rotate, by applying centered and constant vertical load of 90 kN given from 445kN (100 kip) load cell to obtain the shear type failure mode. Horizontal cyclic displacements, with increasing amplitude and the presence of four plateau used to take pictures for the digital image correlation were applied. Figure 24 a and b represent the applied load, choosen from [3].
(a)
(b) Figure 24 (a) Load History (b) Plateau for DIC
During in-plane cyclic tests, the confined masonry walls attained three main limit states, which were used to idealize observed behavior. At first, specimens responses were linear elastic, with similar stiffness values. When sliding mechanism occurs, it causes the development of horizontal cracks and the masonry's behavior changes and it starts working as strut and tie. At this point, the base shear continues to increase until the yielding point. From this point, with the increasing of cracks’ dimensions, the strut area starts decreasing with the base shear until the ultimate displacement.
3.3 Experimental results
Plotting the lateral force versus the lateral displacement relative to the mid-span of the tie beam (control point), are obtained the hysteretic force-displacement diagrams for each tested specimens.
31 In figure 25 are plotted the three diagrams, from which it is possible to analyze the structural behavior of the walls including initial stiffness, change of CM walls behavior with relative decreasing of stiffness due to the damage, shear forces and associated deformations and overall deformability. Form figure 25 it is evident that improving the detailing the average lateral force and the average displacement capacity increase considerably.
Figure 25 Hysteretic Force-Displacement Diagram
In respect to the effect of longitudinal aluminum strips the average lateral force capacity increases by 40% and the average lateral displacement by 180%.
Have to been underline that the seismic response of buildings is related not only to strength and displacement capacity (members ductility), but also to typical parameters of cyclic behavior such as energy dissipation capacity, stiffness degradation and viscous damping coefficient, according to damage propagation.
To completely understand the tests results, with the help of a simple Matlab script, are also illustrate in figure 26 the positive and negative peaks of each load cycle for the three specimens tested.
“In-Plane Cyclic Behavior of Substandard Confined Masonry: Full-Scale Experiments, Finite-Element Modeling and Incremental Dynamic Analysis”
Chapter 3
32
Figure 26 Peacks Diagram
Negative and positive peaks are plotted in the same quadrant, because in that way it is possible to evaluate for first how the test was done, in fact the two curve have to be almost the same. In that particular case, the discrepancies between the type One curves are due to a local failure mechanism that happened at the top right corner as shown in figure 27, where it was formed an hinge.
(a) (b)
Figure 27 Corner hinge (a) DIC side (b) Instrumented side
Below will be illustrate the Digital Image Correlation Results and the cracks pattern for each specimens with the scope to lay the bases for the numerical modeling Hypothesis.
3.4 Digital Image Correlation results and
Three Digital image correlation test were carried out. Two 5 Megapi were used to do it. This analysis
mechanicals laws directly. Below it is reported the algorithm
Once defined what is the way to obtain the results,
analysis it is that is possible to see how and where the strain is localized. In that side, it took a really important weight to define the behavior under cycli
As is shown in figure 29, it is clear that strut and tie behavior. The wall’
direction. Hot range color indicate tension, cold range color compression. 3.4 Digital Image Correlation results and Crack Pattern
Three Digital image correlation test were carried out. Two 5 Megapixel camera and one computer analysis technique permits to define the strain field
w it is reported the algorithm used in DIC analysis.
Figure 28 DIC Algorithm
Once defined what is the way to obtain the results, the really important aspect of this type of analysis it is that is possible to see how and where the strain is localized. In that side, it took a really important weight to define the behavior under cyclic load of each specimen.
As is shown in figure 29, it is clear that CM walls, with the rising of the first cracks, starts having a ’s diagrams are referred to exx1 that represent the strain in the x r indicate tension, cold range color compression.
(a)
33 xel camera and one computer to define the strain field and so to solve the
the really important aspect of this type of analysis it is that is possible to see how and where the strain is localized. In that side, it took a really
, with the rising of the first cracks, starts having a are referred to exx1 that represent the strain in the
“In-Plane Cyclic Behavior of Substandard Confined Masonry: Full-Scale Experiments, Finite-Element Modeling and Incremental Dynamic Analysis”
Chapter 3
34
(c) (d)
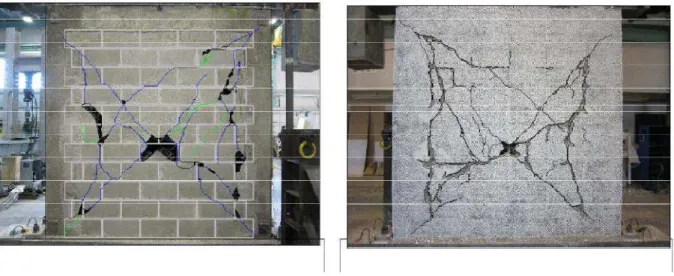
Figure 29 (a-b) First cracks (c-d) Typical Shear failure cracks
In order to give a full view of damage degree below is shown the cracks pattern of type one specimen.
Figure 30 Crack Pattern
Type two specimen digital image analysis are reported in figure 31, it is clear also in that case the strut behavior of retrofitted CM wall, with another important aspect, that the tooth presence doesn’t change the system answer.
Figure 31 DIC Type Two wall
In that case, the presence of the aluminum strips increase a lot the compression of the wall, but not the stiffness carrying the damage degree more high as we can see fr
The third in-plane shear test was performed on type three wall
the numerical model. The choice to create an archetype that was able to represent this specimen belong to two reason, the first as shown in figure 26, its load capacity and ultimate displacement are in the middle between a really not engineering technique and a retrofitted
because the presence of normal but functional engineering detail illustrated DIC results and the crack pattern of type two wall.
(c)
31 DIC Type Two wall (a-b) Cracks Begin (b-c) Shear Failure
In that case, the presence of the aluminum strips increase a lot the compression of the wall, but not the stiffness carrying the damage degree more high as we can see from the figure 32.
Figure 32 Crack Pattern
plane shear test was performed on type three wall. This is the specimen used to validate The choice to create an archetype that was able to represent this specimen s shown in figure 26, its load capacity and ultimate displacement are in the middle between a really not engineering technique and a retrofitted
the presence of normal but functional engineering detail has give good results. Below are illustrated DIC results and the crack pattern of type two wall.
35
(d)
In that case, the presence of the aluminum strips increase a lot the compression of the wall, but not om the figure 32.
. This is the specimen used to validate The choice to create an archetype that was able to represent this specimen s shown in figure 26, its load capacity and ultimate displacement are in the middle between a really not engineering technique and a retrofitted wall and the second give good results. Below are
“In-Plane Cyclic Behavior of Substandard Confined Masonry: Full-Scale Experiments, Finite-Element Modeling and Incremental Dynamic Analysis”
Chapter 3
36
(a) (b)
(c) (d)
Figure 32 DIC Type Two wall (a-b) Cracks Begin (b-c) Shear Failure
Figure 33 Type Three Wall Crack Pattern
Another test was carried out, the in plane behavior of confining frame. This test was really important, as will explained in chapter 4, for calibrate the archetype. Below is reported the Force-lateral displacement Hysteretic diagram.
37
Figure 34 Force-Lateral Displacement Hysteretic Diagram
Have to be point out that the frame was damaged, because it was the confining frame for Type Two wall.
(a) (b)
“In-Plane Cyclic Behavior of Substandard Confined Masonry: Full-Scale Experiments, Finite-Element Modeling and Incremental Dynamic Analysis”
Chapter 4
37
4. Numerical Modeling
After a comprehensive literature review [15-16-17-18-19-20-21] act to know how other authors treat the problem, to identify the practices and the parameters that govern the problem and to define what was the best modeling approach, a macro modeling approach, based on the assumption done in previous chapters was choosen. Also the choice of the program had a relevant weight, and at the end the numerical analysis was done using Seismostruct, a free license program. For first have to be defined the meaning of archetype. An archetype is a prototypical representation of a seismic-force-resisting element. Archetypes are intended to reflect the range of design parameters and element attributes that are judged to be reasonable representations of the feasible design space and have a measurable impact on system response. Once validated it, how will be show in next chapter, it is possible to define the space of the construction made of archetype and using non linear analysis it is possible to define the seismic response of the proposed seismic-force-resisting system.
Below is reassumed the numerical modeling process:
4.1 Hypothesis
Based on the meaning of Confining Masonry walls, and then confined with cast
in-frame work like a parallel system. In figure 37 is shown the meaning:
With this assumption, it was possible
the masonry wall. It is also assumed that the frame works for flexural deformation and the walls for shear.
4.2 Frame Modeling
To modeling the frame the following data
• Column section 193.675x193.675 mm
• Beam section 193.657x254 mm
• Longitudinal reinforce 4Ø12 S400;
• Rectangular Hoops 1 Ø12/100 mm S200;
• Rebar cover thickness 34.95 mm.
The constitutive law used for concrete is Mander et Al.[1988] Model. To describe completely the mechanical characteristics of the material, five parameter had to be defined.
meaning of Confining Masonry walls, namely unreinforced masonry walls built first -place reinforced concrete, the first assumption was that
frame work like a parallel system. In figure 37 is shown the meaning:
Figure 37 Process to define the Archetype
With this assumption, it was possible to split the modeling problem into two element, the frame and med that the frame works for flexural deformation and the walls for
To modeling the frame the following data were used:
Column section 193.675x193.675 mm2 ; x254 mm2;
Longitudinal reinforce 4Ø12 S400; Ø12/100 mm S200; Rebar cover thickness 34.95 mm.
law used for concrete is Mander et Al.[1988] Model. To describe completely the mechanical characteristics of the material, five parameter had to be defined.
38 namely unreinforced masonry walls built first place reinforced concrete, the first assumption was that wall and
split the modeling problem into two element, the frame and med that the frame works for flexural deformation and the walls for
“In-Plane Cyclic Behavior of Substandard Confined Masonry: Full-Scale Experiments, Finite-Element Modeling and Incremental Dynamic Analysis”
Chapter 4
39 In table 13 are defined the parameters:
Table 13
Parameter Explanation
fc Cylindrc Compression Strength
ft Traction Strength
εc Strain at the maximum strength
kc Confining Factor
γ Weight of concrete
The element class used was inelastic plastic hinge frame element. This type of element permit to concentrate such inelasticity within a fixed length of the element, as proposed by Scott and Fenves [2006]. The advantages of such formulation is a full control/calibration of the plastic hinge length. In fact, the tests was done for a damaged frame, and the model, at the beginning had to follow the same curves, so, in base of the assumption found in [22-23-24], the first step was to model a damaged frame, or better to define the plastic hinge length to model the real cyclic response of the frame. Two limit curves will shown in figure 38, the first that represent the frame without damage and a plastic hinge length equal to a 16.67% of the length of the column and the second one, that represent a complete damage of the frame with a plastic hinge length equal to the 33% of the length of the column. Once made the elementary archetype, using a non linear static analysis in displacement control, we obtain the numerical results shown in figure 38 and 39 that are plotted with the test results.
40 Defined what were the upper and lower limit curve, after a lot of numerical test, the real frame behavior was obtained. In fact, as is shown in figure 39, the plastic hinge after type two wall test was equal to the 28% of the length of the column, and that means, how we can see from the force-lateral displacement diagram, the dissipative properties of the frame weren’t been exhausted. That’s have to be point out, because for a seismic point of view, what we will find it is the wall behavior, that have less ductility properties than the frame. It is also true that one of the first hypothesis we find from literature review was that the frame role was only to confine the wall, and not bearing loads.
Figure 39 Analitycal Modeling of the Frame
Once defined the frame element properties and checked that it was working well (validation using test results), we started the confined wall modeling.
4.3 Confined Masonry wall Modeling
To modeling the non-linear behavior of infill panels in frame structures it is used a four nodes masonry panel element, developed and initially programmed by Crisafulli [11] and implemented in Seismostruct by Blandon [2005].
“In-Plane Cyclic Behavior of Substandard Confined Masonry: Full-Scale Experiments, Finite-Element Modeling and Incremental Dynamic Analysis”
Chapter 4
41
Figure 40 Infill Element
Each diagonal direction features two parallel struts to carry axial loads across two opposite diagonal corners and a third one to carry the shear from the top to the bottom of the panel. This latter strut only acts across the diagonal corners and a third one to carry the shear from the top to the bottom of the panel. This latter strut only acts across the diagonal that is on compression, hence its activation depends on the deformation of the panel. The axial load struts use the masonry strut hysteresis model, while the shear strut uses a dedicated bilinear hysteresis rule.
To fully characterize this type of element, these are the parameters that have been defined:
• strut curve parameters:
• shear curve parameters;
• infill panel thickness;
• out of plane failure drift;
• strut area 1;
• strut area 2;
• equivalent contact length;
• horizontal and vertical length;
• proportion of stiffness assigned to shear;
• specific weight.
4.3.1 Strut curve parameters
This is the masonry infill strut model, developed and initially programmed by Crisafulli and implemented in Seismostruct by Blandon to be used in association with the infill panel element.
42 The first things have to be underlined it is that this curve was studied assuming small hysteretic cycles. 17 parameters need to be defined in order to fully characterize this response curve, and must be underline that a lot of them are experimental parameters.
Table 14
Parameter Explanation
Em Inizial Young Modulus
fmө Diagonal Compression Capacity of the panel
ft Bond-strnght of the interface frame-wall
εm Strain at Maximum Stress
εuk Ultimate Strain
εcl Strain after which cracks partially close
ε1 Strut Area reduction strain
ε2 Residual Strut Area strain
gu Starting unloading stiffness factor
ar Strain reloading factor
ach Strain inflection factor
ba Complete unloading strain factor
bch Strain inflection factor
gpu Zero stress Stiffness factor
gpr Reloading Stiffness factor
ex1 Plastic unloading Stiffness factor
ex2 Repeated cycle Strain factor
Have to be underlined that the last nine parameters are all empirical parameters and related to cyclic loading. In addition, sensitivity studies have also shown that only three of them play a significant role:
• reloading stiffness factor;
• strain inflection factor;
• plastic unloading stiffness factor. 4.3.2 Shear curve parameters
The shear strength results as the combination of two mechanisms, namely, bond strength and friction resistance between the mortar joints and the bricks. The shear strength can thus be expressed as the sum of the initial shear bond strength τ0 and the product of coefficient of friction µ
“In-Plane Cyclic Behavior of Substandard Confined Masonry: Full Incremental Dynamic Analysis”
Chapter 4
estimate shear resistance is pragmatically adopted by design codes, independently of the failure mechanism being developed in the infill panel. To
parameters have to be defined:
Parameter
τ0 µ
τmax
αs
Below it is shown the way in which were defined these parameters.
4.3.3 Panel thickness
This value could be considered as equal to the width of the panel bricks alone or include also the contribute of the plaster.
4.3.4 Out of plane failure drift
Introduced in percentage of storey height, it take in account the possibility that if out of plain behavior occur, the panel do not give contribution in react to seismic response.
4.3.5 Strut Area 1
Strut area 1 it is the initial strut area value. In according with different authors, in the figure below it is represented how it is defined.
Plane Cyclic Behavior of Substandard Confined Masonry: Full-Scale Experiments, Finite
estimate shear resistance is pragmatically adopted by design codes, independently of the failure mechanism being developed in the infill panel. To fully characterize this response curve 4
Table 15
Explanation Shear bond strength
Friction coefficient Maximum shear strength
Empirical factor. It represents the ratio between the maximum shear stress and the average stress in the panel
Below it is shown the way in which were defined these parameters.
Figure 41
This value could be considered as equal to the width of the panel bricks alone or include also the
Introduced in percentage of storey height, it take in account the possibility that if out of plain behavior occur, the panel do not give contribution in react to seismic response.
area 1 it is the initial strut area value. In according with different authors, in the figure below it Scale Experiments, Finite-Element Modeling and
43 estimate shear resistance is pragmatically adopted by design codes, independently of the failure fully characterize this response curve 4
Explanation Shear bond strength
Friction coefficient Maximum shear strength
Empirical factor. It represents the ratio between the stress and the average stress in the panel
This value could be considered as equal to the width of the panel bricks alone or include also the
Introduced in percentage of storey height, it take in account the possibility that if out of plain behavior occur, the panel do not give contribution in react to seismic response.
4.3.6 Strut Area 2
Defined a percentage of strut Area1, it represent the residual strut area, after that taken the wall.
4.3.7 Equivalent contact length
Introduced as percentage of the vertical height of the panel, effectively yielding the distance between the internal and dummy nodes (node 1
account of the contact length between
4.3.8 Horizontal and vertical offsets
Xoi and Yoi introduced as percentage of the horizontal and
parameters that provide the distance between the external corner nodes and the internal ones.
4.3.9 Proportion of stiffness assigned to shear
It represent the proportion of the panel stiffness that should be assigned
With the following means: Ka = Strut stiffness;
Kb = Shear stiffness;
γs = proportion of stiffness assigned to shear.
Figure 42 Strut Area 1
Defined a percentage of strut Area1, it represent the residual strut area, after that
Equivalent contact length
Introduced as percentage of the vertical height of the panel, effectively yielding the distance e internal and dummy nodes (node 1-2-3-4 figure 40) and used as to somehow take due account of the contact length between the frame and the infill panel.
Horizontal and vertical offsets
introduced as percentage of the horizontal and vertical dimensions of the panel, are parameters that provide the distance between the external corner nodes and the internal ones.
Proportion of stiffness assigned to shear
It represent the proportion of the panel stiffness that should be assigned to the shear spring
= proportion of stiffness assigned to shear.
44 Defined a percentage of strut Area1, it represent the residual strut area, after that damaging has
Introduced as percentage of the vertical height of the panel, effectively yielding the distance 4 figure 40) and used as to somehow take due
vertical dimensions of the panel, are parameters that provide the distance between the external corner nodes and the internal ones.
![Figure 4 Shear Failure [10-11] Figure 3 Failure Mechanisms [7]](https://thumb-eu.123doks.com/thumbv2/123dokorg/7466929.102092/10.892.95.799.240.518/figure-shear-failure-figure-failure-mechanisms.webp)
![Figure 5 Increasing of Struts [11]](https://thumb-eu.123doks.com/thumbv2/123dokorg/7466929.102092/11.892.102.799.398.621/figure-increasing-of-struts.webp)
![Table 1 Strentgh in masonry units [14]](https://thumb-eu.123doks.com/thumbv2/123dokorg/7466929.102092/20.892.109.794.261.570/table-strentgh-in-masonry-units.webp)