Engineering Department
______________________________________________________
SCUOLA DOTTORALE / DOTTORATO DI RICERCA IN
XXV
_______________________
CICLO DEL CORSO DI DOTTORATO
Seismic Assessment of As-built and Isolated cases of an
Existing RC Bridge through Experimental PsD Testing
__________________________________________________
Titolo della tesi
Arkam Mohamad
__________________________
__________________
Nome e Cognome del dottorando
firmaProf. Fabrizio Paolacci
_________________________
__________________
Docente Guida/Tutor: Prof.
firmaProf. Aldo Fiori
________________________
__________________
Collana delle tesi di Dottorato di Ricerca In Scienze dell’Ingegneria Civile
Università degli Studi Roma Tre Tesi n° 47
Abstract
In Italy most of Infrastructures and highway bridge systems have been built before the issue of modern seismic design codes. Chiefly, the existing transportation systems that built in the late 60s and early 70s were designed primarily for gravity loads. As a result, such systems do not employ seismic details and hence their structural performance is inadequate under earthquake ground motions.
To decide for any retrofitting operation, the seismic behaviour of existing bridges must be assessed. Because the nonlinear procedures are becoming very popular in the frameworks of structural assessment, there is a need to accurately simulate authentic model to provide reliable indications about the performance required to this kind of structures.
Based on these observations, this thesis is devoted to the seismic assessment of existing RC bridges. In particular, the vulnerability of an old RC viaduct with portal frame piers equipped with plain steel bars has been numerically and experimentally investigated. Subsequently, the retrofitting has been evaluated using Friction Pendulum System isolation “FPS”.
The nonlinear FE modelling has been executed using OpenSEES software framework. The local behaviour of the bridge has been taking into account, mainly, the bond-slip, strain penetration effect of the plain steel bars, bar buckling and the shear behaviour effect of the transverse beams of the portal frame piers.
Depending on a previous experimental campaign consisting of cyclically imposed displacements on 1:4 reduced scale models of a frame pier, belonging to the same RC highway viaduct, a new experimental activity has been proposed within the RETRO project funded by the European
Union. In particular, Two specimens (scale 1:2.5), 2 floors (total height is 5.8 m) and 3 floors (total height is 10.3 m) one-bay reinforced concrete frame respectively, were built and tested using the PsD technique with sub-structuring; the modelling of the entire viaduct is considered along with the non-linear behaviour of each pier.
During the test campaign, two different configurations for the analysed viaduct have been considered; “As-built” and “Isolated with Friction Bearings”. The response of both cases has been compared to evaluate the effectiveness of the isolation system. To this end, two natural accelerograms were selected based on studying the seismiogenic zone of the bridge to represent, according to current seismic codes, the Serviceability and Ultimate limit states.
Analysis and interpretation of the experimental were achieved throughout the data recorded by the instrumentation used in the test campaign. The results have been used to calibrate numerical models and to provide a detailed analysis of the performance of the as-built configuration and to show the effectiveness of friction pendulum systems for seismic protection, which will ultimately lead to guidelines for the assessment and design of similar structures as part of pre-Normative research in support to the Eurocodes.
Keywords: Reinforced Concrete Bridges, Frame Piers, Plain steel bars, Numerical Simulation, Retrofitting of Bridges, Experimental investigation, Friction Pendulum System, PseudoDynamic Testing.
Preface
First and foremost I would like to thank my supervisor Prof. Fabrizio Paolacci for his extreme effort of help, advice and encouragement throughout my PhD study
Many thanks to University Roma Tre for awarding me the scholarship for PhD research study. I would like to circulate my thanks to all Engineering department faculty members, laboratory workers and all friends and colleagues for their encouragement and support.
I would like to recognize and thank the Joint Research Center for the invitation to work in ELSA laboratory during the experimental tests. I extend my thanks to all RETRO project team for their help and high collaboration.
Finally, I would like to thank my parents and family for their love, and endless moral support.
Acknowledgments
The study and results in this thesis are established upon RETRO’ project which is a 3-year European project funded by Seismic Engineering Research Infrastructures for European Synergies “SERIES”. The experimental activates have been achieved at the European Laboratory for Structural Assessment “ELSA” at Joint Research Centre.
Table of Contents
ABSTRACT ... V
PREFACE ... VII
ACKNOWLEDGMENTS ... VIII
TABLE OF CONTENTS ... IX
LIST OF FIGURES ... XIV
LIST OF TABLES ... XXIV
LIST OF SYMBOLS ... XXV
1. INTRODUCTION
... 11.1. BACKGROUND AND MOTIVATION ... 1
1.2. OBJECTIVES AND SCOPE ... 4
2.3. NATIONAL AND INTERNATIONAL CODES ... 5
2. LITERATURE REVIEW OF THE
ASSESSMENT OF EXISTING BRIDGES
... 72.1. INTRODUCTION ... 7
2.2. TYPICAL SEISMIC DAMAGES OF BRIDGES ... 10
2.3. NATIONAL AND INTERNATIONAL CODES ...15 2.4. PERFORMANCE-BASED EARTHQUAKE ENGINEERING ...15 2.5. CODE AND STANDARDS FOR PBEE ... 17
2.6. DESCRIPTION OF RETRO PROJECT ... 21
2.7. RELUIS CAMPAIGN ANALYSIS AND TESTING (2005-2008) 23
2.7.1. RELUIS CASE STUDY AND SPECIMENS ... 24
3. DESCRIPTION OF THE CASE STUDY
“RIO-TORTO” BRIDGE
... 34 3.1. GEOMETRICAL CHARACTERISTICS OF RIO-TORTO BRIDGE ... 34 3.2. MATERIAL PROPERTIES ... 38 3.3. VERTICAL LOADS ... 40 3.4. REINFORCEMENT DETAILS OF THE PIERS ...41 3.5. SOIL CONDITIONS ... 42 3.6. SEISMOGENIC ZONE AND RESPONSE SPECTRA ... 434.NUMERICAL MODELLING OF RIO-TORTO
BRIDGE
... 47 4.1. PRELIMINARY MODEL USING MIDAS GEN ... 47 4.1.1. NON-LINEAR CONSTITUTIVE LAWS FOR MATERIALS ... 51 4.1.1.1. CONSTITUTIVE LAWS FOR CONCRETE ... 51 4.1.1.2. CONSTITUTIVE LAWS FOR STEEL BARS ... 53 4.1.2. RESTRAINTS AND BOUNDARY CONDITIONS ... 53 4.2. REFINED MODEL SIMULATION OF THE BRIDGE USING OPENSEES FOR AS-BUILT AND ISOLATED CASES ... 56 4.2.1. OPENSEES F.E MODEL OF THE AS-BUILTCONFIGURATION ... 56 4.2.1.1. DESCRIPTION OF THE MAIN NON-LINEAR PHENOMENA OF THE RIO TORTO VIADUCT ... 56 4.2.1.2. GEOMETRY AND CONSTITUTIVE LAWS ... 57 4.2.1.3. STRAIN PENETRATION EFFECT OF THE PLAIN STEEL BARS ... 58 4.2.1.4. MODELLING OF NON-LINEAR SHEAR BEHAVIOUR ... 60 4.2.2. OPENSEES F.E. MODEL OF ISOLATED CONFIGURATION AND IMPLEMENTATION OF THE ISOLATORS ... 62
4.2.2.1. DESIGN OF THE FP ISOLATION SYSTEM ... 62
4.2.2.2. OPENSEES F.E. MODEL OF ISOLATED CONFIGURATION ... 64
5.SEISMIC RESPONSE ANALYSIS OF
RIO-TORTO BRIDGE
... 675.1. PRELIMINARY EVALUATION OF THE SEISMIC RESPONSE OF AS-BUILT CONFIGURATION ... 67
5.1.1. STATIC CYCLIC ANALYSIS IN 2-D OF PIER 9 AND 11 ... 68
5.1.2. DYNAMIC ANALYSIS IN 2-D OF PIER 9 AND 11 ... 72
5.1.3. ELASTIC 3-D ANALYSIS OF THE ENTIRE VIADUCT ... 74
5.1.3.1. MODAL ANALYSIS OF THE RIO-TORTO VIADUCT ... 75
5.1.3.2. RESPONSE SPECTRUM ANALYSIS ... 80
5.2. SEISMIC RESPONSE ANALYSIS OF THE REFINED MODEL USING OPENSEES ... 86
5.2.1. SELECTION OF THE DATA INPUT ... 86
5.2.1.1. DEFINITION OF SERVICEABILITY LIMIT STATE (SLS) ... 86
5.2.1.2. SELECTION OF THE INPUT SIGNALS ... 89
5.2.1.2.1. SERVICEABILITY LIMIT STATE SLIGHT (SLS) ... 89
5.2.1.2.2. ULTIMATE LIMIT STATE (ULS) ... 91
5.2.2. MODAL ANALYSIS OF THE VIADUCT USING OPESEES MODEL ... 93
5.2.3 SIMULATION OF NL RESPONSE OF THE AS-BUILT CONFIGURATION ... 95
5.2.3.1 ANALYSIS OF THE RESPONSE OF SLS ... 95
5.2.3.2 ANALYSIS OF THE RESPONSE FOR ULS ... 103
5.2.4 SIMULATION OF NL RESPONSE OF THE ISOLATED CONFIGURATION ... 110
5.2.4.1 SIMULATION OF THE SEISMIC TEST UNDER SLS CONDITION ... 110
5.2.4.2 SIMULATION OF THE SEISMIC RESPONSE UNDER ULS
CONDITION ... 114
6. MOCK UP’S DESIGN AND PSD TEST
SETTING UP
... 1186.1. DESCRIPTION OF THE MOCK UP’S ... 118
6.1.1 SCALING ... 118
6.1.2. FLEXURAL AND SHEAR STRENGTH SCALING ... 119
6.1.3. SCALING OF THE BOND SLIP PHENOMENON ... 121
6.1.4. SCALING OF THE FP DEVICES ... 122
6.2. GEOMETRY AND DETAILING OF THE PIER MOCK UP’S .... 124
6.3. GRAVITY LOADS ... 125
6.4. SCALED ISOLATION SYSTEM SETTING UP ... 126
6.5. MATERIALS MECHANICAL PROPERTIES OF THE PIERS .... 127
6.6. TESTING METHODS ... 129
6.7. SETTING UP AND INSTRUMENTATION ... 131
6.7.1. TESTING RIG ... 131
6.7.2. CONTROL STRATEGY ... 134
6.7.3. PIERS CONTROL ... 136
6.7.4. CONTROL OF ISOLATORS ... 137
6.8. SENSORS AND ACQUISITION SYSTEM ... 139
6.9. REDUCED MODEL IN OPENSEES FOR PSD TESTING ... 143
7. EXPERIMENTAL RESULTS
... 1497.1. TESTING PROGRAM ... 149
7.2. ISOLATORS AND SPECIMENS CHARACTERIZATION ... 152
7.2.1.1. CYCLIC TESTS FOLLOWING THE LOMIENTO ET AL.
PROCEDURE ... 152
7.2.1.2. TESTS FOR DIFFERENT CYCLING VELOCITIES AND AMPLITUDES ... 155
7.2.2. STATIC CHARACTERIZATION OF THE SPECIMENS ... 157
7.3. PSD TEST RESULTS ON THE ENTIRE VIADUCT ... 158
7.3.1. PSD TEST RESULTS ON THE NON-ISOLATED VIADUCT 159
7.3.2. PSD TEST RESULTS ON THE ISOLATED VIADUCT ... 169
8.CONCLUSIONS
... 174REFERNCES ... 178
APPENDIX A: PHOTOGRAPHIC OF MOCK UP’S CONSTRUCTION ... 187
APPENDIX B-1: FIGURES OF ISOLATED CASE IN SLS ... 195
APPENDIX B-2: FIGURES OF ISOLATED CASE IN ULS ... 191
List of Figures
Figure 2.1 San Fernando Earthquake 1971 9
Figure 2.2 Loma Prieta Earthquake 1989 - Cypress viaduct 9 Figure 2.3 Nishinomiya - Kobe Earthquake 1995 10 Figure 2.4 Hanshin Expressway damage, Kobe, Japan (1995) 11
Figure 2.5 Cypress Freeway Viaduct collapse 12
Figure 2.6 East Bay Bridge Loma Prieta, 1989 12 Figure 2.7 Gothic Avenue Viaduct, Northdridge 1994 13 Figure 2.8 Wushi viaduct Chi-Chi, Taiwan 1999 14
Figure 2.9 Shinkansen Viaduct Kobe, 1995 14
Figure 2.10 Total life-cycle cost curve 17
Figure 2.11 Damage states at different qualitative performance
levels 18
Figure 2.12 Building performance levels in Vision 2000
performance 19
Figure 2.13 Decision making for building evaluation depending
on Decision Variable 20
Figure 2.14 RETRO project frame piers tested at ELSA 22 Figure 2.15 Reinforcement layout and cross section of Pier 12
(dimensions in cm) 25
Figure 2.16 Pier 12 experimental test setup 26
Figure 2.17(a) Linear potentiometer at a beam–column joint and,
(b) linear potentiometer at a column base 27
Figure 2.18 (a) Time-history of the imposed displacements, (b)
time-history of the vertical loads 28
Figure 2.19 Force-deflection response: (a) specimens #1 and #2,
(b) specimen #1 and #3 29
Figure 2.20 (a) Shear cracking pattern of the transverse beam of specimen #1; (b) crack at the base of a column of specimen#1; (c) failure of both the joints of specimen #2; and (d) failure mode of 30
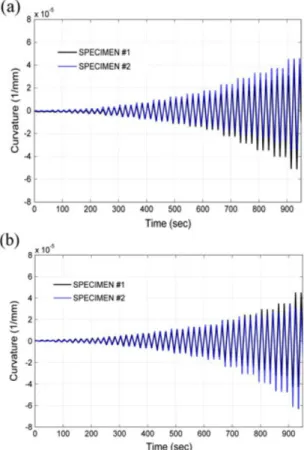
specimen #3: shear failure of the transverse beam and joint Figure 2.21 Curvature of the columns at bottom section: (a) left
column and (b) right column 31
Figure 3.1 Longitudinal view of the viaduct Rio-Torto 34 Figure 3.2 (a) A view of the bridge, (b) Detail of the deck 35
Figure 3.3 Cross-section of the deck 35
Figure 3.4 Garber Saddles 35
Figure 3.5 Reinforcement details of pier 9 and 11 36 Figure 3.6 Overall dimensions of all piers (full scale) 37
Figure 3.7 Preparation of the specimens 38
Figure 3.8 Set-up of the pull-out test 39
Figure 3.9 Results of the previous experimental campaign at
University Roma Tre 40
Figure 3.10 Full-scale cross-sections of the cap-beam, transverse
and the columns 41
Figure 3.11 Reinforcement details of the transverse beam 42 Figure 3.12 Geological conditions of the zone 43 Figure 3.13 Shallow foundation (Plinths) of the Rio-Torto viaduct 43 Figure 3.14 (a) Seismogenic zones, (b) Italian ground shaking
intensity map on Bedrock (INGV) 44
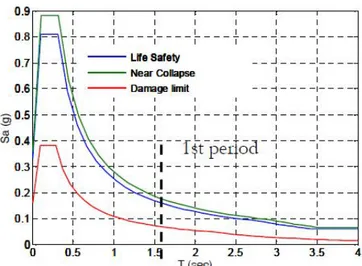
Figure 3.15 Response spectra of the viaduct according to the
current Italian code (Soil A) 45
Figure 3.16 (a) Seismogenic zone of the viaduct (b) seismic
hazard in terms of PGA for 50 years 46
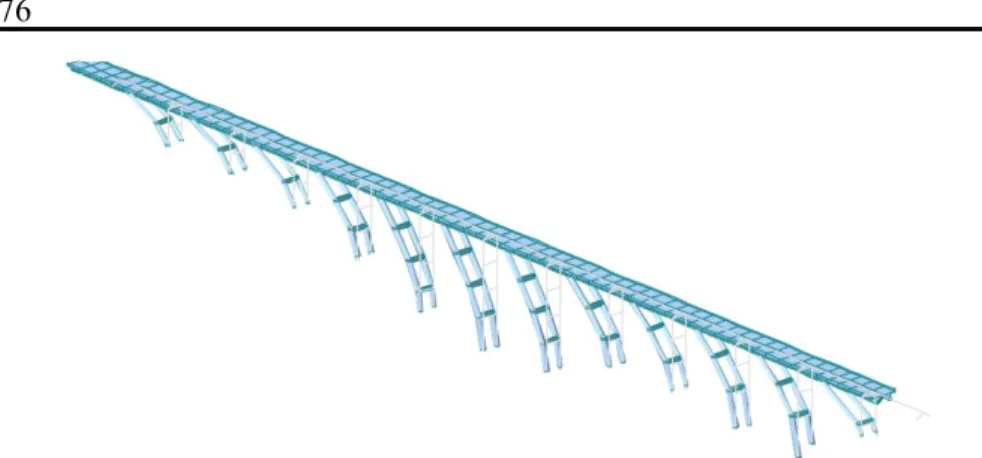
Figure 4.1 Longitudinal 3-D view of the RIO-TORTO viaduct –
MIDAS 48
Figure 4.2 MIDAS - Fiber subdivision of a column of pier #9 49 Figure 4.3 MIDAS - Fiber subdivision of one of the transverse
beams of pier #9 49
Figure 4.4 Elements and nodes of the MIDAS model 50 Figure 4.5 Masses placement in the MIDAS model 50
Figure 4.6 Masses symbols of the piers 50
Figure 4.8 Steel constitutive law: Menegotto-Pinto model 53 Figure 4.9 Hinge model for the Gerber saddles 54 Figure 4.10 Restraint conditions between deck and abutment 54 Figure 4.11 Restraint conditions between deck and abutment 54 Figure 4.12 Rigid beams to connect the deck to the piers 55 Figure 4.13 Experimental investigation at University Roma Tre:
(a) Force-deflection cycle of pier 12, (b) Shear Damage in the
transverse beam of pier 12 56
Figure 4.14 Rio-Torto viaduct - Opensees 57
Figure 4.15 Numerical model of pier 12 57
Figure 4.16 Crack opening for bar slippage 59
Figure 4.17 Zhao and Shritaran model 59
Figure 4.18 Shear force-deformation relationships 61 Figure 4.19 Single sliding surface friction pendulum system
(courtesy of ALGAS.p.A) 63
Figure 4.20 Hysteretic behaviour obtained during dynamic tests
on single concave surface sliding pendulum 64
Figure 5.1 T-H of the gravitational load 69
Figure 5.2 T-H of the horizontal displacements 69
Figure 5.3 Force-deflection cycle: pier 9 70
Figure 5.4 Force-deflection cycle: pier11 70
Figure 5.5 Moment-curvature relationship of the base section of
column dx – pier 9 (scale 1:2) 71
Figure 5.6 Moment-curvature relationship of the transverse beam
– pier 9 (scale 1:2) 71
Figure 5.7 Moment-curvature relationship of the base section of
column dx – pier 11 (scale 1:2) 71
Figure 5.8 Moment-curvature relationship of the transverse
beam– pier 11 (scale 1:2) 71
Figure 5.9 Sequence of plastic hinge formation in the pier 9 for
cyclic imposed displacements 72
Figure 5.10 1st vibration mode of pier # 9 73
5.12 Response spectrum analysis - Bending moment pier 9 – with
masses 74
Figure 5.13 Response spectrum analysis - Bending moment pier 9
- without masses 74
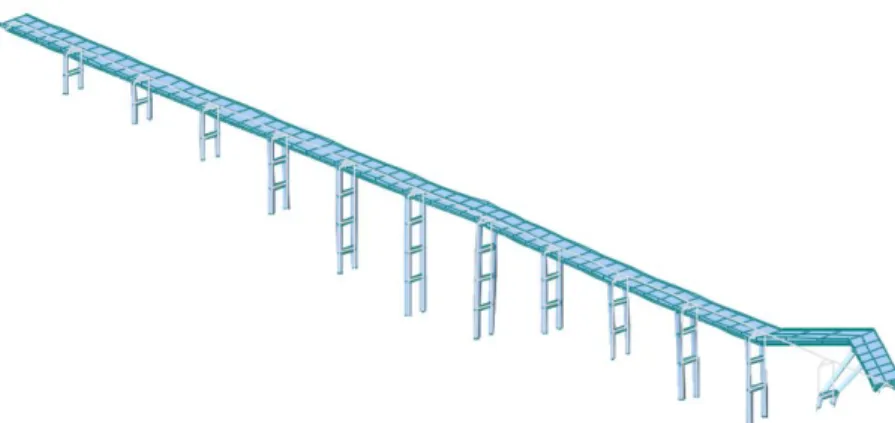
Figure 5.14 Modal analysis – 1st vibration mode of Rio-Torto
bridge 76
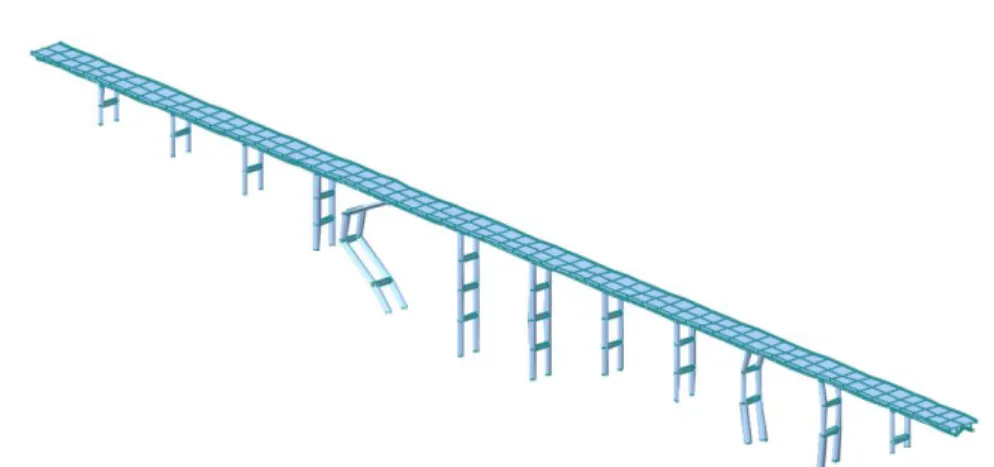
Figure 5.15 Modal analysis – 2nd vibration mode of Rio-Torto
bridge 76
Figure 5.16 Modal analysis – 3rd vibration mode of Rio-Torto
bridge 76
Figure 5.17 Modal analysis – 4th vibration mode of Rio-Torto
bridge 77
Figure 5.18 Modal analysis – 5th vibration mode of Rio-Torto
bridge 77
Figure 5.19 Modal analysis – 6th vibration mode of Rio-Torto
bridge 77
Figure 5.20 Modal analysis – 7th vibration mode of Rio-Torto
bridge 78
Figure 5.21 Modal analysis – 8th vibration mode of Rio-Torto
bridge 78
Figure 5.22 Modal analysis – 24th vibration mode of Rio-Torto
bridge 79
Figure 5.23 Response spectra of the viaduct according to the
current Italian code (Soil A) 80
Figure 5.24 Response spectrum analysis: Deformation of
Rio-Torto viaduct 81
Figure 5.25 Response spectrum analysis stresses: Axial force
(kN) 82
Figure 5.26 Response spectrum analysis stresses: bending
moment (kN.m) 83
Figure 5.27 Response spectrum analysis stresses: shear (kN) 84 Figure 5.28 Comparison between linear and non-linear response 85 Figure 5.29 Cracks pattern in the transverse beam observed 87
during the experimental test at University Roma Tre: a) hairline cracks, b) moderate crack c) extensive cracks
Figure 5.30 Serviceability Limit State - Pier 9 87 Figure 5.31 Serviceability Limit State - Pier 11 87 Figure 5.32 Serviceability Limit State - Pier # 9 88 Figure 5.33 Serviceability Limit State - Pier # 11 88 Figure 5.34 Record of the 29th May 2012 (W-E Component):
acceleration (top), velocity (middle) and displacement (bottom)
response histories 89
Figure 5.35 Response spectra of the record of the 29th May 2012 (East-West Component): acceleration (left), velocity (middle) and
displacement (right) spectra 90
Figure 5.36 Reduction of the signal length 90
Figure 5.37 Final signal used in the numerical simulations 91 Figure 5.38 Record of the 29th May 2012 (N-S Component):
acceleration (top), velocity (middle) and displacement (bottom)
response histories 91
Figure 5.39 Response spectra of the record of the 29th May 2012 (East-West Component): acceleration (left), velocity (middle) and
displacement (right) spectra 92
Figure 5.40 Reduction of the signal length 92
Figure 5.41 Final signal used in the numerical simulations 93
Figure 5.42 Opensees 2nd Eigenmode 94
Figure 5.43 Opensees 5th Eigenmode 94
Figure 5.44 Opensees 20th Eigenmode 94
Figure 5.45 Opensees 25th Eigenmode 94
Figure 5.46 Maximum lateral displacement of piers 96
Figure 5.47 Maximum base shear of piers 97
Figure 5.48 Maximum shear force in the transverse beam 97
Figure 5.49 Maximum inter-storey drift 98
Figure 5.50 Hysteretic cycle response of piers 99 Figure 5.51 Moment-curvature cycles at bottom section of the left
Figure 5.52 Moment-curvature cycles at bottom section of the
right column of each pier 100
Figure 5.53 Moment-curvature cycles of the transverse beam at
1st level of each pier 100
Figure 5.54 Shear force-deformation cycles of the transverse
beam at 1st level of each pier 101
Figure 5.55 Moment-curvature cycles of the transverse beam at
2nd level of each pier 101
Figure 5.56 Shear force-deformation cycles of the transverse
beam at 2nd level of each pier 102
Figure 5.57 Moment-curvature cycles of the transverse beam at
3rd level of each pier 102
Figure 5.58 Shear force-deformation cycles of the transverse
beam at 3rd level of each pier 102
Figure 5.59 Maximum lateral displacement of piers 103
Figure 5.60 Maximum base shear of piers 104
Figure 5.61 Maximum shear force in the transverse beam 105
Figure 5.62 Maximum inter-storey drift 105
Figure 5.63 Hysteretic cycle response of piers 106 Figure 5.64 Moment-curvature cycles at bottom section of the left
column of each pier 106
Figure 5.65 Moment-curvature cycles at bottom section of the
right column of each pier 107
Figure 5.66 Shear force-deformation cycles of the transverse
beam at 1st level of each pier 108
Figure 5.67 Moment-curvature cycles of the transverse beam at
2nd level of each pier 108
Figure 5.68 Shear force-deformation cycles of the transverse
beam at 2nd level of each pier 109
Figure 5.69 Moment-curvature cycles of the transverse beam at
3rd level of each pier 109
Figure 5.70 Shear force-deformation cycles of the transverse
Figure 5.71 Deck and piers maximum transversal displacement 110 Figure 5.72Hysteretic behaviour of the devices during the strong
motion 111
Figure 5.73 Maximum base shear 112
Figure 5.74 Maximum inter-storey drift 112
Figure 5.75Hysteretic behaviour of the piers 113 Figure 5.76 Hysteretic behaviour of the transverse beam 113 Figure 5.77 Deck and piers maximum transversal displacement 114 Figure 5.78Hysteretic behaviour of the devices during the strong
motion 115
Figure 5.79 Maximum base shear 115
Figure 5.80 Maximum inter-storey drift 116
Figure 5.81Hysteretic behaviour of the piers 116 Figure 6.1 Reinforcement of cap and transverse beam and of the
tall pier 122
Figure 6.2 Constitutive low relationships 122
Figure 6.3 Maximum deck displacements 123
Figure 6.4 Geometry of pier 11 124
Figure 6.5 Geometry of pier 9 125
Figure 6.6 Isolation devices test setup 127
Figure 6.7 Stress-Strain behaviour of test A-fi3-A for plain 3mm
steel bar 128
Figure 6.8 Stress-Strain behaviour of test A-fi4-A for plain 4mm
steel bar 128
Figure 6.9 Stress-Strain behaviour of test C-fi6-B for plain 6mm
steel bar 128
Figure 6.10 Stress-Strain behaviour of test E-fi10-B for plain
10mm steel bar 128
Figure 6.11 Mock-up of the RETRO piers in ELSA 132
Figure 6.12 Loading frame of Pier 9 133
Figure 6.13 Loading frame of Pier 11 133
Figure 6.14 Cross section of the isolator set-up 133 Figure 6.15 Top and side view of the isolator set-up 134
Figure 6.16 (a) Horizontal actuators used in ELSA Lab; (b) Steel
frame used to connect the actuators to the piers 135
Figure 6.17 PsD test setting up 135
Figure 6.18 Actuator map setting up 136
Figure 6.19 LVDT sensors map of pier 9 tests 140 Figure 6.20 LVDT sensors on the transverse beam 141 Figure 6.21 LVDT sensors map of pier 11 tests 142 Figure 6.22 Validation of the reduced model of Pier 9 (a)
Displacement, (b) Dissipated energy histories at ULS 145 Figure 6.23 (a) Hysteretic loop for the bilinear system, (b) bilinear
S-DoF system after Mosthagel (1999) 145
Figure 6.24 Dynamic response of right isolator of Pier 9 at ULS:
a) Hysteretic loop; b) dissipated energy 146
Figure 6.25 Plan view of the reduced model of the bridge in the
non-isolated case 146
Figure 6.26 Cap beam level transversal displacement responses of Pier 9 in the non-isolated case at (a) SLS; (b) ULS 147 Figure 7.1 Sinusoidal test comparisons of runs at different
velocities - Test b22 154
Figure 7.2 Random test comparisons of runs at different velocities
- Test b23 155
Figure 7.3 Test at variable amplitude, Isolator setup at short pier -
Test b16 156
Figure 7.4 Test at variable amplitude, Isolator setup at tall pier-
Test d03 156
Figure 7.5 Test at variable frequency, Isolator setup at short pier -
Test b22 156
Figure 7.6 Test at variable frequency, Isolator setup at tall pier -
Test b22 156
Figure 7.7 Force-displacement loops for short pier - Test f03 158 Figure 7.8 Force-displacement loops for tall pier Test f04 158 Figure 7.9 Curvature at the bottom section of the left column of
Figure 7.10 Shear Deformation in the transverse beam for test k07 160 Figure 7.11 Parameters for the evaluation of the curvature in the
columns 161
Figure 7.12 Parameters for the evaluation of the shear
deformation 161
Figure 7.13 Force-Deflection cycle of Pier 9 (SLS PGA=100%) -
Test k07 162
Figure 7.14 Force-Deflection cycle of Pier 11 (SLS PGA=100%)
- Test k07 162
Figure 7.15 Force-Deflection cycle of Pier 9 (ULS PGA=100%) -
Test k09 162
Figure 7.16 Force-Deflection cycle of Pier 11 (ULS PGA=100%)
- Test k09 162
Figure 7.17 (a) Cycles of the remaining (numerical) piers (b)
Displacement abd shear force curves - Test k09 163 Figure 7.18 Shear cracks pattern in the transverse beam of pier 11
after test k09 164
Figure 7.19 Crack opening at the top and bottom of pier 11 after
test k09 164
Figure 7.20 Force-Deflection cycle of Pier 9 - test k10
(Aftershock PGA=100%) 165
Figure 7.21 Force-Deflection cycle of Pier 11 - test k10
(Aftershock PGA=100%) 165
Figure 7.22 Force-Deflection cycle of tall Pier for test k12
(PGA=200%) 165
Figure 7.23 Force-Deflection cycle of Pier 11 for test k12
(PGA=200%) 165
Figure 7.24Transverse beam damage on pier 11 after test k12 166 Figure 7.25 Crack opening at the top of a column in the Short pier
after test k12 167
Figure 7.26 Blow up of the transverse beam damage on short pier
after test k12 167
after test k12
Figure 7.28 Crack opening and buckling phenomena at the bottom section of columns in the Short (a,b) and Tall pier (c) after test
k12 168
Figure 7.29 Time-History of the shear deformation at transverse beam of Tall (a) and Short pier (b), curvature at bottom section of
left column of Tall (c) and Short pier – 200% ULS 168 Figure 7.30 Force-Deflection cycles of Tall Pier for various level
of testing – non-isolated bridge 169
Figure 7.31 Force-Deflection cycles of Short Pier for various
level of testing – non-isolated bridge 169
Figure 7.32 Hysteretic cycles of numerical piers – 200% ULS 169 Figure 7.33 Force-Deflection cycle of Pier 9 during tests k07 and
l01 (SLS PGA=100%) 170
Figure 7.34 Force-Deflection cycle of Pier 11 during tests k07
and l01 (SLS PGA=100%) 170
Figure 7.35 Shear Deformation in the lower transverse beam of
pier 11 during tests k07 and l01 (SLS PGA=100%) 171 Figure 7.36 Curvature at the bottom section of left column of pier
11 during tests k07 and l01 (SLS PGA=100%) 171
Figure 7.37 Hysteretic cycles of all piers for isolated and
non-isolated bridge 100% ULS 171
Figure 7.38 Force-Deflection cycle of Pier 9 during tests r01, r02
and r03 (ULS PGA=65%, 80% and 90%) 172
Figure 7.39 Force-Deflection cycle of Pier 11 during tests r01, r02
and r03 (ULS PGA=65%, 80% and 90%) 172
Figure 7.40 Numerical hysteretic cycles of all piers for isolated
List of Tables
Table 3.1 Deck characteristics 35
Table 3.2 Vertical loads 40
Table 4.1 Masses of the bridge 50
Table 4.2 Mass at each node in all piers 51
Table 4.3 Parameters used in concrete and steel constitutive laws 53 Table 5.1 Periods and participating mass of pier 9 72 Table 5.2 Eigenvalues and excited masses of Rio-Torto viaduct 75 Table 5.3 Comparison between modal analysis with and w/o the
piers’ masses 79
Table 5.4 Drift for the observed damage in the transverse beam of
pier #12 88
Table 5.5 Eigenvalues and excited masses of Rio-Torto viaduct -
Opensees 95
Table 6.1 Scale factors used in PsD test 119
Table 6.2 Gravity load on the Pier 9 by different elements 125 Table 6.3 Gravity load on the Pier 11 by different elements 126
Table 6.4 LVDT sensors table for pier 9 141
Table 6.5 LVDT sensors table for pier 11 143
Table 7.1 List of significant tests performed during the RETRO
test campaign 149
Table 7.2 Results of the static characterization of specimens 158 Table 7.3 Geometric stiffness applied at piers 159
List of Symbols
Compressive concrete stress
Compressive strength (peak stress) of confined concrete Compressive strength of unconfined concrete
εc Longitudinal concrete strain
εco Strain for unconfined concrete
εcc Strain at maximum concrete stress
Initial modulus of elasticity of concrete
Secant modulus of elasticity of concrete at peak stress f Friction coefficient of the Isolator
R FP device curvature radius
iso Sliding displacement in the isolator Tensile strength of the concrete
Ac Cross section area of Concrete
Asw Stirrups area
fy Steel strength
D Distance between rebars at the top and bottom of the section
Asp Area of inclined rebars
P Normal force
Keff Effective stiffness of the isolator
Teff Effective period of the isolator
KGeom Geometric stiffness of the scaled model Curvature
1. INTRODUCTION
1.1. Background and Motivation
The seismic vulnerability assessment of existing and new lifeline systems, especially transportation systems, is becoming of paramount importance in resilient social communities. Bridge systems and highways are primary elements that can be utilized for rescue operations in the aftermath of moderate-to-major earthquake ground motions. Most of today’s existing transportation systems in Europe were built chiefly in the late 60s and early 70s and were designed primarily for gravity loads. As a result, such systems do not employ seismic details and hence their structural performance is inadequate under earthquake ground motions.
Recently, a comprehensive research program (Reluis DCP 2005-2008 – Research Thrust 3 –Prof. P.E. Pinto and G. Mancini) was initiated in Italy to formulate pre-normative European guidelines for the assessment of existing bridges. This novel program was motivated by the urgent needs to assess the seismic vulnerability and retrofit of existing bridge structures. The outcomes of the aforementioned research are summarized by Pinto & Mancini (2009). However, a number of design issues require further developments. The implementation of comprehensive guidelines for the seismic assessment and retrofit of existing bridges is time consuming, as it requires the thorough understating of complex local and global response mechanisms. Full scale testing programs should be employed to validate provisional models and to assess their reliability for parametric analyses. In the US it took more than ten years, dating back to the failures of modern bridges during the San Fernando (1971) earthquake, for the Federal Highway Administration (FHWA) to issue the “Retrofitting guidelines for Highway Bridges” (FHWA-ATC, 1983).
Since 1992, a refined research program funded by FHWA has been undertaken in the US to investigate a number of topics related to the seismic assessment and retrofit of bridges (FHWA 1995, FHWA-MCEER 2005). The European standards, i.e. Eurocodes, include a document for the seismic design of new bridges, namely Eurocode 8 Part 2. Part 3 of Eurocode 8 addresses existing buildings, but there is no part of Eurocode 8 covering existing bridges.
The assessment of the seismic vulnerability of existing bridges is a complex process. The assessment scheme requires a comprehensive dataset, which is often unavailable due to the lack of information, especially for reinforced concrete structures (adequate knowledge of the mechanical and geometrical characteristics of the structure and materials, information on structural modification occurred during the life of the bridge, a reliable estimation of the gravity load, etc.). These difficulties affect detrimentally the seismic response evaluation, and as a result, the structural vulnerability cannot be reliably estimated.
The evaluation of the expected seismic response of bridge structures is influenced by several uncertainties relative to mechanisms characterizing the post-elastic structural response. As a result, the effective use of methods and processing tools employing nonlinear analyses is often prohibitive and/or misleading. Nevertheless, non-linear procedures are becoming popular in the frameworks of structural assessment, thus, there is a need to accurately model the dissipative zones to provide reliable indications about the performance of the structure. In addition, the steel reinforcement of old constructions was comprised mainly by smooth steel bars. The influence of such bars in the response of the structure, especially their bond and anchorage mechanisms, has not been adequately investigated (both numerically and experimentally) in the past. Existing formulations simulating the behaviour of smooth bars and their anchorage shows that the existing experimental tests appear old and not comprehensive. Conversely, in recent years, this problem has been reconsidered and a systematic approach to the study of bond-slip and
anchorage efficiency of plain steel bars has been adopted (Fabbrocino et al. 2005, Feldman & Bartlett, 2005).
Another interesting issue is the rehabilitation of old bridges using innovative techniques. Seismic isolation is an effective way to reduce the response of bridges designed for vertical loads only. This technique, widely studied in the past, has been marginally investigated concerning its effectiveness on old bridges. In addition, further comparative analyses, numerical and experimental, are needed to better understand the performance of different isolation systems (Makris & Chang, 2000 Change et al. 2002).
Finally, the introduction of innovative retrofitting schemes, e.g. based on active/passive control technologies and application of FRPs in critical regions, call for models with predictive capacity. To do so, structural identification and monitoring are expected to play an important role. Considering that only a limited number of dynamic features of an existing bridge can be extracted from experimental modal analysis (Sohan et al. 2002), new non-linear identification techniques should be developed and tested in the future to capture the global dynamic response at the ultimate limit states (Bursi et al. 2009).
In view of the strategic nature of transportation infrastructures a further thorough study is becoming urgent and is deemed necessary. Towards this end, experimental test programs are vital to characterize the quality and quantity of typical structural systems (Verderame et al. 2009a-b, Marefat et al. 2009). Furthermore, a scarce experimental activity on old reinforced concrete structures renders this topic crucial for future assessment guidelines (Paolacci & Giannini, 2012, Arani et al. 2013). As a result, the state of the art on seismic assessment and retrofit of old bridges requires further advancement.
1.2. Objectives and Scope
According to the previous motivation and background, it is possible to conclude the aim of this study by investigating the seismic behaviour of existing reinforced concrete (RC) bridges and the effectiveness of innovative retrofitting systems. The research program focuses on old bridges, not properly designed for seismic action. In particular, the seismic vulnerability of an old Italian viaduct (Rio-Torto) with portal frame piers is evaluated. A proper isolation system has been designed using Slide Spherical Bearings. The non-linear response of the case study in “as-built” and “isolated” configurations has been tested through an experimental test campaign considering two prototype piers.
The experimental test campaign described herein follows a previous experimental campaign consisting of cyclically imposed displacements on 1:4 reduced scale models of a reinforced concrete portal frame pier, belonging to a typical old highway viaduct. In particular, two specimens (scale 1:2.5), a 2-level and a 3-level one-bay reinforced concrete frame, were constructed and tested using the pseudoDynamic (PsD) technique with sub-structuring, including the modelling of the entire viaduct. During the test, different configurations were considered, namely the retrofitted viaduct using Friction Pendulum Bearings and the “as-built” viaduct.
The main goals of the thesis are:
1) Increase the knowledge on the non-linear behaviour of portal frame piers in presence of plain steel bars for which few studies have been carried out.
2) Employment of large-scale experimental tests for the seismic assessment of existing bridges.
3) Study of the effectiveness of traditional and innovative seismic isolation systems (FP isolators).
1.3. Thesis Structure
This research is presented in 8 chapters as the follows:
Chapter 1 gives a background introduction about the motivations and scope of the research study. The seismic assessment state-of-the-art of existing bridges presented and the need of deep investigation regarding to a normative criteria discussed.
Chapter 2 shows the literature review about the seismic assessment of existing bridges by underlining the difference between existing and new structures and outlining the uncertainties difficulties of the existing bridges aspects. An overview on the national and international codes has been discussed.
In Chapter 3, the description of the case study “Rio-Torto” bridge has been presented. In particular, it comprises a description of the geometrical characteristics, material properties investigation and reinforcing steel bars. In addition, a brief study on the soil properties, seismogenic zone response spectra have been provided.
Chapter 4 presents the numerical modelling of Rio-Torto bridge procedure. The non-linear model simulation has been performed using Midas Gen and OpenSEES softwar. Firstly, The preliminary non-linear model including only the flexural behaviour of the bridge has been analysed using Midas Gen. Then, a refined model comprising the local behaviour of the elements (bond-slip of plain bars, nonlinear shear behaviour of transverse beams) has been built for both “as-built” and “isolated” cases using OpenSEES framework.
Chapter 5 analyses the seismic response of Rio-Torto Bridge through numerical simulations. A preliminary simulation of the seismic behaviour of the bridge in linear and non-linear field using simplified models was useful to provide a more clear view for the plan strategy of the
experimental campaign and the selection of the pier frames to be tested. The main non-linear analysis simulating the entire bridge at this stage is modal analysis and response spectrum analysis. Further, a focus analysis on piers under investigation “Pier 9 and 11” has been provided; specifically, static cyclic and dynamic analysis to give more confident response behaviour. Then, this chapter discusses the numerical analysis of the refined non-linear model using OpenSEES. Attention was paid on both “as-built” and “isolated” configurations, including the identification of input signals for both Serviceability and Ultimate Limit States.
Chapter 6 deals with the design aspects of the mock-ups piers. After a brief introduction on scaling problems and design criteria of isolators, the criterion and design of Pseudodynamic test setting up and instrumentations have been provided.
Chapter 7 discusses the experimental PsD tests and results of RETRO project campaign, starting from identifying the cyclic response of isolators. Then the results of the several seismic tests on isolated and non- isolated configuration are described and observations on global and local behaviour of the viaduct have been reported for each level of damage. Finally, comparisons of the different test results have been shown.
Chapter 8 reviews the conclusions of this study and outlines the orientation of future work.
2. LITERATURE
REVIEW
OF
THE
ASSESSMENT
OF
EXISTING BRIDGES
2.1. Introduction
The evaluation of the seismic vulnerability of an existing structure, and in particular for R.C. structure, is very different from that of a new structure, for several reasons:
The geometrical characteristics are usually unknown due to lacking of design information (drawings, etc..)
Inadequate knowledge of the mechanical characteristics of structure and materials.
The design details, for example of the reinforcing bars placement, are very uncertain.
A difficult and reliable estimation of the gravity loads.
Lack of information about any structural modification occurred during the life of the bridge.
These difficulties have an important consequence: the practical difficulties to estimate the seismic vulnerability of such kind of structures. The evaluation of the expected seismic response of the bridge structures is conditioned by many uncertainties about the main mechanisms which characterize the post-elastic response.
An effective utilization of methods and calculus instruments which imply non-linear analysis are difficult.
Because non-linear analysis is becoming a popular analysis method, there is the necessity of correctly model the plasticization zones providing reliable indications about the performance required to the structure.
In addition, the steel reinforcement of old constructions was often realized with plain steel bars, whose behaviour, especially regarding bond and anchorage, has not been widely investigated in the past.
The evaluation of the risk associated to the seismic vulnerability of the transportation infrastructure, and in particular to that of bridge structures has been the object of quite large number of researches. This has not been enough to stimulate the authorities to think about a code dedicated to the assessment of existing bridges. For the R.C. bridges in Italy, this is due to two main reasons:
After the Friuli Earthquake (1976), limited damages have been observed in the bridges.
After the Irpinia Earthquake (1980), the bridges on the Highway A16 suffered some damages, essentially due to inadequacy of the bearing devices, which has been changed with isolation devices The delay in adopting specific technical codes for the assessment of the seismic risk of existing bridges is not only an Italian characteristic but it was all over the world. For example, in USA the first technical document on this subject was published by the Federal High Way Administration (FHWA), only after 24 years from the San Fernando earthquake (Fig 2.1), in spite of its inadequacy which was shown during the subsequent Earthquake of Loma Prieta (1989) (Fig. 2.2).
Figure 2.1 San Fernando Earthquake 1971
Figure 2.2 Loma Prieta Earthquake 1989 - Cypress viaduct
Even in Japan, usually considered a front-line country for what concerns the seismic problems, suffered very serious damages such as the damage happened during Kobe earthquake 1995 (Fig. 2.3).
Figure 2.3 Nishinomiya - Kobe Earthquake 1995
2.2. Typical seismic damages of bridges
Earthquakes cause damage to all structures, including bridges. Major earthquakes can bring about the collapse of dozens of buildings, but collapsed bridges are often the most visible signs of the havoc an earthquake can wreak. In general, the main reason of seismic damage could be due to insufficient seismic detailing which cause significant damage in the deck or columns or both of them.
Large sections of roadway may consist entirely of viaduct, sections with no connection to the earth other than through vertical columns. When concrete columns are used, the detailing is critical. Typical failure may be in the toppling of a row of columns due either to soil connection failure or to insufficient cylindrical wrapping with rebar. Both failures were seen in the 1995 Great Hanshin earthquake in Kobe, Japan (Fig. 2.4), where an entire viaduct, centrally supported by a single row of large columns, was laid down to one side.
In fact, ten spans of the Hanshin Expressway in three distinct location in Kobe and Nishinomiya were completely topples over, blocking a key link that carried 40% of two important cites “Oska-Kobe” road traffic. About
half of the elevated expressway’s piers were damaged in some way, and the entire route stayed closed for 19 month.
Figure 2.4 Hanshin Expressway damage, Kobe, Japan (1995)
Sometimes viaducts may fail in the connections between components. This was seen in the failure of the Cypress Freeway in Oakland, California, during the Loma Prieta earthquake (Fig. 2.5). This viaduct was a two-level structure, and the upper portions of the columns were not well connected to the lower portions that supported the lower level; this caused the upper deck to collapse upon the lower deck.
Another example for deck damage is the East Bay Bridge in The Loma Prieta earthquake 1989 (Fig. 2.6). A 76-by-50-foot section of the upper deck on the eastern cantilever side fell onto the deck below. The quake caused the Oakland side of the bridge to shift 7 inches to the east, and caused the bolts of one section to shear off, sending the 250-short-ton section of roadbed crashing down like a house of cards. Immediately after Loma Prieta, the bridge was closed for a month as construction crews made repairs.
Figure 2.5 Cypress Freeway Viaduct collapse
Figure 2.6 East Bay Bridge Loma Prieta, 1989
Another important failure could happen is due to column piers. The damages of the piers are often due to the lack of ductility and/or shear strength of the sections like Gothic Avenue Viaduct in Northdridge Earthquake 1994 (Fig. 2.7).
Figure 2.7 Gothic Avenue Viaduct, Northdridge 1994
Wishi Bridge also suffered the same shear failure of piers in Chi-Chi Earthquake 1999. It has 18 spans with a total length of 624.5 meters. This bridge is two parallel structures that were constructed during two different periods. The superstructure of the northbound bridge was constructed in 1981, but it used the original substructure (pier-wall type) that was constructed in the 1950s. The southbound bridge was completed in 1983. Both structures use PCI girders in their simply supported superstructures, and both have pier-wall-type substructures. The fault rupture occurred behind and under the northern abutments of both bridges. Although the two bridges suffered similar ground motions, they failed in different ways. The first and second spans of the older bridge (northbound) collapsed. This failure was due to the fault rupture, which caused a large ground movement, pushing the superstructure back and forth until it fell down from the "seats" atop the piers.
The bearings also failed due to large compression forces. The third pier of the northbound bridge was uplifted also. Both superstructures may have collided during the earthquake, causing some damage to the substructures. The piers of the northbound bridge suffered tension cracking and fractured, and the southbound bridge piers had severe shear cracks and failures (Fig. 2.8).
Figure 2.8 Wushi viaduct Chi-Chi, Taiwan 1999
The viaduct or the failure of the nodes of frame piers is also spreads in RC frame piers bridges due to inadequate seismic details of the connections such as in Shinkansen Viaduct, Kobe, 1995 (Fig 2.9).
2.3. National and International codes
Starting from the year 1992 a vast research program has been undertaken in the US (funded by the FHWA) to study several aspects related to the seismic assessment and retrofit of bridges.
The products of the above research are:
Seismic Retrofit Manual for Highway Bridges” (FHWA, 1995). Seismic Retrofitting Manual for Highway Structures: Part 1 Bridges”
(FHWA- MCEER, 2005).
“Seismic Retrofitting Manual for Highway Structures: Part 2 Retaining structures, Slopes, Tunnels, Culverts and Roadways” (FHWA- MCEER, 2005).
In Europe the Eurocodes system includes a normative document for the seismic design of new bridges, which is at least partially based on the recent concepts of performance-based design: Eurocode 8 Part 2. For the existing structures, there is the Eurocode 8 part 3 that regards only existing buildings.
In Italy there are two main documents regarding existing buildings OPCM 3441 and NTC 2008. But there is nothing regarding existing bridges.
Within a wide research program funded by RELUIS and in particular from the research line 3 (existing bridges) new guidelines of existing bridges has been proposed.
2.4. Performance-Based Earthquake Engineering
Traditional design practice (code-based design) focuses on limiting displacements and forces to the levels indicated in codes. This is easy to understand for engineers and leads to straightforward design methods. This is the so called prescriptive approach. However, other stakeholders
(owner, architects, etc..) of the design process may not be familiar with these engineering measurements and this makes it hard to communicate to them the quality of the designed structure.
Earthquake engineering practice is undergoing drastic changes triggered by a variety of reasons. (knowledge about earthquake occurrences, ground motion, structural response characteristics..). It is widely acknowledged that seismic design should explicitly considers multiple performance objectives. There is a minimum level of required protection by society in order to safeguard adequately against partial collapse that could have series consequences on human lives (OLD). But there are other responsibilities in addition to life safety, including continuing operation of critical facilities, protection against the discharge of hazardous materials, and protection against excessive damage that may have important consequences for society on a local, regional, national, or international level.
Performance-based earthquake engineering (PBEE) is a new design approach that implies design, evaluation, and construction of engineered facilities whose performance under common and extreme loads responds to the several needs and objectives of owners, users and society. PBEE is based on the principle that performance can be predicted and evaluated with quantifiable confidence in order to make, together with the costumer, intelligent and informed trade-offs based on life-cycle considerations, rather than construction costs alone (Zarieian & Krawinkler 2006).
When a Performance-Based Design is carried out, the engineer will be able to communicate with the stakeholders in terms they understand clearly, such as the expected annual costs of repair or the annual saving that would result from using a given retrofit strategy (Fig. 2.10).
Figure 2.10 Total life-cycle cost curve
Performance objectives are quantified usually based on life-cycle cost considerations, which include various parameters affecting structural performance, such as, structural, non-structural or contents damage, and human casualties.
To guarantee a reliable confidence in predicting the performances of a structure, a probabilistic approach to the problem is required. So far, the uncertainties have been taken into account explicitly by partial safety coefficients and implicitly with a general conservative approach to design structures (for example, models for the cross-sectional capacity of reinforced concrete members have traditionally a conservative bias to account for unavoidable model uncertainty: the plane section hypothesis).
Moreover a cost-benefit is not usually accounted. For these reasons a great effort has been made in the past in defining a new design philosophy able to take into account all the uncertainties.
2.5. Code and Standards for PBEE
One of the guidelines that studying the PBEE is the NEHRP Guidelines and Commentary for Seismic Rehabilitation of Buildings (FEMA Publication 273, 1997) which has been funded in the 1990’s by Federal Emergency Management Agency (FEMA), the Applied Technology Council (ATC) and Building Seismic Safety Council (BSSC).
This development effort marked a major milestone in the evolution of performance-based seismic design procedures and articulated several important earthquake-related concepts essential to a performance-based procedure. The key concept was the definition of performance objectives, consisting of the specification of the design event (earthquake hazard), which the building is to be designed to resist, and a permissible level of damage (performance level).
Another important feature was the introduction of standard performance levels, which quantified levels of structural and nonstructural damage, based on values of standard structural response parameters.
Performance levels are defined in terms of global performance, as global displacements (e.g. roof displacements). These levels are associated to a certain probability of occurrence of the seismic action (Fig. 2.11).
Figure 2.11 Damage states at different qualitative performance levels
Another projects extended the method developed in FEMA-273/274. In particular: ATC-40, Methodology for Evaluation and Upgrade of Concrete Buildings and Vision-2000 Framework for Performance-based Seismic Design Project (Fig. 2.12).
These technologies were further refined by the American Society of Civil Engineers in their conversion of the FEMA-273/274 reports into the Pre-standard for Seismic Rehabilitation of Buildings, the well known FEMA-356.
Together, the FEMA-356, ATC-40, and Vision-2000 documents define the current state of practice of the First-Generation Performance-Based Seismic Engineering (FG-PBEE). It is clear that this approach in essentially deterministic and by the time it becomes implemented in most of the codes and standards such as (EN1998 – NTC2008).
Figure 2.12 Building performance levels in Vision 2000 performance
The recognized randomness of the several variables included in the Performed-based Earthquake Engineering approach has induced the scientific community to develop a full- probabilistic version of PBEE, the so called Next-generation PBEE. For this reason FEMA sponsored a large project (widely known as the SAC Steel Project) to develop seismic evaluation and design criteria for that class of buildings. Key products of the project included a series of recommended design criteria documents included probabilistic nature of the problem (FEMA-350)
FEMA has also contracted with the Applied Technology Council (ATC) to develop a next generation of performance-based seismic design guidelines for buildings, a project known as ATC-58. Although focused primarily on design to resist earthquake effects, the next generation
performance guidelines will be compatible with performance-based procedures being developed at this time for other hazards including fire and blast.
The philosophy of FEMA-58 has been fully-implemented in the PEER approach (Pacific Earthquake Engineering Research Center). The procedure provide the mean rate of exceeding (probability of occurrence in a given time) of a so called Decision Variable (DV). An example of a DV for building evaluation is mean annual loss, for bridges the critical DV is the likelihood of closure of the facility (Fig. 2.13).
Figure 2.13 Decision making for building evaluation depending on Decision Variable
In this approach all the randomness are taken into account:
Randomness of seismic input (Hazard Analysis)
Randomness of structural response (Structural Analysis) Randomness of the Structural Capacity (Damage Analysis) Randomness of objective function (Loss analysis)
2.6. Description of RETRO project
This thesis study focuses on the non-linear numerical modelling and seismic response analysis of the existing RC bridges in order to increase the knowledge of Assessment of existing RC bridges. For this reason it comes as part of RETRO project briefly described in this section.
RETRO project is a new experimental campaign that studies the “Assessment of the seismic vulnerability of an old R.c viaduct with frame piers and study of the Effectiveness of different isolation systems through Pseudodynamic Test on a laRge scale mOdel”. This project comes because of the urgent need to investigate the seismic behaviour of old RC bridge widespread in Italy.
The project is funded by the Seismic Engineering Research Infrastructure for European Synergies “SERIES”, where the experimental activates have been performed in the European Laboratory for Structural Assessment “ELSA” at the Joint Research Center “JRC” in Ispra, Italy
(http://www.series.upatras.gr). RETRO project extended from 2010 to
2013 and six universities have been involved:
University Roma Tre University of Patras
University of Naples and Sannio Politecnico di Torino
Univertsity of Bogazici ALGA Spa Milan
In the aforementioned project, a case study bridge with frame piers “Rio-Torto Bridge” has been chosen to be studied because of its high seismic vulnerability. In particular, two specimens of scale 1:2.5 of frame piers belonging to a typical RC highway viaduct have been tested using the PseudoDynamic technique with sub-structuring, as shown in (Fig. 2.14).
The first specimen is a frame pier of 2 levels (height 5.8 m) and the second is frame pier of 3 levels (height 10.3 m).
Figure 2.14 RETRO project frame piers tested at ELSA
The objectives of the project are: increasing the knowledge on the non-linear behaviour of RC frame piers and studying the effectiveness of different seismic isolation systems. The strategic aim is to provide comprehensive guidelines for the seismic assessment and retrofit of existing bridges.
In more specific, the RETRO research activities aim to:
1. Improve the knowledge on the seismic behaviour of old bridges with frame piers and in particular:
a. Study of the local behaviours (bond-slip, strain-penetration effect, bars buckling, etc...), especially under cyclic loading. b. Assessment of the dynamic behaviour of an entire viaduct and
evaluation of the seismic vulnerability using PsD technique with sub-structuring.
c. Study of the reliability of existing models for the simulation of the seismic behaviour of this kind of bridges.
2. Analysis of the effectiveness of the seismic isolation systems for old bridges, and in particular:
a. Critical analysis of the proposed design methods of isolation systems already present in literature, especially under optimization and in presence of an asynchronous ground motion.
b. Proposal of an alternative design method based on the Performance Based Engineering and optimization concepts. c. Experimental evaluation of two isolation systems using PsD
technique with substructuring: Spherical Sliding Bearings. d. Numerical simulation of the seismic response of the tested
bridge with and without isolation systems.
e. Numerical experimental comparison of the effectiveness of the isolation systems.
2.7. ReLUIS campaign analysis and testing (2005-2008)
RETRO project was proposed in the light of the results of a comprehensive research program (Reluis DCP 2005 - 2008) that was initiated in Italy to formulate pre-normative European guidelines for the assessment of existing bridges. This work was devoted to experimental activities on large-scale models of portal frame bridge piers, highly vulnerable to seismic action (Paolacci & Giannini, 2011).
The tests conducted piers belong to “Rio-Torto”; an old Italian viaduct on the Florence-Bologna highway. The specimens used are three identical 1:4 one-bay two-floor reinforced concrete frames built using plain steel bars for pier 12. The selected scale, mainly mandated by the laboratory infrastructure, is compatible with the nonlinear phenomena expected in the analyzed pier.
2.7.1. Reluis Case study and specimens
The preliminary analysis on the dynamic behaviour for pier 12 shows a critical condition in terms of flexural and shear capacity of columns and transverse beam against earthquakes, thus making it particularly suitable for an experimental campaign. The pier has two columns of diameter D=120cm, with a longitudinal and transverse reinforcement consisting, respectively, of 16 plain steel bars 20mm and spiral stirrups 6mm with spacing s = 14 cm. The transverse beam has a rectangular section 40*130 cm with a symmetrical longitudinal reinforcement realized with 10 + 10 20mm, reduced in the middle of the beam to 6 + 6 20mm, and stirrups 8mm with variable spacing (s=10cm at nodes and s = 14 cm in the middle). The cap-beam presents a U-shaped section with top and bottom longitudinal reinforcement 4 24 + 8 20mm and stirrups 8mm with variable step.
The three 1:4 scale mock-up’s of pier 12 have been built to carry out quasi-static cyclic tests. Each pier is a reinforced concrete frame, 3.5m high, consisting of two circular columns of diameter D= 30 cm, a transverse beam with a rectangular section 10*32.5 cm placed at mid height (1.75 m), and finally an inverted U-shaped cap beam. The foundation is a rectangular beam with section 30*60 cm. The reinforcement details are shown in (Fig. 2.15).
Figure 2.15 Reinforcement layout and cross section of Pier 12 (dimensions in cm)
Non scaled concrete and steel reinforcing bars 6 and 2 were used to respect the similitude requirements (Krawinkler et al. 1988). Actually, while the similitude requirements for the flexural behaviour and the confinement were fully respected, for the shear this was not totally true, where the diameter of stirrups was slightly larger than the required one. For example, for the columns a diameter of 2mm was used in lieu of 1.64 mm. This acceptable approximation was dictated by the minimum diameter available on the market (2mm). Similar conclusions can be drawn for the transverse beam.
More delicate is the scaling effect on concrete–steel bond conditions. Past experimental tests have shown that the scaling may have a relevant influence on the bond of deformed bars, especially in terms of slippage and cracks propagation (Ichinose & Kanayamab, 2004). In the case of plain steel bars, its influence can be still considered significant (Bazant & Sener, 1988, Pinto & Mancini, 2009), but because the experimental evidence has proved that in this case the anchorage effect of hooks
prevails (Fabbrocino & Verderame, 2005), the simple geometrical scaling can be accepted.
As far as the experimental test of the mock-up is concerned, horizontal displacement imposed at the top of the pier in quasi-static manner has been applied using a 250-kN hydraulic actuator in displacement control. The foundation of the mock-up is anchored to the laboratory base concrete slab using anchor bars (Fig. 2.16).
Figure 2.16 Pier 12 experimental test setup
Vertical loads are simulated by prestressing forces applied to the columns using 24mm Dywidag bars and measured by two 500 kN load cells. Because in the last two tests a greater number of channels were available, a larger number of sensors were used. In particular, a net of sensors was placed on the transverse beam to measure the eventual shear cracking
width. The complete scheme of the sensors for the specimens #2 and #3 is shown in (Fig. 2.17).
The displacements along the height and the horizontal force applied at the top were measured using draw wire transducers (Fig. 2.17a) and a 250-kN load cell, respectively, whereas the mean curvature at the columns and beam edges was monitored using pairs of longitudinal linear potentiometers with lengths B1 and B2, equal to 30 cm (Fig. 2.17b).
Figure 2.17 (a) Linear potentiometer at a beam–column joint and, (b) linear potentiometer at a column base
2.7.2 Reluis campgin results
The experimental test on the piers consists of displacements cyclically imposed at the top of the specimen. The time-history of the displacements is shown in (Fig. 2.18a). The amplitude of the cycles varies from 0.1mm to 60 mm, and for each amplitude three cycles of displacements have been imposed, for a total number of 52 cycles. The frequency of the applied signal is equal to 0.05Hz to realize a quasi-static test. The dead load acting on the real scale pier is equal to 6600 kN; therefore, a vertical load of about 200 kN has been applied to each column using the prestressing system previously described (Pinto & Molina, 2003).
The dead loads were expected to be constant for simulating the effects of an earthquake, in case of the absence of the vertical component of the
acceleration. Actually, because of an inaccurate control of the pressure in the actuators, the load cells have recorded a time-variable force, with the same frequency as the applied horizontal displacements (Fig. 2.18b). The two vertical forces are out of phase, showing an initial value of 200 kN and maximum and minimum equal to 260 kN and 190 kN, respectively.
Figure 2.18 (a) Time-history of the imposed displacements, (b) time-history of the vertical loads
The time-history is not symmetric and shows an increasing average value. The global cyclic behaviour measured in the experimental test during the first six cycles is, as expected, quite linear, even if a reduced dissipated energy, probably because of an initial settlement of the specimen, was observed. In Figures 2.19a and 2.19b the complete cyclic history of the three specimens is shown. Because the cycles are symmetric, only the behaviour for positive forces and displacements is commented. For
negative values similar conclusions may be drawn. As far as the shape of cycles is concerned, a marked pinching is observed, which shows that the behaviour is dominated by low dissipation mechanisms. For high values of displacements a decreasing of the global stiffness has also been observed, whereas, a limited degradation in terms of force has been identified for cycles with the same amplitude.
Figure 2.19 Force-deflection response: (a) specimens #1 and #2, (b) specimen #1 and #3