Chapter 5
Synthesis of Gallium(III) Pentacoordinated Complexes
5.1 Gallium pentacoordinated complexes with phenolsThe literature report pentacoordinated gallium(III) compounds, with the general formula Q’2GaL, obtained with two equivalent of 2‐methyl‐8‐
hydroxyquinoline (HQ’) and one equivalent of a monodentate ligand (HL) as phenols, carboxylic acids an halides.1‐6 The synthesis of new pentacoordinated
gallium complexes was performed adapting the method suggested by Sapochak
et al..1 Compounds of the general formula Q’2GaLn were obtained with two
equivalent of 2‐methyl‐8‐hydroxyquinoline and one equivalent of a monodentate ligand (HLn) as a phenol and its p‐substituted derivatives as p‐
cyanophenol and p‐nitrophenol (Figure 5.1). HO R R= ‐H ‐CN ‐NO2 HL1 HL2 HL3 Figure 5.1: p‐substituted phenols (HLn). In order to avoid the competitive formation of the hexacoordinated tris‐chelated GaQ’3 derivative, the phenol ligands were activated by sodium hydroxide in
containing gallium(III) nitrate hydrate salt dissolved in a considerable amount of water to control the reaction mixture acidity. N O Ga O N O R Qʹ2GaOC6H5 Qʹ2GaOC6H4NO2 Qʹ2GaOC6H4CN Ga(NO3)3 nH2O HL1 phenol R= ‐H p‐cyanophenol ‐CN p‐nitrophenol ‐NO2 HQʹ = 2‐methyl‐8‐hydroxyquinoline NaOH, Ethanol . HLn HQ' Ethanol, ΔT 3 4 5 6 7 bʹ b a aʹ c HL2 HL3 Scheme 5.1: synthesis of bis(2‐methyl‐8‐hydroxyquinolinate) gallium(III) phenolate.
The desired compounds: Q’2GaOC6H5, Q’2GaOC6H4CN and Q’2GaOC6H4NO2;
were obtained as greenish yellow crystalline powders in relatively good overall yield. All compounds show high solubility in chloroform. The complexes were characterized by elemental analysis, IR, 1H NMR spectroscopy, X‐ray diffraction
on single crystal, differential scanning calorimetry (DSC) and cyclic voltammetry (CV). The infrared spectra show characteristic C−H stretching bands of the methyl group ranging from 3000 and 3100 cm‐1, further the typical
bands of the coordinated Q’ fragment in the 1610 ‐ 1110 cm‐1 range; in the case
of Q’2GaOC6H4CN the stretching band relative to the –CN group is observed at
2221 cm‐1, while for Q’2GaOC6H4NO2 the intense band at 1303 cm‐1 is ascribed
to the stretching of the –NO2 group. The 1H NMR spectra of all compounds,
collected in deuterated chloroform, are consistent with the proposed structures, revealing the magnetic equivalence of the two Q’ moieties with only one set of signals, slightly shifted to higher frequencies when the phenol ligand is p‐
substituted. The chemical shift of the Ha,a’ and Hb,b’ signals, corresponding to the
hydrogens of the phenol ring is weakly influenced by the presence of the gallium centre. In all cases a weak shield to lower frequencies can be observed with respect to the corresponding ligand. In Figure 5.2 are reported the 1H
NMR spectra of Q’2GaLn compounds.
Figure 5.2: 1H NMR of Q’2GaOC6H5, Q’2GaOC6H4CN and Q’2GaOC6H4NO2.
The redox potentials were measured versus ferrocene as internal references (Cp2Fe/Cp2Fe+) using tetrabutylammonium perfluorate (0.1M) as electrolyte in
dichloromethane‐acetonitrile (1:1) solutions. CV analyses showed no reduction H 3 H b,b’ H a, a’ H 5, 7, c H 4 H 6 Q’2GaOC6H5 (pp 7 2 7 0 6 8 6 6 6 4 6 2 7 4 7 6 7 8 8 0 8 2 (ppm) 7.2 7.0 6.8 6.6 6.4 7.4 7.6 7.8 8.0 8.2 H 4 H 6 H 3 H 7 o 5 H b,b’ H 5 o 7 H a,a’ Q’2GaOC6H4CN (ppm)7.4 7.2 7.0 6.8 6.6 6.4 7.6 7.8 8.0 8.2 8.4 H 4 H b,b’ H 6 H 3 H 7 o 5 H a,a’ H 5 o 7 Q’2GaOC6H4NO2
waves for all complexes inside the solvent window. Oxidation processes have been noticed as broad irreversible waves above 1300 mV. The non well‐defined irreversible oxidation waves and the precipitation at the Pt working electrode surface prevent further analysis. All microcrystalline complexes were thermally characterized by DSC analysis. In all cases the trace show only high melting peak values. The Figure 5.3 shows the behaviour of Q’2GaOC6H4CN. This
graph represent an example of the thermal behaviour of this series of compounds. So as can be observed any polymorphism depending on the temperature was noticed.
Figure 5.3: Q’2GaOC6H4CN DSC graph.
The possible generation of a glassy state is an interesting feature of these materials. Because of the morphological stability is one of the important requirements of the amorphous thin film in order to be exploited in OLED technologies. Further, the high melting point, above 250 °C, is another important requirement for this kind of applications due to the temperatures generated into the thin film, as Joule effect, during the current flow.
Stability tests were collected following the method described in Chapter 4. A dichloromethane solution, 1x10‐4 M, of Q’2GaLn compounds was dropped to a
cuvette containing cyclohexane. Then each of the thirty additions was followed by collection of absorption spectra. The ratio of the absorption maximum at 245
nm and at 260 nm, A245/A260, respectively, were plotted versus the timescale. Figure 5.4 report the absorption spectra and the A245/A260 ratio values. When the absorption band at 245 nm grows in intensity the A245/A260 ratio value increase. 240 250 260 270 280 290 0,0 0,2 0,4 0,6 0,8 1,0 1,2 1,4 1,6 1,8 2,0 2,2 2,4 2,6 Absor b anc e Wavelength/nm 0 5 10 15 20 25 30 35 40 0,0 0,2 0,4 0,6 0,8 1,0 Qʹ2GaOC6H4NO2 Qʹ2GaOC6H5 Qʹ2GaOC6H4CN A24 5 /A 260 t/min Figure 5.4: chemical stability in cyclohexane solvent.
The ratio value, in the case of Q’2GaOC6H5, achieve a maximum after twenty
added drops, then the ratio value start to decrease. This behaviour is due to the fact that the absorption band at 260 nm shows very high intensity, so after a certain number of added drops the concentration is to high to detect some change in the absorption profile. The plotted graphs report a stable chemical behaviour of Q’2GaOC6H4CN and Q’2GaOC6H4NO2, in the forced chemical
environment previously described, and a certain lability of Q’2GaOC6H5
compound.
5.1.1 Structural features of Q’2GaOC6H5, Q’2GaOC6H4CN and Q’2GaOC6H4NO2
Molecular structure of Q’2GaOC6H5, Q’2GaOC6H4CN and Q’2GaOC6H4NO2
complexes has been obtained through single crystal X‐ray diffraction analysis performed on good quality crystals obtained in all cases from slow diffusion of
n‐hexane in a chloroform solution. Complex Q’2GaOC6H5 is monoclinic,
crystallizing in the P21/c space group while both Q’2GaOC6H4CN and
Q’2GaOC6H4NO2 compounds crystallize in the triclinic space group P‐1 with
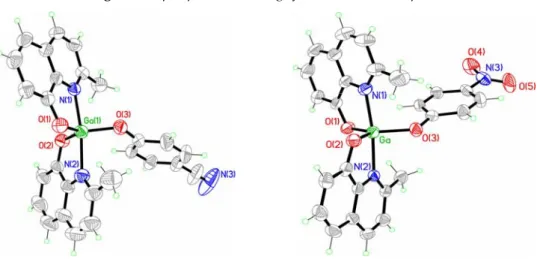
almost the same cell parameters. The perspective drawing of complex Q’2GaOC6H5 is illustrated in Figure 5.5 while those of complexes
Q’2GaOC6H4CN and Q’2GaOC6H4NO2 are reported in Figure 5.6.
Figure 5.5: perspective drawing of Q’2GaOC6H5 complex.
Figure 5.6: perspective drawing of Q’2GaOC6H4CN and Q’2GaOC6H4NO2 complexes.
The crystallographic data of all compounds are reported in the Table 5.1.
Q’2GaLn Q’2GaOC6H5, Q’2GaOC6H5, Q’2GaOC6H5,
fw 479.17 504.18 524.17
Crystal System monoclinic triclinic triclinic
space group P21/c P ‐1 P ‐1 a , Å 15.736(1) 9.199(2) 9.077(2) b , Å 10.9021(8) 9.670(2) 9.410(2) c , Å 13.209(1) 15.109(3) 15.134(3) α, deg 90 106.774(4) 105.23(3) β, deg 103.836(3) 91.538(4) 92.54(3) γ, deg 90 114.381(3) 113.09(3) V, Å3 2200.2(3) 1155.5(4) 1131.4(4) Z 4 2 2 D(calcd), g/cm3 1.447 1.449 1.539 μ, mm–1 1.281 1.225 1.261 temp, K 298 298 298 F(000) 984 516 536
θ(deg) 2.29 to 30.51 1.43 to 24.71 2.44 to 25.05
no. measured reflns 55913 10323 4286
no. unique reflns 6727 [R(int) = 0.0345] 3933 [R(int)= 0.0164] 4009 [R(int)= 0.0314]
reflns with I > θ(I) 4990 3628 3043 refined params 291 308 316 goodness‐of‐fit 1.026 1.109 1.035 R indices, a, b wR2= 0.0932 R1 = 0.0361, wR2= 0.0762 R1 = 0.0269, wR2= 0.1083 R1 = 0.0450, R indices (all data) R1 = 0.0544, wR2= 0.1052 R1 = 0.0291, wR2= 0.0798 R1 = 0.0603, wR2= 0.1124 a
R1 = Σ(|Fo| ‐ |Fc|)/Σ|Fo|. b wR2 = [Σw(Fo2 ‐ Fc2)2 /Σw(Fo2)2]1/2.
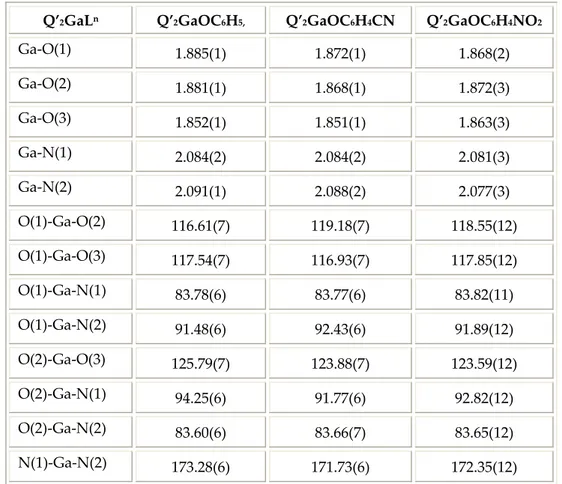
Table 5.2 report the selected bond distances and angles of Q’2GaLn complexes.
Q’2GaLn Q’2GaOC6H5, Q’2GaOC6H4CN Q’2GaOC6H4NO2
Ga‐O(1) 1.885(1) 1.872(1) 1.868(2) Ga‐O(2) 1.881(1) 1.868(1) 1.872(3) Ga‐O(3) 1.852(1) 1.851(1) 1.863(3) Ga‐N(1) 2.084(2) 2.084(2) 2.081(3) Ga‐N(2) 2.091(1) 2.088(2) 2.077(3) O(1)‐Ga‐O(2) 116.61(7) 119.18(7) 118.55(12) O(1)‐Ga‐O(3) 117.54(7) 116.93(7) 117.85(12) O(1)‐Ga‐N(1) 83.78(6) 83.77(6) 83.82(11) O(1)‐Ga‐N(2) 91.48(6) 92.43(6) 91.89(12) O(2)‐Ga‐O(3) 125.79(7) 123.88(7) 123.59(12) O(2)‐Ga‐N(1) 94.25(6) 91.77(6) 92.82(12) O(2)‐Ga‐N(2) 83.60(6) 83.66(7) 83.65(12) N(1)‐Ga‐N(2) 173.28(6) 171.73(6) 172.35(12) Table 5.2: selected bond distances (Å) and angles (°). The angles around the Ga(III) ion approximate a trigonal bipyramid geometry, with the two Q’ ligands in an N,N trans conformation (N−Ga−N angle ranges from 171.4 to 173.3°). The average Ga−O and Ga−N bond distances are of 1.87 and 2.09 Å.
Intermolecular π−π stacking and hydrogen bonds interactions are the most remarkable structural features of the Q’2GaLn solids. An examination of the
solid‐state packing of all phenolate complexes shows that there are close intermolecular π−π stacking interactions mainly between the pyridyl–pyridyl rings of neighbouring molecules. The π−π stacking parameters and the operation symmetry are summarized in Table 5.3.
Q’2GaLn [N(1)/C(9)]‐ [N(1)/C(9)] * [N(2)/C(19)]‐ [N(2)/C(19)] * [C(11)/C(16)]‐ [C(11)/C(16)] * C−H‐‐‐π Q’2GaOC6H5, d a = 3.47 Å, i S b = 1.24 Å, αc = 19.7° d = 3.46 Å, ii S = 0.92 Å, α = 14.9° D = 2.90 Å, v CPh−H‐‐‐X = 163.1° Q’2GaOC6H4CN d = 3.43 Å, iii S = 0.98 Å, α = 16.4° d = 3.55 Å, i S = 2.40 Å, α = 34.2° d = 3.65 Å, iv S = 0.57 Å, α = 8.90° D = 2.66 Å, i CPh−H‐‐‐X = 162.6° Q’2GaOC6H4NO2 d = 3.39 Å, iii S = 1.07 Å, α = 17.6° d = 3.459Å, i S = 2.22 Å, α = 31.7° d = 3.60 Å, iv S = 0.52 Å, α = 8.2° D = 2.69 Å, i CPh−H‐‐‐X = 158.7° a interplanar distance: distance between the ring planes; b horizontal displacement: distance between the ring normal and the centroid vector; c displacement angle: angle between the ring normal and the centroid vector; * symmetry codes: (i) 1–x, 2‐y, 1‐z; (ii) 2–x, 2‐y, 1‐z; (iii) 2–x, 2‐y, 2‐z; (iv) 1–x, 1‐y, 1‐z; (v) x, 1+y, z; Table 5.3: π−π stacking parameters of phenolate compounds. In all cases, both the Q’ ligands, nominally called the Q’A (the N(1) quinolinate) and the Q’B (the N(2) quinolinate) chelates, are involved in aromatic interactions
with the symmetrical related rings, while stacks with mixed chelates are not found. The primary motif between the planar aromatic units for both chelates is the offset face‐to‐face (OFF) type, with the distance between the mean planes passing through the rings involved in the stacking within the range 3.3–3.8 Å, generally accepted for the phenomenon of π–π stacking. Moreover, the phenol rings are involved in edge‐to‐face interactions (EF), often referred as C−H–π hydrogen bonds, being the aromatic ring H donor in the case of complex Q’2GaOC6H5 and H acceptor in both complexes Q’2GaOC6H4CN and
Q’2GaOC6H4NO2. While the Q’A–Q’A stacking is characterized by the same
parameters in the series this gallium compounds, the Q’B–Q’B aromatic
interaction differs from complex Q’2GaOC6H5 to complexes Q’2GaOC6H4CN
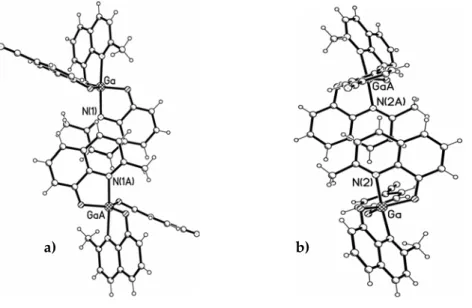
and Q’2GaOC6H4NO2. The orthogonal views of the QA’ (a) and the QB’ (b)
Figure 5.7: orthogonal view of QA’ (a) and QB’ (b) chelates stacking in Q’2GaOC6H5.
In fact, the Q’B–Q’B stacking in complex Q’2GaOC6H5 is characterized by a small
transverse offset (less than 1 Å), which causes a nearly complete facing of the overall aromatic system, involving the pyridyl‐fused phenolate rings in the same interaction as shown in Figure 5.7, drawing b. The crystal packing of complex Q’2GaOC6H5 reported in Figure 5.8 shows in (c) the C−H‐‐‐π hydrogen
bonds between raw of molecules and in the drawing (d) the generation of secondary repetition motifs. Figure 5.8: C−H‐‐‐π hydrogen bonds (c), secondary motif (d) of Q’2GaOC6H5. a) b) d) c)
As previously described each molecule of Q’2GaOC6H5 interacts with two
symmetrical related molecules through the Q’A and the Q’B chelates, generating
extended two‐dimensional chains illustrated in Figure 5.8, drawing c. Among chains, edge‐to‐face interactions occur between one hydrogen atom of the phenol ligand and the [C(1)/C(6)] aromatic ring of the Q’A chelate. Furthermore,
the secondary repetition motif recognizable is a combination of two OFF and two EF interactions in Figure 5.8, drawing d.
The orthogonal views of the QA’ (a) and the QB’ (b) chelates stacking of
Q’2GaOC6H4CN and Q’2GaOC6H4NO2 compounds, that can be considered
isostructural, are illustrated in Figure 5.9.
Figure 5.9: orthogonal view of chelates stacking in Q’2GaOC6H4CN or Q’2GaOC6H4NO2
The different offset in the OFF interactions between the Q’B chelates observed in
complexes Q’2GaOC6H4CN and Q’2GaOC6H4NO2 is such that each chelate
shows two contacts: a pyridyl–pyridyl [N(2)–C(19)] interaction, above the mean plane of the Q’B ligand, and a phenolate–phenolate [C(11)–C(16)] stacking
below it, with the generation of chains running approximately along the b axis as shown in Figure 5.9, drawing b and in Figure 5.10, drawing c, illustrating the crystal packing of complex Q’2GaOC6H4CN view down the a axis showing the
Q’B stacking contacts; while in the drawing (d) is showed the generation of chains running along the b axis . Figure 5.10: crystal packing of complex Q’2GaOC6H4CN. In both cases the presence of edge‐to‐face interactions involving the OC6H4CN and OC6H4NO2 rings, respectively, gives rise to a combination of three OFF and
two EF interactions as a supramolecular secondary motif, connecting three molecules together, Figure 5.10, drawing d.
These repetition units are linked between π−π interactions involving the Q’A
chelates of symmetrical molecules.
As a final confirmation of the lack of any polymorphism in the Ga(III) derivatives Q’2GaOC6H5, Q’2GaOC6H4CN and Q’2GaOC6H4NO2, X‐ray powder
diffraction analysis on the bulk sample showed it to be identical in all cases to the single crystal used for structure determination. c) d)
5.2 Pentacoordinated bimetallic complexes
The phenoxyde shows high reactivity towards gallium(III) as observed with the stable monometallic pentacoordinated compounds so the gallium coordination chemistry was studied related to the formation of bimetallic pentacoordinated compounds, in order to understand the chemical behaviour of gallium(III) metal in aqueous solutions with the contemporary presence of the strong chelating agent 2‐methyl‐8‐hydroxyquinoline and bisphenols ligands. Bidentate phenols ligands (HLn), illustrated in Figure 5.11, were chosen taking in account their chemical structure. (CH2)3 OH HO OH HO OH HO 4,4ʹ‐biphenol 2,2ʹ‐bis‐(4‐hydroxyphenyl)‐propane 4,4ʹ‐(1,4‐pheylenediisopropylidene)bis‐phenol HOC6H4(CH2)3C6H4OH HOC6H4C(CH3)2C6H4C(CH3)2C6H4OH HOC6H4(CH2)3C6H4OH HL4 HL5 HL6 Figure 5.11: bidentate phenol ligands (HLn). Thus, each ligand bear some structural characteristic:
4,4’‐biphenol HOC6H4C6H4OH (HL4), with two aromatics rings directly
covalently linked,
4,4’‐(1,4‐phenylenediisopropylidene)bis‐phenol,
HOC6H4C(CH3)2C6H4C(CH3)2C6H4OH, (HL5), in which the aromatics
2,2’‐bis‐(4‐hydroxyphenyl)‐propane HOC6H4(CH2)3C6H4OH, (HL6) with
the three methylene groups is an example of flexible ligand.
The synthesis of all compounds was performed as previously described for the monometallic compounds but with HQ’:Ga:HLn in 4:2:1 molar ratio (Scheme
5.2). The ligands were activated with sodium hydroxide in ethanol solution then slowly added to an aqueous solution of gallium(III) nitrate hydrate. Some minutes after the ethanolic solution of 2‐methyl‐8‐hydroxyquinoline was slowly added to the reaction mixture that was refluxed for six hours and under stirring overnight. nH2O Ga(NO3)3 N Ga N Ga N Qʹ2GaOC6H4C6H4OGaQʹ2 2‐methyl‐8‐hydroxyquinoline 2,2ʹ‐bis‐(4‐hydroxyphenyl)‐propane 4,4ʹ‐biphenol HLn HLn= HQʹ HQʹ= NaOH, Ethanol 4,4ʹ‐(1,4‐pheylenediisopropylidenene)bis‐phenol Ethanol, ΔT . N Scheme 5.2: synthetic procedure of bimetallic gallium complexes. The product were collected and washed with water ethanol and diethyl ether, to obtain solids at list 40% of reaction yields, which colour ranging from yellow to light green. But, because of the competitive formation of GaQ’3, which
presence was checked by 1H NMR analysis, only Q’2GaOC6H4C6H4OGaQ’2
compound was obtained with high purity confirmed by elemental analysis. The melting point wasn’t observed at temperature below 350°C. IR spectra show the methyl stretching around 3065 cm‐1 and the typical bands of the
chelated 2‐methyl‐8‐hydroxyquinoline in the range 1605 – 1100 cm‐1. 1H NMR
equivalent nd the Hb,b’ are shifted to high frequency respect to those of Q’2GaOC6H5. 5.3 Multimetallic Gallium (III) complexes Pentacoordinated bimetallic gallium(III) compounds, synthesised with the right phenol ligands, open the possibility to synthesis more complex chemical structures. The idea is to build a multimetallic compound bearing more than two Q’2Ga‐ fragments. In order to exploit the chemical affinity between phenols
with particular structural properties and gallium(III) [5,10,15,20‐tetrakis(4‐ hydroxyphenyl)‐21H,23H‐porphyrin], H2TPP(OH)4, reported in Figure 5.12, has
been selected to be tested in reactions for the synthesis of mixed metallic complexes. OH NH N HN N HO OH OH meso β H2TPP(OH)4 Figure 5.12: 5,10,15,20‐tetrakis(4‐hydroxyphenyl)‐21H,23H‐porphyrin H2TPP(OH)4 Porphyrin are rigid heteroaromatic macrocycles with an extended insaturation. These molecules are interesting because of the versatility of their chemical structure. Indeed, by introducing different chemical substituent on the β and/or
meso positions, it is possible to modulate both chemical and physical properties.
Further the centre of the heteroaromatic ring can host a metal cation with the suitable ionic radius.7‐9
Then H2TPP(OH)4, bearing in each meso position a phenol function and a metal
cation in the central cavity, can be complexed as a rigid aromatic ligand acting a linker between more than two Q’2Ga‐ fragments as illustrated in the Scheme 5.3.
Scheme 5.3: example of assemblated structure.
The synthesis of the desired heterobimetallic structure was performed in two steps. The aromatic ring centre of H2TPP(OH)4 was complexed with zinc acetate
dehydrate in 1:1 molar ratio as reported in Scheme 5.4.
H2TPP(OH)4 was solved under energetic stirring in tetrahydrofurane at room
temperature, then a methanolic solution of zinc acetate dihydrate was slowly
= OH N N N N HO M meso β
+
N N Ga O O = Q’2Ga‐ MTTP(OH)4added. Suddenly, the reaction mixture colour has changed from light violet to dark violet. The reaction mixture was allowed to stir over night. The solvent of the reaction mixture was dried by evaporation under vacuum and the dark violet solid was collected and washed many time with water and with a small amount of diethyl ether. OH N N N NH H HO OH OH CH3OH, THF, r. t. Zn Zn(CH3COO)2 2H2O OH N N N N HO OH OH β . H2TPP(OH)4 ZnTPP(OH)4 a aʹ b bʹ .2H 2O Scheme 5.4: synthesis of ZnTPP(OH)4∙ 2H2O.
The product, ZnTPP(OH)4, was obtained in very good yields at list 70 %. It
shows very high solubility in diethyl ether and in alcohols but is insoluble in chloroform, further it shows a weak hygroscopicity, so the compound was dried at 100°. The melting point wasn’t observed at temperature below 350°C. Elemental analysis confirm the purity of the compound. IR spectra show the broad band of the phenol chemical functions at 3306 cm‐1 and the CH stretching
of the aromatic ring around 2920 cm‐1. Narrow and intense bands were
observed in the range between 1607 – 998 cm‐1. 1H NMR spectra were collected
in methanol. As can be observed all protons are magnetically equivalent so the profile spectra shows one signal for each kind of proton. The four β protons are deshield at 8.86 ppm because of the extended conjugation of the aromatic rings. The phenol signals of Ha,a’ and Hb,b’ are found at 8.00 ppm and 7.18 ppm
The synthetic second step, to obtain the desired polymetallic compound, was performed following the procedure described for the monometallic gallium compounds previously illustrated.
ZnTPP(OH)4 was activated with NaOH, 1:4 molar ratio, then this suspension
was slowly added to an aqueous solution of gallium(III) nitrate hydrate. Successively an ethanolic solution of 2‐methyl‐8‐hydroxyquinoline was slowly added to the reaction mixture to obtain ZnTPP(OH)4:Ga:HQ’ in 1:4.5:8 molar
ratio as illustrated in the Scheme 5.5. After a six hours reflux and overnight stirring, a greenish blue solid was filtered. O N O N O N N N N N O Ga N O O O Ga Ga O O Zn Ga O ZnTPP(OGaQʹ2)4 Ga(NO3)3.nH2O ZnTPP(OH)4 .2H 2O HQʹ . 2H 2O Ethanol, ΔT NaOH, Ethanol Scheme 5.5: synthesis of ZnTPP(OGaQ’2)4.
The collected powder was washed with water, ethanol, and small amounts of diethyl ether and chloroform to obtain a blue solid in 70% of reaction yield. Melting point wasn’t observed at temperature below 350°C. The purity and the structure of ZnTPP(OGaQ’2)4 were confirmed by elemental analysis and by
typical band of the phenol hydroxyl group is disappeared. The presence of the chelated 2‐methyl‐8‐hydroxyquinoline is revealed in the range between 1601 cm‐1 and 1114 cm‐1. 1H NMR spectra were registered in deuterated methanol
and the presence of the Q’2Ga− fragment is showed by one set of signals as well
as the porphyrin moiety.
In order to study the reactivity of this kind of chemical systems, where one or more quinaldinate gallium fragment can be introduced on the periphery of the porphyrin moiety, other synthesis were performed with different ZnTPP(OH)4:Ga:HQ’ molar ratio as shown in the Scheme 5.6.
Scheme 5.6: possible assembled structures.
The synthesis of ZnTPP(OH)3(OGaQ΄2), ZnTPP(OH)2(OGaQ΄2)2, or
ZnTPP(OH)(OGaQ΄2)3 compounds were obtained following the same
procedure illustrated previously with ZnTPP(OH)4:Ga:HQ’ respectively in
1:1:2, 1:2:4 and 1:2:6 molar ratio. IR and 1H NMR analysis of all compounds
were in agreement with the proposed structure as shown in Figure 5.14, but wasn’t possible to distinguish if the resulting spectra were due to a single compound or to the contribution of a mixture of polymetallic species.10 or ZnTPP(OH)3(OGaQ’2) ZnTPP(OH)2(OGaQ’2)2 ZnTPP(OH)(OGaQ’2)3
Figure 5.13: typical 1H NMR profile of the polymetallic species.
The calculated values of the elemental analysis do not differentiate significantly the ZnTPP(OH)3(OGaQ΄2), ZnTPP(OH)2(OGaQ΄2)2, ZnTPP(OH)(OGaQ΄2)3,
ZnTPP(OGaQ΄2)4 species since the related C%, H% and N% values span the
ranges 64.27 − 66.10, 4.26 − 3.72 and 7.25 − 7.22 respectively. While the elemental analysis give experimental values which do not perfectly agree for a unique pure species. Because of the difficulty to study the real structures and the purity degree of these products, as previously mentioned, MALDI/TOFMS (matrix assisted laser desorption/ionization tandem time‐of‐flight mass spectrometry) analysis were carried out.
The TOF spectrum of species ZnTPP(OGaQ΄2)4 is compatible with that of a
mixture of compounds. In fact, it shows, besides the base peak at m/z 385, the species at m/z 740 that corresponds to the unreacted porphyrin (ZnTPP(OH)4)
and minor peaks at m/z 1124, 1508, 1892 and 2276 corresponding to ionized ZnTPP(OH)3(OGaQ’2), ZnTPP(OH)2(OGaQ’2)2, ZnTPP(OH)(OGaQ’2)3, and
ZnTPP(OGaQ’2)4, respectively.All these species behave similarly when allowed
to dissociate spontaneously, as shown by the corresponding MS/MS spectra. The ions at m/z 1892 and elemental composition [ZnTPP(OH)(OGaQ’2)3] afford, in fact, the species [ZnTPP(OGaQ’2)2 ‐ H]+ at m/z 1507, as shown in the expandex view of Figure 5.14, by homolysis of the O−Ga bond. (ppm) 6.8 7.0 7.2 7.4 7.6 7.8 8.0 8.2 8.4 8.6 8.8 9.0 9.2 9.4 Hβ H 4 H b,b’ H 3 H 6 H a,a’ and H 5 o 7 H 5 o 7
Figure 5.14: TOF/TOF spectrum of the m/z 1892‐1902 cluster.
In order to study these compounds, 2,7‐Dimeythoxynaphtalene (DMN) was tested and proposed11 as new matrix to analyse low molecular weight
complexes extremely labile species because of in the present study DMN has revealed the opportunity to use a softer methodology for this labile compounds sensible to the acidity of other typology of matrix.
With the experimental conditions described previously the main product is Ga4/Zn is very hard to purify properly so that, traces of the homologous
polymetallic species (Ga3/Zn, Ga2/Zn or Ga/Zn) which usually form together
with Ga4/Zn, cannot be effectively removed. Although the MALDI/TOFMS11
data do not allow a quantitative estimation of the relative abundance of the different polymetallic complexes, on the bases of both the reproducibility of the preparation and the values of the data were obtained, the ZnTPP(OH)(OGaQ΄2)3, ZnTPP(OH)2(OGaQ΄2)2 and ZnTPP(OH)3(OGaQ΄2)
species are present in traces only, and that these traces do not affect the results of the spectroscopic measurements.
5.3.1 Multimetallic gallium complexes: different synthetic pathway
A different synthetic pathway was explored in order to overcome the problematic results previously described. Because of the difficulties come from the incomplete complexation of the phenol chemical function in the peripheral porphyrin sites, the strategy was follow the inverse synthetic route, first, introducing the Q’2Ga− fragment then the zinc insertion in the porphyrinic core, adapting the usual synthesis, as illustrated in Scheme 5.7. O N O N O NH N HN N N O Ga N O O O Ga Ga O O Ga O H2TPP(OGaQʹ2)4 Ga(NO3)3.nH2O H2TPP(OH)4.2H2O .2H 2O CH3COONH4, Ethanol, ΔT NaOH, Ethanol HQʹ Scheme 5.7: synthesis of H2TPP(OGaQ’2)4.
The obtained product is a dark purple, insoluble solid in 42% reaction yield. Melting point wasn’t observed a temperature below 350°C. The elemental analysis confirm the purity of this compound and infrared spectra are consistent with the presence of quinolinate fragments, but because of the poor solubility of H2TPP(OGaQ’2)4, 1H NMR spectra wasn’t registered.
The solid was suspended in ethanol and a slightly excess of zinc acetate dihydrate was added (Scheme 5.8). H2TPP(OGaQʹ2)4
.
H2O (CH3COO)2Zn .2H2O Ethanol, ΔT ZnTPP(OGaQʹ2)4.
H2O Scheme 5.8: reaction with zinc acetate.A dark violet solid was obtained with a 50% of reaction yield. As expected, the melting point wasn’t observed, the infrared spectra are consistent with the presence on a chelated 2‐methyl‐8‐hydroxyquinoline and an intense band stretching at 997 cm‐1 could be associated to the metalation of the porphyrinic
core. Also in that case 1H NMR analyses were not allowed because of the poor
solubility. The last synthetic test was to introduce in the porphyrinic core a gallium atom to obtain an homopolymetallic compound the synthesis was carried out with H2TPP(OH)4:Ga:HQ’ in 1:5:8 molar ratio. After sixteen hours
under reflux, a small amount of litium chloride was added to induce metathesis on the axial position of the gallium in the porphyrinic core, as shown in the Scheme 5.9, the reaction mixture was allowed to stir for 24 hours under ambient temperature. O N O N O N N N N N O Ga N O O O Ga Ga O O Ga O ClGaTPP(OGaQʹ2)4 Ga(NO3)3.nH 2O H2TPP(OH)4.2H2O CH3COONH4, Ethanol, ΔT NaOH, Ethanol HQʹ LiCl Ga Li Scheme 5.9: synthesis of ClGaTPP(OGaQ’2)4.
A dark bluish violet powder was isolated with a good reaction yield. The elemental analysis are consistent with the compound purity. Unlikely the solid is insoluble, so 1H NMR wasn’t registered.
5.4 Gallium(III) pentacoordinated complexes with carboxylic acids
Gallium(III) pentacoordinated compounds obtained with HQ’:Ga in 2:1 molar ratio, and a third monodentate ligand (HL’n) chosen among mono and bidentate
carboxylic acid, p‐substituted benzoic acids derivatives, or halides, are known in literature. These compounds were studied for long of time only from the structural point of view to understand the gallium chemistry and the selective chelating properties of 2‐methyl‐8‐hydroxyquinoline and the high affinity of gallium(III) towards carboxylate. This class of pentacoordinate compounds has revealed interesting structural and chemical features. To improve these properties a series of new pentacoordinated gallium(III) complexes were synthesised choosing substituted benzoic acids and bidentate carboxylic acids.
5.4.1 monometallic gallium compounds with benzoic derivatives
The synthesis were performed adapting the synthetic protocol previously described. To achieve pentacoordination in the bischelated Q’2Ga− fragment, p‐
nitrobenzoic acid, p‐hexyloxybenzoic acid and p‐octyloxybenzoic, showed in Figure 5.15, were chosen as monodentate ligand HL’n. C R R= ‐NO2 ‐O(CH2)5CH3 ‐O(CH2)7CH3 O HO HLʹ1 HLʹ2 HLʹ3 Figure 5.15: p‐substituted benzoic ligands (HL’ n).
Scheme 5.10 report the reaction procedure to obtain the desired compounds Q’2GaOOCC6H4NO2 and Q’2GaOOCC6H4O(CH2)5CH3.
‐O(CH2)5CH3 ‐NO2 R = N O Ga N O Qʹ2GaOOCC6H4NO2 Qʹ2GaOOCC6H4O(CH2)5CH3 NaOH, Ethanol C O O Ga(NO3)3. nH2O HLʹ n = p‐nitrobenzoic acid p‐hexyloxybenzoic acid 2‐methyl‐8‐hydroxyquinoline HLʹ n HQʹ HQʹ= 3 4 5 6 7 Ethanol, ΔT R a bʹ b aʹ
Scheme 5.10: synthetic procedure of Q’2GaL’n p‐substituted benzoic acid.
All compounds were obtained as green microcrystalline powder with at list 50% of reaction yields. The purity and the structures were confirmed by elemental analysis and spectroscopic characterization.
The melting point of Q’2GaOOCC6H4NO2 compound was 267 − 270°C while
those of Q’2GaOOCC6H4O(CH2)5CH3 was 203 ‐ 205°C. The lowered melting
point of this last compound, respect to those typically showed by bisquinaldinate compounds, is probably due to the presence of the aliphatic chain. The structure is confirmed by the presence in the infrared spectra of the C−H stretching bands of the −CH3 group at 3051 cm‐1 for the p‐nitrobenzoic
derivative, and at 3065 cm‐1 for p‐hexyloxybenzoic derivative, further for this
last compounds intense bands in the 2951‐2870 cm‐1 range are attributed to the
C−H stretching of the aliphatic chain. The presence of the C=O group is revealed in an intense stretching band at 1660 cm‐1 in the spectra of
This band is shifted at 1650 cm‐1 in Q’2GaOOCC6H4O(CH2)5CH3 compound. The
bands in the range between 1606 cm‐1 and 1114 cm‐1 represent the chelated
quinolinate fragment in both compounds. The bisquinolinate fragment shows only one set of signals in the 1H NMR spectra registered in CDCl3. The Ha,a’ of p‐
nitro benzoic derivative is shifted about 1.40 ppm to high frequency respect to
those of Q’2GaOOCC6H4O(CH2)5CH3 compound, while Hb,b’ is slightly shifted to
high frequency. The presence of the aliphatic chain in of the p‐hexyloxy derivative compound is revealed by a sequence of signals at low frequencies. A different pathway was exploit to obtain pentacoordinated compounds.
So starting from the phenolate derivative complex Q’2GaOC6H5, the phenolate
ligand was substituted by the p‐octyloxybenzoate to obtain Q’2GaOOCC6H4O(CH2)7CH3 complex as showed in the reaction Scheme 5.11.
N O Ga O N O HLʹ3 = p‐octyloxybenzoic acid HL' n N O Ga N O C O O O Qʹ2GaOC6H4OC8H17 CHCl3, Ethanol, r.t.
Scheme 5.11: different synthetic procedure of Q’2GaL’n obtained with p‐octyloxybenzoic acid.
The p‐octyloxybenzoic ligand was activated with sodium hydroxide in ethanol and slowly added to a chloroform solution of Q’2GaOC6H5, in 10:1 molar ratio,
to obtain a green microcrystalline solid in 30% reaction yield.
The ligand substitution was confirmed by elemental analysis and by spectroscopy, as expected the melting point was lowered towards 185–187°C. The infrared spectra confirm the compound structure, with the stretching band
of the methyl group at 3057 cm‐1 and presence of the aliphatic chain is
evidenced by C−H stretching bands in the range 2924 – 2854 cm‐1.
The C=O stretching is found at 1642 cm‐1. The typical quinolinate bands profile
ranging from 1605 cm‐1 to 1115 cm‐1.
1H NMR spectra shows only one set of signals related to the magnetically
equivalent quinolinate moieties. The chemical shift of the Ha,a’ and Hb,b’ protons
are slightly shifted respectively to lower an higher frequencies respect to those of the free ligand. The aliphatic signals, found to low frequency, doesn’t show any change in the chemical shift respect to the unlinked ligand.
The high affinity between gallium and carboxylates is demonstrated with the previous substitution reaction. Further, always microcrystalline solids were obtained directly from the reaction mixture.
5.4.2 Chemical structure of Q’2GaOOCC6H4O(CH2)5CH3
The Q’2GaOOCC6H4O(CH2)5CH3 complexes was structurally characterized by
X‐ray diffraction analysis on single crystal. Good crystals were obtained from chloroform/n‐hexane mixture. The complex, which structure is shown in Figure 5.17, crystallize in the monocline P21/c space group with two molecules in the
asymmetric unit.
The coordination geometry around gallium atom is distorted trigonal bipyramid. The 2‐methyl‐8‐hydroxyquinolinate moieties are coordinated to gallium through oxygen and nitrogen atoms. So the coordination sphere is completed by one molecule of carboxylate through an oxygen atom. In the Table 5.4, the selected bond length and angles related to the coordination sphere are reported. Ga(1)‐O(1) 1.854(5) Ga(2)‐O(6) 1.835(6) Ga(1)‐O(2) 1.862(5) Ga(2)‐O(7) 1.839(6) Ga(1)‐O(3) 1.890(5) Ga(2)‐O(8) 1.853(7) Ga(1)‐N(1) 2.048(6) Ga(2)‐N(3) 2.033(7) Ga(1)‐N(2) 2.059(7) Ga(2)‐N(4) 2.069(7) O(1)‐Ga(1)‐O(2) 115.2(2) O(6)‐Ga(2)‐O(7) 105.6(3) O(1)‐Ga(1)‐O(3) 135.3(2) O(6)‐Ga(2)‐O(8) 121.3(3) O(1)‐Ga(1)‐O(3) 109.4(3) O(7)‐Ga(2)‐O(8) 133.1(3) O(1)‐Ga(1)‐N(1) 84.8(2) O(6)‐Ga(2)‐N(3) 83.0(3) O(2)‐Ga(1)‐N(1) 90.7(2) O(7)‐Ga(2)‐N(3) 94.6(3) O(3)‐Ga(1)‐N(1) 97.9(2) O(8)‐Ga(2)‐N(3) 89.9(3) O(1)‐Ga(1)‐N(2) 90.8(2) O(6)‐Ga(2)‐N(4) 92.8(3) O(2)‐Ga(1)‐N(2) 82.(2) O(7)‐Ga(2)‐N(4) 96.4(3) O(3)‐Ga(1)‐N(2) 91.6(2) O(8)‐Ga(2)‐N(4) 83.4(3) N(1)‐Ga(1)‐N(2) 169.9(2) N(3)‐Ga(2)‐N(4) 168.9(3) Ga(1)‐‐‐‐‐‐‐O(4) 2.692(3) Ga(2)‐‐‐‐‐‐‐O(9) 2.296(4)
Table 5.4: bond lenght (Å) and angles (°) of Q’2GaOOCC6H4O(CH2)5CH3.
As it is possible to observe, the geometry is greatly distorted by the presence of the chelating ligands, so the two nitrogen atom in apical position (N(1) and N(2) in the molecule 1; N(3) and N(4) in molecule 2) deviate strongly from linearity because of the N−Ga−N angle is 169.2(2) and 168.9(3)°, respectively, in the two
molecules. The bite angles related to the chelated five terms rings, GaNOCC, are 84.8(2) in the molecule 1, and 83.0(3) in the molecule 2; are similar to those observed in analogous gallium complexes.2 The two chelated five terms rings
GaNOCC in each molecules, are almost perpendicular each other, with
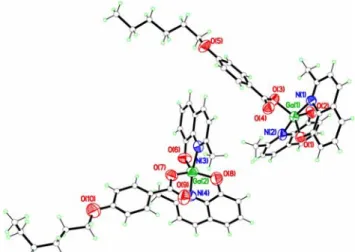
dihedral angles between the middle plain of 68° (molecule 1) and 59°(molecule 2). The crystal packing is characterized by two typology of intermolecular interactions: hydrogen bond and π−π stacking interactions.
Figure 5.17: crystal packing of Q’2GaOOCC6H4O(CH2)5CH3 compound.
Indeed, as evidenced in Figure 5.17, molecule 1 present weak hydrogen bond type interactions between oxygen atom O(4) of the carboxylate ligand not involved in the coordination and an hydrogen atom of the quinolinate pyridinic moiety of a molecule symmetrically correlated to the molecule 2 (O(4)‐‐‐H(51a) = 2.47 Å, O(4)‐‐‐C(51a) = 3.34 Å, C(51a)‐H(51a)‐‐‐O(4) = 156.7°, a = 3‐x, 1‐y, 1‐z). The second type of intermolecular interaction consists of π−π stacking interactions between two quinolinate pyridinic ring belonging to molecule 2 and to a symmetrically correlated to the molecule 1.
The interaction nature is evidenced by the interplanar distance similar to 3.61 Å (centroid distance of 4.18 Å), by the inclination angle of 30° and a trasversal slip of 1.82 Å. 5.5 Gallium complexes trisubstituted benzoic acids derivatives A new series of compounds were synthesised to study which possible changes can be introduced in the physical and chemical properties of the pentacoordinated bisquinaldinate gallium(III). Starting from the previous synthetic observations, the affinity between the carboxylic chemical function and gallium(III) metal cation could be better exploited to introduce more substituents enhancing the complexity of the chemical structure. In order to investigate this aspect, substituted benzoic acid bearing aliphatic tales HOOCC6H2(OC6H13)3, HL’4, and HOOCC6H2(OC14H29)3, HL’5, as gallic acid
derivative, as illustrated in Figure 5.18, were synthesised.
Figure 5.18: HOOCC6H2(OC6H13)3 and HOOCC6H2(OC14H29)3, gallic acid derivatives.
C O HO O O O HOOCC6H2(OC14H29)3 a aʹ HLʹ5= C O HO O O O HOOCC6H2(OC6H13)3 a aʹ HLʹ4 =
5.5.1 Synthesis of HOOCC6H2(OC6H13)3 and HOOCC6H2(OC14H29)3
The synthesis were carried out as illustrated in the Scheme 5.12, adapting the synthetic procedure reported in literature.12,13 The etherification of the methyl
ester, methyl 3,4,5‐trihydroxybenzoate CH3OOCC6H2(OH)3, was performed in
cyclohexanone. Potassium carbonate was added to the suspension with methyl ester:K2CO3 in 1:5.1 molar ratio. An excess of the suitable 1‐bromo‐alcane (1:3.1
molar ratio) was dropped to the reaction mixture suddenly a catalytic amount of potassium iodide was added. The brown reaction mixture was refluxed for 72 hours. After collection of the salts by filtration, the cyclohexanone solution was dried many time as azeotrope with water by evaporation under reduced pressure. A white solid was obtained by crystallization from CHCl3/methanol. C6H13O C6H13O C6H13O C O OH K2CO3, C6H13Br, KI Cyclohexanone, ΔT, 72 h HOOCC6H2(OC6H13)3 CH3OOCC6H2(OH)3 HO HO HO C O OCH3 Ethanol, ΔT, 24h r.t KOH HCl:H2O C6H13O C6H13O C6H13O C O OH HOOCC6H2(OC14H29)3
Scheme 5.12: synthesis of HOOCC6H2(OC6H13)3 and HOOCC6H2(OC14H29)3.
The obtained product was suspended under stirring in ethanol at 70°C then an aqueous solution of potassium hydroxide was added in order to obtain the
benzoic acid. After 24 hours under reflux the desired compound was precipitated by adding an acidic aqueous solution of HCl:H2O in 2:10 volume
ratio. The precipitated white product was washed with water and ethanol, then solved in warm petroleum ether and recrystallised at low temperature. The HOOC6H2(OC6H13)3 compound was obtained as white solid in 70% of reaction
yield. The compound purity and structure was confirmed by the usual characterization techniques. The melting point was found around 35‐37 °C and the infrared spectra show the intense C−H stretching of the aliphatic chains in the range 2931 – 2638 cm ‐1 and the presence of the carbonyl group at 1687 cm‐1. 1H NMR spectra, collected in CDCl3, confirm the presence of the three aliphatic
chains at low frequencies. The HOOC6H2(OC14H29)3 compound was collected as
white solid with a 60% of reaction yield and the elemental analysis confirm its purity. This compound show good solubility in chloroform and slightly in diethyl ether. IR spectra show two narrow and intense bands at 2919 cm‐1 and
2849 cm‐1 respectively. The carbonyl group stretching was found at 1682 cm ‐1. 1H NMR spectra reveal the presence of the three aliphatic chains without any
change in the chemical shift respect to the compound HOOC6H2(OC14H29)3. DSC
analysis reported in literature reveal liquid phase at 74°C and mesomorphysm interval 45°C –Tc.
5.5.2 Synthesis of Q’2GaOOCC6H2(OC6H13)3 and Q’2GaOOCC6H2(OC14H29)3
The synthesis of pentacoordinated gallium(III) compound Q’2GaOOCC6H2(OC6H13)3 and Q’2GaOOCC6H2(OC14H29)3 was performed
adapting the method described for this class of compounds as reported in the Scheme 5.13, and taking in account the difficulties due to the solubility features of the benzoic monodentate ligands. The ligands HOOC6H2(OC6H13)3 and
1:2 molar ratio, small amounts of diethyl ether were added to enhance the benzoic acids solubility, then the reaction mixture was allowed to stir for 24 hours at room temperature. N O Ga N O Ga(NO3)3nH2O HLʹ n = HQʹ = 2‐methyl‐8‐hydroxyquinoline KOH, Ethanol, Diethyl Ether . HL' n HQ' Ethanol, ΔT 3 4 5 6 7 a aʹ R R R C O O HOOCC6H2(OC14H29)3
HOOCC6H2(OC6H13)3 R= ‐OC6H13
‐OC14H29
Scheme 5.13: synthesis of Q’2GaOOCC6H2(OC6H13)3 and Q’2GaOOCC6H2(OC14H29)3.
The activated ligands were slowly added to an ethanolic solution of gallium(III) nitrate hydrate under energetic stirring, after 15 minutes an ethanolic solution of 2‐methyl‐8‐hydroxyquinoline was slowly added to the reaction mixture. That suspension was refluxed for six hours then was allowed to stir overnight. The reaction mixture was dried by evaporation under vacuum to give a solid again dissolved in chloroform to be filtered on Celite powder. The obtained chloroform solution was dried by evaporation under vacuum. The green solid was dissolved in small amount of chloroform then a small quantity of methanol was added to induce crystallization at very low temperatures. A green microcrystalline precipitates was obtained. The green solid was washed with small amounts of very cold diethyl ether and acetone to obtain the desired compound. The ligands aren’t soluble in ethanol, further the presence of three aliphatic chains influence the reactivity of these compounds. So the reaction yields were quite low. The purity of the obtained green microcrystalline solids was confirmed by elemental analysis. The infrared spectra of the two compounds show the typical bands profile of a pentacoordinated gallium(III)
bisquinaldinate complex. Indeed around 3064 cm‐1 it is possible to observe the
C−H stretching of the methyl group, and the intense C−H stretching bands of the aliphatic chains in the 2931–2859 cm‐1 range for Q’2GaOOCC6H2(OC6H13)3
compound and in the 2917–2851 cm‐1 range for Q’2GaOOCC6H2(OC14H29)3
compound. The stretching band of the carbonyl group was observed 1649 cm‐1
shifted to higher frequencies respect to the free ligands. The presence of the chelated 2‐methyl‐8‐hydroxyquinoline is revealed in the range between 1586– 1115 cm‐1. As illustrated in Figure 5.19, the desired structure was confirmed by 1H NMR spectra.
Figure 5.19: 1H NMR spectra of Q’2GaOOCC6H2(OC14H29)3
The redox potentials measured versus ferrocene show the same behaviour explained previously with the gallium phenolate compounds. CV analyses showed no reduction waves for all complexes inside the solvent window. Oxidation processes are evident as irreversible waves above 1433 mV for Q’2GaOOCC6H2(OC6H13)3 and 1440 mV for Q’2GaOOCC6H2(OC14H29)3. The non
(ppm) 7.10 7.20 7.30 7.40 7.50 7.60 7.70 7.80 7.90 8.00 8.10 8.20 8.30 H 4 H 6 H 3 H a,a’, 5 , 7 Q’2GaOOCC6H2(OC14H29)3 (ppm)2.0 1.6 1.2 0.8 0.4 0.0 2.4 2.8 3.2 3.6 4.0 −OCH 2− −CH 3 (Q’) −OCH2CH2− H2O −CH2− −CH 3
well‐defined irreversible oxidation waves and the precipitation at the Pt working electrode surface prevent further analysis.
Moreover, complex Q’2GaOOCC6H2(OC6H13)3 has been characterized in the
solid state by X‐ray diffraction analysis on single crystal. Crystal packing and supramolecular motif are still under investigation.
As shown in Figure 5.20, the angles around the Ga(III) ion approximate a trigonal bipyramid geometry, with the two Q’ ligands in an N,N trans conformation (N−Ga−N angle of 171.5(1)°).
Figure 5.20: Perspective view of Q’2GaOOCC6H2(OC6H13)3 complexes with atomic numbering scheme
(ellipsoids at the 50% level).
All the geometrical parameters such as bond distances and angles are comparable with those values found in the other pentacoordinated Ga(III) complexes previously discussed. Only one of the three alkoxy chains shows a
trans conformation, while the other two exhibit one and two gauche
configurations of C−C bonds revealed also in 1H NMR spectra by the two
signals of −OCH2− protons..
The melting point of Q’2GaOOCC6H2(OC6H13)3 was observed at 160‐164°C.
While the presence of long aliphatic chains in the molecular structure of Q’2GaOOCC6H2(OC14H29)3 suggest different thermal behaviour, in fact phase
transitions ware detected by DSC. The thermographs were collected at the heating and cooling rate of 10 °C/min. In the heating run two endothermic peaks at 68 °C and a 154 °C were detected while in the cooling run two exothermic peaks were observed at 46 °C and 144 °C. Further study on the phase transition characteristics are still under investigation. 5.6 Pentacoordinated complexes obtained with bifunctional carboxylic acids A series of bimetallic compounds were synthesised exploiting the reactivity of carboxylate derivative in order to link two Q’2Ga− fragments. The bifunctional
carboxylic acid were chosen on the basis of the central unit characteristics. therephtalic acid HOOCC6H4COOH, acetilenic acid HOOCC≡CCOOH and
dodecandicarboxylic acid HOOC(CH2)12COOH could be some examples of
rigid aromatic or insature or flexible central unit. As illustrated in the Scheme x, the synthetic pathway was similar to those reported for the previous compounds also for Q’2GaOOCC≡CCOOGaQ’2 complex reported in literature
with a different synthetic procedure.2
N O Ga N O N O Ga N O Qʹ2GaOOCC6H4COOGaQʹ2 nH2O C C O O O O N O Ga N O N O Ga N O C C O O O O C C Qʹ2GaOOCC N O Ga N O N O Ga N O C C O O O O (CH2)12 Qʹ2GaOOC(CH2)12COOGaQʹ2 Ga(NO3)3. 2-methyl-8-idroxyquinoline HL'n HQ' H L'n = HQ' = dodecandicarboxylic acid terephtalic acid acetilenic acid
NaOH, Ethanol, ΔT Ethanol, ΔT
CCOOGaQʹ2
Scheme 5.14: pentacoordinated bimetallic compounds.
The Q’2GaOOCC≡CCOOGaQ’2 and Q’2GaOOC(CH2)12COOGaQ’2 compounds
are light green solids recrystallized from chloroform/n‐hexane mixture to obtain reaction yields ranging from 34% to 40%. Only the complex Q’2GaOOC(CH2)12COOGaQ’2 shows low melting point around 172‐174°C. The
purity of all compounds was confirmed by elemental analysis except for Q’2GaOOCC6H4COOGaQ’2 because of the presence of GaQ’3 as impurity
checked by 1H NMR spectroscopy. In the infrared spectra of all compound the
C−H stretching bands of the methyl group ranging from 3069 cm‐1 to 3046 cm‐1.
In the case of Q’2GaOOC(CH2)12COOGaQ’2 complex, at 2925 cm‐1 and 2852
cm‐1 it is possible to observe the narrow and intense band stretching of the
aliphatic C−H. The C=O stretching ranging from 1669 cm‐1 to the very strong
tension of the rigid structure. The typical quinaldinate bands profile is checked between 1610 cm‐1 to 1114 cm‐1. Because of the low solubility in the common
organic solvents, Q’2GaOOCC≡CCOOGaQ’2 complex wasn’t possible to record
the 1H NMR spectra. While the spectral profile and the protons number of
Q’2GaOOC(CH2)12COOGaQ’2 complex confirm its chemical structure.
5.7 Multimetallic Gallium complexes obtained with polycarboxylate ligand
The previous synthesis of bimetallic compounds was a preliminary study to understand the possibility to obtain a multimetallic complex as described in Paragraph 5.3 but choosing a ligand with four carboxylic acids as [4,4’,4’’,3’’’‐ (21H,23H‐porphine‐5,10,15,20 tetrayl tetrakis‐(benzoic acid)] H2TTP(COOH)4
illustrated in Figure 5.21. COOH NH N HN N HOOC COOH COOH meso β H2TPP(COOH)4 Figure 5.21: H2TTP(COOH)4. The synthesis was performed in two steps following exactly the same procedure previously described and reported in Scheme 5.15.
COOH N N N N H H HOOC COOH COOH CH3OH, THF, r. t. Zn Zn(CH3COO)2 2H2O COOH N N N N HOOC COOH COOH β . H2TPP(COOH)4 H2TPP(COOH)4 a a' b b' .2H 2O Scheme 5.15: synthetic procedure for ZnTPP(COOH)4.
H2TTP(COOH)4 revealed lower solubility than H2TTP(OH)4 in
tetrahydrofurane. After the methanolic solution of zinc acetate dihydrate was added to the reaction mixture suddenly its colour changed in dark violet. The ZnTPP(COOH)4 was obtained as a dark violet precipitated in the reaction
mixture. The product was filtered, washed with water, ethanol and diethyl ether to obtain very good reaction yields. IR spectra shows the broad band of the carboxylic stretching at 3125 cm‐1, the C=O stretching was observed at 1703
cm‐1 at lower frequencies respect to the free porphyrin.
The presence of a new intense band at 1404 cm‐1 was evidenced. But the
elemental analysis are in disagreement with the theoretical values, probably due also to the hygroscopicity of the porphirinic carboxylic functions. Because of the poor solubility wasn’t possible to register 1H NMR spectra.
ZnTPP(COOH)4 compound was activated with NaOH in ethanol in 1:4 molar
ratio, and successively dropped in an aqueous solution of gallium(III) nitrate hydrate, finally an ethanolic solution of 2‐methyl‐8‐hydroxyquinoline was added to the reaction mixture with ZnTPP(COOH)4: Ga:HQ’ in 1:4:8 molar