Chapter 6
Photophysical Characterization of Pentacoordinated Compounds
6.1 Photophysical properties of Q’2GaLn compounds
Gallium coordination compounds obtained with mono and bidentate ligands were characterized in dichloromethane solutions. Photoluminescent quantum yields, ΦPL, were calculated using [Ru(bipy)3]Cl2, (bipy= 2,2’‐bipyridine) (H2O,
ΦPL= 0,028) as standard. Absorption and emission spectra of Q’2GaLn gallium complexes, described in Figure 6.1, were collected in dichloromethane solutions, on KBr pellets and on amorphous thin films obtained by spin coating techniques. N O Ga N O R HL1 R = ‐H HL2 ‐CN HL3 ‐NO2 HQʹ = 2‐methyl‐8‐hydroxyquinoline Qʹ2GaLn
Figure 6.1: Q’2GaLn compounds.
The recorded absorption and emission spectra in solution illustrated in Figure
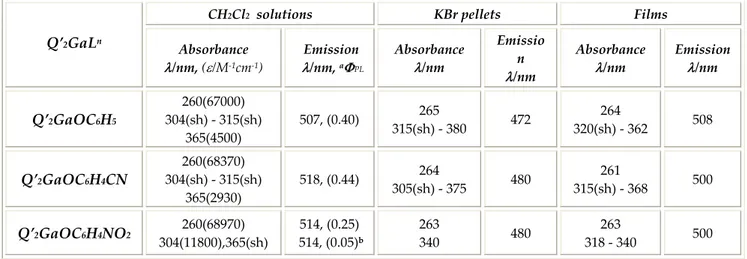
6.2 show almost the same spectral profile for Q’2GaOC6H5, Q’2GaOC6H4CN compounds with an intense band at 260 nm and 365 nm attributed to a π→ π* transitions, and two shoulders at 304 nm and 315 nm, while in
250 300 350 400 450 500 550 600 650 700 0,0 0,1 0,2 0,3 0,4 0,5 0,6 Q 2GaC6H4NO2 Q 2GaC6H5 Q 2GaC6H4CN Inten sity , a.u. Absorbance Wavelength/nm
Figure 6.2: absorption and emission spectra of Q’2GaOC6H5, Q’2GaOC6H4CN, Q’2GaOC6H4NO2.
Emission spectra were collected exciting the dichloromethane solutions at 365 nm to obtain maximum emission band values at 507‐518 nm range as reported in Table 6.1. All compounds show high photoluminescence quantum yields with values of about 40% for Q’2GaOC6H5 and Q’2GaOC6H4CN compounds and 25% for Q’2GaOC6H4NO2 compound.
In particular, while for phenol and p‐cyanophenol derivatives the ΦPL values are almost independent from the exciting wavelength in the range 290‐410 nm, for p‐nitrophenol derivative, which absorption spectrum shows a prominent band at 304 nm, the emission quantum yield measured exciting at this wavelength is dramatically reduced at 5%. The spectral characteristics showed in solution by this series of complexes, are retained in solid and film samples. As reported in Table 6.1, the absorption bands collected on KBr pellets are red‐shifted respect those registered in solution, the film emission is slightly blue‐shifted a reduced Stokes shift is noted in the solid samples. Although the emission spectra show the same profile, the emission maximum of gallium compounds obtained with para substituted phenols, registered both in solution and in KBr pellets, are red‐ shifted about 10 nm respect to the emission of gallium compound synthesised with the unsubstituted phenol.
CH2Cl2 solutions KBr pellets Films Q’2GaLn Absorbance λ/nm, (ε/M‐1cm‐1) Emission λ/nm, aΦPL Absorbance λ/nm Emissio n λ/nm Absorbance λ/nm Emission λ/nm Q’2GaOC6H5 260(67000) 304(sh) ‐ 315(sh) 365(4500) 507, (0.40) 265 315(sh) ‐ 380 472 264 320(sh) ‐ 362 508 Q’2GaOC6H4CN 260(68370) 304(sh) ‐ 315(sh) 365(2930) 518, (0.44) 264 305(sh) ‐ 375 480 261 315(sh) ‐ 368 500 Q’2GaOC6H4NO2 260(68970) 304(11800),365(sh) 514, (0.25) 514, (0.05)b 263 340 480 263 318 ‐ 340 500 aλex = 365 nm, bλex = 304 nm
Table 6.1: Q’2GaLn absorption, emission and ΦPL in CH2Cl2 solutions in KBr pellets and on film.
Comparing the electronic spectra of this series of complexes with those of similar pentacoordinated quinolinate gallium derivatives obtained different monodentate ligands no appreciable differences can be found.1,2 This is an evidence of the fact that electronic properties of this class of complexes are mainly due to the quinolinate ligands. 6.1.1 Theoretical calculations and HOMO‐LUMO assignments The structure of the ground and excited state, electron transition and the energy transfer mechanism influence the luminescence and the electroluminescence of the metal chelate so theoretical calculation were carried out in order to understand the nature of the electronic structure of Q’2GaLn series.
B3LYP/6‐31G(d) computations have been applied to these pentacoordinated gallium(III) complexes after ground state energy minimization. Figure 6.3 shows the Kohn‐Sham (KS) orbital energies and shapes of some of the highest occupied and lowest unoccupied orbitals of Q’2GaOC6H5. Their qualitative description can be extended to Q’2GaOC6H4CN and Q’2GaOC6H4NO2.
Figure 6.3: description of Q’2GaOC6H5 complex Kohn‐Sham orbitals close in energy to the HOMO and the LUMO.
A general feature of all the reported orbitals is the substantial localization on the ligands, with a very small contribution from the metal centre. This is a typical feature of this class of compounds and it has already pointed out in the cases of AlQ3, ZnQ2 and AlQ’2L.3,8 The orbitals reported in Figure 6.3 can be grouped in
orbitals localized on the Q’ chelants and orbitals localized on the Ln ligand. The
Q’ orbitals have been labeled as “q” and consist in couples of almost‐degenerate orbitals, which are mostly produced by the slightly interacting Q’ fragment orbitals, delocalized on both the chelants. The Ln orbitals have been labeled as
“p” orbitals, and they are very similar to the fragment orbitals of the pyridyl‐ fused phenolate moiety.
Figure 6.3 shows the fragment orbitals that can be assigned to each KS orbital in
this gallium pentacoordinate compounds series.
It is possible to note that, in the case of Q’2GaOC6H5 (1), the HOMO is localized on L1 (p2), while the LUMO is localized on the Q’ ligands (q2). This characteristic
is not retained in the case of Q’2GaOC6H4CN (2) and Q’2GaOC6H4NO2 (3).
Figure 6.4: energy level scheme of relevant Kohn‐Sham orbitals of Q’2GaLn complexes.
The presence of the electron attracting groups ‐CN and ‐NO2 in the L2 and L3
ligands, leads to a stabilization of the p orbitals. As a consequence, in 2 and 3 the HOMO becomes localized on the Q’ chelants (one of the q1 orbitals),
whereas the LUMO continues to be a q2 localised orbital. In the case of
compound 3, the virtual orbital p3 (not reported in the case of compounds 1 and
2) is computed. It consists in a π orbital with antibonding character located
between the oxygen and nitrogen atoms of the ‐NO2 group. Table 6.2 collects
the energies of the reported orbitals.
Q’2GaOC6H5 Q’2GaOC6H4CN Q’2GaOC6H4NO2
p1 ‐6.20 p1 ‐6.92 p1 ‐6.99
q1 ‐5.59 q1 ‐5.84 p2 ‐5.98
q1 ‐5.45 p2 ‐5.73 q1 ‐5.88
p2 (HOMO) ‐5.20 q1 (HOMO) ‐5.70 q1 (HOMO) ‐5.73
q2 (LUMO) ‐1.77 q2 (LUMO) ‐2.02 q2 (LUMO) ‐2.05
q2 ‐1.69 q2 ‐1.94 q2 ‐1.97 q3 ‐0.54 q3 ‐0.77 p3 ‐1.65 q3 ‐0.50 q3 ‐0.74 q3 ‐0.80 q3 ‐0.77 Table 6.2: energies of the Kohn‐Sham orbitals reported in Figures 6.3 and 6.4. All the values are in eV.
The presence of the p3 orbital is important to understand the absorption
spectrum of this compound, somehow different from those of 1 and 2.
According to TD‐DFT computations, the electronic spectra of the three compounds show two principal absorptions. The first absorption is computed at 399 nm (3.10 eV) for 1 and 400 nm (3.10 eV) for 2 and 3, while the second one is more intense and in all cases is found between 242 and 247 nm (5.11 ‐ 5.01 eV). These electronic transitions can be assigned to changes in the electronic density within the Q’ chelants and, in this sense, can be considered localized on these chelants. In the case of 3, the presence of the ‐NO2 group leads to an intense
additional absorption computed at 304 nm (4.08 eV) associated to an electronic transition from the p2 quinolinate‐localized orbital to the p3 orbital localized on
the ‐NO2 group. The computed spectrum well reproduces the experimental one,
allowing an accurate peak attribution. Table 6.3 reports information about the six lowest energy excited states. These states can be classified in two classes: q‐ localized and p→q charge transfer.
Q’2GaOC6H5 Q’2GaOC6H4CN Q’2GaOC6H4NO2
State Wavelength (f)a Composition State Wavelength (f)a Composition State Wavelength (f)a Composition
S1 434 nm (0.0007) p2‐q2 S1 400 nm (0.0805) q1‐q2 S1 400 nm (0.0809) q1‐q2 S2 417 nm (0.0005) p2‐q2 S2 392 nm (0.0049) p2‐q2 S2 390 nm (0.0091) q1‐q2 S3 399 nm (0.0819) q1‐q2 S3 388 nm (0.0031) mixed q 1‐q2 and p2‐q2 S3 377 nm (0.0038) q 1‐q2 S4 389 nm (0.0052) q1‐q2 S4 378 nm (0.0019) p2‐q2 S4 369 nm (0.0029) q1‐q2 S5 378 nm (0.0044) q1‐q2 S5 377 nm (0.0039) q1‐q2 S5 368 nm (0.0007) p2‐q2 S6 370 nm (0.0040) q1‐q2 S6 368 nm (0.0042) q1‐q2 S6 356 nm (0.0045) p2‐q2 S7 317 nm (0.0001) p1‐q1 S7 296 nm (0.0016) q1‐q3 plus other ones S7 334 nm (0.0003) q1‐p3 a f: oscillator strength Table 6.3: the computed lowest‐energy excited states of compounds 1‐3. The reported composition has to be considered a qualitative description in terms of monoelectronic excitation.
Interestingly, in the case of compound 1, the excited states S1 and S2 belong to
the p→q charge transfer class, with low oscillator strengths. These transitions can be assigned to monoelectronic excitations from the p2 to the q2 orbital. On
the other hand, the excited state S3 is a q‐localized transition (q1→q2
monoelectronic excitations) with larger oscillator strength. Thus, according to the computations, the experimental lowest‐energy absorption band should not be associated to the HOMO‐LUMO transition. This is the only difference among
1 and both compounds 2 and 3, for which the first excited state is a q1→q2
transition with larger oscillator strength. Furthermore, the first intense computed excitation at 399‐400 nm for 1‐3 is always a q1→q2 transition, as
proved by the constant energy gap between q1 and q2 orbitals, of 3.68 eV in all
compounds. We can conclude that the substituents on the Ln ligands do not
significantly influence the electronic structure of the Q’ chelants, leaving the q‐ localized electronic transitions within an extremely narrow interval of wavelength. A similar observation can be extended to the fluorescence process. The experimental similarity in the fluorescence peak wavelengths of the three complexes can be explained as a consequence of the localisation of the emissive electronic transitions on the Qʹ chelants. As reported in Table 6.3, the lowest energy excited state (S1) in complex 1 should produce a significantly different
emission wavelength peak and quantum yield respect to the other complexes. In fact, the S1 energy (relative to the ground state) changes from 2.86 eV (434
nm) in complex 1 to 3.09 eV (400 nm) in complexes 2 and 3. This gap of 0.23 eV is not confirmed by our experiments, where the fluorescence emission peak spreads in a range of 0.06 eV in CH2Cl2 solution, 0.05 eV in KBr pellets and 0.04 eV in solid films (Table 6.4). Q’2GaLn CH2Cl2 solution aEmission λ/nm, eV (ΦPL) KBr pellets Emission λ/nm, eV Film Emission λ/nm, eV Q’2GaOC6H5 507, 2.45 (0.40) 472, 2.63 508, 2.44 Q’2GaOC6H4CN 518, 2.39 (0.45) 480, 2.58 500, 2.48 Q’2GaOC6H4NO2 514, 2.41 (0.25) 480, 2.58 500, 2.48 λex= 365 nm Table 6.4: emission photophysical data of Q’2GaLn
Furthermore, the shape of the emission peaks (Figure 6.2) is comparable for all complexes, proving a similarity in the emission processes. The extremely low oscillator strength assigned to the S1 state of complex 1 should imply a barely
emissive complex, which does not correspond to the experimental data. Therefore we can conclude that the emission process as well as the lowest‐ energy absorption processes are dominated by the Qʹ chelants. A strong evidence of the predominance of the Qʹ chelants in the fluorescence process has already been observed in the case of similar pentacoordinated aluminum complexes3 for which a low energy monodentate phenolate→quinolinate excited state is present. As a consequence of this finding, after light absorption and population of the q1→q2 excited states (from S3 to S6 in complex 1), the non‐
radiative internal conversion towards the S1 state is slower than the emission
from the populated (pumped) states, which is in agreement with the apparent low electronic interaction between the Ln ligands and Qʹ chelants previously
discussed. With reference to the absorption spectra, the presence of an intense electronic excitation around 304 nm, assigned to the p2→p3 transition involving
the ‐NO2 chromophore, is the only relevant difference between complexes 1‐2
and complex 3. As already reported in the discussion of the experimental spectra, this band seems to be overlapped with the lowest energy band at 365 nm (Figure 6.2), which is attributed to q1→q2 excitations. This evidence could
explain the lowest quantum yield observed in the case of complex 3. The lowest population of the emissive Qʹ‐localised excited states, combined with a small interaction between the Ln and Qʹ ligands (with consequent slow intersystem
crossing towards the emissive state) could lead to a reduced quantum yield. This is supported by the different Φ‐value of 3 measured exciting the complex on the band corresponding to the p2→p3 (304 nm) or to the q1→q2 (365 nm)
experiments, when the population of the excited states is achieved by hole‐ electron recombination only mediated by the Qʹ chelants. 6.1.2 Absolute photoluminescence efficiency on film Absolute photoluminescence quantum yield (PLQY) on film were calculated in the Organic Semiconductor Centre laboratories of the Physic and Astronomy Department of the University of St. Andrews under the supervision of professor Ifor D. W. Samuel.
The measurement were collected under ambient and dark conditions with an integrating sphere (Figure 6.5) coupled with a silicon photodiode.
Figure 6.5: integrating sphere.
The excitation source was a He – Cd LASER with an excitation wavelength of 325 nm. The integrating sphere is a hollow sphere, 10 cm diameter, coated on the inside walls with a diffusely reflecting material, Scheme 6.1. The flux of light received through an aperture in the sphere is proportional to the total amount produced within the sphere independently of its angular distribution.
Scheme 6.1: schematic representation of the integrating sphere.
For each compound were prepared two samples and for each samples were collected two measurements. All compounds were characterized four times. After measurement with the integrating sphere, the photoluminescence spectra of the films were recorded with a fluorimeter. The obtained PLQY is the average value of four calculated results.
Films on quartz discs (1 cm diameter, 1 mm thickness) of each compound were obtained by spin‐coating (speed: 2500 rpm, ramp: 50 rpm, dwell: 50 sec) from chloroform solutions (10 mg, 0,5 mL). The calculations were obtained following the method proposed by Greenam et al..9
In the Figure 6.6 is illustrated the experimental set‐up adopted for thiskind of measurements. With the photodiode is measured the laser incident signal power XLASER, without filter and sample. Then the laser power on sample Xsample,
and the laser power on the sphere wall Xsphere, were collected in the presence of filter Silicon photodiode baffle He – Cd LASER sample
N
2 10 cm diameterthe filter and the sample. The transmitted ray T from the sample is checked using a power meter. Figure 6.6: experimental set‐up. For each sample were collected two reflective index R, by checking the reflected ray from the sample with a power meter, the angular distribution of the emitted light is highly sensitive to refractive index of the material and to the orientation of emitting dipoles within the film.10 After measurements with a fluorimeter the photoluminescent spectra L(λ) of the films were collected. The experimental set‐ up is illustrated in Figure 6.7.
Figure 6.7: experimental set‐up to collect reflective index. T He ‐ Cd LASER λex= 325 nm N2 s He ‐ Cd LASER λex= 325 nm R
Then all collected values were used to calculate the quantum efficiency with the Equations 6.1 representing the ratio of the emitted photon number to absorbed photon number. Equations 6.1: quantum efficiency.
While with Equation 6.2 was calculated the correction factor for the spectral response influenced by the technical limit of each component of the sphere set‐ up. Equations 6.2: correction factor. The absolute photoluminescence quantum yield is given by X/Y. Then emission spectra on film of all compounds, reported in Figure 6.8, were recorded.
x
=X
sample– (R + T) X
sphere(1 – R – T) X
LASERquantum efficiency Xsphere = LASER on the sphere wall XLASER = LASER incident signal without filter Xsample = LASER on sample R = reflectance T = trasmittance
Y=
∫
S
sphere(
λ
) L(
λ
)G(
λ
)F(
λ
)
S
lamp(
λ
)
dλ x
(
S
sphere(
λex
) G(
λex
)
S
lamp(
λex
)
)
∫
L(
λ
)
dλ
correction factor for the spectral response Ssphere = spectral responce of the sphere Slamp = spectrum of the lamp L(λ)= emission spectrum F(λ)= trasmission of the filter G(λ)= quantum efficiency of the photodiode400 450 500 550 600 650 700 0,0 0,2 0,4 0,6 0,8 1,0 Q'2GaOC6H5 Q'2GaOC6H4CN Q'2GaOC6H4NO2 GaQ'3 Int ensit y (a .u.) Wavelength/nm
Figure 6.8: emission spectra on film.
GaQ3 complex was also taken in account as reference compounds, so the calculated PLQY on film are illustrated in the Table 6.5. Compounds Emission λ max,/nm Φ PL GaQ’3 507 18% Q’2GaOC6H5 507 28% Q’2GaOC6H4CN 506 31% Q’2GaOC6H4NO2 500 1,8%
Table 6.5: emission maximum and absolute photoluminescence quantum yield.
As can be evidenced the absolute quantum efficiency of Q’2GaOC6H4NO2 complex is dramatically reduced. 6.1.3 Blended films with TPD and TPBI A series of characterizations on film were carried out in order to have an idea about the charge transport capability of the synthesised gallium compounds.
Thin films obtained by spin‐coating from dichloromethane solutions of gallium compounds blended with charge transport materials in different percent in weight were taken in account. For this purpose TPD or TPBI, often exploited in multilayer device structure, were chosen.
Therefore dichloromethane solutions (10 mg, 0.5 mL) of gallium compounds were prepared in which TPD and TPBI was dissolved in 10, 20 and 50 percent in weight. The films were realized adopting the same spin‐coating parameters (2500 speed, 50 ramp, 50 dwell) used for the calculation of the absolute photoluminescence efficiencies previously described. The excitation wavelength λex was 325 nm.
6.1.3.1 Photophysical behaviour of TPD and TPBI.
TPD, which molecular structure is illustrated in Figure 6.9, is known as hole transporting material.11 The photophysical properties in dichloromethane solution are reported in Figure 6.10. N N Figure 6.9: TPD; N,N’‐diphenyl‐N,N’‐bis(3‐methylphenyl)‐1,1’‐biphenyl‐4,4’‐diamine. 200 300 400 500 600 0,0 0,1 0,2 0,3 0,4 0,5 0,6 358 315 210 TPD Ab sorb an ce Wavelenght/nm 300 400 500 600 0 100 200 300 400 500 421 402 TPD In te n sity , a. u. Wavelength/nm Figure 6.10: absorption and emission spectra on film of TPD.
Instead, TPBI is an electron transport material.12 Figure 6.11 report the molecular structure while the absorption and the emission spectra, collected in dichloromethane solution, are illustrated in Figure 6.12. Figure 6.11: TPBI; 1,3,5‐tri(phenyl‐2‐benzimidazole)‐benzene. 200 300 400 500 600 0,0 0,1 0,2 0,3 0,4 0,5 200 310 TPBI Abs orba n ce Wavelength/nm 400 500 600 0 50 100 150 200 250 300 350 400 380 TPBI In te n sity, a. u . Wavelength/nm Figure 6.12: absorption and emission spectra on film of TPBI. 6.1.3.2 Blended film with TPD
Figure 6.13 report the absorption and the emission spectra of Q’2GaOC6H5 blended with TPD in 10, 20 and 50 percent in weight. In the absorption spectra only the bands at 310 nm and at 360 nm show the contribution of the TPD. While the emission spectra show an enhancement of the emission intensity by increasing the TPD amount. Probably this phenomenon is due to an energy
N N N N N N
transfer mechanism between TPD and Q’2GaOC6H5. The intense TPD emission disappear.
300 400 500 0,0 0,2 0,4 0,6 0,8 1,0 1,2 1,4 1,6 1,8 360 310 260 10% TPD 20% TPD 50% TPD Asorb ance Wavelength/nm 400 500 600 0 20 40 60 80 100 120 140 160 180 200 520 10% TPD 20% TPD 50% TPD Intensity, a. u. Wavelength/nm
Figure 6.13: absorption and emission spectra on film of Q’2GaOC6H5:TPD blend.
Instead the absorption and the emission spectra on film of Q’2GaOC6H4CN blended with TPD reported in Figure 6.14, show very weak contribution of TPD in the absorption spectra and a quenching effect of the emission intensity by increasing the TPD amount.
300 400 500 0,0 0,2 0,4 0,6 0,8 1,0 1,2 1,4 1,6 360 310 260 10% TPD 20% TPD Ab so rb an ce Wavelength/nm 400 500 600 0 10 20 30 40 50 60 520 10% TPD 20% TPD In te n sit y, a. u. Wavelength/nm
Figure 6.14: absorption and emission spectra on film of Q’2GaOC6H4CN:TPD blend.
The blended films Q’2GaOC6H4NO2:TPD, substantially are not chanced in absorption while a dramatic quenching of the emission intensity is observed (Figure 6.15).
300 400 500 0,0 0,2 0,4 0,6 0,8 1,0 1,2 1,4 1,6 340 260 10% TPD 20% TPD Ab sorb an ce Wavelength/nm 400 500 600 0 10 20 507 10% TPD 20% TPD Intensity, a. u. Wavelength/nm
Figure 6.15: absorption and emission spectra on film of Q’2GaOC6H4NO2:TPD blend.
The blended film were studied also for the reference compound GaQ’3. As
shown in Figure 6.16 the emission of the blended films is quenched by increasing the TPD percentage.
300 400 500 0,0 0,2 0,4 0,6 0,8 1,0 1,2 1,4 1,6 1,8 2,0 360 310 260 10% TPD 20% TPD A b sorba n ce Wavelength/nm 400 500 600 0 100 200 520 10% TPD 20% TPD In te ns iy, a. u. Wavelength/nm Figure 6.16: absorption and emission spectra on film of GaQ’3:TPD blend. 6.1.3.3 Blended film with TPBI
The photophysical spectra on film obtained from blended dichloromethane solutions of Q’2GaOC6H4R together with TPBI in 10% and 20% in weight.
In Figure 6.17 are reported the absorption and the emission spectra of the
300 400 500 0 2 260 312 370 10% TPBI 20% TPBI Ab sor b an ce Wavelength/nm 400 500 600 0 100 200 507 10% TPBI 20% TPBI Inte nsit y, a. u. Wavelength/nm
Figure 6.17: absorption and emission spectra on film of Q’2GaOC6H5:TPBI blend.
In the absorption spectra the band intensity at 312 nm increase and the other one is shifted to 370 nm. The emission intensity is quenched by increasing the TPBI percentage. The same behaviour in absorption is observed for the
Q’2GaOC6H4CN:TPBI blended films (Figure 6.18). 300 400 500 0 2 260 310 370 10% TPBI 20% TPBI A b so rb an ce Wavelength/nm 400 500 600 0 50 100 150 200 500 10% TPBI 20% TPBI In te n sity , a. u. Wavelength/nm
Figure 6.18: absorption and emission spectra on film of Q’2GaOC6H4CN:TPBI blend.
The emission spectra show a strong enhancement of the emission intensity by increasing the TPBI percentage.
In the absorption spectra of Q’2GaC6H4NO2:TPBI a growing intensity is observed for the band at 315 while emission spectra (Figure 6.19) show the emission intensity increasing probably due to an energy transfer mechanism between TBPI and Q’2GaC6H4NO2.
300 400 500 0 2 315 260 10% TPBI 20% TPBI A b so rb an ce Wavelegth/nm 400 500 600 0 5 10 15 20 25 30 35 40 507 50% TPBI 10% TPBI 20% TPBI In ten sity, a. u. Wavelength/nm
Figure 6.19: absorption and emission spectra on film of Q’2GaOC6H4NO2:TPBI blend.
The absorption and the emission spectra of the GaQ’3:TPBI blended films are
described in Figure 6.20. 400 500 600 700 800 0 100 200 520 10% TPBI 20% TPBI In te n sity, a. u. Wavelength/nm Figure 6.20: absorption and emission spectra on film of GaQ’3:TPBI blend. The absorption band at 310 nm is due to the TPBI contribution and the band at 360 nm is shifted at 370 nm. In the case of GaQ’3 the increasing presence of the TPBI cause only a weak quenching of the emission intensity. The behaviour of all blended film samples could be resumed in the Scheme 6.2. By increasing the percentage of TPD and TPBI in the blend the emission increase or the decrease the intensity. 300 400 500 0 2 370 310 260 20% TPBI 10% TPBI Abs o rb an ce Wavelength/nm
N O Ga N N O :TPD Hole transporting material :TPBI Electron transporting material Very weak quenching red shift 507 → 520 nm strong enhancement 507 nm red shift 507 → 520 nm strong quenching 500 nm strong enhancement red shift 507 → 520 nm 507 nm strong enhancement a λex = 365 nm Scheme 6.2: blended film behaviour.
The gallium complexes:TPD blended films show a strong red‐shift of the emission maximum values, more than 10 nm, respect those of the not blended film as previously illustrated. The emission maximum values of the blended films obtained with TPBI are weakly red‐shifted only Q’2GaOC6H4CN blended films show exactly the same maximum emission value of not blended film. GaQ’3 N O Ga N O Q’2GaOC6H5 N O Ga N O CN Q’2GaOC6H4CN N O Ga N O NO2 Q’2GaOC6H4NO2
6.2 Bimetallic gallium complexes obtained with bisphenol.
The gallium complex in which the monodentate ligand is a 4,4’‐bisphenol
Q’2GaOC6H4C6H4OGaQ’2, reported in Figure 6.21, was the only bimetallic compound obtained with high purity. Indeed the presence of unreacted 2‐ methyl‐8‐hydroxyquinoline and biphenol ligand or the presence of GaQ’3 were observed as impurities in the absorption spectra. N Ga N N Ga N
Figure 6.21: Q’2GaOC6H4C6H4OGaQ’2 bimetallic gallium complex.
Figure 6.22 illustrate the Q’2GaOC6H4C6H4OGaQ’2 absorption and emission spectra collected in acetic acid solution. The intense bands at 260 nm and 360 nm show the typical spectral characteristics of the pentacoordinated gallium compounds with two 2‐methyl‐8‐hydroxyquinolinate moieties. In Table 6.5 are collected the photophysical data. 300 350 400 450 500 550 600 650 700 0,0 0,1 0,2 0,3 0,4 0,5 0,6 0 5 10 15 20 25 30 Qʹ2GaOC6H4C6H4OGaQʹ2 In te ns it y, a. u. Ab so rb an ce Wavelength/nm
Absorbance λ,nm (ε, L mol‐1 cm‐1) Emission λ, nm , aΦPL Q’2GaOC6H4C6H4OGaQ’2 320(36776) ‐ 353 (9200) 520 (0.05) a λex = 365 nm
Table 6.5: photophysical data of Q’2GaOC6H4C6H4OGaQ’2.
The emission maximum value is red‐shifted respect those displayed by the monometallic gallium compounds previously described. In particular very low photoluminescence quantum yield is revealed. Because of this compound show poor solubility, the characterization on film wasn’t allowed.
6.3 Photophysical properties of Q’2GaL’n compounds
The electronic states responsible of the emission are centred on the Q’2Ga‐
fragment as discussed in the previous paragraph. A first observation of the photophysical data reported in literature about the Q’2GaOOCC6H5 compound,1
pentacoordinated gallium(III) complexes in which the pentacoordination is achieved with a carboxylate instead a phenoxyde, the spectral behaviour is retained while the photoluminescence quantum yield is reduced. Sapochak et al. attribute this quenching to the presence of the carbonyl group, known to cause fluorescence quenching.1
The absorption and the emission spectra of Q’2GaL’n gallium complexes, described in Figure 6.23, were collected in dichloromethane solutions.
N O Ga N O C O O R Qʹ2GaLʹn HLʹ1 R = ‐NO2 HLʹ2 ‐O(CH2)5CH3 HLʹ3 ‐O(CH2)7CH3 HQʹ = 2‐methyl‐8‐hydroxyquinoline
Figure 6.23: Q’2GaLn compounds.
Figure 6.24 report the absorption spectra of Q’2GaL’2 and Q’2GaL’3.
300 400 500 0,0 0,2 0,4 0,6 0,8 1,0 1,2 1,4 1,6 Qʹ2GaOOCC6H4O(CH2)5CH3 Qʹ2GaOOCC6H4O(CH2)7CH3 Abs o rb an ce Wavelength/nm 300 400 500 600 700 800 0,0 0,1 0,2 0,3 0,4 0,5 0,6 0,7 0,8 Qʹ2GaOOCC6H4O(CH2)5CH3 Qʹ2GaOOCC6H4O(CH2)7CH3 In te n si ty , a. u. Wavelength/nm
Figure 6.24: absorption and emission spectra of Q’2GaL’2 and Q’2GaL’3.
Absorption spectra show the typical intense bands centred at 260 nm and 365 nm due to the π−π* transitions. Emission bands are less broad than the emission of showed by gallium compounds obtained with phenoxyde ligands.
In Table 6.6 are reported the collected data in which are included those of Q’2GaOOCC6H5 compound reported in literature by Saphochak.. CH2Cl2 solutions Film Q’2GaL’n Absorbance λ/nm, (ε/M‐1cm‐1) Emission λ/nm (ΦPL) Absorbance λ/nm Emission λ/nm Q’2GaOOCC6H51 366 500 (0.06) / / Q’2GaOC6H4NO2 260(23370) 315 (sh), 363(1100) 515 (0.08) 263 – 370 510 Q’2GaOOCC6H4O(CH2)5CH3 260(14980) 315(2937) 365(4034) 515 (0.30) 263 – 370 505 Q’2GaOOCC6H4O(CH2)7CH3 260(10231) 315(3062), 365(5250) 515 (0.40) 263 – 370 505
Table 6.6: photophysical data of Q’2GaL’n in solution and on film.
The maximum emission values in solution are red‐shifted about 15 nm respect the compound reported by Sapochak. Films were obtained by spin‐coating from dichloromethane solutions, the collected absorption spectra are slightly red shifted while a blue‐shift of 10 nm is observed relatively to the compound with the alkylic chain in p‐position of the benzoic ligand.
The excitation wavelength was 365 nm for Q’2GaL’1 while was changed to 315 nm for Q’2GaL’2 and Q’2GaL’3. Q’2GaL’1 shows ΦPL value comparable with those reported in literature for Q’2GaOOCC6H5 compound, contrarily to the
expectations, strong enhancement is obtained with compound Q’2GaL’2 and
Q’2GaL’3.
6.3.1 Photophysical data of Q’2GaL’n compounds with trisubstrituted ligands
The synthesised Q’2GaOOCC6H4(OC6H13)3 and Q’2GaOOCC6H4(OC14H29)3 compounds, illustrated in Figure 6.25, were characterised in dichloromethane solution and on film obtained by spin‐coating techniques
N O Ga N O R R R O Qʹ2GaLʹn HLʹ4 R = ‐OC6H13 HLʹ5 ‐OC14H29 HQʹ = 2‐methyl‐8‐hydroxyquinoline O
Figure 6.25: Q’2GaL’n compounds.
Absorption and emission spectra, reported in Figure 6.26, exhibit the typical spectral profile of this class of pentacoordinated compounds. 300 400 500 0,0 0,2 0,4 0,6 0,8 1,0 1,2 1,4 1,6 1,8 2,0 2,2 Qʹ2GaOOCC6H4(OC6H13)3 Qʹ2GaOOCC6H4(OC14H29)3 Ab so rb anc e Wavelength/nm 300 400 500 600 700 800 0,0 0,2 0,4 0,6 0,8 1,0 Qʹ2GaOOCC6H3(OC6H13)3 Qʹ2GaOOCC6H3(OC14H29)3 In te ns ity, a. u. Wavelength/nm Figure 6.26: absorption spectra of Q’2GaL’n. This series of complexes, obtained with trisubstituted benzoic acids derivatives, shows in the absorption spectra the presence of a band at 300 nm with almost the same extinction coefficient, ε, of the band at 365 nm, the emission spectra were registered exciting both the solutions and the film at 300 nm. The maximum emission values are centred around 515 nm while a strong blue‐shift of 20 nm is revealed on film. Furthermore, high ΦPL value are found for both compounds as described in Table 6.7.
Table 6.7: collected photophysical data of Q’2GaLʺn. 6.3.2 Photophysical data of bimetallic compounds
The photochemical behaviour of this series of compounds, Figure 6.27, correspond to the observation previously evidenced. Table 6.8 report the collected data. N O Ga N O N O Ga N O C C O O O O C C Qʹ2GaOOCC N O Ga N O N O Ga N O C C O O O O (CH2)12
Qʹ2GaOOC(CH2)12COOGaQʹ2 CCOOGaQʹ2
Figure 6.27: synthesised bimetallic compounds.
Compound Q’2GaOOC(CH2)12COOGaQ’2 bearing the alkylic chain as a flexible spacer between the two chromophores show better photoluminescence quantum efficiency values than Q’2GaOOCC≡CCOOGaQ’2. The structure of this last one was reported in literature, but photophysical data are not reported. CH2Cl2 solutions Film Q’2GaL’n Absorbance λ/nm, (ε/M‐1cm‐1) Emission λ/nm (ΦPL) Absorbance λ/nm Emission λ/nm Q’2GaOOCC6H4 (OC6H13)3 260(167479) 300(9024) 365(9268) 515 (0.50) 263 – 370 495 Q’2GaOOCC6H4 (OC14H29)3 260(88717) 300(4769) 365(4770) 515 (0.40) 263 – 370 495
CH2Cl2 solutions Film Compound Absorbance λ/nm, (ε/M‐1cm‐1) Emission λ/nm ( aΦPL) Absorbance λ/nm Emission λ/nm Q’2GaOOCC≡CCOOGaQ’2 260(111150) 296(2830),315(3620) 365(6580) 517 (0.20) 265 – 370 500 Q’2GaOOC(CH2)12COOGaQ’2 260(68730) 300(1890), 315(2400) 364 (3600) 512 (0.36) 263 – 370 510 Table 6.8: collected data of bimetallic compounds. 6.4 Polymetallic gallium compounds The word porphyrin derive from the Greek word porphura meaning purple, and all porphyrins are intensely coloured. The study of this kind of molecular species involve a lot of attention because of their interesting photophysical properties. Thus, combining chemical synthetic versatility and electro‐optical properties of these molecules, many assembled structures are synthesised and are under investigation to emulate at molecular level light‐harvesting complexes and reaction centres of natural photosynthesis. Furthermore, in a bottom –up approach, the target is to build optoelectronic devices as switches, wires, logic element, information storage. Porphyrins can be considered ideal components to construct supramolecular systems due to the rigid and planar geometries, intense absorption bands in the visible region, relatively long fluorescence decay time, facile tunability of their optical and redox properties by metalation / functionalization.13
For these reasons H2TPP(OH)4 and H2TPP(COOH)4 were chosen in order to study the optoelectronic properties of the synthesised polymetallic
ZnTPP(OGaQ’2)4 and ZnTPP(COOGaQ’2)4 compounds described in Figure 6.28. N O N O N N N N N O Ga N O N Ga O O Zn ‐O‐ ‐COO‐ = Ga ZnTPP(OGaQʹ2)4 ZnTPP(COOGaQʹ2)4
Figure 6.28: polymetallic ZnTPP(OGaQ’2)4 and ZnTPP(COOGaQ’2)4 compounds.
The electronic absorption spectra of H2TPP(OH)4 and H2TPP(COOH)4 is typical of a porphyrin. Its consist of a strong transition to the second excited state (S0 →
S2) at about 418 nm called Soret or B band and the four weak vibrational
transitions to the first excited state (S0 → S1) ranging from 516 nm to 650 nm,
named Q bands. Both transitions are π → π* as illustrated by Gauterman four orbital model. Further, the phenols or the benzoic units at the meso positions form with the porphyrin ring a large dihedral angle which prevent a satisfactory π‐electron delocalization.14 Such a conformation prevents the intermolecular π−π interactions among porphyrin cores which for unsubstitued porphyrins usually quench the fluorescence emission, and in thin solid film is responsible of degradation due to aggregation phenomena. Although at high concentrations they show an appreciable fluorescence.15
The polymetallic gallium compounds obtained with porphyrins were studied in methanol solutions and the photoluminescent quantum yield was calculated using cresyl violet perchlorate (CV) (MeOH, ΦPL= 0,54) as standard.
6.4.1 Photophysic study of ZnTPP(OGaQ’2)4
Figure 6.29 report the absorption spectra of H2TPP(OH)4, ZnTPP(OH)4 and
ZnTPP(OGaQ’2)4 collected in methanolic solutions. 250 300 350 400 450 500 550 600 650 700 0,0 0,5 1,0 1,5 2,0 2,5 3,0 x 15 H2TPP(OH)4 ZnTPP(OH)4 ZnTPP(OGaQʹ2)4 A b so rb an ce Wavelength/nm
Figure 6.29: H2TPP(OH)4, ZnTPP(OH)4 and ZnTPP(OGaQ’2)4 absorption spectra.
Comparing the absorption spectra of H2TPP(OH)4 and ZnTPP(OH)4, it is possible to observe the slightly B band red‐shift, and a change in the Q band. In fact the band intensity at 500 nm is strongly reduced and the band at 650 nm disappear. This behaviour is retained in ZnTPP(OGaQ’2)4 absorption spectra. In that case the contribution of the Q’2Ga‐ fragment is evidenced by the typical
intense band centred at 256 nm, and a less intense absorption at 358 nm, both assigned to π−π* transitions localized on the Q’2Ga‐ fragment.
The introduction of a metal cation, in that case zinc, can be detected by UV analysis. The conformation of porphyrin macrocycle is influenced by the
complexed central cavity and by the substituents in meso positions. So a square planar conformation is preferred. The simplification of the absorption spectra is due to symmetry enhancement of the porphyrin macrocycle.16‐18
Emission spectra were recorded in methanol with excitation wavelenght of 350 nm. The spectra reported in Figure 6.30 show the intense emission bands of
H2TPP(OH)4 at 658 nm and 720 nm due to vibronic deactivation S1 → S0.
Because of the internal conversion from S2 to S1 is rapid, fluorescence can only
be detected from S1. 450 500 550 600 650 700 750 800 0 100 200 300 400 500 H2TPP(OH)4 ZnTPP(OH) 4 ZnTPP(OGaQʹ 2)4 In te nsity , a. u. Wavelength/nm
Figure 6.30: H2TPP(OH)4, ZnTPP(OH)4 and ZnTPP(OGaQ’2)4 emission spectra.
The zinc presence in ZnTPP(OH)4 influence a strong blue‐shift of the emission maximum values about 60 and 48 nm respectively. In the emission spectrum of
ZnTPP(OGaQ’2)4 complex it is possible to observe the contribution of the Q’2Ga‐
fragments revealed with the broad emission band centred at 510 nm that can be attributed to a fluorescence deactivation (τ = 12.5 ns) from the lowest electronic excited state. Furthermore, the intense bands at 614 nm and 657 nm are attributed to the zinc porphyrinic moiety. Figure 6.31 report the deconvolution of the ZnTPP(OGaQ’2)4 emission spectrum in the two components ZnTPP(OH)4 and Q’2GaOC6H5.
Figure 6.31: deconvolution of the ZnTPP(OGaQ’2)4 spectrum.
Figure 6.32 shows the deconvolution of the ZnTPP(OGaQ’2)4 spectrum in the two components ZnTPP(OH)4 and Q’2GaOC6H5.
Figure 6.32: deconvolution of the ZnTPP(OGaQ’2)4 emission spectrum.
In Table 6.9 are reported the lifetimes τ and the photoluminescence quantum yields of H2TPP(OH)4, ZnTPP(OGaQ’2)4 and of Q’2GaOC6H5 as reference compound.
Compound Absorption λmax/nm (ε /M‐1cm‐1) Emission a λmax /nm ΦPL τ/ns H2TPP(OH)4 424(555000), 559(18500) 600(11500) 610 0.018 1.2 ZnTPP(OGaQ’2)4 256(210000), 352(33000) 424(931000), 559(29500) 600(18500) 500, 605 0.040 12.4b 1.2 (64%), 11.7 (36%)c Q’2GaOC6H5 256(67000), 358(4500) 510 0.106 12.5 In methanol at room temperature; aλex = 350 nm; bλem = 500 nm; cλem = 605 nm.
Table 6.9: photophysical data and life timeτ of H2TPP(OH)4, ZnTPP(OGaQ’2)4 and Q’2GaOC6H5.
6.4.1.1 Energy transfer properties
If the absorption spectrum of ZnTPP(OH)4 and Q’2GaOC6H5 are compared as suggested in Figure 6.33, it can be noted an overlap region around 500 nm suggesting a Franck‐Condon factor that experimentally is proportional to a spectral overlap integral between the emission of the donor an the absorption of the acceptor. 450 500 550 600 650 0,00 0,04 0,08 0,12 0,16 0,20 0 20 40 60 80 100 Int e n sity, a.u . Wavelength/nm Ab so rb an ce
Figure 6.33: Overlap of the absorption spectrum of ZnTPP(OH)4 (blu line) with the emission spectrum of Q’2GaOC6H5 (green line).
Due to such features an energy transfer (ET) mechanism from the donor (D)
Q’2GaOC6H5, to the acceptor (A) ZnTPP(OH)4, could be expected in
ZnTPP(OGaQ’2)4. So the polymetallic species could be considered as if is an antenna system where the D and A chromophores are covalently linked then schematically represented as a simple dyad D‐B‐A where B, the chemical linker. In the present study B can be seen as a phenol bearing in para position the porphyrin macrocycle.
In principle, the Dexter ET should be ineffective in ZnTPP(OGaQ’2)4, since, as previously mentioned, the phenol rings, with respect to the porphyrin ring, adopt a tilted conformation which hampers a consistent orbital overlap between the D and A sites. Indeed, as shown by luminescence spectrum of
ZnTPP(OGaQ’2)4 (Figure 6.34) 300 400 500 600 700 0,0 0,1 0,3 0,4 0,5 0 25 50 75 100 In te ns it y , a.u. A b sor b an ce Wavelength/nm Figure 6.34: absorption and emission spectra of ZnTPP(OGaQ’2)4 the presence of a band at 500 nm (λex = 256 nm), is certainly attributable to the emission of the D component (Q’2Ga‐ fragment), while exciting at 424 nm only
the emission of the porphyrinic moiety is obtained. Then complete ET process from D to A can be excluded. Alternatively, taking into account the Förster mechanism, it should be recalled that the transfer efficiency can be calculated according to the formula ERET = 1– (τDA/τD), wherein τDA and τD are the lifetimes of
D, respectively with and without A. The lifetimes measured at the emission
maxima, 500 nm for ZnTPP(OGaQ’2)4 (τDA = 12.4 ns) and 510 nm for
Q’2GaOC6H5 (τD = 12.5 ns), from these data ERET results 0.008, a value which
suggests that in ZnTPP(OGaQ’2)4 the RET mechanism, probably because of the unfavourable κ2 factor, practically does not work.19 If an energy transfer mechanism is not favoured, ZnTPP(OGaQ’2)4 exhibit two emission colours. By choosing the right excitation wavelength it is possible to tune from the Q’2Ga‐
lateral pendant emission to the porphyrinic core emission.
6.4.2 Photophysic study of ZnTPP(COOGaQ’2)4
Absorption and the emission spectra of H2TPP(COOH)4 and ZnTPP(COOH)4 show the same photophysical behaviour described in the previous paragraph. The Q band at 646 nm disappear because of the presence of zinc in the central cavity of the porphyrin and the absorption spectra is red‐shifted respect to those of ZnTPP(OH)4. On the contrary ZnTPP(COOGaQ’2)4 show in absorption again the presence of four Q bands (Figure 6.35). This evidence could arise from conformational distortion of the structure probably due to some flexibility induced by the presence of carboxylates. 250 300 350 400 450 500 550 600 650 700 0,0 0,2 0,4 0,6 0,8 1,0 1,2 1,4 1,6 1,8 2,0 2,2 x 15 H2TPP(COOH)4 ZnTPP(COOH)4 ZnTPP(COOGaQʹ2)4 A b so rb ance Wavenlegth, nm
In Figure 6.36 are reported the emission spectra collected in methanol solutions. The emission bands of all species are shifted to lower frequencies respect those of the phenol substituted porphyrins derivatives previously described. 450 500 550 600 650 700 750 0 100 200 300 400 500 600 700 800 H 2TPP(COOH)4 ZnTPP(COOH) 4 ZnTPP(COOGaQʹ 2)4 In te n si ty , a. u. Wavelength,nm
Figura 6.39: emission spectra of H2TPP(COOH)4, ZnTPP(COOH)4 and ZnTPP(COOGaQ’2)4.
Table 6.10 report the photophysical data of all compounds. Unlikely the
extinction coefficients ε are not calculated because of the poor solubility of all these molecular species. Compounds Absorbance λmax /nm Emission λmax /nm ΦPL H2TPP(COOH)4 240, 300, 370, 398, 415 512, 547, 588, 646 650, 715 0.012 ZnTPP(COOH)4 310, 358, 400, 422 514, 556, 596 607, 656 0.015 ZnTPP(COOGaQ’2)4 256, 310, 364, 400, 420 513, 550, 591, 646 500, 603 650, 715 0.13
Table 6.10: photophysical data of H2TPP(COOH)4, ZnTPP(COOH)4 and ZnTPP(COOGaQ’2)4.
6.5 Conclusions
All pentacoordinated compounds are luminescent. The Q’2Ga− fragment is
slightly influenced by the presence of both mono‐, bi‐ or polydentate ligand. As can be observed the absorption and the emission spectra retain almost the same spectra profile both in solution and in the solid state showing intense absorption bands in solution at 260 nm and at around 365 nm due to the π→ π* transitions. Emission maxima in solution ranging from 500 nm to 517 nm. Between these two absorption maxima a presence of a shoulder ranging from 300 nm to 315 nm differentiate the series of mono‐ and bimetallic compounds. Q’2GaLn compounds are good emitter. ΦPL values ranging from 25% for Q’2GaOC6H4NO2 to 44% for Q’2GaOC6H4CN. The calculation of the electronic state reveal that all the reported orbitals are localized on the ligands, with a very small contribution from the metal centre. The presence of the electron attracting groups ‐CN and ‐ NO2 in the L2 and L3 ligands, leads to a stabilization of the p orbitals. In the case
of Q’2GaOC6H5 (1), the HOMO is localized on L1 (p2), while the LUMO is
localized on the Q’ ligands (q2). This characteristic is not retained in the case of
Q’2GaOC6H4CN (2) and Q’2GaOC6H4NO2 (3). Furthermore, the presence of a π orbital (p3) was computed. This may explain the low ΦPL values (5%) collected exciting at 304 nm associated to an electronic transition from the p2 quinolinate‐
localized orbital to the p3 orbital. The antibonding character of this one, located
between the oxygen and nitrogen atoms of the ‐NO2 group, is responsible of the
low population of the electronic state. The computations confirm also the observation reported in literature about the transition process dominated by the Q’2Ga− fragment. The materials behave in the same manner as thin solid film. In
fact, the absolute photoluminescence quantum yield collected on film, at excitation wavelength of 325 nm, show the emission quenching of the
of the charge transfer properties of the materials when an bias voltage is applied to a device. Thus, blended (in 10% and 20% in weigth) film with TPD (hole transporting material) and TPBI (electron transporting material) were characterised in order to understand the charge transport abilities of Q’2GaLn compounds. The results reveal that Q’2GaOC6H4CN and Q’2GaOC6H4NO2 seem to be better hole transport material while Q’2GaOC6H5 act as electron transport material.
The photophysical behaviour, centred on the quinolinate moieties is retained also in Q’2GaL’n compounds. The compounds bearing in the p‐position an aliphatic chain show intense emission and high ΦPL values ranging from 30% to 50%. This phenomenon may be attributed to an self organization of the molecule due to the aliphatic chains. But properly explanation of the results need more investigation.
The ZnTPP(OGaQ’2)4 and ZnTPP(COOGaQ’2)4 polymetallic compounds were characterised in order to study possible energy transfer mechanism between more than two chromophores in the same chemical structure. The study was focussed ZnTPP(OGaQ’2)4 complex because of its good solubility. The absorption and the emission spectra reveal the contribution of both the cromophores Q’2Ga− fragment and Zn‐porphyrin. The calculated lifetimes,
attributed to the transition on the two chromophores, coupled with the tilted conformation of the phenol rings, with respect to the porphyrin ring, hamper energy transfer mechanisms. It seem that the two chromophores are independent each other, then exciting a two different excitation wavelength, corresponding to electronic state of the chromophores it is possible to switch between to different emissions.