Neurobiology of Disease
Genetic Deletion of Neuronal PPAR
␥ Enhances the
Emotional Response to Acute Stress and Exacerbates
Anxiety: An Effect Reversed by Rescue of Amygdala PPAR
␥
Function
Esi
Domi,
1X
Stefanie
Uhrig,
2Laura
Soverchia,
1Rainer
Spanagel,
2Anita C.
Hansson,
2Estelle
Barbier,
3X
Markus
Heilig,
3Roberto
Ciccocioppo,
1and
X
Massimo
Ubaldi
11School of Pharmacy, Pharmacology Unit, University of Camerino, Camerino 62032, Italy,2Neuroanatomy Research Group, Institute of
Psychopharmacology at the Central Institute of Mental Health, Medical Faculty Mannheim/University of Heidelberg, Heidelberg 68159, Germany, and 3Center for Social and Affective Neuroscience, Institute for Clinical and Experimental Medicine, Linkoping University, Linkoping, Sweden
PPAR
␥ is one of the three isoforms of the Peroxisome Proliferator-Activated Receptors (PPARs). PPAR␥ is activated by
thiazolidinedio-nes such as pioglitazone and is targeted to treat insulin resistance. PPAR
␥ is densely expressed in brain areas involved in regulation of
motivational and emotional processes. Here, we investigated the role of PPAR
␥ in the brain and explored its role in anxiety and stress
responses in mice. The results show that stimulation of PPAR
␥ by pioglitazone did not affect basal anxiety, but fully prevented the
anxiogenic effect of acute stress. Using mice with genetic ablation of neuronal PPAR
␥ (PPAR␥
NestinCre), we demonstrated that a lack of
receptors, specifically in neurons, exacerbated basal anxiety and enhanced stress sensitivity. The administration of GW9662, a selective
PPAR
␥ antagonist, elicited a marked anxiogenic response in PPAR␥ wild-type (WT), but not in PPAR␥
NestinCreknock-out (KO) mice.
Using c-Fos immunohistochemistry, we observed that acute stress exposure resulted in a different pattern of neuronal activation in the
amygdala (AMY) and the hippocampus (HIPP) of PPAR
␥
NestinCreKO mice compared with WT mice. No differences were found between
WT and KO mice in hypothalamic regions responsible for hormonal response to stress or in blood corticosterone levels. Microinjection
of pioglitazone into the AMY, but not into the HIPP, abolished the anxiogenic response elicited by acute stress. Results also showed that,
in both regions, PPAR
␥ colocalizes with GABAergic cells. These findings demonstrate that neuronal PPAR␥ is involved the regulation of
the stress response and that the AMY is a key substrate for the anxiolytic effect of PPAR
␥.
Key words: amygdala; anxiety; conditional PPAR
␥ knock-out mice; pioglitazone; PPAR␥; stress
Introduction
Peroxisome proliferator-activated receptors (PPARs) are a group
of nuclear receptor proteins that regulate gene expression as
ligand-activated transcription factors (
Michalik et al., 2006
).
Three closely related PPAR isoforms have been identified (alpha,
delta, and gamma), which are transcribed from different genes
and differ from each other in tissue distribution, ligand
specific-Received Nov. 16, 2015; revised Oct. 18, 2016; accepted Oct. 29, 2016.
Author contributions: E.D., R.C., and M.U. designed research; E.D., S.U., L.S., A.C.H., E.B., and M.U. performed research; R.S. contributed unpublished reagents/analytic tools; E.D., S.U., L.S., R.S., A.C.H., E.B., M.H., R.C., and M.U. analyzed data; E.D., R.S., M.H., R.C., and M.U. wrote the paper.
This work was supported by the Italian Society of Pharmacology (fellowship to E.D.), the Bundesministeriumfu¨r Bildung und Forschung (e:Med program Grant FKZ: 01ZX1311A,Spanagel et al., 2013and Grant RO1 AA017447 to M.R.). We thank Dr Kevin Niswender at Vanderbilt University for providing PPAR␥-engineered mouse lines; Rina Righi and Mariangela Fiorelli for animal care; and Alfredo Fiorelli, Elisabeth Ro¨bl, and Claudia Scha¨fer for technical support.
The authors declare no competing financial interests.
Significance Statement
Peroxisome Proliferator-Activated Receptor Gamma (PPAR
␥) is a classical target for antidiabetic therapies with
thiazolidinedi-one compounds. PPAR
␥ agonists such as rosiglitazone and pioglitazone are in clinical use for the treatment of insulin resistance.
PPAR
␥ has recently attracted attention for its involvement in the regulation of CNS immune response and functions. Here, we
demonstrate that neuronal PPAR
␥ activation prevented the negative emotional effects of stress and exerted anxiolytic actions
without influencing hypothalamic–pituitary–adrenal axis function. Conversely, pharmacological blockade or genetic deletion of
PPAR
␥ enhanced anxiogenic responses and increased vulnerability to stress. These effects appear to be controlled by PPAR␥
neuronal-mediated mechanisms in the amygdala.
ity, and physiological role (
Berger and Moller, 2002
;
Breidert et
al., 2002
;
Chang et al., 2007
;
Tontonoz and Spiegelman, 2008
).
Although all PPARs were initially identified in peripheral tissue,
there is now evidence of their abundant distribution in the brain
(
Schnegg and Robbins, 2011
).
Among the three isoforms, PPAR
␥ has the highest expression
in the CNS, where it has been identified in neurons, astrocytes,
and glial cells (
Moreno et al., 2004
). Putative natural ligands of
PPAR␥ are polyunsaturated fatty acids and arachidonic acid
metabolites such as 15-deoxy-delta12,14-prostaglandin J2 and
hydroxyoctaedecadienoic acid (
Forman et al., 1995
). Potent
syn-thetic agonists of PPAR
␥ are molecules that belong to the class of
thiazolidinediones (TDZs) such as pioglitazone and rosiglitazone
(
Lehmann et al., 1995
). TDZs have glucose-sensitizing properties
and are used clinically to treat type 2 diabetes and insulin
resis-tance (
Kersten et al., 2000
).
In the brain, relatively high PPAR␥ expression levels have
been found in areas involved in the regulation of motivation and
emotion, including the caudate putamen, nucleus accumbens,
septum, ventral tegmental area, and hippocampus (HIPP)
(
Moreno et al., 2004
;
Gofflot et al., 2007
;
de Guglielmo et al.,
2015
). Moreover, PPAR
␥ appears to be linked to stress
modula-tion because its receptor expression is increased in the rat cortex
after stress and its activation attenuates the stress response in
rodents (
García-Bueno et al., 2005
). PPAR␥ activation also
atten-uates affective symptoms in depressed and bipolar patients
(
Kemp et al., 2014
;
Zeinoddini et al., 2015
).
It is known that chronic stress induces inflammatory responses in
the CNS (
Raison et al., 2006
;
García-Bueno et al., 2008b
) and
stim-ulation of the neuroimmune system may contribute to the
exacer-bation of depression and anxiety disorders (
Koo et al., 2010
;
Christoffel et al., 2011
;
Tanaka et al., 2012
). Reduction of
proinflam-matory cytokines and the anti-inflamproinflam-matory response by microglia
inhibition after PPAR
␥ stimulation has been proposed as a
mecha-nism for the antidepressant and neuroprotective effects of TDZs
(
Carta et al., 2011
;
Kemp et al., 2014
). However, a growing body of
evidence indicates an important role of PPAR␥ in the modulation of
neuronal-mediated mechanisms. For example, recent microarray
studies have shown that treatment with PPAR␥ agonists modulates
preferentially genes linked to synaptic transmission and neuronal
functions in the amygdala (AMY) and HIPP (
Searcy et al., 2012
;
Ferguson et al., 2014
), whereas inhibition of alcohol drinking and
heroin self-administration appear to be mediated by the ability of
PPAR
␥ to inhibit dopaminergic activity through the facilitation of
presynaptic inhibitory GABAergic transmission within the ventral
tegmental area (
Stopponi et al., 2011
;
de Guglielmo et al., 2015
).
Here, we explored the role of PPAR␥ in the regulation of stress
responses and anxiety at the neurocircuitry and mechanistic
lev-els. Using outbred mice, we studied the effect of PPAR␥
activa-tion on anxiety. To confirm that the effect of pioglitazone was
mediated by PPAR␥, in a subsequent experiment, we
coadmin-istered the selective receptor antagonist GW-9662 (
Leesnitzer et
al., 2002
) with pioglitazone. We then tested basal and
stress-induced anxiogenic response in conditional knock-out (KO)
mice carrying a genetic ablation of PPAR␥ in neurons but sparing
the receptor in glial cells. We then mapped neuronal activation
after a mild stress exposure in KO and wild-type (WT) mice. We
identified the AMY as a key area for PPAR
␥ modulation of
anx-iety and acute stress responses. To confirm this hypothesis, we
activated PPAR
␥ selectively in the AMY and HIPP of stressed and
nonstressed WT mice and then tested for anxiety. Combining
immunohistochemistry and in situ hybridization through
RNA-scope multiplex fluorescent technology, we found that PPAR␥
receptors in these regions are heavily expressed in glutamic acid
decarboxylase 2 (GAD2)-positive cells, suggesting their ability to
regulate GABAergic transmission.
Materials and Methods
Subjects
Experiments were performed using male CD1 (Charles River Laborato-ries) and mice with neuron-specific PPAR␥ deletion (PPAR␥NestinCre
KO) kindly provided by Dr K. Niswender (Vanderbilt University, Nash-ville, TN). To obtain the conditional inactivation of PPAR␥ in neuronal cells, transgenic mice expressing the Cre recombinase under the control of the rat Nestin (Nes) promoter were bred to homozygous PPAR␥loxP/loxP mice. The resulting heterozygous F1 offspring
(PPAR␥⫹/loxP) were either positive or negative for Nes–Cre. From mat-ings of PPAR␥⫹/loxPwith PPAR␥⫹/loxPNes–Cre mice, F2 mice of the desired genotypes (PPAR␥loxP/loxP Nes–Cre (PPAR␥NestinCre) and
PPAR␥loxP/loxP) were obtained, which were then intercrossed to obtain
F3 animals. PPAR␥loxP/loxPmice were used as control littermates for
conditional PPAR␥ mice. The mice used for this study were on a C57BL/6J background (Jones et al., 2002).
Mice were⬃8 weeks of age at the beginning of the experiments and were housed in groups of 5 and kept in a normal light/dark (LD) cycle (08:00/20:00) at constant temperature (20 –22°C) and humidity (45– 55°), with food and water provided ad libitum.
Each experiment was conducted with independent groups of mice during the dark phase of the cycle. Animals were treated in accordance with the guidelines of the European Community Council Directive for Care and Use of Laboratory Animals.
Drugs
Pioglitazone was prepared from Actos (30 mg) and suspended in distilled water for oral administration via intragastric gavage. The drug (30 mg/kg concentration) was administered orally at a volume of 10 ml/kg body weight. For intra-AMY and intra-HIPPocampal microinjections, piogli-tazone was purchased from Molcan and dissolved in 15% DMSO and 10% Cremophor. The final volume was adjusted adding physiological saline solution. Pioglitazone (5g/0.6 l) was administered in a volume of 0.3l per each site with a stainless steel injector protruding beyond the cannula tip 1.00 mm and 0.5 mm for the AMY and the HIPP, respectively (de Guglielmo et al., 2015). GW9662 was from Tocris Bioscience and was dissolved in 5% DMSO, 5% Tween 20, and 90% distilled water. The compound was administered at a dose of 5 mg/kg and injected at the volume of 10 ml/kg intraperitoneally. Pioglitazone at doses⬍20 mg/kg given peripherally was not effective in the mouse forced swimming test (Sadaghiani et al., 2011), whereas, it showed efficacy in various behav-ioral models at doses as high as 30 mg/kg (Stopponi et al., 2011;de Guglielmo et al., 2014;de Guglielmo et al., 2015). Similarly, previous studies indicated that 5 mg/kg GW9662 is sufficient to reverse the effect of 30 mg/kg pioglitazone selectively (Stopponi et al., 2011;de Guglielmo et al., 2014; de Guglielmo et al., 2015). Drugs were freshly prepared before administration.
Elevated plus maze (EPM) test
Basal anxiety behavior of PPAR␥NestinCreKO and WT mice was tested in
the EPM, which was elevated 50 cm from the floor in the center of a darkened room with three light bulbs placed in each corner of the room. Each open arm of the EPM measured 27⫻ 7 cm and the closed arms measured 27⫻ 7 ⫻ 13.5 cm. At the beginning of each trial, mice were placed in the center of the EPM facing one of the closed arms and left undisturbed in the room for the remaining time of the trial. Each trial lasted 5 min. Mice were recorded using an Ethovision videotracking system (Noldus Information Technology). The percentage of time spent in open arms [%OAT⫽ 100 ⫻ time in open arm/(time in “open arm” ⫹ time in “closed” arm)] was considered an index of anxiety behavior and Correspondence should be addressed to Roberto Ciccocioppo, School of Pharmacy, Pharmacology Unit,
Univer-sity of Camerino, Via Madonna delle Carceri, 62032 Camerino (MC) Italy. E-mail:[email protected]. DOI:10.1523/JNEUROSCI.4127-15.2016
the total number of entries was considered a measure of locomotion. After each trial, the maze was cleaned with water and dried using paper towels.
Open-field test
Mice were tested in an open field (Med Associates) placed in the center of a darkened room to assess locomotor activity and anxiety behavior. At the beginning of each trial, mice were placed in the center of the field and left undisturbed in the room for the remaining period of the trial. The trial lasted 5 min and was recorded using the Ethovision videotracking system. Param-eters were set as follows: the open field was divided into a rim zone consti-tuting the outer 6 cm of the field and a center zone including the rest of the field. The parameters measured were total distance traveled, time spent in the central zone, and number of rearings. After each trial, the field was cleaned with water and dried using paper towels.
LD exploration test
The LD exploration test for anxiety-related behavior consisted of an open-topped rectangular Plexiglas box (45 cm⫻ 30 cm ⫻ 30 cm) that was parti-tioned into a small (18 cm⫻ 30 cm) area and a large (27 cm ⫻ 30 cm) area with a door (7.5 cm⫻ 7.5 cm) in the center of the partition at floor level. The small compartment was painted black and kept dark, whereas the large com-partment was painted white and was brightly illuminated with a 60 W (400 lux) light source. Each mouse was placed into the dark compartment facing away from the aperture and allowed to explore the apparatus freely for 5 min. The number of light compartment entries (defined as all 4 paws out of the shelter) and time spent inside the light compartment over a 5 min session were recorded with the Ethovision videotracking system. The test lasted 5 min because this is the time at which behavior is most strongly influenced by novelty (Mozhui et al., 2010).
Restraint stress procedure
Restraint stress was applied by placing the animal in a conic 50 ml plastic tube. The tube diameter was adjusted with plaster tape that was also used to close the posterior opening to avoid free movements to the mice. There was a 0.5–1.0 cm hole at the far end of the plastic tube to allow normal breathing. After 1 h of restraint stress, mice were tested immedi-ately for anxiety-related behavior. For behavioral studies, mice received pioglitazone or the vehicle 12 h and 10 min before they were immobilized in tube for the 1 h restraint. Anxiety behavior was assessed immediately after stress.
Intracranial surgery and histological analysis
For intracranial surgery, mice were anesthetized by intramuscular injec-tion of 100 –150l of a solution containing tiletamine chlorohydrate (58.17 mg/10 ml) and zolazepam chlorohydrate (57.5 mg/10 ml) and placed into a stereotaxic frame. The skull was exposed and stainless steel guide cannulae (diameter, 0.35 mm; length, 7 mm) were bilaterally im-planted to reach the AMY or the HIPP using the following coordinates: (1) AMY: 1.4 mm caudal from the bregma,⫾3.0 mm mediolateral and ⫺3.9 mm ventral from the dura; (2) dorsal HIPP, 1.7 posterior to bregma,⫾ 1.5 mm mediolateral and 1.3 mm ventral to the skull surface (Paxinos and Franklin, 2003). The guide cannulae were fixed to the skull with dental cement and two anchoring screws. Behavioral tests were initiated after full recovery (5– 6 d after surgery).
For the intracranial injections, pioglitazone was administered using a Hamilton microsyringe in a volume of 0.3l/site by mean of a stainless steel injector 0.5 or 1.0 mm longer than the guide cannula for HIPP and AMY, respectively, so that its tip protruded into the area. After the ex-periments, to verify the cannula placement, mice were lightly anesthe-tized with isoflurane and 0.3l/site malachite green solution was injected into the area. After the mice were killed, the ink diffusion into the region was evaluated histologically.
The injection sites (seeFig. 6C,F ) were confirmed for both AMY and HIPP by comparison with plates taken from a mouse brain atlas (Paxinos and Franklin, 2003). Histological analysis confirmed bilateral injections into the AMY in 41 animals and HIPP in 44 animals. These mice were used for the analysis of the effects of intra-AMYr and hippocampal pi-oglitazone injections on the anxiety behavior. Mice with incorrectly placed cannulas were excluded from analysis.
In situ hybridization
Radioactive labeling of riboprobes and the in situ hybridization proce-dure has been described previously (Hansson et al., 2006;Bernardi et al., 2014;Sommer et al., 2014).
Riboprobe synthesis
Mouse-specific riboprobes were generated from mouse cDNA templates 共PPAR␥, position 138 bp and 341 bp on mouse cDNA, gene reference sequence in PubMed database; BC_021798,http://www.ncbi.nlm.nih. gov/Entrez兲. A total of 200 ng of DNA (PCR template) was used for the
synthesis of RNA probes (antisense and sense). The DNA was incubated with transcription buffer (Ambion) in the presence of 12.5 nmol ATP, CTP, and GTP; 50 pmol UTP; 125 pmol [␣-35S]UTP (1250 Ci/mmol;
PerkinElmer); and 1 unit of RNase inhibitor and 1 unit of RNA polymer-ase (Roche Molecular Biochemicals) at 37°C for 90 min. This step was followed by digestion of the DNA with RNase-free DNase at 37°C for 20 min. The transcripts were purified using spin columns (illustraTM Mi-crospinTM S-200 HR Columns; GE Healthcare).
Tissue preparation and brain sections
Fresh brains were collected from PPAR␥ KO and WT mice in RNase-free conditions and were immediately frozen in dry ice and stored at⫺80°C until the brains were cryosectioned at 10m thickness. Mouse brain sections were brought to room temperature (RT) for fixation in 4% paraformaldehyde in PBS, pH 7.0, for 15 min, followed by washing in PBS, pH 7.4, for 10 min and rinsing twice in sterilized water (5 min). Deproteination of the tissue was accomplished by incubation in 0.1M
triethanolamine, pH 8.0, for 10 min. After 2 further washing steps in PBS, pH 7.4, for 5 min, the tissue was acetylated in 0.1Mtriethanolamine, pH 8.0, with 0.25% acetic anhydride for 20 min and then washed again twice in PBS, pH 7.4, for 5 min. The sections were then dehydrated in graded ethanol and air dried. Prehybridization in prehybridization buffer (50% deionized formamide, 50 mMTris-HCl, pH 7.6, 25 mMEDTA, pH 8.0, 20 mMNaCl, 0.25 mg/ml yeast tRNA, 2.5⫻ Denhardt’s solution; Invitro-gen) was performed in humidified chambers at 37°C for 2– 4 h. After-ward, the prehybridization solution was drained off the slides and the sections were hybridized with 100l of hybridization buffer (50% de-ionized formamide, 20 mMTris-HCl, pH 7.6, 10⫻ Denhardt’s solution, 5 mg/ml yeast tRNA, 1 mg/ml polyadenylic acid, 10 mMEDTA, pH 8.0, 150 mMDTT, 330 mMNaCl, and 10% dextran sulfate) containing 1⫻ 106
cpm of either the labeled antisense RNA or sense RNA. Siliconized cov-erslips were used to cover the sections for the incubation at 55°C over-night in a humidified chamber. After removal of the coverslips by washing with 1⫻ standard saline citrate (SSC, 42°C, 40 min), the slides were washed again twice with 1⫻ SSC and then in 0.5⫻ SSC/50% for-mamide for 1 h at 42°C, followed by 2 washing steps in 1⫻ SSC for 30 min at 42°C. The sections were then treated with 1g/ml RNase in RNase buffer (0.5MNaCl, 10 mMTris, pH 8.0, 1 mMEDTA, pH 7.5) for 1 h at 37°C, washed twice in 1⫻ SSC for 30 min at 55°C, and briefly washed in 1⫻SSC at RT. Finally, the sections were dehydrated in graded ethanol and air-dried. BAS-SR 2025 imaging plates were exposed to the dry slides for 7 d and then scanned with a PhosphorImager (Fuji Typhoon FLA 700). MCID Image Analysis Software (Imaging Research) was used for densitometric analysis: bregma 0.14 mm [lateral septum and bed nucleus of the stria terminalis (BNST) and bregma⫺1.22 mm (sensory cortex (S1), habenula, laterodorsal thalamic nucleus, central AMY (CeA), and basolateral AMY (BLA) according to the mouse brain atlas;Paxinos and Franklin, 2003]. The mean density values were measured as minimal detectable change (MDC) units per square millimeter and were con-verted into nano-Curies per gram using [14C] microscales (GE
Health-care Life Sciences).
Histochemistry
Tissue preparation. Mice were deeply anesthetized by CO2inhalation and
transcardially perfused with 4% paraformaldehyde in PBS. The brains were postfixed for 1 h and cryoprotected in 30% sucrose solution in PBS at 4°C until sectioning (30m thickness). All reactions were performed on free-floating sections for c-Fos immunostaining. Sections were rinsed in PBS, treated for 30 min in 1% H2O2in PBS to reduce background, and
for 2 h. The sections were then placed in a solution (3% NSS in PBS) containing an antibody directed against c-Fos (1:10.000; Ab-5; Calbio-chem) overnight at RT. After several washings in PBS, the sections were incubated in blocking solution (3% NSS in PBS) containing biotinylated goat antirabbit antibody (1:500; Vector Laboratories) for 90 min, fol-lowed by a 1 h incubation in an avidin-biotin peroxidase complex solu-tion (Vector Laboratories). Immunoreactivity was visualized as a black reaction product after 5 min in a 0.04% 3,3⬘ diaminobenzidinetetrahy-drochloride solution containing 0.01% H2O2(Sigma-Aldrich) and 0.1%
nickel ammonium sulfate. The sections were mounted on Superfrost1 slides (Fisher Scientific), air dried, dehydrated by serial alcohol rinsing, cleared in xylene, and coverslipped.
RNAscope multiplex fluorescent. In situ hybridization was performed using the RNAscope Multiplex Fluorescent kit (Advanced Cell Diagnos-tics) according to the manufacturer’s instructions and as described pre-viously (Li et al., 2015).
Briefly, fresh frozen tissues were sectioned, mounted on slides, and fixed in 10% formalin (Thermo Fisher Scientific) for 20 min at 4°C. After 3 washes in 1⫻ PBS, sections were dehydrated in 50%, 70%, and 100% ethanol and then treated with protease solution (pretreatment 4) for 20 min at room temperature. After pretreatment 4, target probes for PPAR␥ (GenBank accession number: NM_ 001127330.2) and GAD 65 (GAD2) (NM_008078.2) were applied on the slides and incubated at 40°C for 2 h in the HybEZ oven. Next, slides were incubated with preamplifier and amplifier probes (AMP1 at 40°C for 30 min, AMP2 at 40°C for 15 min, and AMP3 at 40°C for 30 min). The slides were then incubated with fluorescently labeled probes by selecting a specific combination of colors: green (Alexa Fluor 448) for PPAR␥ and red (Atto 550) for GAD2. Finally, brain sections were incubated for 20 s with DAPI (Thermo Fisher Scien-tific). Fluorescent images of the HIPP and AMY were captured using an LSM700 Zeiss upright confocal microscope.
Plasma corticosterone levels
Blood samples were taken from 1 h restrained and nonrestrained PPAR␥ KO and WT mice. Plasma was obtained by centrifuging the samples at 1000 ⫻ g for 15 min. All plasma samples were stored at ⫺20°C before assaying with a commercially available radioimmunoassay with
126I-labeled rat/mice corticosterone (MP Biomedicals). A gamma
coun-ter was used to measure radioactivity of the samples. The values obtained are expressed in nanograms per milliliter.
Statistical analysis
Behavioral analysis and corticosterone levels were analyzed by two-way ANOVA or, when necessary, by Student’s t tests. Newman–Keuls post hoc analysis was performed when necessary. For quantification of c-Fos, the number of positively stained nuclei per region of interest was determined bilaterally in two sections for each mouse by using the cell counter anal-ysis macro of ImageJ. All cell counts were performed in regions of interest covering identical areas in square micrometers. For immunohistochem-istry and gene expression, the regions of interest were defined by anatom-ical landmarks as described in the atlas (Paxinos and Franklin, 2003). Because the data had homogenous variances within, but not between, regions, statistical analysis was performed by two-way ANOVA and t test analysis within each brain region for c-Fos and in situ hybridization, respectively. Statistical analysis of the raw data was performed in Statis-tica 7 (StatSoft).
Results
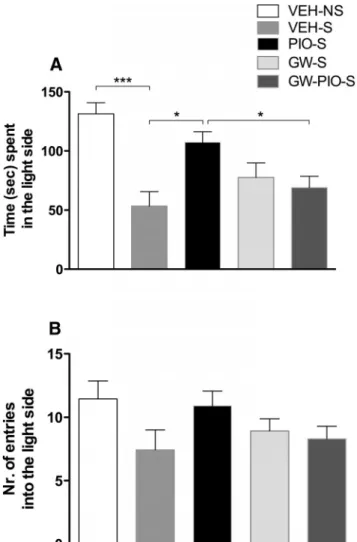
Pioglitazone reduces acute stress-induced anxiety without
affecting basal anxiety levels
The anxiolytic effect of pioglitazone was assessed under basal
conditions or after 1 h of restraint stress in the LD test. Fifty
CD1 mice were divided into 4 groups (n
⫽ 12–13/group) and
were treated with pioglitazone (30 mg/kg) or vehicle given
twice at 12 h and 10 min before restraint stress (70 min before
the LD test).
Two-way ANOVA revealed a significant overall difference
be-tween groups with a main effect of restraint stress (F
(1,46)⫽ 17.6;
p
⫽ 0.0001), accompanied by a main pioglitazone effect (F
(1,46)⫽
6.4; p
⫽ 0.014) and a significant stress ⫻ treatment interaction
(F
(1,46)⫽ 5.4; p ⫽ 0.024). Newman–Keuls post hoc tests showed
an increase in stress-induced anxiety ( p
⫽ 0.0002) and an effect
of pioglitazone in reducing it ( p
⫽ 0.001;
Fig. 1
A). No effect of
pioglitazone was observed in the group tested under basal
condi-tions ( p
⫽ 0.884). No significant effect of restraint and treatment
on number of entries into the light side was observed (F
(1,46)⫽
3.0, p
⫽ 0.089 and F
(1,46)⫽ 0.6, p ⫽ 0.433;
Fig. 1
B).
To evaluate whether a single pioglitazone administration is
sufficient to exert an anxiolytic action, we performed an
addi-tional experiment in which we injected the PPAR␥ agonist only
once 10 min before restraint stress (70 min before the LD test).
One-way ANOVA revealed a significant overall difference
be-tween groups (F
(2,34)⫽ 8.12; p ⫽ 0.0013). The Newman–Keuls
test revealed that restraint stress significantly reduced the time
spent in the light compartment compared with unrestrained
con-trol mice ( p
⫽ 0.0012). Pretreatment with pioglitazone did not
significantly reverse the anxiogenic effect of restraint stress (data
not shown). No significant effect of stress and treatment on
number of entries into the light side was observed (F
(2,34)⫽ 3.21;
p
⫽ 0.053).
GW9662 blocks the anxiolytic effect of pioglitazone on
stress-induced anxiety
The effect of pioglitazone, GW9662, and their combination was
tested on anxiety induced by restraint stress. CD1 mice were
di-Figure 1. A, Restraint stress significantly decreased the time spent in the light side of the compartment. Pretreatment with pioglitazone (30 mg/kg) reversed the anxiogenic-like effect of stress. B, No differences were detected in the number of entries into the light side of the arena. The data represent the mean⫾SEMvalues(n⫽12–13pergroup).Differencebetween vehicle nonstressed and vehicle stressed: ***p⬍ 0.001. Difference between vehicle stressed and pioglitazone stressed: ## p⬍ 0.01.
vided into five groups (n
⫽ 12–13/group). Animals were
sub-jected to restraint stress for 1 h. Treatments with pioglitazone (0
and 30 mg/kg), GW9665 (0 and 5 mg/kg), or their combination
were given twice 12 h and 10 min before restraint stress (70 min
before the LD test). GW9662 preceded the administration of
pi-oglitazone. An additional group was not subjected to restraint
and served as a control. To control for the effect of stress, we
compared restrained and nonrestrained animals using a t test.
Results showed a significant difference between groups, with
stressed mice spending less time in the light side of LD compared
with nonstressed mice (t
(25)⫽ 4.72, p ⫽ 0.000076). At this point,
to evaluate the effect of treatments, we used a two-way
fact-orial ANOVA. Results showed no main effect for pioglitazone
(F
(1,48)⫽ 3.61; p ⫽ 0.063) or GW9662 (F
(1,48)⫽ 0.68; p ⫽ 0.41),
but a significant drug
⫻ drug interaction (F
(1,48)⫽ 7.2; p ⫽
0.009). Newman–Keuls post hoc tests showed that pioglitazone
reversed stress-induced anxiety ( p
⫽ 0.011) and GW9662
signif-icantly blocked it ( p
⫽ 0.042;
Fig. 2
A). No significant effect of
restraint (t
(25)⫽ 1.90, p ⫽ 0.068) or administration of
pioglita-zone (F
(1,48)⫽ 1.38; p ⫽ 0.24), GW9662 (F
(1,48)⫽ 0.21; p ⫽ 0.64),
or both (F
(1,48)⫽ 2.8; p ⫽ 0.10) was observed on the number of
entries into the light side (
Fig. 2
B).
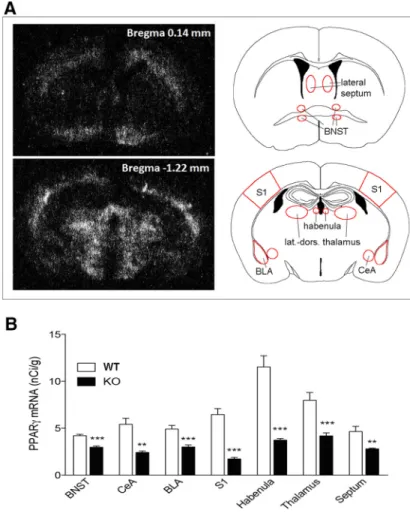
Analysis of PPAR
␥ expression in conditional PPAR␥
NestinCreKO mice
For studying the contribution of neuronal PPAR␥ in
anxiety-related behavior, we used PPAR
␥
NestinCreKO mice. We verified
the neuronal deletion of PPAR␥ using in situ hybridization (ISH)
and demonstrated a significant effect of genotype on PPAR
␥
ex-pression in all of the following brain areas analyzed in
PPAR
␥
NestinCreKO and WT animals (n
⫽ 7 per group): septum
(t
⫽ 15.53, df ⫽ 12, p ⫽ 0.0000); BNST (t ⫽ 68.95, df ⫽ 12; p ⫽
0.0000); S1 (t
⫽ 16.82, df ⫽ 12; p ⫽ 0.001); BLA (t ⫽ 51.05, df ⫽
11; p
⫽ 0.0000); CeA (t ⫽ 12.99, df ⫽ 12; p ⫽ 0.003); habenula
(t
⫽ 35.9, df ⫽ 12; p ⫽ 0.0000); and laterodorsal thalamic nucleus
(t
⫽ 33.58, df ⫽ 12; p ⬍ 0.0000) (
Fig. 3
A). The distribution
pattern of PPAR
␥ mRNA expression of the septum and BNST
was analyzed in a brain section taken 0.14 mm anterior to the
bregma, whereas the pattern of PPAR
␥ gene expression of BLA,
CeA, S1, habenula, and thalamus was analyzed in a brain section
taken 1.22 mm from the bregma (
Fig. 3
B). In summary,
consis-tent with previously published data, residual PPAR␥ expression
was still detectable in KO mice, indicating receptor deletion in
neurons, but not in other cell types (i.e., microglia,
oligodendro-cytes;
Sarruf et al., 2009
).
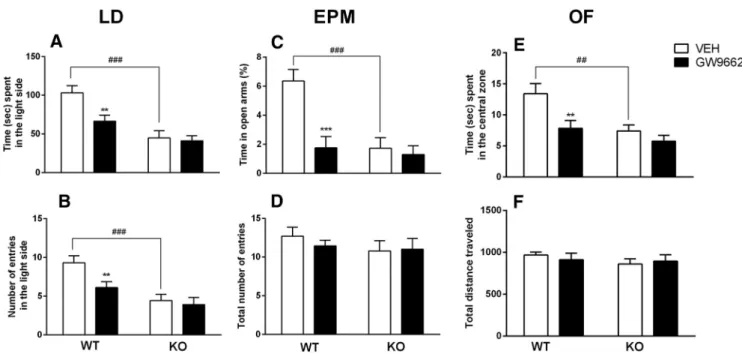
PPAR
␥
NestinCreKO animals exhibit an anxiogenic-like
phenotype and blockade of PPAR
␥ elicits a significant
anxiogenic-like response in WT, but not in KO, mice
A group of PPAR␥ KO (n ⫽ 20) and a WT (n ⫽ 20) mice were
used for this experiment. Each group was subdivided in 2
sub-groups (n
⫽ 10) and treated with the selective PPAR␥ antagonist
GW9662 (5 mg/kg, i.p.) or vehicle given 12 h and 1 h before the
behavioral tests. In the analysis of time spent in the light side of
the compartment, overall factorial ANOVA revealed a significant
main effect of genotype (F
(1,36)⫽ 23.4; p ⫽ 0.0000), a significant
main effect of treatment (F
(1,36)⫽ 5.1; p ⫽ 0.020), and a
signifi-cant genotype
⫻ treatment interaction (F
(1,36)⫽ 4.7; p ⫽ 0.039).
Post hoc analysis showed that PPAR
␥ KO mice spent less time in
the light side of the LD compartment compared with WT mice
( p
⫽ 0.0001). GW9662 administration significantly (p ⫽ 0.003)
reduced the time spent in the light side for WT, but not PPAR␥
KO, mice ( p
⫽ 0.75;
Fig. 4
A). Similarly, for the number of entries
into the light side, overall ANOVA revealed a significant effect of
genotype (F
(1,36)⫽ 21.9; p ⫽ 0.0001), treatment (F
(1,36)⫽ 6.1;
p
⫽ 0.019), and a genotype ⫻ treatment interaction (F
(1,36)⫽ 5.3;
p
⫽ 0.025). Post hoc analysis showed that there were fewer entries
into the light side by PPAR␥ KO mice than by WT mice (p ⫽
0.0009). GW9662 administration significantly ( p
⫽ 0.010)
re-duced the number of entries into the light side of the arena for
WT, but not PPAR
␥ KO, mice (p ⫽ 0.685;
Fig. 4
B).
For the EPM test, each group was subdivided in 2 subgroups
(n
⫽ 9/10) and treated with GW9662 (5 mg/kg, i.p.) or vehicle
12 h and 1 h before EPM test. Analysis of percentage of time spent
in the open arms showed a significant main effect of genotype
(F
(1,33)⫽ 15.98; p ⫽ 0.0003), a significant main effect of
treat-ment (F
(1,33)⫽ 7.351; p ⫽ 0.01), and a significant genotype ⫻
treatment interaction (F
(1,33)⫽ 15.35; p ⫽ 0.0004). Post hoc
anal-ysis showed that PPAR
␥ KO mice spent less time in the open arms
of the EPM compared with WT mice ( p
⫽ 0.0002). GW9662
administration significantly ( p
⫽ 0.0002) reduced the time spent
in the open arms for WT, but not PPAR␥ KO, mice (p ⫽ 0.40;
Fig. 4
C). ANOVA also showed a significant genotype difference
in the number of entries into open arms (F
(1,33)⫽ 5.872; p ⫽
0.021). There was no significant effect of the treatment (F
(1,33)⫽
0.953; p
⫽ 0.34), but a significant interaction genotype ⫻
treat-Figure 2. A, Restraint stress significantly decreased the time spent in the light side of the apparatus. Pretreatment with pioglitazone (PIO, 30 mg/kg) reversed the anxiogenic-like effect of stress and GW9662 (GW) blocked the anxiolytic-like effect of pioglitazone. B, No differences were detected in number of entries into the light side of the arena. The data represent the mean⫾SEMvalues(n⫽12–13pergroup).***p⬍0.001;*p⬍0.05.S,Stress;NS,nostress.
ment: (F
(1,33)⫽ 4.76; p ⫽ 0.036) (data not
shown). Overall ANOVA did not reveal a
significant effect of the genotype (F
(1,33)⫽
0.97; p
⫽ 0.329) for either treatment
(F
(1,33)⫽ 0.97; p ⫽ 0.668) or the
geno-type
⫻ treatment interaction (F
(1,33)⫽
0.38; p
⫽ 0.668) in the total number of
entries (
Fig. 4
D).
In the open-field test (n
⫽ 9/10 mice),
ANOVA showed a significant effect of
ge-notype in the time spent in the center zone
(F
(1,33)⫽ 10.01; p ⫽ 0.0033) and a
signif-icant effect of treatment (F
(1,33)⫽ 7.9; p ⫽
0.008), but no significant genotype
⫻
treatment interaction (F
(1,33)⫽ 2.389; p ⫽
0.1316). Post hoc analysis showed that
PPAR␥ KO mice spent less time in the
center zone ( p
⫽ 0.006), whereas
GW9662 reduced the time in the center
zone in WT only ( p
⫽ 0.0042;
Fig. 4
E).
ANOVA revealed no significant effect of
the genotype (F
(1,33)⫽ 0.9044; p ⫽
0.3485), no significant effect of
treat-ment (F
(1,33)⫽ 0.0274; p ⫽ 0.8694), and
no significant genotype
⫻ treatment
in-teraction (F
(1,33)⫽ 0.4944; p ⫽ 0.4868)
in total distance traveled (
Fig. 4
F ).
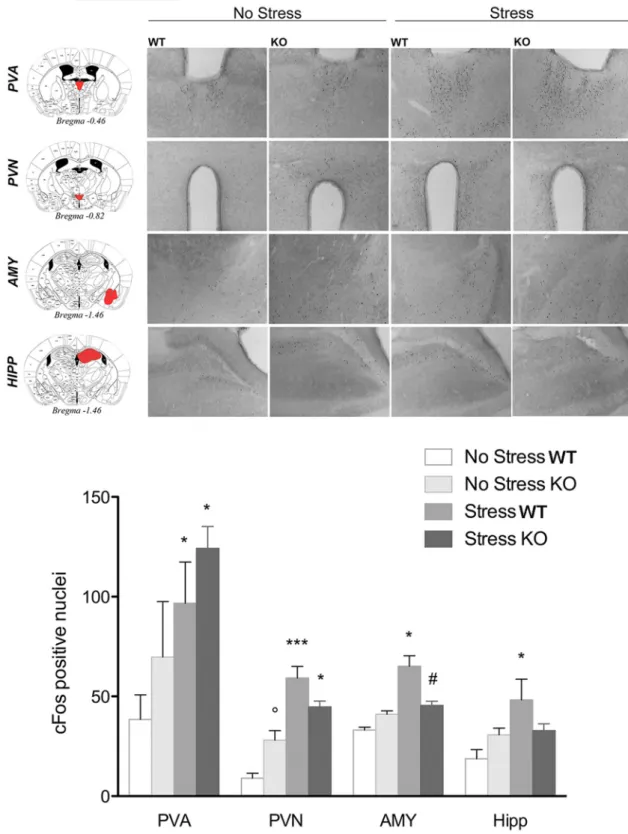
c-Fos analysis reveals a different
pattern of stress-induced neuronal
activation in PPAR
␥ KO and WT mice
c-Fos immunoreactivity was assessed in
PPAR␥ KO and WT mice (n ⫽ 3–4 per
group) after exposure to the bright
illumi-nated and novel environment as in the
light dark exploration test (
Fig. 5
).
Ro-dents show an innate aversion for bright
illuminated compartments and the contemporary exposure to
light and a novel environment acts as a mild stressor (
Bourin and
Hascoe¨t, 2003
). For each brain region, data were collected
bilat-erally from at least two separate sections. Brains were collected 90
min after the LD test (stressed group). The control group
(non-stressed) remained in their home cages. The results for all regions
analyzed are reported in
Figure 5
. In the paraventricular nucleus
of the thalamus (PVA), two-way ANOVA did not show a main
effect of genotype (F
(1,9)⫽ 1.25; p ⫽ 0.290), but there was a
significant main effect of stress (F
(1,9)⫽ 9.3; p ⫽ 0.015) without a
significant genotype
⫻ stress interaction (F
(1,9)⫽ 0.2; p ⫽ 0.65).
Post hoc analysis showed a significant increase in the number of
c-Fos-positive cells after stress in both WT ( p
⫽ 0.033) and KO
mice ( p
⫽ 0.042). In the paraventricular nucleus of the
hypothal-amus (PVN), ANOVA revealed no main effect of genotype (F
(1,9)⫽ 0.03; p ⫽ 0.857), a significant effect of stress (F
(1,9)⫽ 48.9; p ⫽
0.0000), and a significant genotype
⫻ stress interaction (F
(1,9)⫽
9.5; p
⫽ 0.013). Post hoc analysis showed a significantly higher
number of c-Fos-positive cells after stress in both WT ( p
⫽
0.0004) and KO mice ( p
⫽ 0.022). Moreover, the data revealed
that, under basal conditions, KO mice expressed a higher level of
c-Fos compared with WT mice ( p
⫽ 0.045).
In the AMY region, ANOVA showed no effect of genotype
(F
(1,9)⫽ 0.37; p ⫽ 0.558), a significant effect of stress (F
(1,9)⫽
5.7; p
⫽ 0.031), and a significant genotype ⫻ stress interaction
(F
(1,9)⫽ 10.6; p ⫽ 0.0098). Newman–Keuls post hoc test
showed a significantly higher level of c-Fos-positive cells in
WT mice after stress ( p
⫽ 0.015), but not in KO mice (p ⫽
0.50). PPAR
␥ KO stressed mice exhibited a significantly lower
expression level of c-Fos compared with WT stressed mice
( p
⫽ 0.019). In the HIPP, the analysis showed no effect of
genotype (F
(1,9)⫽ 0.2; p ⫽ 0.661), but there was a significant
difference between groups in the main effect of stress (F
(1,9)⫽
7.1; p
⫽ 0.025) and a significant genotype ⫻ stress interaction
(F
(1,9)⫽ 6.6; p ⫽ 0.030). Post hoc analysis showed that c-Fos
expression was increased only in WT after stress ( p
⬍ 0.020).
c-Fos did not change in KO stressed mice compared with
non-stressed control mice ( p
⫽ 0.944), but showed a trend close to
significance with lower expression in KO mice after stress
compared with WT stressed mice ( p
⫽ 0.063).
PPAR
␥ WT and KO animals show a similar endocrine
response to acute stress
Plasma corticosterone levels were detected in PPAR␥ KO and
WT mice under basal conditions and after 1 h of restraint
stress. Mice were divided into 4 groups (n
⫽ 7– 8/group) and
corticosterone levels were assessed. WT mice showed a
corti-costerone level of 65.5
⫾ 8.0 ng/ml that was increased to 124.
6
⫾ 8.0 ng/ml after stress. KO basal costicosterone was 72.1 ⫾
8.7 ng/ml and increased to 151.1
⫾ 18.5 after stress. Two-way
ANOVA did not show a significant overall difference between
groups with main effect of genotype (F
(1,25)⫽ 1.39; p ⫽ 0.248),
Figure 3. A, Dark-field photomicrographs from autoradiograms depicting the pattern of PPAR␥ expression of coronal mouse brain section at the bregma level 0.14 mm (top) and 1.22 mm (bottom). B, PPAR␥mRNAlevelsofPPAR␥NestinCreKO and WT mice
in the BNST, CeA, BLA, S1, habenula, thalamus, and septum. The data represent the mean⫾ SEM (n ⫽ 7 per group). **p ⬍ 0.01; ***p⬍ 0.001.
but revealed a significant main effect of stress (F
(1,25)⫽ 26.04;
p
⫽ 0.0000) without a significant genotype ⫻ stress
interac-tion (F
(1,25)⫽ 0.5; p ⫽ 0.460). The Newman–Keuls test
showed an increase of corticosterone levels in stressed mice
compared with the baseline in both WT ( p
⫽ 0.013) and KO
( p
⫽ 0.001) mice.
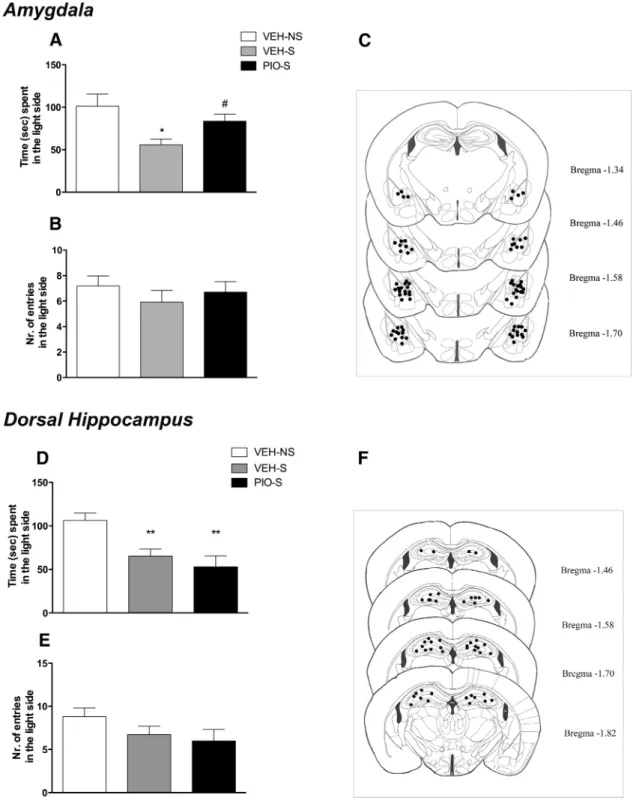
Intra-AMY, but not intra-HIPPocampal, infusion of
pioglitazone reduces stress-induced increase in anxiety-like
behavior
Restraint-stressed WT mice (n
⫽ 13 mice per group) were treated
with pioglitazone or vehicle twice 12 h and 10 min before stress
directly into the AMY (2.5
g/side/0.3 l). A third group of mice
(n
⫽ 15) not subjected to restraint stress but injected into the
AMY with vehicle served as a control. Anxiety-like behavior was
monitored by the LD test. One-way ANOVA revealed a
signifi-cant overall difference between groups (F
(2,37)⫽ 4.8; p ⫽ 0.013).
Newman–Keuls test revealed that restraint stress significantly
re-duced the time spent in the light compartment compared with
unrestrained control mice ( p
⫽ 0.014). Pretreatment with
piogli-tazone reversed the anxiogenic effect of restraint stress ( p
⫽
0.035;
Fig. 6
B). ANOVA showed no overall effect of the treatment
in the number of entries into the light side (F
(2,37)⫽ 0.62; p ⫽
0.541;
Fig. 6
C). When the other two groups of mice (n
⫽ 9–10/
group) were tested for anxiety-like behavior in LD in response
to intra-AMY pioglitazone infusion under basal conditions
(nonstressed), no drug effect was detected in the time spent in
the light side (t
(17)⫽ 0.36, NS) or in the total number of entries
in the light side (t
(17)⫽ 0.81, NS).
When pioglitazone or its vehicle was infused into the HIPP of
stressed mice (n
⫽ 11/group), compared with nonstress controls
(n
⫽ 11), ANOVA revealed a significant overall difference
be-tween groups (F
(2,30)⫽ 7.9; p ⫽ 0.0016). Newman–Keuls test
showed that restraint stress significantly reduced the time spent
in the light compartment compared with unrestrained control
mice ( p
⫽ 0.0067). Pretreatment with pioglitazone did not
mod-ify the effect of stress ( p
⫽ 0.035;
Fig. 6
E). ANOVA showed no
overall effect of the treatment in the number of entries into the
light side (F
(2,30)⫽ 1.7; p ⫽ 0.20;
Fig. 6
C).
PPAR
␥ is largely expressed in GAD2 cells
PPAR
␥ expression was analyzed in the AMY (
Fig. 7
) and HIPP
(
Fig. 8
). The RNAscope multiplex fluorescent technique with
simultaneous detection of PPAR
␥ transcript expression and
GAD2 and DAPI staining allowed us to analyze the colocalization
of PPAR
␥ in GABAergic cells. After counterstaining the sections
with DAPI, we found the most PPAR␥ expression in GAD2 cells
in both areas.
Discussion
In this study, we show that genetic deletion of neuronal PPAR␥
enhances the emotional response to acute stress and exacerbates
anxiety. PPAR␥ in the AMY appears to play a major role. Initially,
we found that systemic PPAR
␥ activation by the selective agonist
pioglitazone inhibited the anxiogenic effect of a stressor in
out-bred mice. To confirm that the effect of pioglitazone was
medi-ated by selective activation of PPAR␥, we pretremedi-ated the mice
with the selective receptor antagonist GW9662 and found that it
fully reversed pioglitazone anxiolytic effect. Based on these
find-ings, we hypothesized that neuronal PPAR
␥ is involved in the
regulation of anxiety-related behavior associated with stress. To
further explore the relationship between PPAR
␥ regulation and
anxiety, we investigated stress response in PPAR␥
NestinCreKO
mice. The genetic deletion of PPAR
␥ in the brains of KO mice was
confirmed by ISH data showing a marked reduction of receptor
transcript expression in several regions involved in emotional
control, including the septum, BNST, BLA, CeA, habenula, and
thalamus. Consistent with previously published data, residual
PPAR␥ expression was still detectable in KO mice, indicating
Figure 4. A, B, PPAR␥NestinCreKO mice and WT animals treated with GW9662 spent significantly less time (A) and displayed fewer entries into the light side of the apparatus (B) compared with
controls in the light dark test. C, PPAR␥NestinCreKO mice and WT mice treated with GW9662 spent significantly less time in the open arms compared with controls in the EPM. D, No differences among
groups were observed in total number of entries in the EPM. E, PPAR␥NestinCreKO mice and WT mice treated with GW9662 spent significantly less time in the central zone of the open-field arena.
F, No differences among groups were observed in the total distance traveled in the open field. The data represent the mean⫾ SEM (n ⫽ 10 per group). Difference between PPAR␥NestinCreKO and
receptor deletion in neurons but not in other cell types (i.e.,
microglia, oligodendrocytes;
Sarruf et al., 2009
).
Neuronal PPAR
␥ is involved in anxiety-related behaviors
In a battery of tests to explore anxiety-related behaviors,
neu-ronal PPAR
␥
NestinCreKO mice exhibited higher innate anxiety
responses compared with WT mice. Notably, in the open-field
test, we observed that PPAR␥ KO mice, despite spending
less time in the center or the arena, showed no differences in
the total distance traveled. Moreover, the two mouse lines did
not differ in the total number of arm entries into the EPM,
excluding the possibility that anxiety tests could have been
influenced by differences in locomotor behavior. This result is
consistent with previous pharmacological data revealing that
Figure 5. Top, Representative images of c-Fos immunohistochemistry in PPAR␥NestinCreKO and WT mice under basal conditions or after exposure to a mild stress (n⫽3–4pergroup).Scalebar, 100m. Bottom, c-Fos expression levels in the PVA, PVN, AMY, and HIPP. Data are expressed as mean ⫾ SEM of the number of c-Fos-positive cells: *p ⬍ 0.05; **p ⬍ 0.01; ***p ⬍ 0.001 stress versus no stress; °p⬍ 0.05 KO no stress versus WT no stress; #p ⬍ 0.05 KO stress versus WT stress.
PPAR␥ activation by pioglitazone and rosiglitazone did not
result in locomotor impairment or reduction in muscle
strength in rodents (
Morgenweck et al., 2010
;
Sadaghiani et
al., 2011
;
de Guglielmo et al., 2014
). Altogether, these results
suggest a specific involvement of PPAR␥ in the modulation of
anxiety and indicate that this effect is mediated by neuronal
mechanisms.
Our finding of a neuronal contribution of PPAR␥ to
anxiety-related behavior has important implications because,
given evidence that the stress/anxiety response is associated
with neuroimmune signaling and increased expression of
cy-tokines (
Raison et al., 2006
;
García-Bueno et al., 2008a
;
Leon-ard and Myint, 2009
;
Hou et al., 2013
), one possibility would
have been that the PPAR␥ system modulates anxiety
thro-Figure 6. A, Restraint stress significantly decreased the time spent in the light side of the apparatus, whereas intra-AMY administration of pioglitazone reversed the anxiogenic-like effect of stress. B, No differences were detected in the number of entries into the light side of the arena. C, Schematic representation of intra-AMY sites of injection assessed by histological analysis. D, Restraint stress significantly decreased the time spent in the light side of the apparatus, whereas intra-HIPPocampal administration of pioglitazone did not reverse the anxiogenic-like effect of stress. E, No differences were detected in the number of entries into the light side of the arena. F, Schematic representation of intra-HIPP sites of injection assessed by histological analysis at the completion of the experiment. Data are expressed as mean⫾SEM(n⫽13–15pergroupofintra-AMYinjections;n⫽11pergroupofintra-HIPPinjections).Differencebetweenrestraintstressedmice(S)and nonstressed (NS) controls: *p⬍ 0.05, **p ⬍ 0.01. Difference between vehicle and pioglitazone in stressed mice: #p ⬍ 0.05.
Figure 7. Representative images (40⫻ magnification) of the AMY for: GAD2 (red) ⫹ PPAR␥ (green) (A); PPAR␥ ⫹ DAPI (blue) (B); GAD2 ⫹ DAPI (C), and merge of PPAR␥ ⫹ GAD2⫹ DAPI (D). E, Illustration of the region of the AMY sampled for RNAscope ISH (Paxinos and Franklin, 2003). Arrows indicate representative cells showing PPAR␥ ⫹ GAD2 ⫹ DAPI colocalization.
Figure 8. Representative images (40⫻ magnification) of the HIPP for: GAD2 (red) ⫹ PPAR␥ (green) (A); PPAR␥ ⫹ DAPI (blue) (B); GAD2 ⫹ DAPI (C), and merge of PPAR␥ ⫹ GAD2⫹ DAPI (D). E, Illustration of the region of the HIPP sampled for RNAscope ISH (Paxinos and Franklin, 2003). Arrows indicate representative cells showing PPAR␥ ⫹ GAD2 ⫹ DAPI colocalization.
ugh anti-inflammatory mechanisms (
Feinstein, 2003
;
García-Bueno et al., 2005
;
Heneka and O’Banion, 2007
;
Woster and
Combs, 2007
;
Yuan et al., 2015
). In contrast to this hypothesis,
we found a distinct anxiogenic-like phenotype in
neuron-specific PPAR␥ KO mice, suggesting that this negative
affective state is linked to the lack of PPAR
␥ in neuronal cells.
To further validate whether the specific blockade of PPAR␥
would increase anxiety, we administered the PPAR
␥ antagonist
GW9662 to WT and KO mice that were then tested for an
anxiety-like response. As expected, blockade of PPAR
␥ exerted a
marked anxiogenic-like effect in WT mice, whereas no effects
were observed in KO mice.
Mapping neuronal activation using
c-Fos immunohistochemistry
Having ascertained that PPAR
␥-mediated response in anxiety is
regulated by neuronal mechanisms, we used c-Fos
immunohis-tochemistry to map neuronal activation in WT and KO mice
under basal conditions and in response to a mild stressful
stimu-lus consisting of the exposure to the light side of the LD
compart-ment. The results provided two important pieces of information:
(1) basal c-Fos expression was generally higher in KO mice
com-pared with WT mice (effect significant in the PVN) and (2) in WT
mice, exposure to LD enhanced c-Fos expression in areas
respon-sible for emotional control (i.e., AMY and HIPP) and in
struc-tures mediating the endocrine response to stress (i.e., PVN and
PVA). Conversely, in KO mice, enhanced c-Fos expression after
stress was only observed in endocrine-relevant areas and in
par-ticular in the PVN, which plays a key role in initiating the
hypo-thalamic–pituitary–adrenal (HPA) response to stress (
Cullinan
et al., 1995
;
Herman et al., 2002
;
Herman et al., 2003
;
Smith and
Vale, 2006
). Based on c-Fos expression pattern, we anticipated no
differences in HPA response to stress between KO and WT mice,
but an altered emotional processing occurring in mice lacking
PPAR␥ function in limbic areas such as the AMY or the HIPP.
Our prediction was confirmed by endocrinology data
show-ing no difference between WT and KO mice in the basal
cortico-sterone level or levels after stimulation by acute stress. This
finding is consistent with previous work demonstrating that the
protective effects of PPAR
␥ ligands on stress were independent of
systemic hormonal responses because no differences were
ob-served in plasma corticosterone levels in rats treated with
rosigli-tazone or vehicle and exposed to restraint stress (
García-Bueno et
al., 2005
).
AMY is the site of action of PPAR
␥-mediated
anxiety responses
After the hypothesis of an altered emotional processing in
re-sponse to stress, we next focused our attention on the limbic
system and, in particular, on the AMY, in which marked c-Fos
hyporesponsivity was observed in PPAR␥ KO mice compared
with WT mice. The AMY is an important relay responsible for the
modulation of anxiety and is activated in response to stress
(
Roozendaal et al., 2009
). PPAR
␥ in this area appears to
modu-late gene networks linked to GABA and glutamate
neurotrans-mission (
Ferguson et al., 2014
), which are both important in the
regulation of affective responses (
Hartmann et al., 1993
).
There-fore, we monitored the effect of intra-AMY injection of
pioglita-zone on anxiety-like behavior in WT mice exposed to restraint
stress. As predicted, the selective activation of PPAR
␥ in the AMY
abolished the anxiogenic-like effect of restraint stress. Next,
con-sidering that differential c-Fos activation between PPAR
␥ KO
and WT mice was detected also in the HIPP, we investigated the
effect of pioglitazone injection in this region. Activation of
PPAR
␥ in this region was, however, unable to prevent the
anxiogenic-like effect of restraint stress. This suggests that the
AMY is a specific neuronal substrate for the anxiolytic effect of
pioglitazone.
Subsequently, we studied the localization of PPAR
␥ in these
regions. In the AMY, results confirmed a relatively high
expres-sion of the receptor in cells positive for the GABAergic marker
GAD2. Interestingly, recent findings from cross-species
genome-wide approaches have identified GAD2 and PPAR
␥ as intriguing
candidate genes in anxiety disorders (
Sokolowska and Hovatta,
2013
). In the HIPP, lower receptor expression levels were
de-tected even though colocalization with GAD2-positive cells was
confirmed. These neuroanatomical data may reflect the
possibil-ity that PPAR␥ activation elicits anxiolytic action through
mod-ulation of the GABAergic transmission within the AMY.
One aspect of the study that remains elusive is why, in outbred
mice, pioglitazone showed its anxiolytic effect only after exposure
to stress, whereas in PPAR␥ KO mice, excessive anxiety also
ap-peared under basal conditions, indicating a tonic control of this
emotional state by PPAR␥. One possibility is that the genetic
deletion of the receptor sets the condition of reduced resilience to
environmental changes, dampening the innate ability of the
mouse to adapt to external stimuli that are then perceived as
stressors. If moderately stressful stimuli, such as those
experi-enced in the LD or EPM tests, are perceived as highly aversive,
then they may also activate stress mechanisms under basal
con-ditions. An aspect of the study that has remained unexplored is
whether activation of PPAR␥ after exposure to stress is able to
attenuate anxiety and restore normal affective condition
Another element of the study to be considered is that the
results from the KO mice point to a neuronal-mediated
mecha-nism for the modulation of anxiety by PPAR␥. This finding is
particularly important because recent clinical data have provided
preliminary evidence for the efficacy of pioglitazone and
rosigli-tazone in attenuating depression and bipolar disorder in patients
(
Kemp et al., 2014
;
Zeinoddini et al., 2015
). In these studies, the
anti-inflammatory and glia inhibitory properties of PPAR
␥
ago-nists were proposed as key factors for the effect of these two
TDZs. Challenging this assumption, we provide here evidence
that PPAR␥ activity is mediated by neuronal extrahypothalamic
mechanisms involving the AMY. The exact cellular processes
through which PPAR␥ modulates AMY transmission remain to
be determined. Here, we have shown a high level of colocalization
with GABA cells. Moreover, we have shown recently that PPAR␥
activation modulates presynaptic GABA transmission and
atten-uates opioid-induced stimulation of DA neurons in the VTA.
Finally, in a recent gene expression study, it was shown that
PPAR␥ stimulation results in marked changes in the levels of
several transcripts linked to GABA and glutamate transmission in
the AMY (
Ferguson et al., 2014
). It is well known that intrinsic
and extrinsic circuitry formed by GABA and glutamate neurons
in the BLA–CeA plays a critical role in the regulation of mood and
affect (
Veinante and Freund-Mercier, 1998
). Therefore, it is
pos-sible that PPAR␥, by regulating the connectivity of these
circuit-ries through modulation of amino acid transmissions, may affect
anxiety and possibly also other affective states. One limitation of
our study is that we have not been able to determine the specific
role of these two AMY subregions that, based on our ISH and
c-Fos results, could be both involved in mediating the effects of
PPAR␥. In fact, due to the small size of the BLA and the CeA, it
was not possible to target these neighboring regions separately
through microinjection experiments in the mouse. Future
stud-ies, possibly using electrophysiology recordings, are needed to
determine the exact role of PPAR
␥ in the regulation of GABA and
glutamate neurocircuitry in these different subregions of the
AMY.
In conclusion, our findings open new vistas on the role of
PPAR
␥ in the regulation of mood disorder, indicating that
damp-ened transmission may contribute to exacerbate anxiety and the
negative effects of stress. The results also suggest that the
activa-tion of PPAR␥ may be beneficial in the treatment of psychiatric
conditions associated with stress and, in particular, anxiety
dis-orders. We have also demonstrated previously marked efficacy of
PPAR
␥ agonists in preventing relapse to alcohol seeking by stress
(
Stopponi et al., 2011
;
Le Foll et al., 2013
;
Stopponi et al., 2013
).
References
Berger J, Moller DE (2002) The mechanisms of action of PPARs. Annu Rev Med 53:409 – 435.CrossRef Medline
Bernardi RE, Uhrig S, Spanagel R, Hansson AC (2014) Transcriptional reg-ulation of L-type calcium channel subtypes Cav1.2 and Cav1.3 by nicotine and their potential role in nicotine sensitization. Nicotine Tob Res 16: 774 –785.CrossRef Medline
Bourin M, Hascoe¨t M (2003) The mouse light/dark box test. Eur J Pharma-col 463:55– 65.CrossRef Medline
Breidert T, Callebert J, Heneka MT, Landreth G, Launay JM, Hirsch EC (2002) Protective action of the peroxisome proliferator-activated receptor-gamma agonist pioglitazone in a mouse model of Parkinson’s disease. J Neurochem 82:615– 624.CrossRef Medline
Carta AR, Frau L, Pisanu A, Wardas J, Spiga S, Carboni E (2011) Rosiglita-zone decreases peroxisome proliferator receptor-gamma levels in micro-glia and inhibits TNF-alpha production: new evidences on neurop-rotection in a progressive Parkinson’s disease model. Neuroscience 194: 250 –261.CrossRef Medline
Chang F, Jaber LA, Berlie HD, O’Connell MB (2007) Evolution of peroxi-some proliferator-activated receptor agonists. Ann Pharmacother 41: 973–983.CrossRef Medline
Christoffel DJ, Golden SA, Dumitriu D, Robison AJ, Janssen WG, Ahn HF, Krishnan V, Reyes CM, Han MH, Ables JL, Eisch AJ, Dietz DM, Ferguson D, Neve RL, Greengard P, Kim Y, Morrison JH, Russo SJ (2011) Ikap-paB kinase regulates social defeat stress-induced synaptic and behavioral plasticity. J Neurosci 31:314 –321.CrossRef Medline
Cullinan WE, Herman JP, Battaglia DF, Akil H, Watson SJ (1995) Pattern and time course of immediate early gene expression in rat brain following acute stress. Neuroscience 64:477–505.CrossRef Medline
de Guglielmo G, Kallupi M, Scuppa G, Stopponi S, Demopulos G, Gaitanaris G, Ciccocioppo R (2014) Analgesic tolerance to morphine is regulated by PPARgamma. Br J Pharmacol 171:5407–5416.CrossRef Medline
de Guglielmo G, Melis M, De Luca MA, Kallupi M, Li HW, Niswender K, Giordano A, Senzacqua M, Somaini L, Cippitelli A, Gaitanaris G, De-mopulos G, Damadzic R, Tapocik J, Heilig M, Ciccocioppo R (2015) PPARgamma activation attenuates opioid consumption and modulates mesolimbic dopamine transmission. Neuropsychopharmacology 40: 927–937.CrossRef Medline
Feinstein DL (2003) Therapeutic potential of peroxisome proliferator-activated receptor agonists for neurological disease. Diabetes Technol Ther 5:67–73.CrossRef Medline
Ferguson LB, Most D, Blednov YA, Harris RA (2014) PPAR agonists regu-late brain gene expression: relationship to their effects on ethanol con-sumption. Neuropharmacology 86:397– 407.CrossRef Medline
Forman BM, Tontonoz P, Chen J, Brun RP, Spiegelman BM, Evans RM (1995) 15-Deoxy-delta 12, 14-prostaglandin J2 is a ligand for the adi-pocyte determination factor PPAR gamma. Cell 83:803– 812.CrossRef Medline
García-Bueno B, Madrigal JL, Lizasoain I, Moro MA, Lorenzo P, Leza JC (2005) Peroxisome proliferator-activated receptor gamma activation de-creases neuroinflammation in brain after stress in rats. Biol Psychiatry 57:885– 894.CrossRef Medline
García-Bueno B, Caso JR, Leza JC (2008a) Stress as a neuroinflammatory condition in brain: damaging and protective mechanisms. Neurosci Biobehav Rev 32:1136 –1151.CrossRef Medline
García-Bueno B, Madrigal JL, Pe´rez-Nievas BG, Leza JC (2008b) Stress
mediators regulate brain prostaglandin synthesis and peroxisome proliferator-activated receptor-gamma activation after stress in rats. En-docrinology 149:1969 –1978.CrossRef Medline
Gofflot F, Chartoire N, Vasseur L, Heikkinen S, Dembele D, Le Merrer J, Auwerx J (2007) Systematic gene expression mapping clusters nuclear receptors according to their function in the brain. Cell 131:405– 418.
CrossRef Medline
Hansson AC, Cippitelli A, Sommer WH, Fedeli A, Bjo¨rk K, Soverchia L, Terasmaa A, Massi M, Heilig M, Ciccocioppo R (2006) Variation at the rat Crhr1 locus and sensitivity to relapse into alcohol seeking induced by environmental stress. Proc Natl Acad Sci U S A 103: 15236 –15241.CrossRef Medline
Hartmann J, Ku¨nig G, Riederer P (1993) Involvement of transmitter sys-tems in neuropsychiatric diseases. Acta Neurol Scand Suppl 146:18 –21.
Medline
Heneka MT, O’Banion MK (2007) Inflammatory processes in Alzheimer’s disease. J Neuroimmunol 184:69 –91.CrossRef Medline
Herman JP, Cullinan WE, Ziegler DR, Tasker JG (2002) Role of the para-ventricular nucleus microenvironment in stress integration. Eur J Neuro-sci 16:381–385.CrossRef Medline
Herman JP, Figueiredo H, Mueller NK, Ulrich-Lai Y, Ostrander MM, Choi DC, Cullinan WE (2003) Central mechanisms of stress integration: hi-erarchical circuitry controlling hypothalamo-pituitary-adrenocortical re-sponsiveness. Front Neuroendocrinol 24:151–180.CrossRef Medline
Hou R, Tang Z, Baldwin DS (2013) Potential neuroimmunological targets in the treatment of anxiety disorders. Mod Trends Pharmacopsychiatri 29:67– 84.CrossRef Medline
Jones JR, Shelton KD, Guan Y, Breyer MD, Magnuson MA (2002) Genera-tion and funcGenera-tional confirmaGenera-tion of a condiGenera-tional null PPARgamma allele in mice. Genesis 32:134 –137.CrossRef Medline
Kemp DE, Schinagle M, Gao K, Conroy C, Ganocy SJ, Ismail-Beigi F, Cala-brese JR (2014) PPAR-gamma agonism as a modulator of mood: proof-of-concept for pioglitazone in bipolar depression. CNS Drugs 28: 571–581.CrossRef Medline
Kersten S, Desvergne B, Wahli W (2000) Roles of PPARs in health and dis-ease. Nature 405:421– 424.CrossRef Medline
Koo JW, Russo SJ, Ferguson D, Nestler EJ, Duman RS (2010) Nuclear factor-kappaB is a critical mediator of stress-impaired neurogenesis and depressive behavior. Proc Natl Acad Sci U S A 107:2669 –2674.CrossRef Medline
Leesnitzer LM, Parks DJ, Bledsoe RK, Cobb JE, Collins JL, Consler TG, Davis RG, Hull-Ryde EA, Lenhard JM, Patel L, Plunket KD, Shenk JL, Stimmel JB, Therapontos C, Willson TM, Blanchard SG (2002) Functional con-sequences of cysteine modification in the ligand binding sites of peroxi-some proliferator activated receptors by GW9662. Biochemistry 41: 6640 – 6650.CrossRef Medline
Le Foll B, Di Ciano P, Panlilio LV, Goldberg SR, Ciccocioppo R (2013) Peroxisome proliferator-activated receptor (PPAR) agonists as promising new medications for drug addiction: preclinical evidence. Curr Drug Tar-gets 14:768 –776.CrossRef Medline
Lehmann JM, Moore LB, Smith-Oliver TA, Wilkison WO, Willson TM, Kliewer SA (1995) An antidiabetic thiazolidinedione is a high affinity ligand for peroxisome proliferator-activated receptor gamma (PPAR gamma). J Biol Chem 270:12953–12956.CrossRef Medline
Leonard BE, Myint A (2009) The psychoneuroimmunology of depression. Hum Psychopharmacol 24:165–175.CrossRef Medline
Li X, Rubio FJ, Zeric T, Bossert JM, Kambhampati S, Cates HM, Kennedy PJ, Liu QR, Cimbro R, Hope BT, Nestler EJ, Shaham Y (2015) Incubation of methamphetamine craving is associated with selective increases in expres-sion of Bdnf and trkb, glutamate receptors, and epigenetic enzymes in cue-activated fos-expressing dorsal striatal neurons. J Neurosci 35:8232– 8244.CrossRef Medline
Michalik L, Auwerx J, Berger JP, Chatterjee VK, Glass CK, Gonzalez FJ, Grimaldi PA, Kadowaki T, Lazar MA, O’Rahilly S, Palmer CN, Plutzky J, Reddy JK, Spiegelman BM, Staels B, Wahli W (2006) International Union of Pharmacology. LXI. Peroxisome proliferator-activated recep-tors. Pharmacol Rev 58:726 –741.CrossRef Medline
Moreno S, Farioli-Vecchioli S, Ceru` MP (2004) Immunolocalization of per-oxisome proliferator-activated receptors and retinoid X receptors in the adult rat CNS. Neuroscience 123:131–145.CrossRef Medline
Morgenweck J, Abdel-Aleem OS, McNamara KC, Donahue RR, Badr MZ, Taylor BK (2010) Activation of peroxisome proliferator-activated