i
Università degli Studi di
Ferrara
DOTTORATO DI RICERCA IN
Pharmaceutical Sciences
CICLO XXVII
COORDINATOR Prof. Stefano Manfredini
Phytochemicals: Design, Synthesis, Biological
Evaluation and Novel Characterisation Methods
Settore Scientifico Disciplinare CHIM/08
PhD Student
Dr. De Lucia Daniela
Supervisor
Prof. Manfredini Stefano
Co-Supervisor
Prof. Ley Steven V.
ii
To my Dad who taught me honesty and perseverance To my Mum who always lifted me up when I fell To my nephews for whom I set an example and for whom I try to be the best To all my amazing family because family means that no one is abandoned or forgotten To Sean my rock and my love of today and hopefully of the rest of my life…
iii
“Risk-taking is the cornerstone of empire.” Estée Lauder
“Great minds discuss ideas, average minds discuss events, small minds discuss people.” Eleanor Roosevelt
“When I thought I couldn’t go on, I forced myself to keep going. My success is based on persistence, not luck.” Estée Lauder
“In the old days, you had a lot of ideas, but you didn't have enough craft and experience” Carlos Benaim
iv
Acknowledgements
I would like to start by thanking Dr Tatiana Bernardi who was the first person I worked with during my PhD and who trained me in new subject areas with great professionalism but maintained an outstanding human profile and kindness. She has always been extremely respectful towards me and my work and always provided me guidance in the best possible way, being open to all my suggestions and ideas and helping me, with her experience, to understand when they were good and when they weren’t, without ever taking over. She is someone who revealed to be a person I can rely on even after we completed our project together, a friend, thank you Tati.
I want to thanks Prof. Stefano Manfredini who accepted me in the PhD giving me opportunities to grow through the challenges he set me along the way and for always being able to break the tension with a funny joke. Dr Anna Baldisserotto for help and training on the work with the dermatophytes and Dr Elisa Andreotti.
I want to thanks Dr Biagia Musio to be able to overcome our personal differences and support me, I know she will miss my “intimidating e-mails….”
I have to also thanks Sabine (“Bine”), Sonja and Sean for all the morning chocolate they left on my desk, the dinners together and the stupid jokes in the lab. Thanks are also due to Guy my bay/desk lab mate for the conversations and the unexpected sense of humour. He is someone who set the example for me to follow as a scientist and has gained my deep respect for his honesty and his genuine kindness.
I will bring a piece of you along all my life. Thanks so much guys!
I would also like to acknowledge all the external collaborators I worked with during my PhD. I especially want to thank Prof. Andreas Bender and Prof. Oliver Werz who joined the project with enthusiasm as soon as I contacted them, but, more than everything, for the incredible respect they treated me with and for being willing to discuss ideas with me although I was new to their respective fields. Thanks to this opportunity, I gained the chance to widen my knowledge and to investigate fields I had no prior experience in which also enabled me to shape my project in a more complete way.
I want to thanks my proof-readers Dr Tatiana Bernardi, Dr Anna Baldisserotto and especially Dr Sean Newton who has been forced to proof read all the work (given he is a native English speaker).
v
Enormous thanks go to my three crazy friends Silvia, Marta and Enrica – it is nice to know that no matter where we are in the world or what challenges we will be facing, we are always there for each other.
The biggest thanks go to my loving family and especially to my nephews (Elena, Massimo and Leonardo) that I love with all my heart. Without their support I would not be at this point in my life and would not have been able to cope with the challenges I have faced over the past few years. It makes me incredibly proud knowing they look up to me and that I can inspire them, even just a little, and knowing that Massimo wants to become a chemist and Elena a botanist. This thesis is dedicated to them, with the wish they will be able to follow with commitment their passions.
Finally, I want to express my incredible gratitude to Steve for the opportunity to work in his group for 18 months during my PhD and for the incredible generosity he has shown to myself and everyone in the group. I want to thank him for turning me from a pharmacist into a little chemist as well for all the support and for trying to make me understand that my project was good (even if it wasn’t Spirodienal A).
vi
T
ABLE OFC
ONTENTSA
CKNOWLEDGEMENTS...
IVA
BBREVIATION ANDA
CRONYMS...
IXP
HYTOCHEMICALS... 1
1.
I
NTRODUCTION TON
OVELC
HARACTERISATIONM
ETHODS INP
HYTOCHEMICALS... 3
1.1. History of Chromatography
... 3
1.2. Chromatography Theoretical Principles
... 3
1.2.1. Adsorption ... 4
1.2.2. Partition ... 4
1.2.3. Complex Formation ... 5
1.3. Thin Layer Chromatography
... 5
1.3.1. Planar Chromatography ... 5
1.3.2. Chromatographic Parameters ... 7
1.3.3. Stationary Phase ... 10
1.4. Development Solvent
... 12
1.5. Modern Planar Chromatography
... 16
1.6. Adansonia Digitata and Prebiotics
... 19
2.
N
OVELC
HARACTERISATIONM
ETHODSA
PPLIED TOP
HYTOCHEMICALS:
A
IMS ANDB
ACKGROUND... 21
3.
R
ESULTS ANDD
ISCUSSION... 22
3.1. Novel Characterisation Methods in Phytochemical Analysis
... 22
4.
C
ONCLUSIONS... 38
5.
E
XPERIMENTALP
ROTOCOLS... 40
5.1. Hydrolytic Treatment of Samples
... 40
5.1.1. Acid Hydrolysis ... 40
5.1.2. Enzymatic Hydrolysis ... 40
5.1.3. HPTLC Protocols ... 41
5.1.4. Derivatisation and Scanning ... 42
6.
I
NTRODUCTION... 45
vii
6.2. Antioxidants
... 46
6.2.1. Preventive Antioxidants ... 47
6.2.2. Chain Breaking Antioxidants ... 48
6.2.3. Antioxidants Assays ... 50
6.3. Multi-Target Approach in Drug Design
... 51
6.4. Arachidonic Acid Pathway
... 54
6.5. Dermatophytes
... 60
6.5.1. Targets for Dermatophyte Therapy ...
61
6.6. Azole-containing derivatives
... 63
7.
P
ROJECT AIMS AND BACKGROUND... 65
7.1. Novel Semi-Synthetic Polyphenol Analogues and Related SAR Studies
... 65
8.
R
ESULTS ANDD
ISCUSSION... 68
8.1. Preliminary Studies Toward Curcumin Analogues
... 68
8.2. Library Planning Strategy Assisted Through In Silico Evaluation
... 72
8.2.1. Molecular Modelling Studies ... 72
8.2.2. Molecular Modelling Parameters ... 76
8.3. Design and Synthesis of the Compound Library
... 77
8.3.1. Rationale Behind the Design ... 77
8.3.2. Synthesis of the Library ... 80
8.4. Reaction Mechanisms of the Key Steps
... 87
8.4.1. Steglich Esterification ... 87
8.4.2. Copper(I) Catalysed Azide–Alkyne Cycloaddition (CuAAC). ... 89
8.5. In Vitro Assays
... 90
8.5.1. Antioxidants Evaluation ... 90
8.5.2. Antimycotic Assays ... 94
8.5.3. 5-Lipoxygenase Activity Studies ... 97
8.5.4. Cytotoxicity Assays ... 102
9.
C
ONCLUSIONS... 103
10.
E
XPERIMENTALP
ROTOCOLS ANDC
OMPOUNDSC
HARACTERISATION... 106
10.1. Antioxidants Protocols
... 106
10.1.1. DPPH Test ... 106
viii
10.2. Dermatophytes Experimental Protocols
... 108
10.3. 5-Lipoxygenase Protocols
... 109
10.3.1. Human Recombinant 5-LO Expression and Purification ... 109
10.3.2. Activity Assay for Human Recombinant 5-LO ... 110
10.3.3. Determination of 5-LO Product Formation in Neutrophils ... 110
10.4. Cytotoxicity assays
... 110
10.5. General Synthetic Procedures and Compounds Characterisation
... 111
10.5.1. Di-acetylation General Procedure... 112
10.5.2. Esters Derivatives Synthesis: Method A. ... 112
10.5.3. Esters Derivatives Synthesis: Method B ... 112
10.5.4. Synthesis of Triazole Derivatives: ... 122
11.
A
PPENDIXL
OGP ... 154
ix
Abbreviation and Acronyms
Α Selectivity factor
AA Amino acids
A.C Artheroderma cajetani
AMD Automated Multiple Development ARA Arachidonic acid
ARE Antioxidant responsive element BTF Trifluorotoluene
CuAAC Copper catalysed azide–alkyne cycloaddition COX Cyclooxygenase
DCC Dicylohexylcarbodiimide DCM Dichloromethane
DMAP Dimethylaminopyridine
DETAPAC Diethylenetriaminepentaacetic acid DMSO Dimethyl sulfoxide
DIPEA N,N-Diisopropylethylamine DMPD Dimethyl-4-phenylenediamine DPPH 2,2-Diphenyl-1-picrylhydrazyl DPPH• 2,2-Diphenyl-1-picrylhydrazyl radical ε° Power of adsorption EC Endothelial cells
EC50 Half maximal effective concentration
EDTA Ethylenediaminetetraacetic acid EETs Epoxy-eicosa-tetraenoic acids
E.f Epidermophyton floccosum
eq. Equivalents
ET Single electron transfer
FAO Food and Agriculture Organization FBS Foetal Bovine Serum
FCR Folin–Ciocolateau
x
FLAP 5-Lipoxygenase activating protein FOS Fructo-oligosaccharides
FRAP Ferric reducing antioxidant power GSH Glutathione peroxidase
HAT Hydrogen atom transfer
HETP Equivalent Height of Theoretical Plates HPLC High Performance Liquid Chromatography HPTLC High Performance Thin Layer Chromatography HRMS High Resolution Mass Spectrometry
IE-HPLC Ion Exchange High Performance Liquid Chromatography
IC50 Half maximal inhibitory concentration
IOU Inhibited Oxygen Uptake K Partition coefficient k’ Retention factor k Velocity constant LG Leaving group LXs Lipoxines 5-LO 5-Lipoxygenase Log P Partition coefficient
LTs Leukotrienes
mPGEs Microsomal associated prostaglandine E synthase
M.c Microsporum canis
M.g Microsporum gypseum
MOM Methoxymethyl
N Number of theoretical plates NOS Nitric oxide synthase
OPLC Over Pressured Layer Chromatography ORAC Oxygen Radical Absorbance Capacity P’ Polarity parameter
PEC Planar Electro Chromatography PBP Polar Bonded Phase
xi
PMNL Human polymorphonuclear cells r Optimisation parameter
Rf Retention factor
RPC Rotation Planar Chromatography
RP-HPLC Reverse Phase High Performance Liquid Chromatography
ROS Radical Oxygen Species RNS Reactive Nitrogen Species
Rs Resolution
rt Room temperature
S Separation factor
SAR Structure–Activity Relationship SEM [2-(Trimethylsilyl)ethoxy]methyl SDA Sabouraud Dextrose Agar
SOD Superoxide dismutase TBS tert-Butyldimethylsilyl
TE Trolox Equivalent
TEAC Trolox Equivalent Antioxidant Capacity TIPS Triisopropylsilyl
TLC Thin Layer Chromatography TPTZ 2,4,6 tripyrididyl-s-triazine
TRAP Total Radical Antioxidant trapping Parameter
T.m Trichophyton mentagrophytes
T.r Trichophyton rubrum
T.t Trichophyton tonsurans
T.v Trichophyton violaceum
1
Phytochemicals
The term phytochemicals refers to chemical compounds derived from plants, (phyto derives from ancient Greek meaning plant), able to exert a beneficial effect on human health.
Phytochemical is a definition that was made up from pharmaceuticals and nutrition1 because they are contained mainly in edible plants, thus they can also be defined as food or part of food that improves human health preventing or healing disease.2 Classes of phytochemicals include alkaloids, phenolic compounds, carbohydrates, organic acids and vitamins and they are used in the nutraceuticals industry as components in food supplements.
They have gained an increasing amount of attention over the last few years given their recognised health benefits, their availability from sustainable sources and the fact that the food supplement market, in which they are largely employed, it is quickly growing because they are not classified as drugs and they do not need to undergo complex pattern for regulatory approval.
This opens up an issue related to fraudulent products with a non-defined or fake composition.3
In the work herein presented, two of the main classes of phytochemicals were considered:
Soluble fibre (carbohydrate polymers such as fructo-oligosaccharides) and their novel characterisation methods
Polyphenols derived from consumable sources: structure–activity relationship (SAR) studies of their semi-synthetic analogues
The application and development of innovative methods for the characterisation of bio-polymers (soluble fibre) is crucial, primarily for the food and nutraceutical industry given the lack of rapid and efficient analytical methods for the quality control of those phytochemicals in foodstuff.
It is a compelling issue especially giving that the presence of soluble fibre is used to claim prebiotic activity for the food product. It is worth mentioning that the term soluble fibre is specific to certain structures classes e.g. inulins and fructo-oligosaccharides etc.
2
Characterisation of such materials, up until now, has been done by mass difference. However, it is clear that this cannot be sufficient to support their presence and the claims associated with it in nutraceuticals and foodstuff and so precise analytical methods and more precise characterisation is essential.
Thus the first part of this work focuses on the application of a novel High Performance Thin Layer Chromatography (HPTLC) based method which was developed using samples of Adansonia digitata fruit pulp to demonstrate this approach given the reported prebiotic activity of this essential food.
The second part of this thesis focuses instead on structure–activity relationship studies of food phytochemicals and their semisynthetic analogues on selected targets. Within that research line new polyphenol analogues were designed, synthesised and evaluated on different targets in order to determine their potential as multi-target compounds.
Polyphenols have attracted great interest in the field of medicinal chemistry considering their reported anti-cancer, anti-inflammatory, anti-oxidant, anti-artherosclerotic properties, as well as neuro- and cardio-protective activities. They have been used in prebiotics, pharmaceuticals, cosmetics, nutraceuticals and can be extracted from renewable sources such as tea leafs, grapes, cocoa seeds and vegetables. Unfortunately, due to their poor solubility properties in aqueous media and rapid in vivo metabolic breakdown they are yet to be exploited to their full potential.
The fact that they have not exploited to their full potential yet, make this class of phytochemicals interesting to work on, in order to try to solve the discussed issues related with them and to expand the project scope further.
3
1. Introduction to Novel Characterisation Methods in Phytochemicals
1.1. History of Chromatography
Until the 1930’s, adsorption chromatography technique conceived by Tswett (1872-1919), was the method commonly used in the analysis of natural extracts. The necessity of having a quick method to identify the different components of the mixture under analysis led to the invention, by Izmailov and Shraiber in 1938, of an “open” chromatographic method – thin layer chromatography (TLC). In 1944 Consden et al. changed the approach to partition chromatography using paper,4 which from that moment onwards quickly became universally used as stationary phase. In 1951, Kirchen and coworkers then introduced a fluorescent indicator in the stationary phase, which led to silica gel becoming the new preferred stationary phase for TLC. The term thin layer chromatography was created by Stahl in 1956 and from there Merck created other kind of thin layers to be used as stationary phase, such as aluminium oxide layers. It is at the end of the 1970’s that High Performance Thin Layer was commercialised and thus the technique HPTLC started to develop from 1987 when Geiss published the manual “Fundamentals of Thin-layer
Chromatography” and in 1988 the Journal of Planar Chromatography was born. 1.2. Chromatography Theoretical Principles
The first principle underlying chromatography is the “affinity” that the analytes contained in the samples move in the system in relation to their affinity towards the mobile and stationary phase. Each analyte in a given chromatographic system has a partition coefficient K (Equation 1.2.1Equation 1.2.1) that is the ratio between the substance concentration in the stationary phase (Cs) and the mobile phase (Cm).
K= Cs/Cm
Equation 1.2.1 Calculating the partition coefficient.
Assuming that the sample provided is soluble in both phases, it would distribute itself between the two until reaching the partition equilibrium. Although it can appear that the substances move with a different speeds, in reality and in accordance with the solubility of each analyte in the mobile phase, some substances will leave the column faster than others (most soluble in the eluent are less retained by the stationary phase). This results in shorter retention times in High Performance Liquid Chromatography (HPLC) or advancing to
Formattato: Tipo di carattere: 12
4
higher retention factor, Rf,* values on TLC plates. Substances which possess higher
solubility in the eluent, migrate less often per unit time.
In thin layer chromatography several factors contribute to determine the Rf suchas:
1. Dimension and model of the chamber
2. Composition and dimension of the thin layer 3. Flux direction of the mobile phase
4. Volume and composition of eluent 5. Humidity
6. Sample preparation
The most relevant mechanism in TLC are the following:
1.2.1. Adsorption
The stationary phase is generally a solid (although it can occasionally be an immobilised layer of liquid) and on the surface the analyte interacts either specifically or non-specifically. The degree of retention depends on the functional groups on each analyte and on their steric structure. In “normal phase chromatography” the mobile phase is less polar than the stationary. There are two models explaining the mechanism of adsorption chromatography. According to the model of Snyder5 and Soczewinskithe,6 the mobile phase competes with the analytes to be retained by the thin layer and the samples displace the eluent molecules from the adsorption site on the stationary phase. The model of Scott and Kucera,7 instead, shift the focus on the interaction between the mobile phase and the sample. Both models are valid mainly depending on the composition of the eluent.
1.2.2. Partition
Partition chromatography is based on the different solubility of the substances in the samples in two immiscible liquid phases. The stationary liquid phase is immobilised on a solid usually porous support, either by absorption or chemical bonds. In the case of using
polar bonded phase (PBP) such as a diol bonded phase (useful for carbohydrates) the
mechanism is more complicated and adsorption must be considered as well.
* R
5
1.2.3. Complex Formation
The retention principle is another possible mechanism and it is based on the reversible formation of coordinated complexes between Lewis acids and bases. This system is particularly useful in separating compounds according to the degree of saturated bonds or steric effects (chiral compounds can also be separated through complex formation). In this type of chromatography, the stationary phase can be impregnated with Lewis acids, such as metal ions. Other separation mechanism include:
Ion-exchange chromatography Size exclusion chromatography Inclusion chromatography
1.3. Thin Layer Chromatography
1.3.1. Planar Chromatography
High Performance Thin Layer Chromatography (HPTLC) is the most recent application of planar chromatography and together with column chromatography is a developing field. The stationary phase in TLC is a thin layer of solid material immobilised on a plain support.
Is common to place the TLC plate vertically in the TLC closed chamber with the eluent – the mobile phase exploits the capillary forces to proceed on the stationary phase and move the analytes along it until the plate is removed from the chamber. Capillary forces are weak and generated by the eluents decrease in free energy when it starts interacting with the porous matrix of the TLC plate.
The research on TLC has recently produced new technologies (Figure 1.3.1Figure 1.3.1) to enable the technique not only to become more reproducible and efficient but also to enable quantitative as well as qualitative analysis. The stationary phase, sample deposition, elution and detection are critical points and thus several tools to better control these steps have been introduced, such as:
High performance thin layer plates which have the same characteristic of stationary phase of HPLC columns
Automated tools for sample deposition New elution systems
Formattato: Tipo di carattere: 12
6
New techniques for plate analysis, such as densitometry (which also enables quantitative analysis)
The main innovations in terms of elution phase has been AMD (Automated Multiple Development) in which the developing chamber is hermetically sealed and the environment is controlled under an atmosphere of nitrogen. This is in order to avoid the contact with oxygen which could induce the eventual oxidation of the analytes. Furthermore, this controlled atmosphere prevents the eventual adsorption of water on the thin layer (due to humidity) which could affect the separating ability of the thin layer. This technology also enables very high efficiency through the possibility of realising multi-step gradients as the one presented in this dissertation.
Another innovation in modern TLC is given by the forced flow systems that enable the user to increase the speed of the flow or to keep it constant.
OPLC (Over Pressured Layer Chromatography) was introduced in the 1980’s. In this
technique, an inflatable cushion exerts an adjustable pressure on the TLC plate and a pump pushes the mobile phase through the stationary. This enables optimisation of the flow speed and removal of the vapour phase from the system.
HPTLC (High Performance Thin Layer Chromatography) use the pressure to move the
mobile phase.
In RPC (Rotation Planar Chromatography), the plate of the stationary phase is round. The sample can also be applied inline with the mobile phase besides applying it before the development as in the other TLC technique. The development mode can proceed from the centre of the plate outwards or from the outside towards the centre.8
Among the forced flow methods PEC (Planar Electro Chromatography) should be mentioned as another recent development. It is based on an electroosmotic flow technique generated applying an electric field along the chromatographic system. To date, this is used only in the characterisation of ideal mixture.9
7
Figure 1.3.1 Planar Chromatography techniques: TLC (Thin Layer Chromatography); HPTLC (High
Performance Thin Layer Chromatography); AMD (Automated Multiple Development); RPC (Rotation Planar Chromatography); OPLC (Over Pressure Thin Layer Circular Chromatography); PEC (Planar Electro
Chromatography); RPC (Rotation Planar Chromatography).
1.3.2. Chromatographic Parameters
Some of the fundamental parameters in TLC, beside the retention factor Rf are:
Partition coefficient K Retention factor k’ Selectivity factor Separation efficiency
Equivalent height of theoretical plates (HETP) Number of theoretical plates (N)
Resolution Rs Separation factor (S) Optimisation parameter r Velocity constant k
The partition coefficient K is a thermodynamic constant which describes the partition equilibrium between the mobile phase and the stationary phase of a given analyte A (Equation 1.3.1Equation 1.3.1).
CAPILLARY FLOW FORCED FLOW
TLC HPTLC RPC OPLC HPTLC PEC AMD
Planar
Chromatography
Formattato: Tipo di carattere: 12
8
K = [Astationary]/[Amobile]
Equation 1.3.1 Equation for the partition coefficient.
The retention time k’ is, instead, a kinetic constant, which can be experimentally determined. It describes the speed of analytes along a chromatographic system. It is defined as the ratio between the time that the solute spends in the mobile phase and the time it spends in the stationary phase. It can also be described as the ratio between the amounts of solute in the two phases in a precise moment.
In planar chromatography, to efficiently separate two compounds, the chromatographic system must be selective and the compounds need to be retained to a different extent. This means that the partition coefficients of the species under analysis have to be sufficiently different to result in a selectivity factor higher than 1.
The selectivity factor α is described as the ratio between the partition coefficient of the two species under analysis, and K1 > K2 (Equation 1.3.2Equation 1.3.2). Thus factor is
always > 1.
K1 / K2
Equation 1.3.2 Equation for the selectivity factor α.
The separating efficiency in chromatography, also depends on the band widening – the wider the band the lower the separation efficiency. Band widening is a phenomenon dependent on several factors such as turbulent and molecular diffusion, mass transfer effects and retention mechanism of solute that is specific of any system mobile phase/solute/stationary phase.
Each of the effects mentioned above are more or less determined according to the characteristic of the chromatographic system.
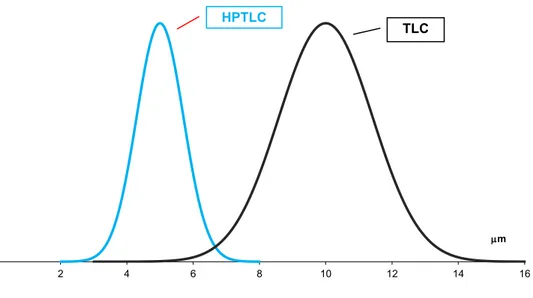
The band widening in TLC means an increase of the surface area of the spots, in capillary flow conditions the determining factors are connected to the dimensional distribution and the average size of the stationary phase. If the particles have an average size around 12 µm and are characterised by irregular shape and distribution, the band widening depends on the packing quality, related to the turbulent movements and to the mass transfer process that are particularly slow. The efficiency in this case is limited by the entity of those effects.
Formattato: Tipo di carattere: 12
9
In stationary phases characterised by smaller particle size, with homogenous distribution and spheric shape (high performance thin layers) and short migration distances the phenomenon is regulated only by the particle size (optimal particle size are around 5-6 µm).
The development of high performance thin layers has enabled thin layer chromatography to discuss separation efficiency through the following concepts: HEPT the height of the theoretical plates† and the number of theoretical plates (Equation 1.3.3Equation 1.3.3).
𝐍 = 𝐿 H
Equation 1.3.3Number of theoretical plates as ratio between migration distance of mobile phase L, and height of theoretical plates H.
The theoretical plate number depends on the migration distance of the mobile phase, migration distance of solute and on the amplitude of the spot in the direction of the development. The packing and the particle size of the stationary phase are critical for band broadening during analysis. HEPT can also be seen as the ability of the system to reduce band broadening giving narrow bands.
Fundamental in chromatography is the Van Deemeter Equation (Equation 1.3.4Equation 1.3.4) as it links the different factors contributing to band broadening.
𝐇 =A + B 𝑢 + C∙ 𝑢
Equation 1.3.4 Van Deemeter equation.
In the above equation, H is the height equivalent to a theoretical plate, A is constant term dependent on the average particle size and homogeneity of the stationary phase and C is constant and is related to longitudinal diffusion (it becomes less relevant with the increase of u which is the flow speed in cm/s). The term C instead is related to stationary phase mass transfer.
Given that in HPTLC the particle size is reduced and homogeneity increased compared to a conventional TLC plate, the band broadening is reduced (Figure 1.3.2Figure 1.3.2).
† The height of theoretical plates (HETP) is the ability of a chromatographic system to generate sharp peaks
Formattato: Tipo di carattere: 12
pt, Non Grassetto, Non Corsivo
Formattato: Tipo di carattere: 12
pt, Non Grassetto
Formattato: Tipo di carattere: 12
10
Figure 1.3.2Particle size distribution of the stationary phase in HPTLC and TLC.
The flow also depends on the stationary phase as well as the characteristic of the mobile phase and for this reason, the effect of varying the mobile phase has on the eluent strength is studied in the optimisation of the gradient.10
Another parameter to take into account is the resolution Rs between two peaks in the chromatogram, which express the separation between two compounds.
It depends on selectivity factor α, plate number N and k’ capacity factor (Equation 1.3.5Equation 1.3.5). In general, it is the combination of stationary and mobile phase to determine the system resolution.
𝐑𝒔 = 1 4⁄ (𝛼 − 1)𝑁1⁄2(𝑘 ′
1 + 𝑘′
⁄ )
Equation 1.3.5 Equation for the resolution Rs.
1.3.3. Stationary Phase
In thin layer chromatography, the stationary phase involves two principles: adsorption and partition. In adsorption chromatography, the two main factors determining the activity of the stationary phase are the dimension of the area of the activated surface and the surface energy for surface unit. The activated area affects the number of adsorption process that can happen, all together, and effect of the deactivators on separation. The wider the activated area the lower the deactivators. For hydrophilic stationary phase (as for silica gel or alumina), the main deactivator is water.
0 2 4 6 8 10 12 14 16 mm
TLC HPTLC
Formattato: Tipo di carattere: 12
11
Variation in the activated surface area can affect:
Spots dimension Rf values
Selectivity
Speed migration of eluent front
The position relative to multiple fronts that are often formed when the mobile phase is constituted of several solvents
The surface energy affects the strength of the adsorption interaction and it is generally assumed that this value is independent from the surface activated area. However, its average value for surface unit decreases with increasing the deactivation’s effect. The surface energy reaches a stable value when 20 to 50% of the active sites have been deactivated. The highest energetic sites are the ones that are deactivated first. The Snyder equation relates the activities of stationary phase with characteristics of the analyte and solvent.11
It shows that separation efficacy is strongly dependent on:
Particle size (µm)
Specific surface area (m2/g)
Diameter (Ǻ) and pores volume (mL/g)
The most common adsorbing material used (~80% of cases) is silica gel. Its activated surface contains free silanol groups (-Si-OH), which are responsible for the polar characteristics of silica layer, and siloxanes groups (-Si-O-Si-). Silica 60 most widely used and has an average pore diameter of 60 Å.
Alumina is another stationary phase commonly used (for acid sensitive compounds). It is highly polar and possesses characteristics of both cationic and anionic exchange. Stationary phase for partition chromatography are generally modified (Figure 1.3.3Figure 1.3.3). – Si – OH + Cl – Si – R CH3 CH3 – Si – O – Si –R CH3 CH3
Formattato: Tipo di carattere: 12
12
Figure 1.3.3 Modified stationary phase.
R can either be an alkyl group, for hydrophobically modified (reversed phase, RP) layers, or a substituted alkyl group in the case of hydrophilic thin layers.
The main alkyl groups in reversed phase are methyl, octyl, dodecyl, octadecyl. The hydrophobic character of those phases depends on chain length and on substituent R, the longest the less polar, and from the degree of modification of the support (its degree of porosity affects the efficiency of substitution).
The R of the hydrophilic modified thin layers instead are functional groups of different polarity, such as the ciano (– C2H4CN), the diol (– C3H6OCH2CHOHCH2OH) and the
amino groups (– C3H6NH2 ).12
1.4. Development Solvent
The characteristics that the development solvent should possess are purity grade, chemical stability, low viscosity and easy handling. During the solvent selection process, its strength and selectivity must be considered. Solvent strength is defined by three main parameters: Hildebrand solubility parameter (δ), power of absorption (ε°), and polarity parameter (P’).
Hildebrand solubility parameter constitutes a measure of the degree of molecular interaction (Van Der Waals) of the solvent. It represents the density of cohesive energy (c) of the solvent and is experimentally obtained through Equation 1.4.1Equation 1.4.1, in which H is the vaporisation heat, R the fundamental gas constant, T the boiling point of the solvent, Vm the molar volume of the solvent.13
m V RT ΔH c δ
Equation 1.4.1 Hildebrand solubility parameter.
The power of absorption ε° is the main parameter to consider in adsorption chromatography. Snyder defined in Equation 1.4.2Equation 1.4.2, where ESa refers to the
adsorption energy and As is the molecular surface occupied by the solvent.
S Sa A E ε
Formattato: Tipo di carattere: 12
pt, Non Grassetto
Formattato: Tipo di carattere: 12
13
Equation 1.4.2 Equation for the power of absorption factor εo.
In Snyders definition it is assumed that the adsorbent surface is completely occupied with solvent (S) and solute (X) and compete with one another according to the equilibrium reported in Equation 1.4.3Equation 1.4.3. In Equation 1.4.3Equation 1.4.3, Xa and Sa refer
to adsorbed molecules of solute and solvent respectively, whereas Xm and Sm refer to
molecule that have not been adsorbed of solute and solvent respectively.
n Sa + Xm Xa + n Sm
Equation 1.4.3 Adsorption equilibrium.
The overall retention equation in adsorption chromatography is shown below (Equation 1.4.4Equation 1.4.4). Vm X AX Wa Va Rm log
Equation 1.4.4 Retention equation used in adsorption chromatography.
The highest interactions between the solute and the adsorbent will result in a higher Rm and consequently the constant k’, and lower Rf. The optimal value for k’ is between 2 and 5 for a bi-component sample and between 0.5 and 20 for a multi-component sample.
The parameter most widely used in partition chromatography (although it is also used in adsorption chromatography) is the polarity parameter P’, experimentally defined as the sum of the solubility’s in the solvent under examination of three standard molecules: ethylic alcohol (hydrogen donor), dioxane (hydrogen acceptor) and nitromethane (high dipole moment). It can range between -2 and 10.2 (which is water polarity).
It is common practice to use a mixture of solvents in order to adjust the eluent strength for specific applications. P’ in a mixture of n components is defined according to Equation 1.4.5Equation 1.4.5, where Φ is the volume fraction of the compounds and P’i is the mean of the polarity of the pure components.
i n i i P
1 'Formattato: Tipo di carattere: 12
pt, Non Grassetto, Non Corsivo
Formattato: Tipo di carattere: 12
pt, Non Grassetto, Non Corsivo
Formattato: Tipo di carattere: 12
pt, Non Grassetto
Formattato: Tipo di carattere: 12
14
Equation 1.4.5 Equation for the mean polarity of pure components.
It is worth mentioning that the solvent strength depends on the interactions with the stationary phase and it increases with its polarity in normal phase chromatography (instead in reverse phase it decreases).14,15
Solvent selectivity is determined by molecular interactions and can affect the separating efficiency power through polarity and hydrogen bonds. The dispersion forces cause fluctuant polarisation constantly moving on the molecular surface, which induce weak attractive forces. These are the only components of the molecular interaction of polar solvents. The degree of polarity that the temporary dipoles confer to a molecule are related to the surface area, thus the bigger the molecule the bigger the interactions.
Hydrogen bonds can instead be evaluated from the point of view of the interactions between electron-donors and electron-acceptors and the reactivity can be described of Lewis acid-base. A practical method to represent the total composition is the construction of a selectivity triangle.
Assuming that the Hildebrand value δ is the same for all substances it can also be assumed that the solubility characteristic of compounds are determined not from the differences in the total value of but from the contribution related to the three interactions forces that compose it.
T = D + P + H
Equation 1.4.6 Hildebrand total parameter.
In Equation 1.4.6Equation 1.4.6, T is the Hildebrand total parameter, D is the dispersion
component, P polar component and H hydrogen component. Based on this hypothesis, the
fractional parameters f (Equation 1.4.7Equation 1.4.7) which represent the percentage contribution to the three components are reported on the side of a triangle.
H P D D D f H P D P P f H P D H H f
Equation 1.4.7 Equations for the three components.
In this way, it is possible to obtain a selectivity triangle in which each spot of the area represent a precise force composition. The Teas triangle (Figure 1.4.1Figure 1.4.1) has a theoretical meaning more than a practical one. This because solvents are not all equivalent
Formattato: Tipo di carattere: 12
pt, Non Grassetto
Formattato: Tipo di carattere: 12
pt, Non Grassetto
Formattato: Tipo di carattere: 12
15
and so the solvents localisation in the triangle needs to be adjusted with experimental results. The triangle is mainly an empirical system.
Figure 1.4.1 Teas triangle.
Snyder has described a triangular selectivity of solvents as well. Its definition takes into account the dipolar interaction, proton-acceptor and proton-donor characteristics, which are the parameters that define the polarity parameter P’. Relating to these parameters the fractional values x that locate the solvents on the triangle are xd, xa and xn (Equation 1.4.8Equation 1.4.8). P' donor) -(H solubility ethanol xd P' acceptor) -(H solubility dioxane xa P' (dipol) methane -solubility -nitro xn
Equation 1.4.8 Synders equations for solvent selectivity.
DISPERSION
DIPOLE
HYDROGEN BOND fD
fP
fH
Formattato: Tipo di carattere: 12
pt, Non Grassetto, Non Corsivo, Colore carattere: Automatico
16
Snyder also classified the solvents into eight selectivity classes (Figure 1.4.2Figure 1.4.2).
TOLUENE VII DCM V VI ACN III THF MTBE I METHANOL II FORMAMIDE IV VIII CHLOROFORM DIPOLE xn H-ACCEPTOR xa H-DONOR xd
Figure 1.4.2 Synders classification of solvents.
In order to choose the correct solvent mixture for a separation, the optimal strength is detected and subsequently the selectivity of the solvents is considered.
1.5. Modern Planar Chromatography
As previously mentioned, critical steps in Thin Layer Chromatography are: sample deposition, elution, derivatisation and detection. With modern planar chromatography techniques, these steps are automated which enables optimisation and reproducibility of the technique.
Deposition happens by means of a microsyringe which enables the deposition of thin bands which are characterised by fixed length and homogenous distribution, small amount of sample (1-5 µL), thus avoiding overloading of the samples that would affect resolution and efficiency. This deposition method is a “spray-on” method (the solvent completely evaporates during the process) and deposition of samples through this automated method make the separation efficacy independent from the
nature of the solvent. This also enables the operator Figure 1.5.1 Linomat 5 apparatus.
Formattato: Tipo di carattere: 12
17
to deposit multiple times along the same band if needed, which is very useful especially if the standard’s addition method mast be used.
Another advantage of using the automated depositor CAMAG Linomat 5 (Figure 1.5.1) is the opportunity to start from a single diluted solution and deposit different traces at different concentrations, generating multi-level calibrations with a noteworthy time saving. The sample deposited through the CAMAG Linomat 5 is nebulised in nitrogen flux. The dimension of the band, the volume of the deposited sample, the distance between the borders of the plate and the traces can be selected and saved to be reproduced iterative times.
In the elution process, using the Automated Multiple Developer (Figure 1.5.2Figure 1.5.2) offers several advantages. The TLC plate is placed in an isolated and closed chamber under nitrogen atmosphere. This avoids the condensation of molecules of mobile phase on the thin layer affecting the development and it enables the speed of solvent front to become independent from the saturation degree of the vapour phase. Operating in controlled atmosphere also enables to avoid the deactivation effects exerted by water molecules due to humidity and it enables better separation efficiency and higher reproducibility.
Figure 1.5.2 AMD apparatus.
The main advantage of the AMD is the possibility of ameliorating the resolution through band concentration. It enables the automated development following a multi-step gradient, in which the solvent strength decrease increasing the number of elution and this decrease is combined with an increase of the development distance.
Formattato: Tipo di carattere: 12
18
The separating ability of this technique is comparable with HPLC methods and separation can be refined for each segment of the chromatogram. In planar chromatography it is possible to perform mono and bi-dimensional separations. In the first case, the TLC plate is developed up to a chosen length for chosen times before the development is stopped and solvent removed (the elution process takes place
several times). This strategy, used in the separation of complex matrices, allows the variation of experimental parameters such as plate length, mobile phase composition in each development and the number of developments.
Weak eluents are necessary to separate substances that are less retained whereas components strongly retained are separated using stronger eluents.
An important characteristic of the development process is the concentration mechanism of the bands, which increase
the efficiency of the layer counteracting the diffusion process of the zone. Each time the stationary phase compress the spot in the direction of the development, the spots that are initially round in shape, gradually turns to oval and eventually turns to be a thin band. This happens because the mobile phase firstly interacts with the molecules in the bottom portion of the spot, starting moving them, when the eluent front surpass the concentrated spot, this migrates and enlarge according the same mechanism common to thin layer chromatography.
The derivatisation of the plates is performed through Chromatogram Immersion Device III from CAMAG (Figure 1.5.3) which is an instrument composed of a dipping apparatus controlled by a timer which dips the TLC plate in a dipping chamber, enabling an homogenous and more reproducible method for derivatisation compared to the spray method normally used.
As a detection system, modern chromatography utilises densitometry scanning, which is a technique that enables not only qualitative but also quantitative determination. The instrument used is a CAMAG TLC Scanner 3 (Figure 1.5.4Figure 1.5.4) interfaced with the software winCATS. According to the signals registered (absorbance or fluorescence) it produces a densitogram which is similar to a chromatogram where the peak maximum corresponds to the maximal density of the spot on the plate.
Figure 1.5.3 Immersion device
III.
Formattato: Tipo di carattere: 12
19 Light sources
Lamp’s selector
Input of lenses system: transmission
range 190 – 800 nm
Input gap of monochromator
Reflection grid
Monochromator :bandwidth 5
or 20 nm
mirror
Disc with gap
Specchio
Lens System: to select micro and
macro slits Reference Photomultiplier Radius separator Measurement photomultiplier reflectance at 30° TLC plate Measurement photodiode
Figure 1.5.4 Scheme of action mechanism of Scanner 3D.
Taking into account that samples are adsorbed and dispersed in a solid matrix are able to cause light scattering, the instrument generally works by reflectance and not through transmittance. The Beer–Lambert linear expression is not usable. Normally the non-linear Kulbeka–Munk is used in HPTLC, (Equation 1.5.1Equation 1.5.1) where R is the
reflectance of an opaque layer infinitely thick, S is the scattering coefficient, ε is the molar adsorption coefficient of analyte and c is the analyte concentration.16,17
S C R R 2.303
2 1Equation 1.5.1 Kulbeka-Munk equation.
The fluorescence measurement has a low background noise and the signal is a linear function of the quantity of sample in a concentration range between two and three orders of size. The equation in this case is shown in Equation 1.5.2Equation 1.5.2, where F is defined as the intensity of fluorescence, is the quantum yield, I0 is the excitation source, ε is the adsorption coefficient, b is the TLC thickness and c is the sample quantity.
C
b
I
o
F
Formattato: Tipo di carattere: 12
pt, Non Grassetto
Formattato: Tipo di carattere: 12
20
Equation 1.5.2 Equation for fluorescence measurement.
1.6. Adansonia Digitata and Prebiotics
The African Baobab (A. digitata) is a tree that belongs to the Bombacaceae family, gender
Adansonia, specie Digitata and it spontaneously grows in Africa (one species), in Australia
(one species) and in Madagascar (six species). The various species differ in the morphological characteristics of the flower. The Adansonia digitata fruit pulp is mainly used as food due to its high nutritional properties, (energetic value 200 kcal/100g and 836 kJ/100g). Baobab fruit pulp is 10-45 cm long and 8-15 cm large and it is covered by a hard shell (the shell has an ovoid or cylindrical irregular shape).
It is composed of a ligneous, hard and capsule-shape epicarp and it is also covered by green-yellow hair, the endocarp of the fruit constitutes its pulp.
The endocarp of ripe Baobab fruit appears off-white dehydrate and powdered and it has a characteristic acidic taste due to the presence of organic acids such as: citric acid, tartaric acid, malic acid and succinic acid. Several parts of it are used daily in the diet of rural communities in West Africa as reported by Brady (2011).18 To support its use and as proof of Baobab relevance as multi-purpose specie, it is worth mentioning that the Forestry Department of the Food and Agriculture Organization (FAO) of the UN has reported information on A. digitata (FAO 1988).19 The main reason for its use as a nutritional foodstuff and the relevance for the food industry, resides in its high nutritional values, due to the high fibre content, carbohydrates and high antioxidants content.20,21
The fruit pulp is also used in the traditional medicine for its prebiotic activity.22 The term prebiotic refers to a non-digestible food ingredient able to beneficially affect the host by selectively stimulating the growth and/or activity of a limited number of bacteria in the colon leading to improvement of the host’s health.23
Roberfroid24 revisited the concept and concluded that prebiotics should be evaluated according to three criteria:
Non-digestibility,
Fermentation by intestinal microflora,
21
Increasing the assumption that Baobab dry pulp leads to an increase of bifidobacteria population and lactic bacteria,25 the gut microflora is capable of using complex sugars such as oligosaccharides‡ such as inulins and fructo-oligosaccharides§ (Figure 1.6.1) and xylo-oligosaccharides**,26 (Figure 1.6.2) as a source of carbon.
‡ Oligosaccharides are carbohydrates with a polymerisation degree ranging from 2 to 10 monomeric units. § Fructo-oligosaccharides (FOS) are carbohydrates composed of glucose and fructose subunits with a polymerisation degree between 3 and 10.
** Xylo-oligosaccharides (XOS) are xylose polymers connected through β-1-4 composing the hemicellulose of the plants cell wall. They have a polymerisation degree between 2 and 10 and they are known as
xylobiose, xylotriose, and so on. Xylobiose (DP = 2) is considered to be a xylo-oligosaccharide in food applications.
22
2. Novel Characterisation Methods Applied to Phytochemicals: Aims
and Background
This first portion of this dissertation focuses on novel characterisation methods applied to phytochemicals. In particular, a new approach to bio-polymer (soluble fibre) determination was developed by means of High Performance Thin Layer Chromatography (HPTLC). Quality control is an important issue in the food industry; however, the lack of rapid and efficient analytical methods often hinders adequate and efficient characterisation of foodstuffs. The aim of this research was to apply a recently developed precise, reliable and green method for the qualitative characterisation of oligosaccharides in complex plant matrices, using Adansonia digitata as a case study.
In the food industry, it is common practice to provide technical data sheets wherein information on soluble fibre is given as a difference in mass from other components (fat, proteins, etc.). Identifying the presence of certain soluble fibres in foodstuffs is important as this is often used to claim prebiotic activity for the product.
Considering that the expression “soluble fibre” is used to refer to specific structures such as inulins, fructo-oligosaccharides, xylo-oligosaccharides etc. it is clear that the characterisation by mass difference, alone, cannot be used to support such a claim and more specific analytical methods are required.
To demonstrate the application of our novel high performance thin layer chromatography (HPTLC) method, a sample of Adansonia digitata fruit pulp due was used due to its previously reported prebiotic activity. High performance liquid chromatography (HPLC) was used in order to validate the results before and after hydrolytic treatment, obtained by HPTLC. Widely accepted solvent and solvent/ultrasound assisted based extraction methods were used or adapted for preparation of the samples.
In a second study, the samples were submitted to enzymatic digestion and, after optimisation of the enzymatic conditions, the polymer obtained was submitted to acid hydrolytic treatment in order to specifically identify their constituent components and confirm the results previously obtained.
23
3. Results and Discussion
3.1. Novel Characterisation Methods in Phytochemical Analysis
Adansonia digitata dry fruit pulp was chosen as the sample in this study due its previously
reported prebiotic activity and given the relevance it has in the support of rural community in Africa. De Caluwé et al. previously showed that increasing concentrations of baobab dry pulp led to an increase in the population of bifido-bacteria and lactic bacteria because the gut microflora is able to use complex sugars such as fructo-oligosaccharides and xylo-oligosaccharides etc. as a source of carbon.27
Furthermore, the Forestry Department of the Food and Agriculture Organization (FAO) of the UN has reported information on Adansonia digitata28 and the International Centre for Research in Agroforestry (ICRAF) continues to promote its use as a multipurpose species. It is worth mentioning that materials having low pH, high nutritional value and a relatively high content of antioxidants29 are often promoted as a nutritious foodstuffs. Up until the start of our investigations, no detailed analyses of Adansonia digitata dry fruit pulp were reported in the literature – the determination was always performed by mass difference.
Initially, the aim was to apply our newly developed method to the specific characterisation of the oligosaccharides composing the Adansonia digitata dry pulp and to validate the method on this case study.
The detailed analysis presented herein started with the extraction of one gram of accurately weighted baobab dried pulp following (or adapting) methods previously reported by Davis et al.30 and Wei et al.31 or Jaime et al.32 Samples for analysis were prepared through extraction with cold or hot water under magnetic stirring, with or without the assistance of ultrasound (Table 3.1.1Table 3.1.1).
Ultrasound has been reported as one of the most effective tools to extract polysaccharides, such as inulins, from various plants tissues,3131 whereas extractions with a mixture of
methanol/water 62.5% v/v3030 and pre-treatment with acetonitrile are reported to be useful
for the removal of free sugars.33 Extraction with ethanol/water in a ratio of 70/30 was also employed.3232 Centrifugations were performed using an ALC 4242 centrifuge at 3500 rpm.
Formattato: Tipo di carattere: 12
pt, Non Grassetto, Non Corsivo
Formattato: Rimando nota di
chiusura, Tipo di carattere: Calibri, 11 pt
Formattato: Rimando nota di
chiusura, Tipo di carattere: Calibri, 11 pt
Formattato: Rimando nota di
chiusura, Tipo di carattere: Calibri, 11 pt
24
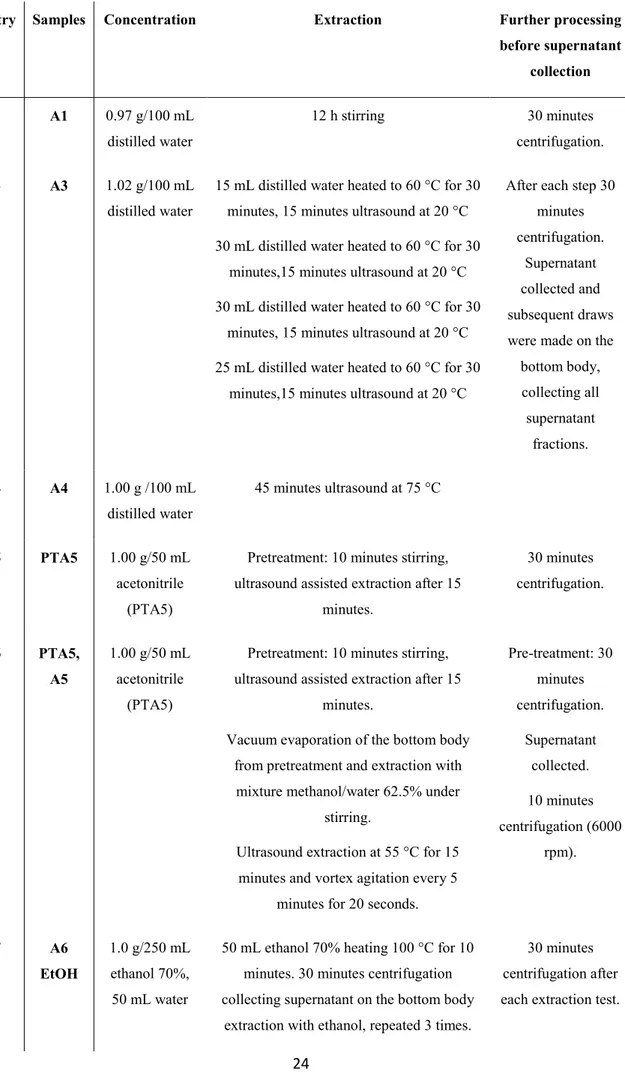
Table 3.1.1 List of samples obtained with different extracting procedures.
Entry Samples Concentration Extraction Further processing
before supernatant collection 1 A1 0.97 g/100 mL distilled water 12 h stirring 30 minutes centrifugation. 3 A3 1.02 g/100 mL distilled water
15 mL distilled water heated to 60 °C for 30 minutes, 15 minutes ultrasound at 20 °C 30 mL distilled water heated to 60 °C for 30
minutes,15 minutes ultrasound at 20 °C 30 mL distilled water heated to 60 °C for 30
minutes, 15 minutes ultrasound at 20 °C 25 mL distilled water heated to 60 °C for 30
minutes,15 minutes ultrasound at 20 °C
After each step 30 minutes centrifugation.
Supernatant collected and subsequent draws were made on the
bottom body, collecting all supernatant fractions. 4 A4 1.00 g /100 mL distilled water 45 minutes ultrasound at 75 °C 5 PTA5 1.00 g/50 mL acetonitrile (PTA5)
Pretreatment: 10 minutes stirring, ultrasound assisted extraction after 15
minutes. 30 minutes centrifugation. 6 PTA5, A5 1.00 g/50 mL acetonitrile (PTA5)
Pretreatment: 10 minutes stirring, ultrasound assisted extraction after 15
minutes.
Vacuum evaporation of the bottom body from pretreatment and extraction with
mixture methanol/water 62.5% under stirring.
Ultrasound extraction at 55 °C for 15 minutes and vortex agitation every 5
minutes for 20 seconds.
Pre-treatment: 30 minutes centrifugation. Supernatant collected. 10 minutes centrifugation (6000 rpm). 7 A6 EtOH 1.0 g/250 mL ethanol 70%, 50 mL water
50 mL ethanol 70% heating 100 °C for 10 minutes. 30 minutes centrifugation collecting supernatant on the bottom body
extraction with ethanol, repeated 3 times.
30 minutes centrifugation after each extraction test.
25
Final extraction with water at 80 °C for 10 minutes. EtOH fraction collected
8 A6 H2O 1.0 g/250 mL
ethanol 70%, 50 mL water
50 mL ethanol 70% heating 100 °C for 10 minutes. 30 minutes centrifugation collecting supernatant on the bottom body
extraction with ethanol, repeated 3 times. Final extraction with water at 80 °C for 10
minutes. H2O fraction collected
30 minutes centrifugation after each extraction test.
Refractive index (Brix index) was used to determine the dry substance, in the aqueous samples, expressed as the calculated % in w/v for the samples which were in aqueous solution. The results of analytical determinations for samples A1 (26%), A3 (32%) and A4 (21%) are reported in (Tab 3.1.2).
Table 3.1.2 Brix index for water extract solutions.
Samples Brix index (% w/v)
A1 26
A3 32
A4 21
The values obtained from the brix index measurements for samples A1 and A4 correspond to the certified concentration of soluble fibres content (Figure 3.1.1Figure 3.1.1), reported by the analysis certificate of the baobab dry fruit pulp used to prepare the samples presented in this work (Table 3.1.1Table 3.1.1). The value registered was slightly higher for sample A3 but it did not exceed the amount of soluble fibre plus sugar content according to the analysis certificate (Figure 3.1.1Figure 3.1.1) ranges between 28.3 % and 31 %.
Formattato: Tipo di carattere: 12
pt, Non Grassetto, Non Corsivo
Formattato: Tipo di carattere: 12
pt, Non Grassetto, Non Corsivo
Formattato: Tipo di carattere: 12
26
Figure 3.1.1 Dietary fibre and sugar content by analysis certificate of the dry fruit pulp used. After this first evaluation and some preliminary trials, samples obtained through the extraction procedures described in (Table 3.1.1Table 3.1.1) were loaded onto the diol HPTLC plate at volume of 1-5 and 10 µL.
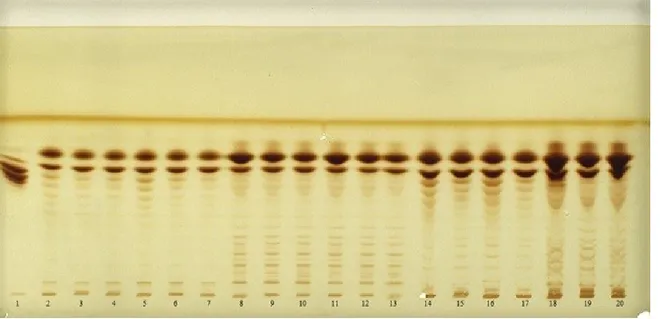
Figure 3.1.2Figure 3.1.2 shows the developed plate in which solutions of the standards at 1000 ppm were prepared in a solvent mixture acetone: water in ratio 2:1, applied and compared to samples loaded at 1 µL. The samples deposited at 5 and 10 mL were “overloaded” and subsequently, the traces showed significant tailing, thus they are not presented herein.
Figure 3.1.2 Derivatised plate for visualisation of sugars mixtures extracted.
Formattato: Tipo di carattere: 12
pt, Non Grassetto, Non Corsivo
Formattato: Tipo di carattere: 12
27
Trace one (Figure 3.1.2Figure 3.1.2) corresponds to Actilight®, trace two to a mixture of glucose/fructose in a ratio 1:1 respectively and traces three, seven and ten correspond to sucrose. Fructose and glucose, when deposited in separate solutions with the method herein described, showed the same Rf value of 0.5. Sucrose instead had an Rf of 0.47, but at this point of our study, it was not of interest to discriminate between glucose and fructose, because the main objective was to detect and separate the oligosaccharide components and not the monomeric moieties.
1 µL of the Actilight® solution was applied at a 2% (w/v) concentration. Actilight® is composed of dietary fibre and contains short chain fructo-oligosaccharides (FOS) which is a prebiotic ingredient. The standard oligosaccharides observed in trace one, include a range that goes from 0.5 µg for sucrose to 8.5 µg for nystose. Actilight standard solution was prepared at a different concentrations, in respect to other sugars taking into account that it is the result of the enzymatic synthesis process, thus the substances contained in it are not at the same concentration. A 2% w/v solution is a concentration we knew would have allowed us to visualise sucrose, the lowest concentrate substance in Actilight®. Next to the standard traces, the samples are shown: A3 in trace four, A4 in trace five, pre-treated A5 in trace six, A5 in trace eight, A6 ethanol fraction in trace nine and A6 aqueous in trace eleven. The method sensitivity is around 10 ppm for each sugar, as previously reported by Vaccari et al.,34 the detection limit has previously been extensively explained by our group with statistic data.35
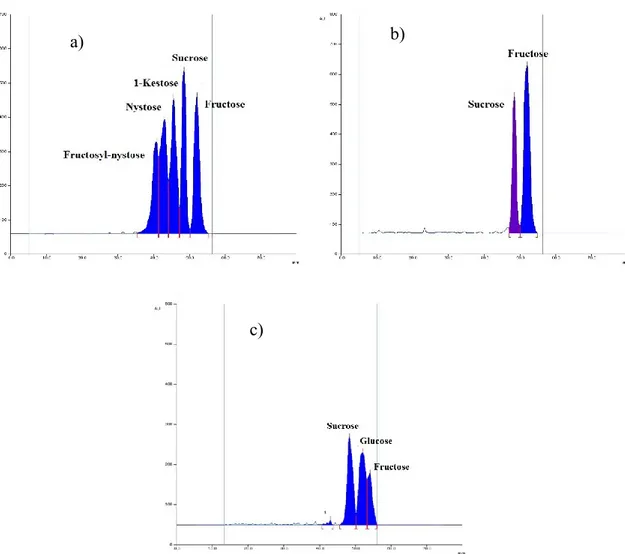
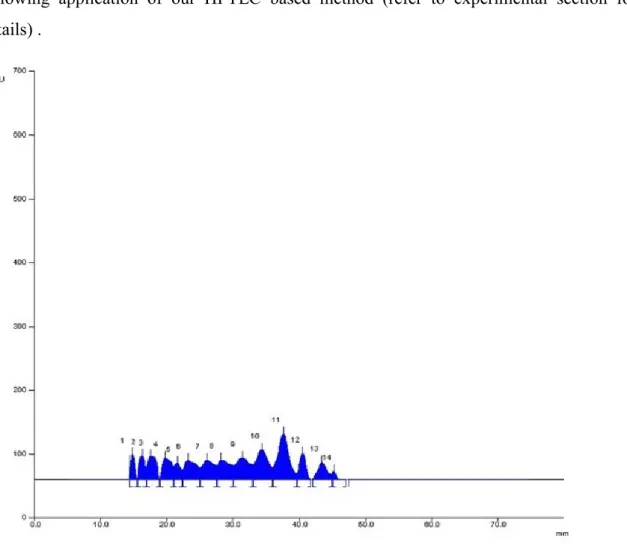
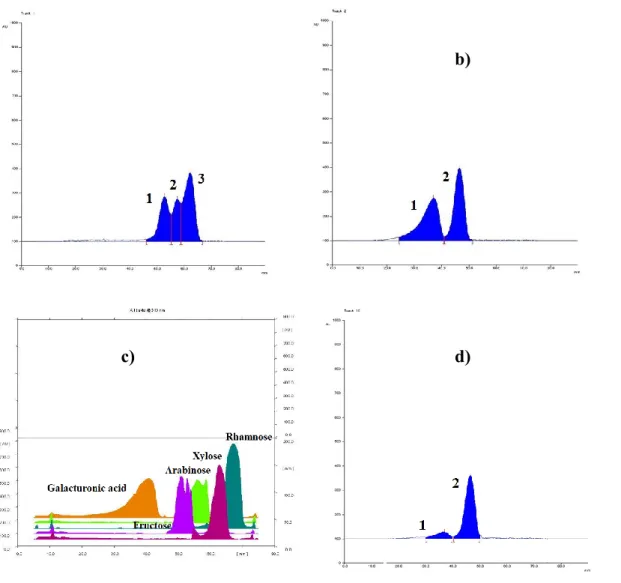
The chromatogram (Figure 3.1.2Figure 3.1.2) clearly shows the absence of oligosaccharides with higher molecular weight than sucrose and, as can be seen, the differences in intensity of the traces suggest that the different extraction methods used here affects only the quantitative analysis but not the qualitative extraction. The chromatograms as a result after analysis of the traces following acquisition with Camag Visualizer and data processing performed using Wincats Comparison Viewer and Camag Scanner III, confirmed what was suggested by Figure 3.1.2Figure 3.1.2. The chromatograms confirmed, with no doubt, that the different extraction procedures used influence the extractive efficiency with respect to glucose, fructose and sucrose. And none of the samples showed the presence of any fructo-oligosaccharides with a molecular weight higher than sucrose. The densitogram of Actilight® (Figure 3.1.3Figure 3.1.3, a) shows every sugar component peak with good resolution whereas the densitogram of traces 5 (sample A4) (Figure 3.1.3Figure 3.1.3, b) and 9 (sample A6 water fraction) (Figure 3.1.3Figure 3.1.3, c) further demonstrate that no peaks at a molecular weights higher than
Formattato: Tipo di carattere: 12
pt, Non Grassetto, Non Corsivo
Formattato: Tipo di carattere: 12
pt, Non Grassetto, Non Corsivo
Formattato: Tipo di carattere: 12
pt, Non Grassetto, Non Corsivo
Formattato: Tipo di carattere: 12
pt, Non Grassetto, Non Corsivo
Formattato: Tipo di carattere: 12
pt, Non Grassetto, Non Corsivo
Formattato: Tipo di carattere: 12
28
sucrose are present. No relevant amount of oligosaccharides (>10 ppm) were detected with the extracting procedures mentioned above.
Figure 3.1.3 Densitograms over Camag Scanner III: a) Actilight® standard; b) trace 5, sample A4; c) trace
9, sample A6 water fraction.
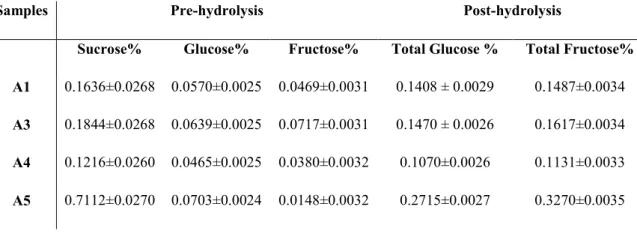
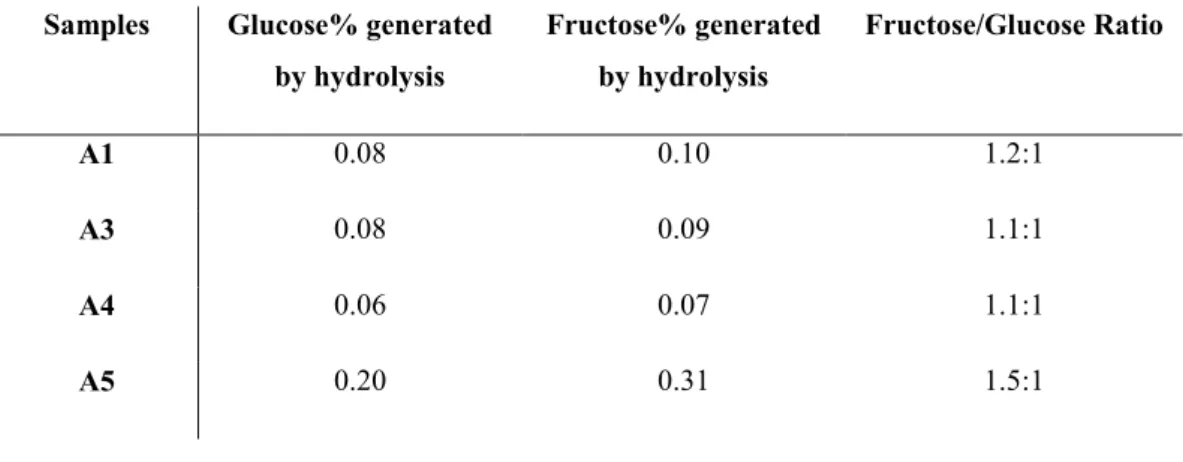
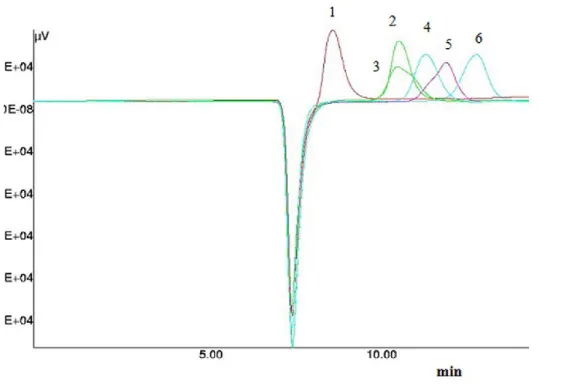
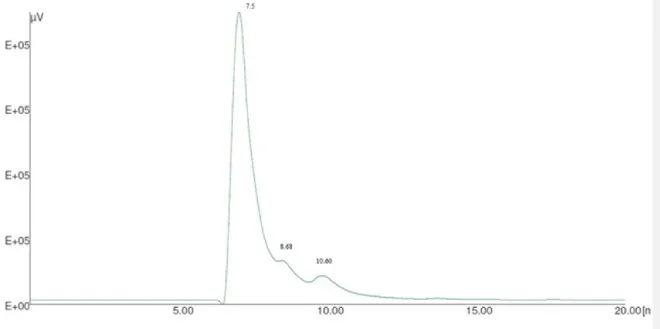
It was then considered necessary to compare the results obtained by means of HPTLC alongside HPLC analysis, matching all the samples before and after hydrolytic treatment, in order to provide further analysis on the free and bonded monosaccharide. This investigation was necessary to evaluate the concentrations of glucose and fructose before and after acidic treatment and verify the absence or presence of oligo-saccharides of higher molecular weight than sucrose through the fructose/glucose calculated ratio. This was used to confirm if the monomers derived after hydrolytic treatment were derived solely from the breakdown of sucrose (and thus confirm or disprove the results obtained with the application of our HPTLC method). In order to confirm the absence of oligosaccharides, as revealed by HPTLC analysis, the ratio between fructose and glucose obtained should be
a) b)