DEPARTMENT OF EARTH,ENVIRONMENT AND RESOURCES SCIENCES
P
H.D.
INE
ARTHS
CIENCE,
E
NVIRONMENT ANDR
ESOURCESXXX
CYCLE
P
H.D
T
HESISPETROGENESIS
OF
ALKALINE
AND
STRONGLY
ALKALINE
VOLCANISM:
EXAMPLES
FROM
AFRICAN
RIFT.
TUTOR
PROF. LEONE MELLUSO
COTUTOR
PROF. VINCENZO MORRA
PhD COORDINATOR
PROF. MAURIZIO FEDI
Ph.D CANDIDATE
MINISSALE SILVIA
Alla persona che crede in me, grazie papà.
TABLE OF CONTENTS
Abstract ... 1
Introduction and aim ... 2
Chapter 1. Geological and petrochemical settings of studied areas ... 4
1.1 The East African Rift system geological setting ... 4
1.2 TheWestern branch in the Tanzanian Craton ... 7
1.2.1 Virunga volcanic province... 13
1.2.2 Nyiragongo volcano ... 15
1.2.3 Nyamuragira volcano ... 17
Chapter 2. Analytical techniques ... 18
2.1 Sample powders preparation and thin sections preparation ... 18
2.2 X-RAY Fluorescence (XRF) ... 19
2.3 Inductively Coupled Plasma – Mass Spectrometry (ICP-MS) ... 20
2.4 Thermal ionization Mass Spectrometry (TIMS) ... 20
2.5 Scanning electron microscopy (SEM) and Microanalyses (EDS) ... 21
2.6 Laser Ablation-Inductively Coupled Plasma-Mass Spectrometry (La-ICPMS) ... 22
2.7 U-Th disequilibrium ... 23
Chapter 3.Data presentatio: rock classification and petrography ... 24
3.1 Rocks classification ... 24
3.2 Sample petrography ... 32
3.2.1 Nyiragongo ... 32
4.2.2 Nyamuragira ... 35
Chapter 4.Mineral chemistry ... 37
4.1 Mineral chemistry ... 37
4.2.1 Olivine ... 37
4.2.2 Pyroxene ... 38
4.2.3 Melilite ... 40
4.2.4Feldspar ... 40
4.2.5 Nepheline and leucite ... 41
4.2.6 Other minerals ... 41
4.2 Glass and minerals trace elements concentration ... 43
Chapter 5.Petrochemistry ... 51
5.1 Major element composition ... 51
5.2 Trace element composition ... 57
Chapter 6 Discussion ... 65
6.1 Mantle source ... 66
6.2 Considerations on the role of CO2 and the model below Tanzanian Craton ... 73
6.4 Isotopes ... 76
6.4 U-Th disequilibria………...82
Conclusions………83
Data tables
86
Abstract
The Virunga Volcanic Province (VVP) lies in the western segment, the Albert Rift, of the East African Rift System (EARS). The volcanism there started about 11 Ma yrs ago and continues to the present. The two active volcanoes of VVP, Nyamuragira and Nyiragongo lie along the seismically active sector of the western rift. Nyiragongo is a stratovolcano characterized by rock types such as melilitite, melilite nephelinite, pyroxene nephelinite,
leucite nephelinite, leucitite and leucite tephrite. Nyamuragira located 15 km to the north of
Nyiragongo, together with it, is one of the most effusive global volcanoes erupting several times in the past few decades, with rocks ranging from basanite to tephrite and basalt. Concerning to this thesis work the samples include parasitic cones and lava fields of the volcanic complexes from 1938 eruption until the last one in 2016, which products were sampled from the proximal vent area to the distal outcrops.
The mafic rocks of Nyamuragira are porphyritic with phenocrysts of olivine and clinopyroxene. Some of the basanites studied have MgO (12.05-13.60 wt.%), Cr (790-926 ppm) and Ni (245-309 ppm) contents within the ranges expected for mantle-derived liquids. The transitional basalts have higher MgO (> 15 wt.%), Cr (> 969 ppm) and Ni (> 750 ppm) contents than basanites. Such enrichment in these elements is probably due to excess of olivine phenocrysts. Nyamuragira basanites have Zr/Nb (3.9-4.0), Ba/Nb (11-12) and La/Nb (0.86-0.9) ratios typical of mantle or OIB values. The primitive mantle-normalized incompatible element patterns of Nyamuragira show positive peaks at Ba and Nb and
smoothly decreasing normalized-abundances from Nbn to Lun and a high Lan/Ybn ratio (18).
The Nyiragongo melilite nephelinites and olivine melilitites have a porphyritic fabric as well as Nyamuragira products. Olivine ranges from forsterite-fayalite to kirschsteinite, clinopyroxene is diopside and melilite has akermanite composition. All samples are feldspar-free. The composition of the glass is often rich in Ba content (up to 5 wt.% BaO). These rocks
have higher CaO (~16.3 wt.%) and lower SiO2 (~ 40 wt.%), MgO (8.7-9.1 wt.%) and
compatible elements concentrations (Cr = 380-395 ppm; Ni = 155-169 ppm) than Nyamuragira basanites. Their incompatible element patterns are also more enriched than those of Nyamuragira basanites with high Light Rare Earth Elements/Heavy Rare Earth
Elements LREE/HREE (Lan/Ybn = 42); in general they present a low heavy REE contents.
The low Zr/Nb (2.1) value of the olivine melilitites indicates that the Nyiragongo olivine melilitites are melt products from an incompatible element-enriched source.
Based on the major and trace elemental compositions of these volcanic rocks, a bimodal characther emerges between the nephelinitic Nyiragongo lavas and the Nyamuragira basanites which suggests that the nephelinitic lavas have different origin. The difference between these types of rocks depends on the degree of partial melting of a garnet-carbonate lherzolite source and it depends on the pressure and depth formation of these lithotypes: deeper source for the melilitites and shallower source for the basanites.
Introduction and aim
The East African Rift System (EARS) provides an opportunity to study the temporal evolution of magmas within a ongoing continental rifting: it consists of eastern and western branches that have contrasting alkaline chemistry characterized by sodic magmas in the eastern branch, and more potassic ones restricted to the western branch (Rosenthal et al., 2009 and reference therein). Carbonatites are also observed in the branches; they are well known from the famous Oldoinyo Lengai and Napak localities in the eastern rift, but also occur in the northernmost western rift in the Toro-Ankole field (Barker and Nixon, 1989; Holmes and Harwood, 1932) together with strongly alkaline magmas such as nephelinites and melilitites, which are very rare lithotypes occuring in the Virunga Volcanic Province (VVP).
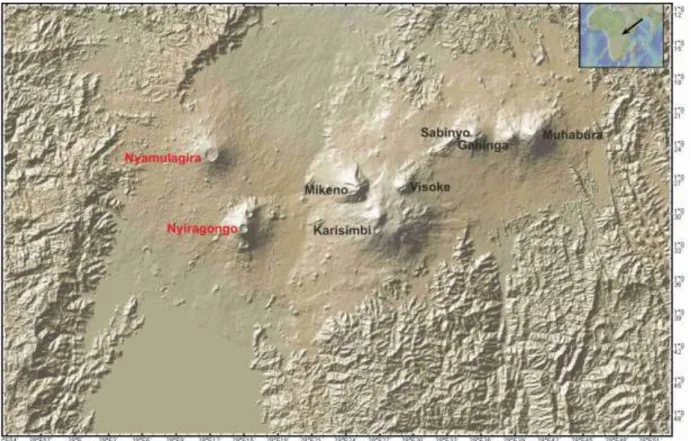
The VVP, localized in Kivu region, consists of different volcanic edifices. Five volcanoes (Nyamulagira, Karisimbi, Sabinyo, Gahinga and Muhavura) are characterised by plagioclase-bearing lavas belonging to a basanite, tephrite, phonotephrite series or to a basanite, K-hawaiite, K-mugearite, K-benmoreite, K-trachyte series (see also Rogers et al., 1992, 1998). The other two volcanoes within the VVP, Mikeno and Visoke have emitted sometimes undersaturated lavas (foidites), with feldspathoid phenocrysts instead of feldspars. Visoke lavas evolved from plagioclase bearing rocks in the old edifice to feldspathoid-bearing rocks (leucitites) in the most recent part of the volcano (Condomines et al., 2015 and reference therein).
The Nyiragongo lavas are quite distinct from those of the other Virunga volcanoes, including Nyamuragira. Almost all Nyiragongo lavas are strongly undersaturated feldspar-free nepheline-melilitites and nephelinites; among the feldspathoids, leucite is generally far less abundant than nepheline. Plagioclase-bearing lavas from the other volcanoes of the VVP are melilite-free basanites usually with leucite as the unic feldspathoid mineral. The Nyiragongo rocks are intermediate between the main Virunga rock series and the ugandites, mafurites and katungites from the Toro-Ankole region (Bell and Powell, 1969). Although the petrogenesis of alkaline undersaturated magmas is not yet fully understood, high-pressure experimental studies have shown that these magmas can be generated by small degrees of partial melting of
H2O and CO2 – rich mantle peridotite (e.g., Bultitude and Green, 1967; Brey and Green
,1975, 1977; Wyllie, 1979)
The aim of this study is the full petrological characterization of these vulcanites outcrops at Nyamuragira and Nyiragongo to fully understand their genesis or correlation and their mantle signature.
Indeed, a major problem currently facing petrologists concerns the characterisation of the mantle source region of continental, intra-plate, alkaline magmas remains a subject of considerable debate. Whether these magmas arise in the lithosphere or in the underlying convecting asthenosphere or geochemically distinct mantle plumes or some combination of these source regions (Wilson 1995). Nyiragongo in fact results controversial from petrological point of view Platz (2004) and Chakrabarti (2009).
According to Andersen (2012) and the most recent petrogenetic models (Demant et al., 1994; Platz et al., 2004), the parent magma of the Nyiragongo nephelinites was an olivine melilititic magma formed by small-fraction partial melting at the base of the lithosphere.
The mineralogical, petrographic, geochemical and isotopic characterization of these lithotypes has been analyzed and interpreted by including within a more general geodynamic context such as the magmatism of Western branch of African Rift. The features that make the Nyiragongo and Nyamuragira areas worthy of interest are mainly related to the presence of magmatic rocks that exhibit an unusual and original mineralogical and chemical composition such as the melilitites erupted from Nyiragongo associated with more common igneous rocks such as basanites at Nyamuragira a volcano.
Chapter 1
Geological and petrochemical settings of studied area
1.1 The East African Rift geological setting
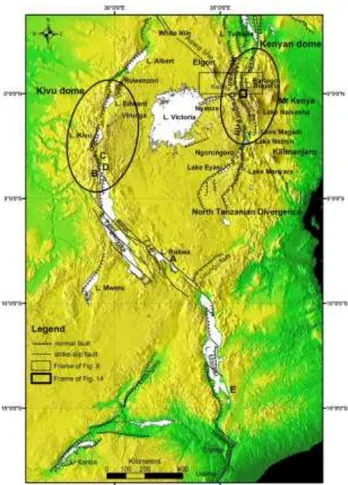
The East African Rift System (EARS) in East Africa (fig.1.1) is part of the broader context of the 'Afro-Arabian Rift, which extends for about 6,500 miles from Turkey to Mozambique, including the Red Sea and the Gulf of Aden, and the continental ones of East Africa. The complex tectonic movement of the plates in this area of the Earth has been under study for several authors (McKenzie, 1970, Chu and Gordon, 1998, 1999), which proposed that the African plaques and Somalia, are separating by rotating around a pole located in the Indian Ocean. Since the continental openings of the Red Sea and the Gulf of Aden have given rise to new ocean basins, (Ebinger and Casey, 2001) have suggested that east Africa, represents an initial stage of this rifting process.
A fundamental importance is given to the African rift system because of its unique place in the world where it is possible to study volcanism and continental opening phenomena before the formation of a new ocean basin, in fact the East African Rift System (EARS) represents a classical example of a young intra-continental ridge system, comprising an axial rift, where continental breakup has not been completed.
Rift system extends over 2000 km from the Red Sea in the north to Mozambique in the south and crosses the Ethiopian dome to the north and the Kenyan dome to the south, which are separated by the Turkana depression characterized by Quaternary volcanism, and the Anza graben representing a ∼150 km wide zone of NW–SE trending extension. The East African rift system shows up at the surface as a series of several thousand kilometers long line up with successions of adjacent individual tectonic basins (rift valleys), generally bordered by uplifted shoulders. Each basin is controlled by faults and forms a subsiding graben filled with sediments and/or volcanic rocks.
The rift valleys form two main lines, the Eastern and Western branches of the EARS. A third, southeastern branch is in the Mozambique Channel. The Eastern branch runs over a distance of 2200 km, from the Afar triangle in the north, through the main Ethiopian rift, the Omo-Turkana lows, the Kenyan (Gregory) rifts, and ends in the basins of the North-Tanzanian divergence in the south. The Western branch runs over a distance of 2100 km from Lake Albert in the north, to Lake Malawi in the south. It comprises several segments: the northern segment includes Lake Albert, Lake Edward and Lake Kivu basins, turning progressively in trend from NNE to N–S; the central segment trends NW– SE and includes the basins of lakes Tanganyika and Rukwa; the southern segment mainly corresponds to Lake Malawi and small basins more to the south. Most of the great lakes of Eastern Africa are located in the rift valleys, except notably Lake Victoria whose waters are maintained in a relative low area between the high mountains belonging to the Eastern and Western branches (Chorowicz J. 2005).
The morpho-tectonics of the EARS involved in divergent movements, inducing localized extensional strain in the continental lithosphere. The brittle crust has responded faulting
and subsidence, forming elongate, narrow rifts, while the lithospheric mantle is subjected to sharply defines ductile thinning, inducing ascension of asthenospheric mantle.
The most characteristic features in the rift system are narrow, elongated zones of thinned lithosphere related to deep intrusions of asthenosphere in the upper mantle. On the surface, the main tectonic features are normal faults, but there are strike-slip, oblique-slip and sometimes reverse faults. Most of the fractures are syn-depositional, and when volcanism occurs, it is closely related to the tectonics (Chorowicz J. 2005).
Figure 1.1: Hypsographic DEM of the East African rift system. Black lines: main faults; white surfaces: lakes; grey levels from dark (low elevations) to light (high elevations). The East African rift system is a series of several thousand kilometers long aligned successions of adjacent individual tectonic basins (rift valleys), separated from
each other by relative shoals and generally bordered by uplifted shoulders. It can be regarded as an intra-continental ridge system comprising an axial rift. (from Chorowicz., 2005)
Volcanism in EARS started between 40-45 Ma in the northern Turkana depression (Ebinger et al., 2003) which has remained volcanically active since that time. In spite of this observation, the modern East African Rift magmatic area is generally described with respect to the onset of flood basalt activity in modern Ethiopia, Eritrea and Yemen that occurred in the late Oligocene and is credited to the impact of a mantle plume head at the
base of the lithosphere. This Oligocene flood basalt event is associated with the breakup of the Afro-Arabian shield, forming the Red Sea 28 Ma (Wolfenden et al., 2005) and the Gulf of Aden 35 Ma (Watchorn et al., 1998). The African Rift represents the third arm of this triple junction, although recent regional plate kinematic models (indicate that the three rift zones were not joined until about 11 Ma (Acton et al., 2000; Eagles et al., 2002; Wolfenden et al., 2004).
The earliest extension documented in the East African Rift System occurred in the Turkana area 25 Ma (Morley et al., 1992; Hendrie et al., 1994). Volcanism and faulting propagated from this region to both the north and south, forming the structures of the modern rift branches.
The Holocene volcanism is scattered along the length of the EARS, but is sparse in places, such as the south western part of the Western Rift between the Virunga and Rungwe Volcanic Provinces (VVP and RVP). In north Afar, volcanic edifices are elongate shields with axial fissures (e.g., Alu-Dalafilla, Erta Ale, Alayta). Further south, central grabens within faulted and fissured terrains and central vent area with a subsided edifice are typical (e.g., Dubbahu-MandaHararo, Ardoukoba, Kammourta) (Barnie et al., 2015). The Tendao-Goba’ad Discontinuity (TGD) marks the triple junction between the Nubian, Somalian and Arabian plates (Acton et al., 1991). In the MER, there is an increasingly well-developed rift valley morphology, large normal fault boundaries and central fissure swarms and cones (e.g., Fantale, Kone, Tullu Moje) and large central volcanoes, including calderas (e.g., Corbetti, O’a). Further south, the rift branches around the Tanzanian Craton, present greater seismicity in the western branch than the eastern one. The southernmost volcanoes of the EARS are located in the Rungwe Province in northern Malawi (Fontijn et al., 2012), south of which, the rifting appears to be amagmatic (e.g., Biggs et al., 2010).
Ages of igneous rocks give some informations about the evolution of the Cenozoic rifts in the EARS. The Eastern Rift developed from north to south, productive magmatism began 45–40 Ma ago in South Ethiopia, at 30–35 Ma in northern Kenya, 15 Ma ago in central Kenya and at 8 Ma in northern Tanzania penetrating into the Tanzania Craton and ending there (Chorowicz J. 2005)
Kampunzu et al. (1998) suggest an along axis southward propagation of the Western Branch (WB), based on a first cycle of volcanism at 11 Ma in the Virunga region (North Kivu), at 10 Ma in Bukavu (South Kivu) and at 9 Ma in Rungwe (near the triple junction, southern end of WR). The northernmost fourth volcanic province in the WB, Toro–Ankole southeast of Rwenzori Mountains, is Quaternary to recent and does not fit to N–S age decrease of the volcanic activity. Chorowicz (2005) suggests the Kivu dome as the origin of rift propagation with rift floors of the northern segment of the WB stepping up to Kivu and stepping down of the central segment from north to south. New age data of first volcanism at Rungwe region of 19–17 Ma (Razzkazov et al., 2003) support a propagation of the WB from south to north. Nyblade and Brazier (2002) assumed the synchronous origin of the WB initiation at 10–12 Ma in a transmission of extensive stresses through the stiff lithosphere when the N–S propagating Eastern Rift laterally encountered Tanzania Craton contemporaneously (Wallner H. and Schmeling
H., 2010). The equatorial section of the East African Rift provides an opportunity to
and western branches that have contrasting alkaline chemistry characterized by sodic magmas in the eastern branch, and more potassic ones restricted to the western branch.
Carbonatites occur in both branches; they are well known from the famous Oldoinyo
Lengai and Napak localities in the eastern rift, but also occur as lavas and tuffs in the northernmost western rift in the Toro-Ankole field (Barker and Nixon, 1989). Together carbonatites and kamafugites provide the opportunity to study magma genesis at an early rift stage before the production of more voluminous magma types.
As mentioned above, the oldest known volcanism (~45 Ma) occured in southwestern part of Ethiopia, and spread southwards with the spreading rift (Ebinger et al., 2000). Strongly alkaline-composed magmas such as melilitites and nephelinites occurred favorably at the propagating tip during its development, and on the flanks of the rift (Williams, 1982): the alkaline rocks positions in the rift axis were later overwhelmed by large, less alkaline magmas, however alkaline volcanic centers remained isolated on the flanks of both sides of the rift axis (Ebinger et al., 1999; Fig. 1.1).
1.2 The Western Branch in the Tanzanian craton
The Western Branch extends over 2500 km and is developed predominantly in mobile belts between the Archean cratons of Tanzania and Bangweulu. Volcanic provinces have developed mainly in intra-basinal positions at the intersections of at least two fault systems (Platz et al., 2004). The Western Rift, as well as the rest of the EARS, is divided into segments along its axis approximately 100 km long asymmetric basins due to an interplay of at least three factors, namely: (i) a response of old, and cold continental lithosphere to the rifting process, (ii) changing stress orientations during discrete rifting episodes, and (iii) the effect of along axis propagation of rifting; coupled with re-activation of pre-existing crustal shear zones (McConnell, 1972; Shudofsky, 1985;
Ebinger, 1989; Ebinger et al., 1993). Moreover, Ebinger (1989) noted that western rift
transfer faults accommodate large differences in elevation between adjoining basins and their uplifted flanks, as well as regional variations in relief related to the 1300 km-wide East African Plateau; hence half-grabens are commonly separated along the length of the rift valley by horsts or sills.
Figure 1.2: Western branch and part of eastern branch of the East African rift system, on shadowed DEM. (Chorowicz, 2005)
The Western branch of the EARS has a low-volcanicity rift at the early phases of the extensional process, characterized by a marked along axis mechanical segmentation. This segmentation is accomplished by the presence of regional transfer zones, representing the complex structural elements that allow the extensional deformation to be transferred from one rift segment to the next (e.g., Morley et al., 1990).
Transfer zones play a significant role in controlling the distribution of volcanic activity, as revealed by the close association between transfer zones and magmatism in the Western Branch of the ears (Rosendahl et al., 1987, Ebinger et al., 1989/ fig 1.2). The four Miocene to- present volcanic provinces (from North to South: Toro Ankole, Virunga, Kivu and Rungwe) are indeed clearly located within the major transfer zones (Corti et al., 2002)
However, the volcanic provinces in the Western Rift are aerially and volumetrically small, leaving the vast majority of the Western Rift lacking magmatism. Four volcanic regions comprise the Western Rift; from North to South these are the Toro-Ankole area in Western Uganda, the Virunga and Kivu provinces along the borders of the Democratic Republic of Congo, Rwanda, Burundi and southern Uganda, and the Rungwe area in south western Tanzania. These provinces are characterized by silica undersaturated mafic volcanism and the local development of evolved products from centralized volcanic edifices. Volcanic products are locally hyper-sodic and ultra-potassic, and also include diverse products such as tholeiites, Kivu, and carbonatites, Toro-Ankole (Ebinger et al., 2002).
Volcanism, uplift and rifting started at about the same time, 12 Ma in Virunga (Ebinger, 1989; Zeyen et al., 1997), 8–9 Ma in the Kivu and Rungwe volcanic fields, at ~6 Ma in the Mwenga–Kamituga Province, but at less than 50000 years in the Toro-Ankole province (Ebinger, 1989; Zeyen et al., 1997; Nyblade and Brazier, 2002).
The compositional range of volcanic eruptive in the western rift branch is broad, ranging from carbonatitic and ultrapotassic, silica undersaturated lavas in the Toro-Ankole field (e.g. Combe and Holmes, 1945; Barker and Nixon, 1989; Stoppa et al., 2000; Tappe et al., 2003) to alkali basalts and tholeiitic in South Kivu (e.g. Bell and Powell, 1969;
Furman and Graham, 1999). There is a systematic decrease in SiO2 and increase in K2O
and CO2 from south to north (Pouclet et al., 1981). Fascinatingly, the geochemistry of
Rungwe volcanics (Furman, 1995) does not keep to this trend. Volcanism in the Virunga province range from silica undersaturated to slightly silica-oversaturated with numerous
intermediate compositions in terms of SiO2 (e.g. Holmes and Harwood, 1937; Rogers et
al., 1992, 1998; Platz et al., 2004; Chakrabarti et al., 2009), while the Rungwe field features trachyphonolites, alkali basalts, basanites, nephelinites, and picrites (Furman, 1995). During the Late Quaternary, volcanism with a broad spectrum of compositions was active simultaneously in Toro-Ankole, Virunga, South Kivu, and Rungwe (Furman, 1995; Boven et al., 1998). The volume of volcanics in the western rift is estimated at
~100 000 km3 (Kampunzu and Mohr, 1991), considerably less than in the eastern rift
branch (e.g. Williams, 1972; Morley, 1999; Rosenthal, 2009 and reference therein). Melilitites and nephelinites occur preferentially at the propagating tip and on the flanks of the rifts (Rosenthal et al., 2009).
Symbols correspond to those in later geochemical figures, indicating volcanic fields in the western rift and proximity to the craton in the eastern rift (blue/yellow circles are on-craton; red/yellow circles are craton-edge; purple squares = off-craton southern Kenya rift; grey squares off-craton northern Kenya rift. Individual locations named are referred to in the text (Rosenthal et al., 2009)
The Tanzanian craton in equatorial east Africa is an area of special interest in terms of both craton development and igneous petrogenesis. In this area, the world’s largest continental rift impinges on a craton that appears to be at an intermediate stage of destabilization.
Geochemical and geophysical interpretations of the thickness and state of the Tanzanian cratonic lithosphere appear to contradict each other, and the elevation of the craton surface lies above 1100 m, in contrast to many cratons that are close to sea level, reflecting buoyancy supported by a subcratonic plume whose effects are seen in the volcanics of both western and eastern rift branches (Foley et al., 2012 and references therein).
The cratons themselves are usually interpretated as virtually indestructible lithospheric blocks whose formation and stability is due to exceptionally high degrees of melting in the distant past and thus to buoyancy owing to the high degree of geochemical depletion of the peridotite (Lee, 2006). Diamond-bearing kimberlites are generally restricted to the central parts of cratons, whereas diamond-free kimberlites and lamproites occur around their margins ( Janse and Sheahan, 1995).
Magmatism on the craton and at its edge has high K/Na and primitive melts show fractionation dominated by olivine. Slightly further from the craton pyroxene fractionation dominates and K/Na ratios in the magmas are lower. Off-craton melts are nephelinites, basanites and alkali basalts with low K/Na. Potassium enrichment in the melts correlates with the occurrence of phlogopite in mantle-derived xenoliths, and also with carbonate in the magmas.
In fig it is shown the spatial relationship of volcanic centres both in western and eastern branches and in the following diagrams the rocks are divided in five categories: (1) kimberlitic rocks, (2) high-MgO or picritic rocks regardless of their K/Na ratios, (3) Low MgO nephelinitic or melilititic rocks, (4) carbonatites, and (5) basanitic, alkali basaltic and basaltic rocks. This is a descriptive categorization aimed to present in a pragmatic way the composition and the differences of Tanzanian craton rocks (Foley et al., 2012) .
Figure 1.4: Geochemistry of K2O and Na2O in igneous rocks from western and eastern fit branches close to the
Tanzanian craton. Western rift (left panel) symbols show volcanic fields (from north to south: blue circles = Toro Ankole; red circles = Virunga; green squares = South Kivu; black squares = Rungwe). Eastern rift symbols refer to proximity to the craton and not to volcanic fields (blue circles = on-craton; red circles = craton edge; purple squares = off-craton south; grey squares = off-craton north). Both western and eastern rift rocks show highest K2O and
lowest Na2O in on-craton positions. The reference line is in the same position in both panels and shows the excellent
distinction between northern and southern volcanic fields in the western rift corresponds broadly to on-/off-craton positions ni the eastern branch, but with more overlap (Rosenthal et al., 2012).
Many studies of rocks in the western branch show that the more alkaline members are typically potassic variants of basanites, nephelinites and melilitites (Pouclet et al., 1981; Rogers et al., 1998; Tappe et al., 2003), which are globally much rarer than types with high Na/K ratios. The most extreme of these occur in the Toro Ankole field of western Uganda and contain kalsilite in addition to nepheline. In contrast, in the eastern rift branch, rocks are mostly of the globally commoner sodic varieties, with rare occurrences of potassium-enriched rocks at the eastern edge of the craton (Dawson et al., 1997). Carbonatites occur in both branches, mostly as composite centres with nephelinite or melilitite (King and Sutherland, 1966; Woolley et al., 1995; Keller et al., 2006; Eby et al., 2009), but occasionally as single occurrences for which a relationship with silicate melts is not proven, as at Fort Portal (Barker and Nixon, 1989). Carbonatitic tuffs that include silicate material are common in the Toro Ankole and Ndale fields in the northern sections of the western rift branch (Stoppa et al., 2000; Eby et al., 2009).
The volcanics show a strong compositional gradient in terms of increasing K2O/Na2O
from south to north Fig. (Pouclet et al., 1981; Pouclet et al., 1984). The distinction
between high and low K2O/Na2O between the Virunga and South Kivu fields is almost
free of overlap, whereas the South Kivu and Rungwe fields show complete overlap (Fig.
). In the eastern rift volcanics, the abundance ranges for K2O and Na2O are different:
K2O/Na2O ratios are generally similar to those in the South Kivu and Rungwe fields of
the western branch, but Na2O extends to higher abundances (>5 wt.%; Fig). The only rocks in the eastern branch that plot with high K2O/Na2O ratios within the range of Virunga rocks are from either on-craton or craton-edge localities in Tanzania. These include rocks referred to as katungites at Pello Hill, and potassic nephelniites at Sora Hill (Dawson et al., 1988). The line in Fig. appears to demarcate the influence of cratonic mantle sources.
Figure 1.5: Mg# vs. CaO plots indicate olivine control by negative slopes and clinopyroxene ± plagioclase fractionation by positive slopes. Predominantly olivine control is seen for Toro Ankole, for the eastern rift on-craton rocks, and to a minor extent for Virunga and the craton-edge eastern rift rocks (Rosenthal et al., 2012).
Fractionation of mafic phenocrysts in continental volcanic series is often illustrated on plots of Mg# or MgO versus CaO, in which olivine control lines from picritic parental melts cause increasing CaO until olivine is replaced as the dominant fractionating phase by clinopyroxene, which depletes later melts in both CaO and Mg#. These trends have been used to demonstrate this order of fractionation for flood basalts and other continental occurrences (Cox, 1980; Kerr et al., 1997). In Fig. , the subdivisions according to volcanic fields (western branch) and proximity to craton (eastern branch) are plotted separately so that trends in individual groupings are clearer. The Virunga field has several rocks with high Mg# and low CaO that may indicate both trends, whereas both Toro Ankole and Virunga fields have an appreciable number of rocks with very high CaO and low MgO, well beyond the usual turning point towards lower CaO contents which characteristically occurs at 10–13 wt.% CaO depending on pressure of fractionation. The eastern rift plots (Fig. ) show similar features: high Mg#, low CaO typical of primitive picritic rocks in which olivine is the only fractionating phase are seen at the on-craton localitites, whereas they are missing in the rift rocks away from the cratons (Fig. , top two panels). The craton-edge rocks (lower left panel) show features similar to Virunga, with olivine control lines and also high-CaO, low Mg# rocks. In his summary of eastern branch nephelinite volcanism, (Le Bas M.J. 1981, 1987) distinguished olivine-poor and olivine-rich nephelinites, noting that olivine-richer types are concentrated further away from the Kenya dome to the northeast, whereas the olivine-poor variety occurs to the west of the rift valley axis.
1.3 The Virunga Volcanic Province
The Virunga Volcanic Province (VVP) is located in the western branch of the East African Rift System (EARS; Ebinger and Furman, 2003), at the intersection between the Democratic Republic of Congo, Rwanda and Uganda and it is widely regarded as one of the classic intra-plate potassic provinces (Rogers et al., 1992). It comprises eight main volcanoes, including two active ones, and numerous pyroclastic cones (fig.). Among the
eight main edifices of the VVP, Nyiragongo and Nyamulagira volcanoes are currently the most active volcanoes of Africa (Wright et al., 2015). Since 1882, Nyamulagira volcano experienced at least 42 eruptions and in November 2014 a lava lake appeared (Smets et al., 2014, 2015). The eruptive activity of Nyiragongo volcano over the last 150 years is characterized by intra-crater activity, corresponding to the presence of a persistent lava lake (1928 1977, 2002-present; Sahama and Meyer, 1958; Durieux, 2003) or lava fountaining activity from 1982, 1994 and 1995 eruptions creating an ephemeral lava lake ( Krafft and Krafft, 1983; Tazieff, 1984; Durieux, 2003; Komorowski et al., 2003). This intra-crater activity was interrupted by two flank eruptions, in 1977 and 2002 ( Tazieff, 1977; Komorowski et al., 2003). Mikeno, Visoke and Karisimbi volcanoes are located in the central part of the VVP. Sabinyo, Gahinga and Muhavura volcanoes are located in the eastern part of the VVP. The cone field of Bufumbira represents the easternmost extension of the volcanic province. With the exception of the 1957 eruption, the Mugogo cone (Verhaeghe, 1958; Condomines et al., 2015), not documented historically eruption is known to have occurred in the central and eastern part of the VVP.
.
Figure 1.6: Map of the Virunga Volcanic Province showing the main volcanic edifices (black triangles) and the >500 pyroclastic cones (yellow polygons). Nyam:Nyamulagira; Nyir: Nyiragongo; Mik : Mikeno; Kar. Karisimbi; Vis:
Figure 1.7: Main volcanic centres in the Virunga Volcanic province. Modified from DEM image.
The Virunga volcanic area is located at a WSW-ENE dextral shift of the rift, and sets in a classical accommodation zone (Ebinger et al., 1999). It consists from SW to NE of eight large strato-shield volcanoes like mentioned above: Nyamuragira (3058 m), Nyiragongo (3470 m), Mikeno (4437 m), Karisimbi (4507 m), Visoke (3711 m), Sabinyo (3634 m), Gahinga (3500 m), and Muhavura (4127 m). Mikeno and Sabinyo are the oldest volcanoes and are dated, respectively, to late Pliocene and to Early Pleistocene. Nyiragongo and Nyamuragira are presently active. The other volcanoes were active from middle Pleistocene to recent time.
Geochronological studies date the last eruptions of the large volcanoes of the central and eastern part of the VVP to the Late Pleistocene. A lava flow of Mikeno volcano was dated at 0.2 ± 0.1 Ma (Guibert et al., 1975), ages from 65 ± 25 k.a to 176 ± 30 k.a have been reported for Sabinyo eruptive products (Bagdasaryan et al., 1973; Rogers et al.,1998), and a Karisimbi lava flow was dated to 0.010 ± 0.007 Ma (De Mulder and Pasteels, 1986). Ages of 33 ± 9 ka and 52 ± 19 ka were obtained for two leucites of Muhavura volcano (Rogers et al., 1998). The central and eastern part of the VVP remains poorly studied, with a limited number of geochronological and geochemical studies available (e.g., Guibert, 1978; De Mulder, 1985; De Mulder and Pasteels, 1986; Marcelot and Rançon, 1988; Kampunzu et al., 1998; Rogers et al., 1998).
Two diverse magmatic suites are shown: leucite-bearing basanites and evolved lavas at Nyamuragira, Karisimbi, Visoke, Sabinyo, Gahinga and Muhavura, and leucite-melilite nephelinites and nepheline-leucitites at Nyiragongo, Mikeno and Visoke (pro parte) (Pouclet et al., 1981, 1983, 1984). Furthermore, remnants of basaltic lava flows, dated to Miocene, are conserved at the upper western edge of the rift. They preceded the major
fault motion of the rift shoulder and the building of the great volcanoes of the main Virunga area (Pouclet, 1975, 1977).
1.3.1 Nyiragongo
Nyiragongo volcano is one of the most active on Earth (Wright et al., 2015), it is located in the eastern part of the Democratic Republic of Congo, close to the border with Rwanda. Nyiragongo is considered one of the most dangerous African volcanoes (e.g., Favalli et al., 2009) due to the dense population in the surrounding area. Its eruptive activity is primarily characterized by the presence of a molten lava lake in the main
crater, from which a SO2- rich gas plume escapes continuously (e.g., Tedesco et al.,
2007).
In both, 1977 and 2002, flank eruptions occurred, draining the lava lake and producing fast-moving lava flows that proved to be deadly and destructive (e.g., Tazieff, 1977; Komorowski et al., 2004). Months to years after these flank eruptions, the lava lake reappeared in the main crater.
The extent, form and the height of the Nyiragongo lava lake grew through time, modifying the morphology of the main crater. Today's crater topography is characterized by remnants of solidified levels of the lava lake, forming platforms attached to the inner flanks.
The Nyiragongo volcanic complex consists of three overlapping large stratovolcanoes aligned roughly in N-S direction and exhibiting summit craters, the older Baruta volcano (3,148 m) to the north, the Nyiragongo (3,470) located 1.5 km south and the Shaheru volcano (2,600 m) located 2 km to the south of Nyiragongo. At least 100 small volcanic lava and cinder cones have developed above parasitic flank vents on Nyiragongo along predominant NE-SW and NS trending fractures zones, often radially oriented. Many of the cones located within 150 m elevation above the present Lake Kivu level and within 1.5 km lateral distance, such as Mount Goma located in the town of Goma, show some evidence that they were formed as the result of partial interaction of magma with the lake waters during violent explosive phreatomagmatic eruptions (Tuttle and Newhall., 1988). Recent flank fissure lava flows from Nyiragongo surround and partly cover lava flows from Baruta and Shaheru and have reached lake Kivu at least twice in recent times, about 700-740 years ago (e.g. Casadevall and Lockwood. 1995; Newhall et al., 2004) and during the 2002 eruption.
Fresh lavas from Nyiragongo are typically nephelinites that contains some melilite or leucite porphyritic with a vesicular, glassy or fine-grained crystalline groundmass (Sahama, 1953, 1957, 1978). They are ranging in composition from alkali olivine basalt to nephelinite, leucite nephelinite, melilite nephelinite, and melilitite (e.g. Demant et al., 1994; Platz et al., 2004; Sahama, 1978; Toscani et al., 1990). Samples of melt from the surface of the 1950s lava lake indicate that the liquid was nephelinitic in composition, and saturated in nepheline, melilite, magnetite and apatite (Sahama, 1978). Holocrystalline melilite nephelinite occurs in the upper part of the volcanic cone which was exposed in the inner crater walls above the 1950s upper terrace (Sahama, 1978; Sahama and Meyer, 1958).
Figure 1.8: Geological sketch map of Nyiragongo (modified after Platz et al., 2004).
1.3.2 Nyamuragira
Smets (2015) states that Nyamulagira is one of the two active volcanoes with, one eruption every 2–4 years, in the VVP. It is a high shield volcano, covers over
1100 km2
and is crowned by a 2.3 × 2 km shallow caldera which contains two smaller pits and it is located south of the Virunga National Park (SE part of N-Kivu, D.R. of Congo). Lavas consist of highly potassic suite of olivine basanite-tephritic phonolites (Kampunzu et al., 1982; Aoki and Yoshida, 1983; Aoki et al., 1985). Such composition results in low viscosity lavas able to flow for tens of kilometers.
Since 1938, a total of 27 flank had erupted (Smets et al., 2010) on this alkali basaltic to basanitic shield volcano. The lava lake was abruptly drained from the summit pitcrater, especially after 1938, when the volcano starts behaving as a closed degassing system that erupts when a verge of volume or pressure is reached. However, in late June 2014, a small lava lake was first observed within the eastern pit-crater (e.g. Campion R. 2014; Smets et al., 2014).
Aoki et al., (1985) suggested that Nyamuragira erupts low-silica, alkalic lavas, including
alkali basalts, hawaiites, basanites and tephrites (SiO2= 43–56 wt%, K2O + Na2O up to 7
Chapter 2
Analytical techniques
Laboratories
Sample preparation for the geochemical and petrographic analysis were carried out in different laboratories. At laboratory of university of Napoli Federico II, the samples were cut, powdered and the thin-sections were obtained there. The major whole rock and trace elements were analysed both at University of Napoli (XRF spectrometry) and at ActLabs laboratories (LOI and ICP-MS). The major element concentrations of mineral and glass phases were determined also at University of Napoli (SEM-EDS). Trace element concentrations for mineral and glass phases were determined at the University of Pavia and Institute of Geosciences and Georesources (CNR). The Sr-Nd-Pb-isotopic analyses were measured at the University of Firenze (TIMS) and finally U-Th-Ra series disequilibria data were determined at the University of Montpellier (gamma ray spectrometry and alfa ray spec).
2.1 The Sample powders preparation and thin sections preparation
First of all the rock samples were cut with a diamond blade circular saw into smaller blocks (~2-3 cm blocks).
One block was used for standard 0.3 μm-thick thin sections, analyzed for petrographic investigations at the polarizing microscope.
The remaining blocks were shattered through the use of a chipmunk jaw crusher to ~1.5 cm rock fragments, washed in deionized water, dried out at 90ºC and then pulverized. The pulverized samples were placed into a steel ball mill with agate jar and run for about thirty minutes. Next, the samples were gently sieved through a 60-micron sieve. The powders were hand-picked to >60 grams each in order to assure both sample quality and to provide enough samples for next analytical processes (like XRF and IC-PMS).
Thin sections preparation
The rock block already cut was treated to make it flat and polished. This operation was carried out using a grinding wheel with grinding disks (of silicon carbide). All the treatment consisted of subjecting the rock section to several polishing cycles, executed with progressively smaller knit disks (80, 180, 300 and 600 Mesh). Subsequently, they went hand-grinding on a glass plate on one of the slide faces to improve visibility at the microscope. The polished face then, cleaned and heated for a few minutes on a plate, was glued to the sanded face of the slide using a bi-component (binder+ hardening) resin. The slide-rock pair was subsequently reduced by thickness using a trimmer, about 100 μm from the glued surface. To reach the thickness of 30μm (standard for thin sections of rocks), the progressive finishing abrasion gradually increased, first on the grinding wheel (300 and 600 mesh) and then onto a hand-held glass plate (600 and 800 Mesh). Finally, the sections were polished with a solution of alumina. The polishing process consists of abrasive finishing (1200, 2400, 4000 Mesh, 1μm and ¼ μm) mounted on a lapping machine, until the section is perfectly glossy. All thin
sections were observed with an optical polarizing microscope to perform an accurate petrographic analysis of fabric and mineral paragenesis.
2.2 X-RAY Fluorescence (XRF)
The X-ray fluorescence spectroscopy (XRF) allows determining the elemental composition of a sample through the study of the X fluorescence radiation. This radiation is emitted by the atoms of the sample as a consequence of an excitation which is obtained typically by irradiating the sample with X-rays and Gamma-rays at high-energy. Similar effects were obtained using ion beams.
When an atom of the sample is exposed to incident radiation of suitable energy there is a certain probability that an electron, initially in a state of energy E1, is torn from it, producing a gap in the electronic structure of the atom. This phenomenon is known as the photoelectric effect (Franzini et al., 1975). To restore the equilibrium conditions, an electron with higher
energy E2>E1 replaces the empty gap by releasing a photon with energy equal to E=E2-E1.
Only the transitions that respect the rules of quantum mechanics are permitted. The term fluorescence refers to the fact that as a consequence of the irradiation a re-emission of radiation with a longer wavelength is obtained.
The fluorescence radiation emitted by a specific chemical element has a characteristic spectrum with lines at known energies, depending from the specific electronic structure of the element atoms (Leoni and Saitta, 1976). A qualitative analysis of a sample is possible by the identification of characteristics emission lines of each chemical element. According to the traditional notation, the energy levels are indicated by two letters. The first (K, L, M, ...) indicates the shell affected by the transition. The second ranking he energy of transition y (α, β, γ, ...).
Figure 2.1: Representation of atomic energy levels.
A quantitative analysis requires a suitable processing, mainly consisting in a comparison of the intensity of X-ray lines with those of a standard samples containing known amounts of the element to be estimated.
Major elements and some of trace elements were carried out by X-ray fluorescence spectrometry using a Panalytical Axios instrument on pellets, from sample powders already obtained. Major elements concentrations are expressed as percentages by weight of oxides
and the determined elements are SiO2, TiO2, Al2O3, Fe2O3(t), MnO, MgO, CaO, Na2O, K2O,
P2O5. Trace elements concentrations are expressed as ppm (parts per million) and the
determined elements are Sc, V, Cr, Ni, Cu, Zn, Rb, Sr, Y, Zr, Nb, Ba, La, Ce. Analytical uncertainties are in the order of 1-2% for major elements and 5-10% for trace elements. the weight loss on ignition (L.O.I.) was determined with standard gravimetric techniques, after igniting one gram of powder at 1000°C for 4 h.
Disk pellets preparation
About five grams of the undersized rock powders were sticked with MOWIOL (Polyvinyl alcohol) and dried at 90ºC, the prepared mixture was poured into special aluminum containers above of a layer of boric acid, with a filler function.
The dust container was, subsequently placed in a 3 cm circular saw, which was inserted into a
hydraulic press Herzog and pressed at 20 Tonn/cm2 for 20 seconds, thus obtaining the pressed
disks.
2.3 Inductively Coupled Plasma – Mass Spectrometry (ICP-MS)
The Laser Ablation Inductively Coupled Plasma Mass Spectrometry (LA-ICP-MS) is a technique used for the in situ analysis of trace elements in rock samples. It can determine many elements in the periodic table to high degrees of accuracy and precision. The technique complements electron microprobe analysis, typically measuring trace elements at a lower concentration range (1 ppb - 100 ppm).
Solid particles are physically ablated due to the interaction of a high power laser beam (> 1 x
1010 Wcm-2) with the surface of the sample. The particles are carried in a stream of inert gas
(helium or argon) into an argon plasma where they are ionised prior to measurement in a mass spectrometer. Isotopes are measured to determine elemental concentrations.
Lanthanides (REE) and other trace elements were determined some selected samples with inductively coupled plasma mass spectrometry (ICP-MS) at Activation Laboratories (Ancaster, Ontario; see www.actlabs.com for a full description of the analytical techniques). Accuracy is generally in the range of 1-2% calculated using JB-2 and JGb-1 standards of the Geological Survey of Japan.
2.4 Thermal ionization Mass Spectrometry (TIMS))
The TIMS is an instrument that measures isotopic ratios that are used in geochemistry, geochronology, and cosmo-chemistry. TIMS is a magnetic sector mass spectrometer that is capable of making very precise measurements of isotope ratios of elements that can be ionized thermally, usually by passing a current through a thin metal ribbon or ribbons under vacuum. The ions created on the ribbons are accelerated across an electrical potential gradient (up to 10 KV) and focused into a beam via a series of slits and electrostatically charged plates. This ion beam then passes through a magnetic field and the original ion beam is dispersed into separate beams on the basis of their mass to charge ratio. These mass-resolved beams are then
directed into collectors where the ion beam is converted into voltage. Comparison of voltages corresponding to individual ion beams yield precise isotope ratios.
The whole rock sample powders (0,1 g ) were leached with hydrofluoric acid and subsequently dissolved in acidic solutions such as hydrofluoric acid, nitric acid and hydrochloric acid. The acids and water used to treat the samples are extremely pure. To separate Sr and Nd from samples in solution column chromatography techniques were carried out that consist in isolating the quantities of Sr and 14 rare earths (REEs) by using cationic exchange columns and subsequently isolating Nd from REE with reverse phase chromatographic columns. To separate Sr and REE were used as 2.5N hydrochloric acid (for Sr) and acid hydrochloric 6N (for REEs). After use, columns and resins were washed with appropriate amounts of 6N hydrochloric acid and Milli-Q® water and reconditioned with hydrochloric acid 2.5N. The columns to separate the Nd from REE are different from the previous ones: the cationic exchanger is an organic acid (2-ethylhexyl phosphoric acid HDEHP). To separate Nd from REE, 0.25N hydrochloric acid was used as the eluent. After use the columns were washed with appropriate amounts of 6N and 6N hydrochloric acid reconditioned with 0.25N hydrochloric acid.
For the Pb the same methods were performed with a different procedure consisting of separate the solutions in two fractions. In a fraction a known amount of Pb 206 isotope was added to determine lead concentrations (spike solution); the other fraction was used to determine lead
isotopic ratios (solution no spike).To separate Pb , we used an eluent 350 μl of a solution of
nitric acid and acid hydrogen bromide.
All other information and references follow Avanzinelli et al. (2005).
Figure 2.2 Nd columns and samples manual loading
2.5 Scanning electron microscopy (SEM) and Microanalyses (EDS)
The scanning electron microscope (SEM) is an electronic instrument used for inspecting topographies of sample materials allowing a high-resolved and high-zoomed observation up to enlargements of 1-10 μm. This technique is based on the interaction between an incident electron beam and sample surface. The electron beam is focused and accelerated at high potential, by means of magnetic lenses, on the specimen, and its interaction generates several electromagnetic radiations such as backscattered electrons, secondary electrons, Auger electrons, characteristic X-rays, and visible light (Middendorf et al., 2005).
High-resolution imaging of surface morphology is generated by secondary electrons. The efficiency of production of backscattered electrons is strongly related to the material’s atomic number. The higher the atomic number the brighter the material image.
If the SEM is equipped with an X-ray detector (EDS) a qualitative/quantitative determination of the chemical elements within the components of the sample is possible. The samples which are analyzed with SEM should be small and need to be covered with a conductive layer of carbon or gold, that facilitates the removal of electrical charges from the sample, which otherwise interferes with image formation (Middendorf et al., 2005). With EDS, the chemical composition of the phases can be determined (Callebaut et al., 2001).
Scanning electron microscopy (SEM) observations and chemical composition of mineralogical phases on polished thin sections were determined with an Energy Dispersive Spectrometer using a JEOL JSM-5310 electron microscope and an Oxford Instruments Microanalysis Unit, equipped with an INCA X-act detector and operating at 15 kV primary beam voltage, 50-100 mA filament current, variable spot size, from 30,000 to 200,000x magnification, 20 mm WD and 50 s net acquisition real time. Measurements were made with an INCA X-stream pulse processor and with INCA Energy software. Energy uses the XPP matrix correction scheme, developed by Pouchou and Pichoir (1988), and the Pulse Pile up correction. The quant optimization is carried out using cobalt (FWHM - full width at half maximum peak height- of the strobed zero = 60-65 eV). The following standards, coming from Smithsonian Institute, were used for calibration: diopside (Ca), San Carlos olivine (Mg), anorthoclase (Al, Si), albite
(Na), rutile (Ti), fayalite (Fe), Cr2O3 (Cr), rhodonite (Mn), orthoclase (K), apatite (P), fluorite
(F), barite (Ba), strontianite (Sr), zircon (Zr, Hf), synthetic Smithsonian orthophosphates (REE, Y, Sc), pure vanadium, niobium and tantalum (V, Nb, Ta), Corning glass (Th and U),
sphalerite (S, Zn), sodium chloride (Cl), and pollucite (Cs). The K, L, L, or M lines were
used for calibration, according to the element (Melluso et al., 2012; Guarino et al., 2016). Backscattered electron (BSE) images were obtained with the same instrument. Precision is 2% (relative).
2.6 Laser Ablation-Inductively Coupled Plasma–Mass Spectrometry
(LA-ICP-MS)
The composition of the glass beneath the thin section has been documented before the sample analysis to promptly recognize the piercing of the rock and to eliminate any glass contribution. The gas background was measured for 60 s, as in any other routine analysis, whereas signals during ablation were acquired for approximately 20-50 s. Analyses were performed with 10 Hz repetition rate of laser and ~1-2.5 mJ/s laser power. Full details as in Miller et al. (2007).
Precautions have been taken to avoid any bias on the analytical results. Memory effects have been taken into account leaving more than 1 min between two consecutive analyses and analysing glasses after the minerals. Spurious signals related to memory effects usually affect more blanks (because less time is passed after the previous analysis), thus determining a worsening of the detection limits and hindering the quantification of elements at ultra-trace concentration level. Surface contamination during sample polishing and/or handling before the micro-analytical measurement and occurrence of micro-inclusions of glass/fluid have been monitored by detailed inspection of the signal profiles acquired during ablation. Only
intervals with parallel signals have been integrated. Anomalous signal contributions at the beginning of the ablation (due to surface contamination) and/or randomly occurring during ablation (possibly related to inclusions and/or memory effect) has been accurately documented and excluded by integration.
The trace element analysis of different mineral phases and glasses were performed on thin section samples and the elements concentrations are expressed in ppm. The spectrometer used, a Perkin Elmer DRCe, has a dual focus analyzer (Finnigan Mat, Element I) coupled with a Q-switched Nd-YAG laser source (Quantel Brilliant). The original ray emitted by the laser source (1064nm, region of near infrared) is converted to 213nm by three harmonic generators. The measuring point diameter varies between 30 and 60nm, with a variable energy of 25-30mJ. Analytical determinations were obtained using the GLITTER software. Accuracy is in the order of 10% for all the elements analyzed, and are calculated using the NIST SRM 610 and BCR-2g standards.
3.7 U-Th Disequilibrium analysis
The U-series nuclides were measured by mass and nuclear spectrometry methods. U and Th contents were determined by isotope dilution mass spectrometry (ID-TIMS) using 235 U- and 230 Th-enriched tracers and standard chemical separations. (230 Th/232 Th) ratios were determined by alpha spectrometry, following the procedure described by Condomines et al. (1982). The 226 Ra and 210 Pb activities were measured through gamma spectrometry, using a CANBERRA™ Ge-well high-purity detector. Around 11 g of rock powder was sealed into a gas-tight PETP (polyethylene terephtalate) cylindrical container and introduced into the Ge-well detector. The general procedure used to determine the activities of the different nuclides, by comparison of gamma-ray peaks with those of an in-house volcanic rock standard, is detailed in Condomines et al. (1995). Self attenuation corrections are systematically applied using a modified version of a Monte Carlo program implemented by J. Fain (Pilleyre et al., 2006), 232 Th can also be easily measured by gamma spectrometry through the activities of its daughter nuclides 228 Ac, 212 Bi and 208 Tl, when the 232 Th decay series is in secular equilibrium, reached after about 30 y. The agreement between Th contents analysed through three different techniques (multi-element ICP-MS, IDTIMS and gamma spectrometry) is excellent (better than 1 %), whereas U contents measured by multi-element ICPMS are about 5 % lower than those determined by both IDTIMS and gamma spectrometry (Condomines et al., 1982).
In sample “Nyira 2016” Bulk Cl-, bulk F and bulk S (total) concentrations were determined respectively by INAA, ISE and combustion IR techniques at ActLaboratories from 1 g of powder. Analytical error is given at +/- 0.01 wt%.
Chapter 3
Data presentation: rock classification and petrography
3.1 Rock classification
In this thesis were used rock samples from several sampling expeditions in Virunga area (Congo): they are lava samples, the majority, and scoria and ashes samples at few cases. All the volcanic products were sampled by Dario Tedesco (Università della Campania) and Charles M. Balagizi (Observatorie Volcanologique de Goma), with which there is an existing collaboration. In particular, for the Nyiragongo edifice this study focus on the 1977 eruptive event with 5 samples, on the 2002 eruptive event with 22 samples, on the 2016 eruption with one sample and six samples from older scoria cones such as Lac Vert and Mt. Goma. For the Nyamuragira volcano this study focus on the 1938 eruption with two samples, on 1948 event with two samples, two sample for 2010 event, four samples for the 2011/2012 event and six other lava samples from older lava flows (fig. 3.1).
The total amount of sampling for this thesis project consists of 47 samples (tab and fig. 3.1) Samples do not represent a complete sequenze of crystallization but scattered samples from different and selected eruption events.
Figure 3.1 Location Map of some of the sampled rocks.
An evaluation was made first through major element composition that let us classify the sampled rocks through different diagrams. In the Total Alkali Silica diagram (TAS; Le Bas et al., 1986; fig. 3.3 ) all the Nyiragongo analyzed rocks all fall into the field of foid, on the contrary the Nyamuragira ones fall within the tephrite/basanite field and in the basalt field. In the diagram there are also some glass analysis.
Figure 3.2 (a) Total alkali silica diagram for the studied rocks: Nyamuragira whole rocks (white circles), Nyamuragira representative glasses (red circles); Nyiragongo whole rocks (grey diamonds), Nyiragongo representative glasses (b) Nyiragongo rock samples with literature data (c) and Nyamuragira rock samples with
Since the rocks of the two volcanic districts are heavily undersaturated in silica, as it emerges from the TAS diagram, they are not properly distinguishable by the use of this classification chart as, as evidenced by many authors (Le Bas, 1989; fig.3.8; Woolley et al., 1996, fig.3.9), in the fields of the foidites and the basanites place a large number of different lithologies, but chemically equivalent. It was then proposed to classify these rocks by using the diagram R1 - R2 (De la Roche et al., 1980; fig 3.7) and the one especially modified for igneous lithotypes (Le Bas, 1989, fig 3.6).
Figure 3.6-3.7 R1-R2 modified diagram and R1-R2 diagram for all the Nyiragongo (grey diamonds) and Nyamuragira (white circles) whole rocks analysis.
In the R1-R2 diagram all Nyiragongo samples fall within the field of nephelinites, and Nyamiuragira samples in the field of foidites and basanites.
Although both diagrams are more suitable for classification of undersaturated rocks, also the R1-R2 diagram and the modified one, do not discriminate between melilitites and foids.
Figure 3.8 Classification of samples according to Le Bas (1989): Nyiragongo (grey diamonds) and Nyamuragira (white circles)
.
For this task a further classification was suggested based on CIPW norm (Cross, Iddings, Pirsson e Washington, 1903). A diagrams was advanced built Nepheline vs Larnite (Woolley et al., 1996, fig 3.9) for the Nyiragongo lithotypes excluding the scoria cone’s ones that show moderately different features.
Generally speaking, the Nyiragongo melilite bearing rocks are characterized by more than 10% of CIPW-normative larnite and thus were classified as melilitites or olivine melilitites following Le Maitre (2002).
The Nyamuragira lithotypes instead are generally basanites and they are not include in this diagram.
Figure 3.9 Classification of samples according to Wooley et al. (1996):Nyiragongo (grey diamonds)
From the point of view of geochemical affinity on average, Na2O contents, ranging 3.38-
7.07wt. % for Nyiragongo rocks and 1.64-4.12 wt.% for Nyamuragira rocks, are the same as
is ~1 (fig 3.10) thus it means that the lava geochemical affinity is basically potassic but in general is alkaline-strongly alkaline.
Figure 3.10 Geochemical affinity diagram: Nyiragongo (grey diamonds) and Nyamuragira (white circles)
Moreover, through the following diagrams, it is possible also to see different features: the Nyiragongo 1977 nephelinites are practically coincident with the 2002 ones, on the contrary they differ with the 2016 event. The older scoria cones also present heterogeneous patterns with a vertical trend for the Lac Vert samples.
Although the Nyamuragira lithotypes have similar trends, it is possible to note two clusters: one with the basalt and the Mg rich samples and the other with all the others (fig. 3.11-3.13).
Figure 3.11 Zr/Nb diagram: Nyiragongo 2002 samples (orange diamonds), Nyiragongo 1977 samples (grey diamonds), Nyiragongo 2016 sample (yellow diamond), Nyiragongo scoria cones samples (black diamonds) and all
Figure 3.12 MgO/Nb diagram: Nyiragongo 2002 samples (orange diamonds), Nyiragongo 1977 samples (grey diamonds), Nyiragongo 2016 sample (yellow diamond), Nyiragongo scoria cones samples (black diamonds) and all
Nyamuragira samples (white circles)
Figure 3.13 La/Nb diagram: Nyiragongo 2002 samples (orange diamonds), Nyiragongo 1977 samples (grey diamonds), Nyiragongo 2016 sample (yellow diamond), Nyiragongo scoria cones samples (black diamonds) and all
T and P
Magma temperatures were estimated by a geothermometer Olivine-liquid. The olivine / liquid geothermometer is based on the coexistence of the olivine balance with magmatic liquid (Putirka, 2008), in accordance with Roeder's Balance Test and Emslie (1970) proposing a Fe-Mg partition coefficient between olivine and liquid of 0.27 ± 0.03. The determinations made with the olivine / liquid geothermometer were carried out under 0.1 kbar conditions.
The temperature values range from 1022 ° C and 1234° C for Nyiragongo and from 1023° C and 1145° C for Nyamuragira.
Magma pressures were estimated by a geobarometer Clinopyroxene-liquid in accordance with Masotta et al., (2012). The pressure values are 0,7-1,1 kbar for Nyiragongo and 0,9-1,2 kbar for Nyamuragira.
3.2 Petrography
All the thin sections produced were observed at the optical microscope and for each sample a systematic description of the fabric was made, as well as the mineral phases and the possible inclusions present, distinguishing, where possible, between phenocrystis and the mass.
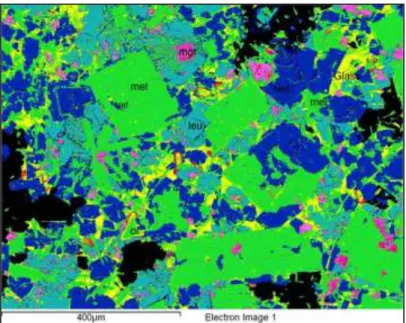
This study also avail itself of the use of the scanning electron microscope (fig 3.14) to detect any minerals in the groundmass not easily distinguishable from the optical microscope alone. Petrographic analysis is described in groups with similar features.
Figure 3.14 Sem image of a melilitite
3.2.1 Nyiragongo samples Eruptive event of 1977
The 1977 lava samples resulting from an event of triggering drainage of magma stored in the crater lava lake, display a moderately porphyritic texture consisting mainly of small
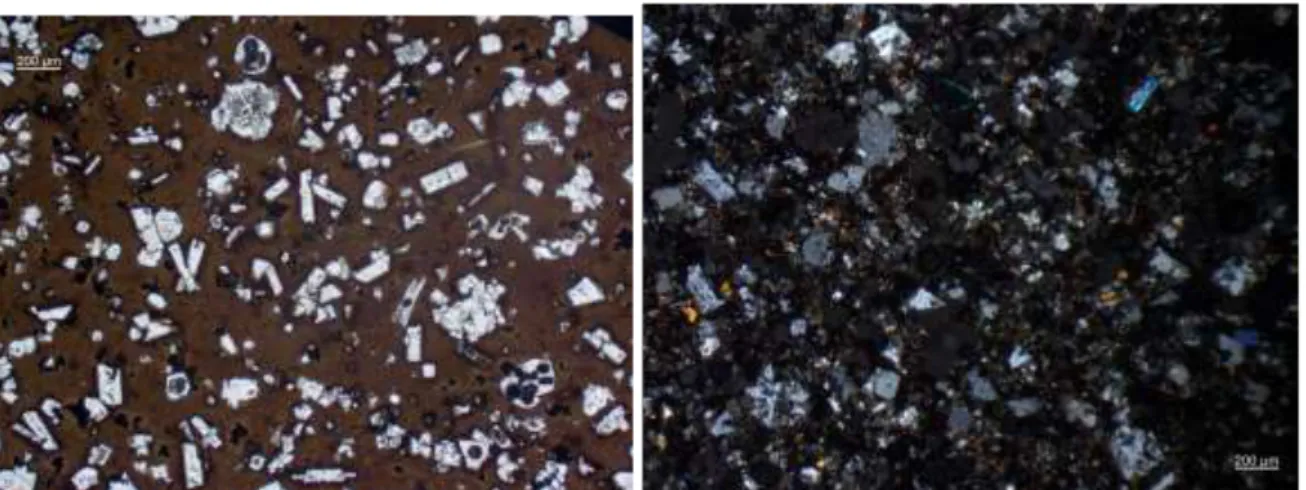
phenocrysts of olivine, clinopyroxene, melilite, nepheline and occasionally apatite (Fig. 3.15-3.16) plus diffuse magnetite, set into a hypocrystalline groundmass of the same phases plus leucite. All 1977 samples are characterized by fine grain size and not alteration of the mineral phases is visible but rather in some crystals glass inclusions occur.
Figure 3.15-3.16 Plane and cross polarized light images of the texture of 1977 representative sample.
Eruptive event of 2002
Also the 2002 lava samples come from a huge triggering drainage of magma from the lava lake which create few lava flows: proximal ones within Shaheru cone (Shaheru rock group) and distal ones up to the lake Kivu along the Muningi/Monigi fracture (Muningi rock group). Both rock groups are characterized by similar petrographic features: despite the different grain size distribution of crystals in all the thin sections, the texture is porphyritic and the predominant phase is euhedral melilite (fig 3.17-3.18). The groundmass varies from holocrystalline (fig 3.19) to hypohyaline (fig 3.17; 3.21), the phenocrysts consist mainly in melilite, (as previously mentioned), nepheline, olivine, leucite, clinopyroxene in decreasing order of abundance, plus diffuse magnetite microliths and accessory apatite.
Figure 3.19-3.22 Plane and cross polarized light images and Sem images of the texture of 2002 representative sample
Eruptive event of 2016
Sample NY16 is characterized by a moderately porphyritic (porphyritic index P.I. about 3%) texture dominated by small euhedral melilite phenocrysts, euhedral to subhedral olivine, nepheline (occasionally forming monomineralic aggregates), leucite and clinopyroxene phenocrysts, generally smaller with respect to those observed in samples from 2002 eruption. The groundmass consists of a highly vesicular brown glass with sparse magnetite (locally occurring also as phenocrysts) and apatite microliths (Fig 3.23-3.24).
Figure 3.23-3.24: Plane polarized light images of the texture of 2016 representative sample
Scoria cones of Lac Vert and Mont Goma
Samples from Lac Vert cone present a highly porphyritic glomero-porphyritic texture consisting mainly of big phenocrysts of olivine, melilite and some clinopyroxene,set into a hypocrystalline groundmass with magnetite and sparse apatite microlithis plus the other principal mineal phases mentioned above.
Mont Goma samples on the contrary are ash/cineritic lithotypes and they present a vitrophiric texture with sparse phenocrysts of clinopyroxene and magnetite (fig 3.25-3.28).
Figure 3.25-3.28 Plane and cross polarized light images of the texture of scoria cones representative sample
3.2.1 Nyamuragira samples
Eruptive events of 1938 and eruptive event of 1948
Both lava samples, 1938 ones and 1948 ones, show similar features: they display a phorphiritic glomero-porphyritic texture consisting mainly of euhedral phenocrysts of olivine, clinopyroxene, plagioclase, which often occurs in small aggregates, plus diffuse magnetite as microliths as well as inclusions odd pecilitic and accessory apatite set into a hypocrystalline groundmass (fig 3.29-3.30)