Analyzing slowly exchanging protein conformations by ion mobility mass spectrometry: study of the dynamic equilibrium of prolyl oligopeptidase
Abraham Lópeza,b, Marta Vilasecaa, Sergio Madurgac, Teresa Tarragóa,d and Ernest Giralta,b *.
a) Institute for Research in Biomedicine (IRB Barcelona), The Barcelona Institute of Science and Technology, Baldiri Reixac 10, 08028 Barcelona, Spain.
b) Department of Organic Chemistry, University of Barcelona, Martí i Franquès 1, 08028 Barcelona, Spain.
c) Department of Physical Chemistry and Research Institute of Theoretical and Computational Chemistry (IQTCUB) of University of Barcelona, Martí i Franquès 1, 08028 Barcelona, Spain.
d) Iproteos, S.L., Barcelona Science Park, Baldiri Reixac 10, 08028, Barcelona, Spain.
*Corresponding author
Keywords: protein dynamics, ion mobility mass spectrometry; conformational equilibrium, native mass spectrometry, gas-phase protein ions
Abstract
Ion mobility mass spectrometry (IMMS) is a biophysical technique that allows the separation of isobaric species on the basis of their size and shape. The high separation capacity, sensitivity and relatively fast time scale measurements confers IMMS great potential for the study of proteins in slow (μs-ms) conformational equilibrium in solution. However, the use of this technique for examining dynamic proteins is still not generalized. One of the major limitations is the instability of protein ions in the gas phase, which raises the question as to what extent the structures detected reflect those in solution. Here we addressed this issue by analyzing the conformational landscape of prolyl oligopeptidase (POP)-a model of a large dynamic enzyme in the μs-ms range-by native IMMSand compared the results obtained in the gas phase with those obtained in solution. In order to interpret the experimental results, we used theoretical simulations. In addition, the stability of POP gaseous ions was explored by charge reduction and collision induced unfolding experiments. Our experiments disclosed two species of POP in the gas phase, which correlated well with the open and closed conformations in equilibrium in solution; moreover, a gas-phase collapsed form of POP was also detected. Therefore, our findings support the potential of IMMS for the study of multiple co-existing conformations of large proteins in slow dynamic equilibrium in solution, but also stress the need for careful data analysis to avoid artefacts.
Introduction
Mass spectrometry (MS) is becoming an established methodology in structural biology1.
One of the most important breakthroughs of MS in this field was the development of soft ionization techniques, namely electrospray ionization2 (ESI) and nanoflow
1 2 3 4 5 6 7 8 9 10 11 12 13 14 15 16 17 18 19 20 21 22 23 24 25 26 27 28 29 30 31 32 33 34 35 36 37 38 39 40 41
electrospray ionization3 (nanoESI). Soft ionization techniques allowed native MS,
which pushed the limit of MS beyond mass analysis and quantification4,5. In particular, native MS was crucial for the application of ion mobility MS (IMMS) in structural biology. Ion mobility (IM) is based on the time that analyte ions take to cross a cell filled with a buffer gas under the effect of an electric field (which is known as drift time,
td)6,7. The mobility of ions strongly depends on their collision cross-section (CCS),
which is defined as the orientationally averaged area in which the protein ion collides with buffer gas molecules. Hence, coupled IMMS devices allow the simultaneous separation of gaseous protein ions not only on the basis of their mass but also on their size and shape8. IMMS has been successfully applied in the structural characterization
of proteins and non-covalent protein complexes9-11, in the study of the self-aggregation
of pathogenic proteins12-14, and in the detection of non-canonical DNA secondary
structures15,16, among others17.
Conformational dynamics is crucial for the biological function of proteins18. In
particular, the slow dynamic motions of proteins in the time scale of μs-ms are closely linked to enzyme catalysis19, allosteric regulation20, and protein-protein interactions21.
However, elucidating protein structures that fluctuate as a function of time requires biophysical techniques with fast experimental time scales that are sensitive to minor and transiently populated species. In this regard, several methods have been developed, for instance, solution nuclear magnetic resonance22 (NMR) and small-angle X-ray
scattering23 (SAXS).
Interestingly, IMMS is a promising MS-based technique for the study of proteins in slow conformational equilibrium24,25. The main advantage of this method with respect to amide hydrogen-deuterium exchange coupled to MS26 is its capacity to obtain direct
measurements of the CCS of transient species co-existing in solution. IMMS has allowed the detection of minor populated conformational ensembles of intrinsically disordered proteins in dynamic equilibrium in solution. Hence, different conformational populations are observed in the gas phase for the intrinsically disordered proteins high mobility group A (HMGA)27 and some domains and constructs of p53 protein28. This
technique also allowed the detection of transiently populated oligomeric species of β2 -microglobulin12,13, α-synuclein29,30 and the amyloid peptides Aβ40/4214,31,32, thus providing further insights into the self-aggregation mechanisms of these IDPs. Fewer examples are found in the literature concerning structured dynamic proteins analyzed by IMMS. For instance, the outward and inward conformations of P-glycoprotein were detected in the gas phase by IMMS33, as well as the two well-characterized
conformations of the multidomain protein NADPH-cytochrome P450 reductase 34. In the
case of the ICL12 ATPase subcomplex, the high conformational heterogeneity caused by the rotation of subunit I was manifested as increased peak broadening in the ion mobilograms35. However, the application of IMMS to proteins in conformational
equilibrium remains controversial. The stability of protein ions in the absence of solvent is a major concern when studying native protein structures10,36, questioning the extent to which structures in dynamic exchange in solution are transferred to the gas phase37,38. Here we used prolyl oligopeptidase (POP), an 81-KDa serine peptidase, as a model of a large protein populating various well-defined conformations in slow equilibrium in solution. 42 43 44 45 46 47 48 49 50 51 52 53 54 55 56 57 58 59 60 61 62 63 64 65 66 67 68 69 70 71 72 73 74 75 76 77 78 79 80 81 82 83 84 85 86
POP is formed by two domains, namely the α/β-hydrolase and the β-propeller39 (Figure
1 A). In vitro, this enzyme hydrolyzes short proline-containing peptides in the carboxyl side of proline40. The in vivo role of POP involves protein-protein interactions41. In
particular, recent studies have revealed that POP is involved in the clearance of α-synuclein and α-α-synuclein aggregates42-44, which are the toxic species responsible for
Parkinson’s disease. POP is likely to benefit from conformational dynamics in order to execute this function45,46. In this regard, using relaxation dispersion NMR and SAXS experiments, we have recently demonstrated that POP is in a slow ms equilibrium between open and closed conformations. This equilibrium arises from the hinge separation between the α/β-hydrolase and the β-propeller domains occurring in solution47 (Figure 1 B).
In the present study we tested the capacity of native IMMS to examine multiple co-existing protein conformers in slow equilibrium in solution using a commercial Synapt G1 mass spectrometer48 and POP as a molecule of interest. The results obtained in the
gas phase were correlated with our previous results obtained in solution47 by means of
computational simulations performed under different conditions. Moreover, the effect of the Coulomb repulsion and the stability of native structures of POP in the gas phase were examined by performing charge reduction and collision induced unfolding (CIU) experiments, respectively. Remarkably, the IMMS experiments detected two species of POP that correlated well with the open and closed conformations in dynamic equilibrium. Therefore, our findings emphasize the value of IMMS for the study of multiple co-existing conformations of large proteins in slow equilibrium in solution.
Materials and methods
Chemicals and protein expression
All chemicals used for the preparation of MS buffers were of analytical grade and were purchased from Sigma-Aldrich (St. Louis, MO, USA). The water used in buffers was LC-MS grade and was purchased from the same company. Cells were provided by Novagen (Merck-Millipore, Darmstadt, Germany). Affinity and size exclusion chromatography columns were purchased from GE Healthcare (Little Chalfont, UK). Buffer exchange columns were from Bio-Rad (Hercules, CA, USA).
POP was expressed in E.coli cells using pET-11 plasmid containing the human POP gene, following our standard protocol47. In order to eliminate interferences with the CCS
measurements, HisTag was removed by digestion with TEV protease. Gel filtration chromatography in the last step of protein purification was critical to achieve satisfactory quality and reproducibility of the results. Given that POP is sensitive to pH and ionic strength49, we used 50 mM NH
4AcO pH = 8 as native MS buffer. POP showed adequate stability and retained the enzymatic activity in this buffer. Moreover, NH4AcO favored the stability of native structures in the gas phase50 and prevented the formation
of adducts. In order to perform buffer exchange, HisTag-cleaved POP samples in storage buffer (50 mM Tris, 20 mM Nacl, pH = 8) were doubly exchanged to MS buffer with Micro Bio-Spin P-30 columns immediately prior to the experiments; similarly, protein standards used for calibration were doubly buffer-exchanged with Micro Bio-87 88 89 90 91 92 93 94 95 96 97 98 99 100 101 102 103 104 105 106 107 108 109 110 111 112 113 114 115 116 117 118 119 120 121 122 123 124 125 126 127 128 129
Spin P-6 columns. Typically, a protein concentration of 10-15 μM was used in all experiments. For charge reduction experiments, sample preparation was identical, but using 50 mM NH4AcO with 0.05 % imidazole pH = 8 as buffer. All experiments consisted of triplicate protein batches expressed and purified separately.
Optimization of the instrumental conditions
All experiments were carried out with a Synapt G1 spectrometer (Waters, Manchester, UK)48. A chip-based Triversa Nanomate nanoESI source (Advion Inc., NY, USA)
operating in the positive mode was used. In order to obtain native POP ions and avoid unfolding, instrumental conditions were optimized near threshold values. The capillary potential, trap collision energy (CE) and trap DC bias were crucial to ensure the stability of native POP structures51. These parameters were therefore kept at the minimum. In
particular, we chose a capillary potential of 1.75 kV, a trap CE of 6 V, and a trap DC bias of 15. In turn, backing pressure was minimized to 3 mbar to prevent structural alterations52. The remaining parameters were the following: 20 V for the sampling cone;
1 V for the extraction cone; and 6 V for transfer collision energy. Automatic trap release was used in all experiments. In the case of CIU experiments, the trap CE voltage was incremented in a step-wise fashion while maintaining other instrumental values51. In
particular, trap CE voltages were sampled at 6 (native), 15, 20, 25, 30 and 35 V. For the IM separation we used N2 as buffer gas, at a pressure of 0.46 bar and flow of 24 ml/min52; in turn, the IM resolution was optimized by tuning simultaneously the
travelling wave height and velocity52. Hence, the T-wave velocity was tuned at 300 m/s,
while triplicate experiments at various T-wave heights (8, 9 and 10 V) were systematically performed in order to prevent electric field inhomogeneities52,53. The TOF mass analyzer was tuned and calibrated between 500 and 8000 m/z, in a V reflector mode. For data processing, MassLynx v.4.1 SCN 704 and Driftscope v.2.4 programs were used. In order to perform Gaussian fitting, ion mobility traces were extracted manually from Driftscope and exported as numerical lists. Afterwards, Gaussian functions were adjusted with the GraphPad Prism 4 software (La Jolla, CA, USA). Extraction of experimental and theoretical CCSs
Experimental CCSs were extracted following the native calibration protocol described by Bush and co-workers54 (see Supporting information). Transthyretin tetramer, bovine
serum albumin, and concanavalin A were the native standard proteins used in the calibration of POP ions. Calibration plots were created using the tabulated CCSs of native protein standards in N2. CCSs were extracted from the experimental td with the
calibration plot. Afterwards, results were averaged for all replicates, and the error was given as the standard error of the mean. The use of N2 must be considered when comparing experimental and theoretical CCSs. The calculations used He as in silico buffer gas54, which yields smaller values than those determined experimentally in N
255. The theoretical determination of CCSs was performed with the MOBCAL program56,57 using the atomic coordinates of POP structures. The trajectory method was used, and a representative charge of +20 was assigned for the calculations.
Computational simulations of POP under different conditions 130 131 132 133 134 135 136 137 138 139 140 141 142 143 144 145 146 147 148 149 150 151 152 153 154 155 156 157 158 159 160 161 162 163 164 165 166 167 168 169 170 171
Replica exchange molecular dynamics (REMD) simulations of POP were performed with explicit TIP3P water molecules58. The protonation state of residues corresponding
to the default protonation state determined by GROMACS59,60 at neutral pH was used in REMD I. In order to promote conformational rearrangements in REMD II, the protonated state of Asp, Glu and His residues was used. An ionic strength of 0.1 M of NaCl was used, and periodic boundary conditions were applied in a system of about 10×10×10 nm3. First, the system was equilibrated by means of 100 ps of a MD calculation with protein heavy atoms restrained. REMD simulations were performed using 18 replicas distributed over range from 300 to 327 °K, where multiple replicas of identical systems were simulated in parallel at various temperatures. The frequency of exchange was selected to have an average accepted exchange every 400 ps for each temperature. REMD I and II simulations were performed for a simulation time of 8.4 and 20 ns, respectively. The structure with a detached loop A obtained in the replica with highest temperature of REMD II (see Results and discussion section) was used as a starting structure for an additional 20-ns REMD simulation at neutral pH (REMD III). We used 75 and 187 structures of REMD I and III simulations, respectively, to calculate the theoretical CCSs as described previously (see Supporting information).
Classical MD simulations in vacuum were also performed with 10 distinct protonation states of a +20 charge state of POP. All simulations were performed using GROMACS software package version 4.5.559 with the AMBER03 force field in the NVT ensemble.
An integration time step of 2 fs was used. A cut-off value of 1.0 nm was fixed for Van der Waals interactions; electrostatic interactions were treated with the particle mesh Ewald method, applying a real-space cut-off of 1.0 nm. No cut-off was used for either electrostatic or Lennard-Jones interactions in the gas phase. A representative charge state of +20 was chosen for in vacuum MD simulations. A semi-grand canonical Monte Carlo procedure was designed to provide a pool of microstates with a protonation distribution of charged residues compatible with this overall charge. Protonation/deprotonation processes of ionizable residues in vacuum depend on gas-phase basicities. We estimated these basicities from pKa values obtained in solution, assuming that this approximation will not significantly affect the final protonation states in the gas phase. The Monte Carlo algorithm considered the free energy associated with the protonation/deprotonation process of each charged residue according to the following equation (1)61,62:
∆ G=±kBT
(
ln(10))
(
pH −log(
Ki))
Equation1A positive sign was used for protonation, whereas a negative sign was used for deprotonation. Ki is the protonation constant of each charged residue i, obtained from
the PropKa program through the web server63. Monte Carlo simulations were performed
using a pH value of 5, in a total of 100000 steps. Then, for the 10 selected microstates, MD simulations were carried out for 6 ns. In order to reproduce the conditions in the IM cell, an effective temperature of 313°K was used in the calculations. This microscopic temperature was obtained by adapting the Mason-Schamp equation6 in order to take into
account field heating64 (Equation 2):
Teff=Tgas+Tfield=298+MN 3 kB
[
2 vds2 s +vd]
Equation2 172 173 174 175 176 177 178 179 180 181 182 183 184 185 186 187 188 189 190 191 192 193 194 195 196 197 198 199 200 201 202 203 204 205 206 207 208 209 210 211 212 213 214Where MN is the mass of a molecule of buffer gas (in kg), kB is the Boltzmann constant,
s is the TWIMS wave velocity (300 m/s), and vd is the drift velocity of the analyte ion
(which was estimated as 26.4 m/s). Structures were sampled at 11 time points during the production run, from 1.5 to 6 ns in 500-ps intervals (see Figure S3 of the Supporting information). Finally, the CCS was averaged for all 10 simulations (110 final structures).
Results and discussion
To date, the study of dynamic proteins by IMMS has focused mainly on intrinsically disordered proteins. These proteins populate a broad conformational space in fast equilibrium, thus challenging IM separation. Therefore, in order to evaluate the capacity of IMMS to characterize protein conformations in dynamic equilibrium, two main issues must be considered. First, the need of reference data based on solution-based experimental techniques, which allows the interpretation and comparison of the results obtained in the gas phase with those obtained in solution. Second, the compatibility between the time scale of the conformational exchange and the time resolution of the IM separation, which typically lies in the range of several ms65. For these reasons, here
we analyzed the slow conformational equilibrium of POP by IMMS and established the correlation between the results obtained in the gas phase with those obtained with solution-based techniques47.
Native POP ions in the gas phase
Native mass spectra of POP showed +17 to +21 charge states, the most populated being +18, +19 and +20 (Figure 2 A). Extracted ion mobilograms disclosed various peaks, corresponding to partially resolved species of POP in the gas phase (Figures 2 A and B). As shown, the populations of these species depend on the charge state. In order to quantify these species, the ion mobilograms were individually fitted to Gaussian functions following Pujol-Pina et al.14 (Figure 2 A). In the case of +17 charge state, a
single major population was present, namely species A. In the case of the +18 charge state, two additional peaks were observed at higher td, named as species B and C.
Hence, the ion mobilogram was adjusted to three Gaussian functions corresponding to species A, B and C. The fitting to three Gaussian functions was also performed for +19 and +20 charge states. Finally, in the case of the +21 charge state, only two Gaussian functions corresponding to species B and C were fitted. In order to monitor the dependence of the occurrence of species on the charge state, the relative population was calculated for each i specie according to the following formula (Equation 3):
Relative population(i)= Ai
AA+AB+AC
Equation3
Where AX is the area of the fitted Gaussian function of a given species. The plot of the
relative populations as a function of the charge state is shown in Figure 3 A (upper panel). The relative population of species A decreased as a function of the charge state, while that of species B was relatively constant between +18 and +21 charge states. Conversely, the relative population of species C increased with the charge state.
215 216 217 218 219 220 221 222 223 224 225 226 227 228 229 230 231 232 233 234 235 236 237 238 239 240 241 242 243 244 245 246 247 248 249 250 251 252 253 254 255
Next, the experimental CCSs of species A, B and C were calculated from td values using
the native calibration protocol54, as described in the Materials and methods section
(Figure 3 A, lower panel). In all species, the CCSs increased steadily as a function of the charge state. This phenomenon is attributed to the higher Coulomb repulsion experienced by multiply charged gaseous ions in the absence of solvent, which causes an expansion of the tertiary structure10,66. The experimental CCSs summarized in Table 1 (left panel) reveal large differences between species (approximately 7% between species A and B, and 10% between species B and C). According to these values, the three species of POP in the gas phase can be assigned to different conformations, probably originated by large-scale rearrangements. Overall, these results correlate with the charge state distribution: the increased population of species C at higher charge states reflects the higher exposure of protonated residues in conformations with a larger CCS9,67. Structural properties of gaseous POP species
Analysis of the structural features of POP species in the gas phase requires the combination of experimental and simulated data. For this reason, we explored the conformational space of POP in solution and in the gas phase by performing simulations under different conditions. The theoretical CCSs of the simulated structures were calculated with the MOBCAL program56,57 (see Materials and methods). This procedure allowed us to establish correlations between the simulated structures of POP and the experimental CCS values.
First, we considered the open conformations of POP in solution described in our previous work47. Since these structures were obtained by a hybrid approach combining
SAXS experiments and MD simulations, we directly used the coordinates for the calculation of the theoretical CCSs. In particular, the three structures displaying larger interdomain angles (measured as the angle formed by residues 582-71-177) were selected. As seen in Figure 3 A and Table 1, the theoretical CCS of the open conformation obtained with this approach was in good agreement with that of species C in the gas phase. Given the significant broadening of the IM peak, it can be speculated that species C correspond to an ensemble of open conformations of POP featuring an interdomain separation similar to that found in solution. It cannot be ruled out that the broad distribution also includes several structures originated by gas-phase rearrangements during the IM experiments, especially considering that the population of these species increases under collisional activation (see below). According to the literature, compact states of proteins have been found to undergo gas-phase transitions towards extended forms during tens of ms37,68-70, but the extent of these transitions is minimized in the case of using gentle instrumental conditions67 . Hence, gas-phase transitions are expected to be low due to the relatively fast experimental time scale (25.6 ms) and the stability of native POP structures under the mild conditions used here. Nevertheless, in order to discard extensive gas-phase transitions occurring during the IM separation, different experiments were performed in which the drift times of POP species were varied (see Supporting information and Figure S4). The absence of large population changes confirms that species observed in the gas phase mainly reflect the conformational heterogeneity in solution.
256 257 258 259 260 261 262 263 264 265 266 267 268 269 270 271 272 273 274 275 276 277 278 279 280 281 282 283 284 285 286 287 288 289 290 291 292 293 294 295 296 297 298
In the case of the closed conformation, we explored the conformational space of POP in solution by REMD simulations under different conditions, using the X-ray structure 1H2W as starting point. First, we performed a short REMD simulation with explicit solvent molecules at neutral pH (REMD I). Since we did not observe major conformational rearrangements in this simulation, the flexible loops surrounding the active site (inset of Figure 1 A) were detached by performing a REMD simulation at acidic pH (REMD II). At low pH, the replica with the highest temperature showed that loop A spontaneously detached and opened a small cavity (Figure 3 B). Afterwards, the structure of POP with loop A detached was stabilized by running an additional REMD simulation at neutral pH (REMD III). As seen in Figure 3 A and Table 1, the CCSs obtained by REMD I and III simulations showed a good correlation with those of species B. Moreover, the theoretical CCSs obtained by the two simulations showed only small variations (< 3 %), indicating that the structural fluctuations of loop A would not be resolved from the IM peak of species B. Hence, we can establish a correlation between the closed conformation of POP in solution and species B in the gas phase, which probably has a certain degree of loop flexibility. In addition, according to our previous study using solution-based biophysical methods47, the open and closed
conformations of POP are almost equally populated in solution. Similarly, the relative populations of species B and C at the intermediate charge states +19 and +20 are 0.40 vs. 0.34, respectively (the contributions of the open and closed structures in these charge states are expected to be similar).
Finally, we examined the effect of the solvent on the stability of POP ions in the gas phase by performing MD simulations in vacuum. In order to obtain representative results, a net charge state of +20 was assumed. Ten microstates with different protonation states compatible with +20 overall charge were generated and used as starting structures for MD simulations (see Materials and methods). Analysis of the tertiary structures obtained by these simulations disclosed no large-scale structural rearrangements in vacuum. However, the averaged RMSD of 3.2 Å with respect to the X-ray structure 1H2W indicated certain variations of POP structures in vacuum. The overlay of the gaseous structures with the X-ray structure showed that some of the β-propeller blades and β-turns experienced tighter packing around the central tunnel of the β-propeller; in addition, certain parts of the N- and C-terminal regions also adopted a more compact conformation (Figure 3 C). Interestingly, the average CCS of these simulated POP structures in the gas phase were in good correlation with species A (Figure 3 A and Table 1). This result indicates that species A is originated by the structural collapse of gaseous POP ions in the absence of the stabilizing effect of the solvent.
Charge reduction of POP ions
In order to minimize the Coulomb repulsion in gaseous POP ions, we performed IMMS experiments using charge-reducing strategies. In particular, we applied the ion cooling mechanism via addition of imidazole in order to explore charge-reduced ions of POP (see Materials and methods)38,71. Hence, in the presence of 0.05 % imidazole, the charge state distribution of POP was expanded from +11 to +20 charge states (Figure 4 A). Due to calibration limitations, it was only possible to analyze the ion mobilograms from +15 to +20 charge states. Ion mobilograms were adjusted to Gaussian functions as described 299 300 301 302 303 304 305 306 307 308 309 310 311 312 313 314 315 316 317 318 319 320 321 322 323 324 325 326 327 328 329 330 331 332 333 334 335 336 337 338 339 340 341 342 343
previously in order to quantify the species present at each charge state. As shown in Figure 4 B, +15 and +16 charge states exclusively revealed species A, while the + 17 charge state indicated the presence of species A and B. In turn, +18 to +20 charge states consisted of species A, B and C.
Analysis of the relative populations as a function of the charge state (Figure S5, upper panel) revealed that decreasing Coulomb repulsion favors species A. Hence, it can be hypothesized that the interplay between attractive intramolecular interactions in vacuum and Coulomb repulsion prevents the structural collapse of POP gaseous ions at higher charge states, thereby favoring the native B and C species10. However, the presence of
imidazole resulted in high CCS for all species at high charge states (+19 and +20, Figure S5, lower panel). This expansion is attributed to the destabilization of gaseous protein ions at high charge states caused by charge-reducing agents, as described by Bornschein et al72.
Stability and unfolding of gaseous POP species
After addressing the effect of Coulomb repulsion on gaseous POP ions, we monitored the stability of species A, B and C by forcing unfolding in the gas phase. To do this, we performed CIU experiments (see Materials and methods)73,74, in which the kinetic energy of ions in the trap region is increased by raising the trap CE voltage. As a consequence of the increased collisional activation of the ions with the gas molecules, ions undergo structural transitions in the gas phase and show less folded forms. Afterwards, ions are injected to the IM cell and analyzed normally. Hence, the collisional activation required for gas-phase transitions reflects the thermodynamic stability of gaseous ions. Figure 5 A and B shows the ion mobilograms and relative populations of the species present in the representative charge state +19 as a function of the trap CE voltage, respectively. The relative populations of species A and B decreased as a function of voltage, and disappeared at 25 and 30 V, respectively. In contrast, the relative population of species C reached a maximum at 25 V. We hypothesized that species A and B experience a separation between the α/β-hydrolase and β-propeller domains in the gas phase upon collisional activation, thereby leading to a new distribution of open states of POP with CCSs similar to that of species C.
New highly extended species D and E were detected at high trap CE voltages (25 and 30 V, respectively). The occurrence of these extended species implies a striking decrease in the relative population of species C. The CCS of species D was 65.8 ± 0.4 nm2 and is expected to be much higher for species E (the limitations of the calibration protocol prevented the calculation of the CCS of this species). Hence, species D and E correspond to ensembles of denatured forms of POP, which arose by the unfolding of certain domains or regions of native POP ions at high collisional activation74. In
particular, the high collisional activation required to unfold native POP ions indicates the stability of species B and C in the gas phase and discards the existence of artefactual species in the mild experimental conditions used in our experiments.
Conclusions 344 345 346 347 348 349 350 351 352 353 354 355 356 357 358 359 360 361 362 363 364 365 366 367 368 369 370 371 372 373 374 375 376 377 378 379 380 381 382 383 384 385
Here we evaluated the capacity of IMMS to analyze the different conformations of large proteins in slow equilibrium in solution. For this purpose, we analyzed POP, a large bidomain enzyme in a slow open/close conformational equilibrium, by IMMS. Our experiments disclosed three species of POP in the gas phase. Two of these species correlated well with the co-existing open and closed conformations in equilibrium in solution, while the third corresponded to a gas-phase collapsed form. In order to transfer the native conformational equilibrium in solution to the gas phase and minimize gas-phase derived artefacts, we carefully optimized the instrumental conditions. Theoretical simulations under different conditions allowed the interpretation of the results. In particular, the conformational space of POP in solution and in vacuum was simulated in order to evaluate the stabilizing effect of the solvent. We also used charge-reducing strategies and CIU experiments to provide qualitative insights into the Coulomb repulsion and the thermodynamic stability of gaseous ions, respectively. Hence, we conclude that IMMS is a highly versatile biophysical technique for the study of multiple protein conformers in slow exchange in solution, overcoming the limitations associated with other biophysical techniques. The relatively fast time scale, the high sensitivity and resolution, and the tolerance of a wide range of molecular sizes and complexity confers IMMS great potential for the analysis of protein conformations co-existing in slow equilibrium in solution. This work provides additional support for the previous IMMS studies performed on a wide variety of biomolecules. Our findings are coherent with the fact that the multiple co-existing protein species detected by this technique can be effectively correlated to dynamic processes of biological relevance occurring in solution. In particular, previous studies detected different populations of IDPs arising from the fast exchange between conformational ensembles27,28, as well as the conformational heterogeneity of large proteins and protein complexes originated by structural flexibility33-35. In the case of self-aggregating proteins, our results sustain that
transient conformations or oligomeric species detected by IMMS can be closely related to those occurring in solution during the complex and dynamic aggregation process 12-14,29-32. However, we stress the importance of careful optimization of the experimental conditions in order to avoid artefacts. In this regard, standardization of methodological procedures, as well as development of stabilizing buffer molecules or ions in MS73,75,76 would help to ensure transferring native protein structures to the gas phase. Finally, we also emphasize the need to use theoretical approaches to analyze the data and to validate the results.
Acknowledgements
This work was supported by the Institute for Research in Biomedicine, MINECO-FEDER (Bio2013-40716-R), the Spanish Ministry of Education and Science (Projects CTM2012-39183) and the Generalitat de Catalunya (XRB and Grup Consolidat 2014SGR521 and 2014SGR1017). AL received funding from the Instituto de Salud Carlos III. The IRB Barcelona Mass Spectrometry Core Facility is a ProteoRed laboratory, part of PRB2-ISCIII. It is supported by grant PT13/0001 and is active group participant in the European COST Action BM 1403 (Native Mass Spectrometry and
Related Methods for Structural Biology).
386 387 388 389 390 391 392 393 394 395 396 397 398 399 400 401 402 403 404 405 406 407 408 409 410 411 412 413 414 415 416 417 418 419 420 421 422 423 424 425 426 427 428 429
(1) Benesch, J. L.; Ruotolo, B. T. Current Opinion in Structural Biology 2011, 21, 641.
(2) Fenn, J. B.; Mann, M.; Meng, C. K.; Wong, S. F.; Whitehouse, C. M.
Science (New York, N.Y.) 1989, 246, 64.
(3) Wilm, M. S.; Mann, M. International Journal of Mass Spectrometry and
Ion Processes 1994, 136, 167.
(4) Ruotolo, B. T.; Robinson, C. V. Current Opinion in Chemical Biology 2006, 10, 402.
(5) Heck, A. J. Nat Methods 2008, 5, 927.
(6) Mason, E. A.; McDaniel, E. W. Wiley, New York. 1988. (7) Langevin, P. Ann. Chim. Phys. 1903, 28, 289.
(8) McDaniel, E. W.; Martin, D. W.; Barnes, W. S. Review of Scientific
Instruments 1962, 33, 2.
(9) Clemmer, D. E.; Jarrold, M. F. Journal of Mass Spectrometry 1997, 32, 577.
(10) Shelimov, K. B.; Clemmer, D. E.; Hudgins, R. R.; Jarrold, M. F. Journal
of the American Chemical Society 1997, 119, 2240.
(11) Ruotolo, B. T.; Giles, K.; Campuzano, I.; Sandercock, A. M.; Bateman, R. H.; Robinson, C. V. Science (New York, N.Y.) 2005, 310, 1658.
(12) Smith, D. P.; Radford, S. E.; Ashcroft, A. E. Proceedings of the National
Academy of Sciences of the United States of America 2010, 107, 6794.
(13) Woods, L. A.; Platt, G. W.; Hellewell, A. L.; Hewitt, E. W.; Homans, S. W.; Ashcroft, A. E.; Radford, S. E. Nature chemical biology 2011, 7, 730.
(14) Pujol-Pina, R.; Vilaprinyó-Pascual, S.; Mazzucato, R.; Arcella, A.; Vilaseca, M.; Orozco, M.; Carulla, N. Scientific Reports 2015, 5, 14809.
(15) Arcella, A.; Portella, G.; Ruiz, M. L.; Eritja, R.; Vilaseca, M.; Gabelica, V.; Orozco, M. Journal of the American Chemical Society 2012, 134, 6596.
(16) Porter, K. C.; Beck, J. L. International Journal of Mass Spectrometry 2011, 304, 195.
(17) Lopez, A.; Tarrago, T.; Vilaseca, M.; Giralt, E. New Journal of Chemistry 2013, 37, 1283.
(18) Henzler-Wildman, K.; Kern, D. Nature 2007, 450, 964.
(19) Eisenmesser, E. Z.; Bosco, D. A.; Akke, M.; Kern, D. Science 2002, 295, 1520.
(20) Tzeng, S.-R.; Kalodimos, C. G. Nature 2009, 462, 368.
(21) Boehr, D. D.; Nussinov, R.; Wright, P. E. Nature chemical biology 2009,
5, 789.
(22) Korzhnev, D. M.; Kay, L. E. Acc Chem Res 2008, 41, 442. (23) Bernado, P.; Svergun, D. I. Molecular bioSystems 2012, 8, 151.
(24) Zhou, M.; Robinson, C. V. Current Opinion in Structural Biology 2014,
28, 122.
(25) Lanucara, F.; Holman, S. W.; Gray, C. J.; Eyers, C. E. Nat Chem 2014, 6, 281.
(26) Wales, T. E.; Engen, J. R. Mass spectrometry reviews 2006, 25, 158. (27) Maurizio, E.; Cravello, L.; Brady, L.; Spolaore, B.; Arnoldo, L.; Giancotti, V.; Manfioletti, G.; Sgarra, R. Journal of proteome research 2011, 10, 3283.
(28) Pagel, K.; Natan, E.; Hall, Z.; Fersht, A. R.; Robinson, C. V. Angew
Chem Int Ed Engl 2013, 52, 361.
430 431 432 433 434 435 436 437 438 439 440 441 442 443 444 445 446 447 448 449 450 451 452 453 454 455 456 457 458 459 460 461 462 463 464 465 466 467 468 469 470 471 472 473 474 475 476 477 478
(29) Bernstein, S. L.; Liu, D.; Wyttenbach, T.; Bowers, M. T.; Lee, J. C.; Gray, H. B.; Winkler, J. R. J Am Soc Mass Spectrom 2004, 15, 1435.
(30) Illes-Toth, E.; Dalton, C. F.; Smith, D. P. J Am Soc Mass Spectrom 2013,
24, 1346.
(31) Bernstein, S. L.; Wyttenbach, T.; Baumketner, A.; Shea, J. E.; Bitan, G.; Teplow, D. B.; Bowers, M. T. J Am Chem Soc 2005, 127, 2075.
(32) Bernstein, S. L.; Dupuis, N. F.; Lazo, N. D.; Wyttenbach, T.; Condron, M. M.; Bitan, G.; Teplow, D. B.; Shea, J.-E.; Ruotolo, B. T.; Robinson, C. V.; Bowers, M. T. Nature chemistry 2009, 1, 326.
(33) Marcoux, J.; Wang, S. C.; Politis, A.; Reading, E.; Ma, J.; Biggin, P. C.; Zhou, M.; Tao, H.; Zhang, Q.; Chang, G.; Morgner, N.; Robinson, C. V. Proceedings of
the National Academy of Sciences 2013, 110, 9704.
(34) Jenner, M.; Ellis, J.; Huang, W.-C.; Lloyd Raven, E.; Roberts, G. C. K.; Oldham, N. J. Angewandte Chemie International Edition 2011, 50, 8291.
(35) Zhou, M.; Morgner, N.; Barrera, N. P.; Politis, A.; Isaacson, S. C.; Matak-Vinković, D.; Murata, T.; Bernal, R. A.; Stock, D.; Robinson, C. V. Science (New York,
N.Y.) 2011, 334, 380.
(36) Hoaglund-Hyzer, C. S.; Counterman, A. E.; Clemmer, D. E. Chem Rev 1999, 99, 3037.
(37) Badman, E. R.; Hoaglund-Hyzer, C. S.; Clemmer, D. E. Analytical
Chemistry 2001, 73, 6000.
(38) van Duijn, E.; Barendregt, A.; Synowsky, S.; Versluis, C.; Heck, A. J.
Journal of the American Chemical Society 2009, 131, 1452.
(39) Fulop, V.; Bocskei, Z.; Polgar, L. Cell 1998, 94, 161.
(40) Cunningham, D. F.; O'Connor, B. The international journal of
biochemistry & cell biology 1998, 30, 99.
(41) Di Daniel, E.; Glover, C. P.; Grot, E.; Chan, M. K.; Sanderson, T. H.; White, J. H.; Ellis, C. L.; Gallagher, K. T.; Uney, J.; Thomas, J.; Maycox, P. R.; Mudge, A. W. Molecular and cellular neurosciences 2009, 41, 373.
(42) Myohanen, T. T.; Hannula, M. J.; Van Elzen, R.; Gerard, M.; Van Der Veken, P.; Garcia-Horsman, J. A.; Baekelandt, V.; Mannisto, P. T.; Lambeir, A. M.
British journal of pharmacology 2012, 166, 1097.
(43) Savolainen, M. H.; Richie, C. T.; Harvey, B. K.; Mannisto, P. T.; Maguire-Zeiss, K. A.; Myohanen, T. T. Neurobiology of disease 2014, 68, 1.
(44) Savolainen, M. H.; Yan, X.; Myohanen, T. T.; Huttunen, H. J. The
Journal of biological chemistry 2015.
(45) Kichik, N.; Tarrago, T.; Claasen, B.; Gairi, M.; Millet, O.; Giralt, E.
Chembiochem : a European journal of chemical biology 2011, 12, 2737.
(46) Kaszuba, K.; Rog, T.; Danne, R.; Canning, P.; Fulop, V.; Juhasz, T.; Szeltner, Z.; St Pierre, J. F.; Garcia-Horsman, A.; Mannisto, P. T.; Karttunen, M.; Hokkanen, J.; Bunker, A. Biochimie 2012, 94, 1398.
(47) Lopez, A.; Herranz-Trillo, F.; Kotev, M.; Gairi, M.; Guallar, V.; Bernado, P.; Millet, O.; Tarrago, T.; Giralt, E. Chembiochem : a European journal of chemical
biology 2016.
(48) Pringle, S. D.; Giles, K.; Wildgoose, J. L.; Williams, J. P.; Slade, S. E.; Thalassinos, K.; Bateman, R. H.; Bowers, M. T.; Scrivens, J. H. International Journal
of Mass Spectrometry 2007, 261, 1.
(49) Polgar, L. European journal of biochemistry / FEBS 1991, 197, 441. (50) Hernandez, H.; Robinson, C. V. Nat Protoc 2007, 2, 715.
(51) Hopper, J. S.; Oldham, N. J Am Soc Mass Spectrom 2009, 20, 1851. 479 480 481 482 483 484 485 486 487 488 489 490 491 492 493 494 495 496 497 498 499 500 501 502 503 504 505 506 507 508 509 510 511 512 513 514 515 516 517 518 519 520 521 522 523 524 525 526 527 528
(52) Ruotolo, B. T.; Benesch, J. L. P.; Sandercock, A. M.; Hyung, S.-J.; Robinson, C. V. Nat. Protocols 2008, 3, 1139.
(53) Michaelevski, I.; Eisenstein, M.; Sharon, M. Analytical Chemistry 2010,
82, 9484.
(54) Bush, M. F.; Hall, Z.; Giles, K.; Hoyes, J.; Robinson, C. V.; Ruotolo, B. T. Analytical Chemistry 2010, 82, 9557.
(55) Jurneczko, E.; Kalapothakis, J.; Campuzano, I. D. G.; Morris, M.; Barran, P. E. Analytical Chemistry 2012, 84, 8524.
(56) Shvartsburg, A. A.; Jarrold, M. F. Chemical Physics Letters 1996, 261, 86.
(57) Mesleh, M. F.; Hunter, J. M.; Shvartsburg, A. A.; Schatz, G. C.; Jarrold, M. F. The Journal of Physical Chemistry 1996, 100, 16082.
(58) Jorgensen, W. L.; Chandrasekhar, J.; Madura, J. D.; Impey, R. W.; Klein, M. L. The Journal of Chemical Physics 1983, 79, 926.
(59) Hess, B.; Kutzner, C.; van der Spoel, D.; Lindahl, E. Journal of
Chemical Theory and Computation 2008, 4, 435.
(60) Berendsen, H. J. C.; van der Spoel, D.; van Drunen, R. Computer Physics
Communications 1995, 91, 43.
(61) Madurga, S.; Rey-Castro, C.; Pastor, I.; Vilaseca, E.; David, C.; Garcés, J. L.; Puy, J.; Mas, F. The Journal of Chemical Physics 2011, 135, 184103.
(62) Madurga, S.; Garcés, J.; Companys, E.; Rey-Castro, C.; Salvador, J.; Galceran, J.; Vilaseca, E.; Puy, J.; Mas, F. Theor Chem Acc 2009, 123, 127.
(63) Li, H.; Robertson, A. D.; Jensen, J. H. Proteins 2005, 61, 704.
(64) Morsa, D.; Gabelica, V.; De Pauw, E. Analytical Chemistry 2011, 83, 5775.
(65) Giles, K.; Williams, J. P.; Campuzano, I. Rapid communications in mass
spectrometry : RCM 2011, 25, 1559.
(66) Jarrold, M. F. Accounts of Chemical Research 1999, 32, 360.
(67) Wyttenbach, T.; Bowers, M. T. The Journal of Physical Chemistry B 2011, 115, 12266.
(68) Badman, E. R.; Myung, S.; Clemmer, D. E. J Am Soc Mass Spectrom 2005, 16, 1493.
(69) Breuker, K.; McLafferty, F. W. Proceedings of the National Academy of
Sciences 2008, 105, 18145.
(70) Myung, S.; Badman, E. R.; Lee, Y. J.; Clemmer, D. E. The Journal of
Physical Chemistry A 2002, 106, 9976.
(71) Catalina, M. I.; van den Heuvel, R. H.; van Duijn, E.; Heck, A. J.
Chemistry (Weinheim an der Bergstrasse, Germany) 2005, 11, 960.
(72) Bornschein, R. E.; Hyung, S. J.; Ruotolo, B. T. J Am Soc Mass Spectrom 2011, 22, 1690.
(73) Freeke, J.; Bush, M. F.; Robinson, C. V.; Ruotolo, B. T. Chemical
Physics Letters 2012, 524, 1.
(74) Koeniger, S. L.; Clemmer, D. E. J Am Soc Mass Spectrom 2007, 18, 322. (75) Freeke, J.; Robinson, C. V.; Ruotolo, B. T. International Journal of Mass
Spectrometry 2010, 298, 91.
(76) Han, L.; Hyung, S.-J.; Ruotolo, B. T. Angew Chem Int Ed Engl 2012, 51, 5692. 529 530 531 532 533 534 535 536 537 538 539 540 541 542 543 544 545 546 547 548 549 550 551 552 553 554 555 556 557 558 559 560 561 562 563 564 565 566 567 568 569 570 571 572 573 574 575 576 577
Tables
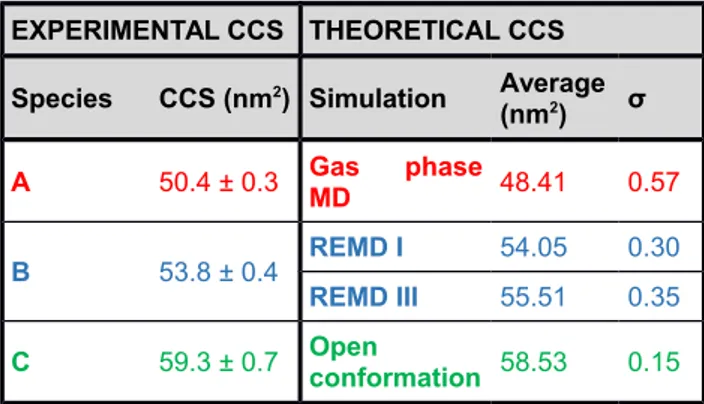
Table 1: Experimental (left panel) and theoretical (right panel) CCSs of POP species. Errors in the experimental CCS are expressed as the standard deviation.
EXPERIMENTAL CCS THEORETICAL CCS Species CCS (nm2) Simulation Average
(nm2) σ A 50.4 ± 0.3 Gas phaseMD 48.41 0.57 B 53.8 ± 0.4 REMD I 54.05 0.30 REMD III 55.51 0.35 C 59.3 ± 0.7 Openconformation 58.53 0.15 579 580 581 582