UNIVERSITY OF NAPLES FEDERICO II
DOCTORATE IN
MOLECULAR MEDICINE AND MEDICAL
BIOTECHNOLOGY
XXXI CYCLE
14-3-3θ, AF4 and MLL-AF4 are targets of MiR-27a in
t(4;11) acute lymphoblastic leukemia: implication for
new targeted therapy options
Tutor Candidate
Prof. Gabriella Esposito Mariateresa Zanobio
COORDINATOR
Prof. Vittorio Enrico Avvedimento
INDEX
ABSTRACT ... 1
1. INTRODUCTION ... 2
1.1 Leukemia ... 2
1.2 Acute lymphoblastic leukemia ... 4
1.3 Abnormalities of the MLL gene in ALL ... 6
1.3.1 Structure and function of MLL ... 7
1.3.2 MLL and the HOX genes ... 9
1.4 The t(4;11)(q21;q23) ALL ... 12
1.4.1 The AFF1 gene and the AF4 protein ... 13
1.4.2 AF4 interactome ... 15
1.5 14-3-3 family proteins: a focus on 14-3-3 θ isoform ... 17
1.6 MicroRNA (miRNAs) and leukemia ... 19
1.6.1 MicroRNA-27a ... 21
2. AIM ... 23
3. MATERIALS AND METHODS ... 25
3.1 Cell lines ... 25
3.2 Transfection ... 25
3.3 Quantitative RT-PCR (RT-qPCR) analysis ... 25
3.3.1 RNA extraction ... 25
3.3.2 Reverse transcription (RT) and real time - quantitative PCR (qPCR) analysis ... 26 3.4 Proteins analysis ... 27 3.4.1 Protein extraction ... 27 3.4.2 Western blot ... 27 3.4.3 Antibodies ... 28 3.5 Molecular Cloning ... 28
3.5.2 Ligation and bacterial transformation ... 29
3.6 Site-directed mutagenesis ... 30
3.7 Luciferase reporter assays ... 30
3.8 Chromatin Immunoprecipitation (ChIP) Assay ... 30
3.9 Cell viability assay... 31
3.10 BrdU cell proliferation assay ... 31
3.11 Apoptosis assay ... 32
3.12 Colony-formation assay ... 32
3.13 Statistical analysis... 32
4. RESULTS ... 32
4.1 MiR-27a and 14-3-3θ expression level in t(4;11) leukemia cell lines.. 32
4.2 AF4 and MLL-AF4 are novel targets of MiR-27a ... 34
4.2.1 MiR-27a targets RUNX1 in RS4;11 leukemia cell line ... 37
4.3 MiR-27a impairs MLL-AF4 chimera’s activity in t(4;11) cell lines .... 38
4.4 MiR-27a impairs MLL-AF4 interaction with HOXA9 promoter in RS4;11 cells ... 40
4.5 MiR-27a affects cell viability, proliferation, apoptosis and clonogenic capacity of t(4:11) leukemic cells ... 41
4.6 MiR-27a and 14-3-3θ expression level in t(4;11) leukemia patients ... 46
5. DISCUSSION ... 48 6. CONCLUSIONS ... 51 7. APPENDICES ... 52 APPENDIX A... 52 APPENDIX B ... 53 APPENDIX C ... 54 8. ACKNOWLEDGEMENTS ... 55 9. REFERENCES ... 56 10. LIST OF PUBLICATIONS ... 62
1
ABSTRACT
The t(4;11)(q21;q23) chromosomal translocation results in the KMT2A/AFF1 fusion gene, which encodes the mixed-lineage leukemia (MLL)-AF4 oncogenic chimera, a hallmark of an aggressive form of acute lymphoblastic leukemia (ALL). In t(4;11) ALL, MLL-AF4 recruits the endogenous co-activator AF4 and aberrantly triggers transcription of MLL target genes, including HOXA9 and MEIS1, thereby driving transformation of hematopoietic progenitors. We previously demonstrated that the scaffold protein 14-3-3θ is a direct interactor of AF4 and promotes AF4 binding to the HOXA9 promoter. Notably, 14-3-3θ is a target of MiR-27a, which acts as tumor suppressor in various human leukemias; moreover, expression levels of MiR-27a correlate with relapse free survival in childhood ALL. This PhD thesis aims to assess the potential role of MiR-27a in t(4;11) ALL pathogenesis. In different leukemia cell lines, we found an inverse correlation between levels of MiR-27a and 14-3-3θ, which was particularly relevant in t(4;11) cell lines. In t(4;11) leukemia cells, transient transfection of MiR-27a led to a decrease in 14-3-3θ protein amount and HOXA9, HOXA7 and MEIS1 transcription. Interestingly, our bioinformatic analysis predicted that AFF1-3’UTR, which is shared with KMT2A/AFF1, contains a putative MiR-27a seed sequence. Consistently, MiR-27a overexpression strongly reduced AF4 and MLL-AF4 protein levels, as well as protein level of RUNX1, a known target of MiR-27a with a key role in t(4;11) leukemia context. We therefore cloned AFF1-3’-UTR in an opportune plasmid vector and performed a luciferase reporter assay. The decreased luciferase activity we measured after co-transfection of MiR-27a and the recombinant plasmid proved that AFF1-3’UTR is a direct target of MiR-27a. Accordingly, transfection of anti-MiR-27a enhanced the expression of AF4 protein, in RS4;11 cells. Moreover, ChIP experiments gave direct proof that MiR-27a overexpression impaired MLL-AF4 binding to HOXA9 promoter. Consistently, MiR-27a overexpression decreased viability, proliferation and clonogenicity of t(4;11) cells, whereas enhanced their apoptotic rate. Lastly, we found that relative expression of MiR-27a was significantly lower in 9 patients affected by severe t(4;11) ALL compared with 9 patients affected by t(12;21) leukemia, which has a benign prognosis. Similarly to the t(4;11) cell lines, in our ALL patients we found an inverse relationship between MiR-27a and 14-3-3θ transcript levels. Overall, we demonstrate that MiR-27a has a pivotal role in t(4;11) ALL molecular pathogenesis and therefore it is a promising novel target for the therapy of this aggressive form of leukemia.
2
1. INTRODUCTION 1.1 Leukemia
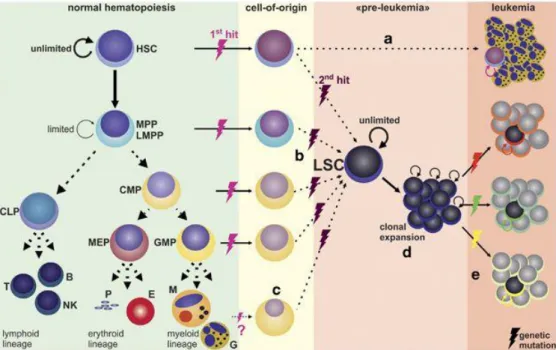
Leukemia is a progressive and malignant neoplasm that usually starts in bone marrow and is caused by the rapid and uncontrolled proliferation of abnormal white blood cells. This heterogeneous group of diseases is characterized by infiltration of blood, bone marrow and other tissues by neoplastic cells of hematopoietic origin (Fig.1); indeed, the replacement of marrow space by leukemic cells may suppress the normal hematopoiesis thus resulting in anemia, thrombocytopenia and granulocytopenia. Other clinical manifestations are due to organ infiltration that causes hepatomegaly, splenomegaly and enlargement of lymph nodes.
The molecular alteration that causes the malignant transformation usually occurs in a pluripotent stem cell, although it sometimes involves committed stem cells with less self-renewal capacity. Therefore, leukemia can be either acute or chronic, depending on the differentiation degree of the transformed cell. Acute leukemia is characterized by immature and poorly differentiated cells called “blasts”, whereas the chronic form presents more mature cells and progresses more slowly than the acute ones. Leukemia is also classified in lymphocytic and myelocytic, depending on the origin of the malignant clone. Thus, there are four broad classifications of leukemia:
• Acute lymphocytic leukemia (ALL) • Acute myelocytic leukemia (AML) • Chronic lymphocytic leukemia (CLL) • Chronic myelocytic leukemia (CML)
3
Figure 1. Hematopoiesis includes proliferation and differentiation processes that produce
all the mature cellular elements of blood. An arrest in the differentiation process leads to leukemic transformation (Riether et al, 2015).
Each class is further sub-divided into subtypes according to two staging systems. The French-American-British (FAB) classification system is based on morphology to define specific immunotypes, whereas the World Health Organization (WHO) classification focuses on chromosome translocations and evidence of dysplasia. The diagnostic workflow is based on complete blood count, peripheral blood smear, bone marrow aspiration and biopsy. Leukocytosis and presence of immature blood-forming cells in bone marrow aspiration contribute to the diagnosis. To confirm diagnosis, flow cytometry is carried out to define the immunophenotype of leukemic cells. In addition, cytogenetic and molecular biology analyses are performed, in order to classify the disease, to define the best therapeutic strategy and to monitor minimal residual disease.
4
1.2 Acute lymphoblastic leukemia
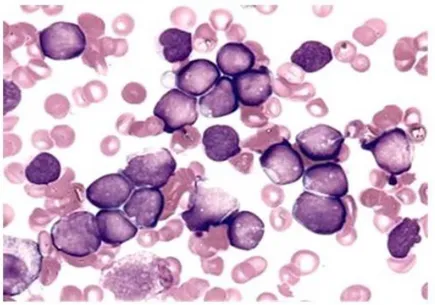
Acute lymphoblastic leukemia (ALL) is caused by malignant transformation and proliferation of lymphoid progenitor cells in bone marrow, blood and extramedullary sites (Fig.2). In 80% of cases, the disease affects children, whereas in adults is rare and characterized by a worse prognosis. The incidence of ALL follows a bimodal distribution with the first peak occurring in childhood and the second one around the age of 50 years.
Figure 2. Bone marrow aspirate from a patient diagnosed with B-ALL. Nucleated marrow
cells are mostly leukemic blasts of similar appearance representing undifferentiated round-shaped clones with evident nucleoli and condensed chromatin (http://www.pedsoncologyeducation.com/ALLBMbiopsy.asp).
In most cases, ALL appears as a de novo malignancy in healthy patients, but some predisposing factors exist, such as environmental factors (exposure to ionizing radiation, pesticides, some solvents, viruses) and genetic syndrome (Down syndrome, Fanconi anemia) (Terwilliger et al, 2017). Malignant transformation and uncontrolled proliferation of an aberrantly differentiated, long-lived lymphoid progenitor cells results in a high circulating number of blasts, replacement of normal marrow by malignant cells and potential leukemic infiltration of the central nervous system (CNS) and abdominal organs. Symptoms include fatigue, pallor, infection, bone pain and easy bruising and bleeding. According to the FAB classification system, ALL is
5
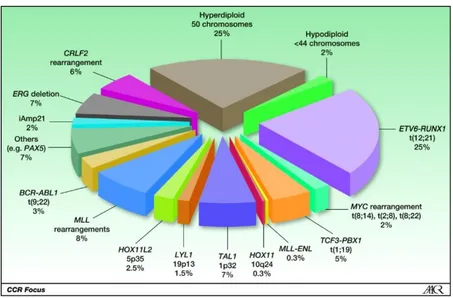
divided into three subtypes (L1, L2, L3) based on morphological features like cell size, cytoplasm, nucleoli, vacuolation and basophilia. The WHO classification, revised in 2008, takes into account both morphology and genetic alterations and identifies the B- and T-ALL types. B-ALL is further divided into two subtypes: B-ALL with recurrent genetic abnormalities and B-ALL not otherwise specified. B-ALL with recurrent genetic abnormalities is delineated on the basis of the specific chromosomal rearrangement that is present in the transformed cell. In fact, most of childhood ALL cases harbor gross chromosomal aberrations. In B-ALL, these alterations include high hyperdiploidy with non-random gain of at least five chromosomes (including X, 4, 6, 10, 14, 17, 18, and 21), hypodiploidy with fewer than 44 chromosomes and recurring translocations (Fig.3).
Figure 3. Spectrum of recurring chromosomal rearrangements in childhood ALL (Mignon et
al, 2012).
The most common rearrangements in ALL include t(12;21)(p13;q22), which encodes the ETV6-RUNX1 (TEL-AML1) chimera; t(1;19) (q23;p13), which produces the fusion protein TCF3-PBX1 (E2A-PBX1); t(9;22)(q34;q11), which arises Philadelphia chromosome and the oncogenic BCR-ABL1 chimera; rearrangements of the 11q23 chromosome region, which involve the MLL gene and a variety of partner genes. In most cases, the primary genetic alteration is not sufficient to cause leukemia, but can promote, in a sub-set of cancer cells, the acquisition of additional genomic changes that allow to the cell to gain further grown advantages. In fact, more than 50 regions of
6
recurring DNA copy number alteration (CNA) have been identified in ALL cells. Many of them involve genes that encode regulators of lymphoid development and of cell cycle, tumor suppressors and lymphoid signaling molecules. Very interestingly, the MLL-rearranged (MLL-r) ALL, which is typically aggressive and arises early in life, harbors < 1 additional genetic alteration per case (Inaba et al, 2013).
The current treatment of ALL comprises induction combination chemotherapy to achieve remission; intrathecal chemotherapy for CNS prophylaxis and/or cerebral irradiation for intracerebral leukemic infiltration; consolidation chemotherapy with or without stem cells transplantation; and maintenance chemotherapy for up to 3 years to avoid relapse. Drug dosage and schedule of administration in combination chemotherapy have been optimized on the basis of leukemic-cell biological features, response to therapy, patient’s pharmacodynamic and pharmacogenomic findings, thus resulting in the current high survival rate. A very recent therapeutic strategy is represented by cancer immunotherapy, which uses the body’s immune system to seek out and destroy malignant cells, using tumor-specific antigen recognition. The principle advantages of this therapy is the ability of the T cells to expand and go after target cells, with the potential for surveillance through T-cell memory (Singh et al, 2016). Chimeric antigen receptor (CAR) T-cell therapy seems to be a successful therapeutic option for patients with relapsed or refractory ALL (Callahan et al, 2017).
1.3 Abnormalities of the MLL gene in ALL
The mixed-lineage-leukemia (MLL) gene rearrangements are present in 80% of infant B-ALL cases and 10% of total childhood B-ALL (Woo et al, 2014). In some cases, MLL is target of insertion, deletion, partial tandem repeats; however, balanced chromosomal translocation is the most common genomic rearrangement involving MLL gene (Meyer et al, 2018). Such balanced translocations fuse in frame the genomic sequences encoding the N-terminus domains of the histone methyltransferase MLL with the genomic sequences encoding the C-terminus domains of a fusion partner gene. To date, about 80 direct (MLL-X) and 120 reciprocal (X-MLL) MLL fusion genes have been identified in acute leukemia patients (Marschalek et al, 2016). The chimeric proteins encoded by these fusion genes cause the self-renewal of hematopoietic progenitors due to aberrant expression of genes normally controlled by MLL (Slany, 2009; Yokoyama et al, 2015).
7
The most common gene rearrangements are: • t(4;11)(q21;q23) encoding MLL-AF4; • t(9;11)(p22;q23) encoding MLL-AF9; • t(11;19)(q23;p13.3) encoding MLL-ENL; • t(10;11)(p13-14;q14-21) encoding MLL-AF10.
About 50% of MLL-r ALL displays the t(4;11)(q21;q23) translocation and is associated with very poor survival (Woo et al, 2014).
Despite this wide genetic variety, most cases of MLL-r ALL have a clinical entity and gene expression signatures that do not depend on the fusion partner involved in leukemogenesis. One of the reasons is that MLL fusion proteins (MLL-FP) share a common structure with the respective partners invariably fused in frame to the MLL’s N-terminus. Moreover, most of fusion partners are nuclear proteins, whereas cytoplasmatic ones are present in rarely occurring MLL-FP. It is known that MLL-FPs function as a novel type of general transcription factors, which are able to indiscriminately activate many different promoters (Slany, 2009). Notably, some of the known partner proteins are involved into the regulation of transcriptional initiation and elongation, as they directly bind to either RNA polymerase II (Pol II) or a part of a multiprotein super elongation complex (SEC) that interacts with Pol II. However, the pathological role of many fusion partner genes has not been well elucidated yet (Marschalek, 2016).
1.3.1 Structure and function of MLL
The normal MLL gene at the 11q23 locus, also known as MLL1/HRX/HTRX1/ALL1/KMT2A, encodes an approximately 500-kDa nuclear protein with multiple functional domains and binding partners, which is expressed in a wide variety of normal human tissues (Winters et al, 2017). Human MLL protein is both structurally and functionally homologous to the Drosophila melanogaster protein trithorax (trx), which is an epigenetic regulator of developmental genes. The common downstream targets of MLL and trx are the homeobox (HOX) genes, which control segment specificity and cell fate in the developing embryo (Krumlauf, 1994). The N-terminal of MLL contains a binding domain for Menin, a protein that links MLL and the chromatin-binding protein lens epithelium-derived growth factor (LEDGF). LEDGF, thanks to its PWWP domain, binds to dimethylated lysine 4 on
8
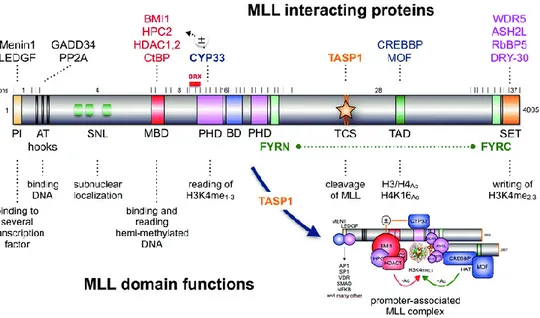
histone 3 (H3K36me2) a signature placed by the histone methyltransferase ASH1L. The MLL N-terminus also contains AT-hook motifs, which mediate the binding to the minor groove of DNA helix, speckled nuclear localization domain 1 and 2 (SNL-1 and SNL-2), and two repression domains, RD1 and RD2. RD1 contains a CXXC domain, a region with homology to DNA methyltransferase 1 (DNMT1) that binds to non-methylated CpG DNA. RD2 is able to interact with HDAC1 e HDAC2. All of these domains are typically conserved in chimeric MLL fusion proteins (Winters et al, 2017). The PWWP and CXXC motifs constitute minimum targeting modules (MTM) that allow the MLL-FPs to aberrantly recognize the target chromatin. Moreover, some evidence indicates that the association between CXXC domain and non-methylated CpGs drives the target recognition, whereas the association between LEDGF and H3K36me2 reinforces the interaction with the target chromatin (Yokoyama, 2017). The middle portion of MLL contains four plant homeodomain (PHD) fingers, which mediate protein–protein interactions, and a bromodomain (BD). The PHD3 subdomain is able to read H3K4me2/3 chromatin signatures and is stabilized via a protein helix to BD domain. In particular, when PHD3 interacts with CYP33/PPIE (a prolyl isomerase) a conformational change occurs; PHD3 loses its reading function and it is no longer able to interact with BD domain. Therefore, PHD3 domain is able to recruit and bind to the BMI1/HPC2/HDAC1-2/CtBP complex. MLL binding to Polycomb-group proteins converts MLL into a transcriptional repressor, which is important for negative regulation of certain MLL target genes. Chromosomal rearrangements in MLL-r leukemias destroy the above described intrinsic control mechanism of the MLL protein (Marschalek, 2016). Indeed, MLL-FPs lose the C-terminal portion of MLL, which contains a transcriptional activation domain and a SET domain. The SET domain is homologous to that of Drosophila trx and it is able to catalyze mono-, di-, and tri-methylation of lysine 4 on histone 3 (H3K4) in vitro. These marks are usually present at transcriptionally active chromatin regions (Santos-Rosa et al, 2002). Other essential proteins that make up the core of the MLL complex include RbBP5, Ash2L and WDR5 (Vedadi et al, 2017). This such formed complex is able to bind a variety of H3K4 methyltransferases with SET domains, including MLL, which is thus able to directly bind to HOX gene promoters, inducing their specific regulation (Milne et al, 2002).
After its translation, wild-type MLL is processed by the Taspase1 enzyme. Proteolytic cleavage gives rise to a 320 kDa N-terminal fragment (MLLN) and a 180 kDa C-terminal fragment (MLLC). MLLN and MLLC normally assemble each other via FYRN and FYRC domains, which belong respectively to MLLN and MLLC fragments (Fig.4). It has been observed that
9
the translocation breakpoint distribution is somehow linked to the age of patients. In particular, infant ALL patients (early disease onset) tend to have the breakpoint within the MLL intron 11 (Marschalek, 2016). It has been demonstrated that breakpoints within the MLL intron 11 are associated with a worse clinical outcome (Emerciano et al, 2013).
Figure 4. Representation of the full-length MLL protein. Exons (1-37) and the major break
cluster region (BRX) are shown above the protein structure. All known binding proteins and the domains with the associated function are depicted (Marschalek, 2016).
1.3.2 MLL and the HOX genes
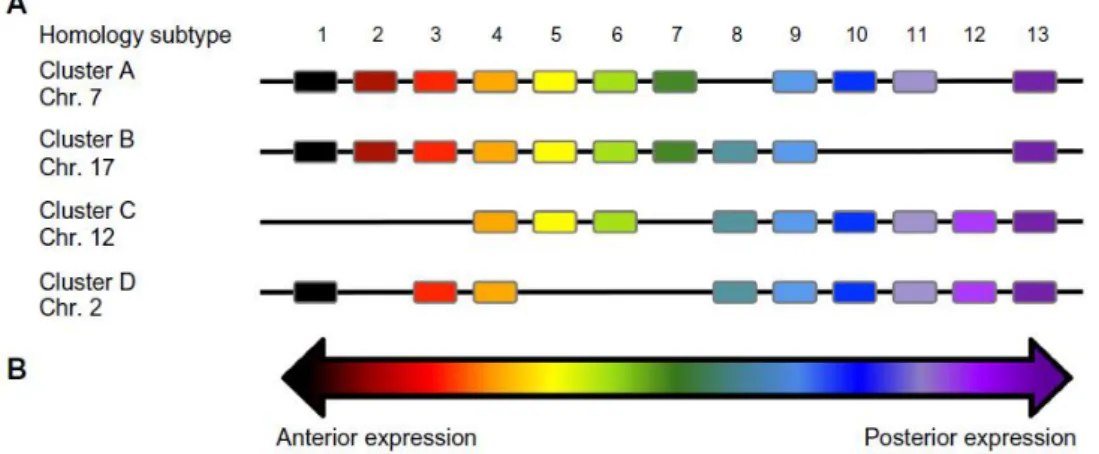
HOX proteins are a deeply conserved group of transcription factors originally recognized for their role in determining segmental identity along the antero-posterior (AP) axis in Drosophila. The role of Hox genes in establishing AP axis identity is conserved in vertebrates. The spatial and temporal expression patterns of Hox genes along the AP axis of flies depend on their position on the chromosome (Pascual-Anaya, 2013). The vertebrate counterparts are usually grouped in four clusters. In human, the four HOX gene clusters (A-D) are located on four different chromosomes, HOXA (7p15), HOXB (17q21), HOXC (12q13) and HOXD (2q31) (Alharbi et al, 2013) (Fig.5).
10
Figure 5. (A) The genomic architecture of HOX genes and (B) schematic representation of
gene expression in embryonic development (Decker et al, 2014).
Mammalian HOX genes are constituted by two exons and a single intron, which varies from less than 200 bases to several kilobases. HOX protein structure is characterized by an acidic tail at the C-terminus and a pentamer upstream of the homeodomain that binds the three amino acids loop extension (TALE) proteins, which act as cofactors. Indeed, PBX and MEIS are the main co-factors of HOX proteins. Of note, the formation of PBX-MEIS heterotrimeric complexes is essential for the execution of HOX-dependent developmental programs (Thorsteinsdottir et al, 2001). The homeodomain is a highly conserved DNA-binding region of 60 amino acids (Lappin et al, 2006).
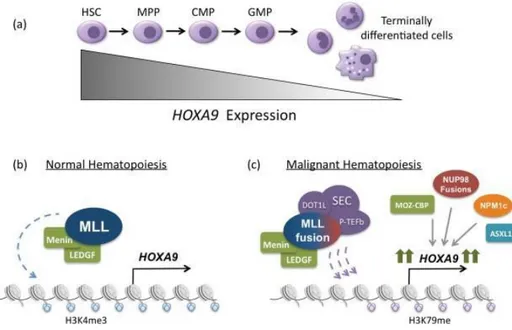
In human, HOX genes are involved in the regulation of hematopoiesis, from post-embryonic stage and throughout adult life (Slany et al, 2005). Multiple HOX genes of clusters A, B and C are expressed in hematopoietic stem cells. Normally, when down-regulation of many HOX genes occurs, the progenitor cells differentiate (Lappin et al, 2006). Some experimental evidence demonstrates that HOX genes, and in particular HOXA9, is overexpressed in more than 50% of AML and in a subset of B and T ALL, with particular relevance in MLL-r leukemia (Collins et al, 2016). Chromatin immunoprecipitation experiments showed that MLL-FPs effectively bind to the DNA locus of the HOXA9 gene (Milne et al, 2005). Moreover, HOXA9 knockdown in MLL-r leukemia cell lines induces apoptosis and reduces colony forming potential of the cells (Fig.6).
11
Figure 6. Regulation of HOXA9 expression in normal and malignant hematopoiesis. (A)
During normal hematopoiesis, HOXA9 is expressed most highly in early progenitor cells and its expression is subsequently down regulated as cells become terminally differentiated. (B) In normal hematopoiesis, HOXA9 expression is regulated by the MLL histone methytransferase. (C) In approximately 50% of acute leukemias, HOXA9 is highly expressed as the result of the MLL1-fusions production (Collins et al, 2016).
When MLL-r cells are subjected to HOXA9 knockdown and then transplanted into mice, the mice leukemic phenotype is attenuated (Orlovsky et al, 2011). HOXA9 is required for the maintenance of leukemic state (Faber et al, 2009) and elevated levels of HOXA9 lead to a long latency form of leukemia (Kroon et al, 1998). MEIS1 is another target gene of MLL-FPs (Armstrong et al, 2002). Even though, high levels of MEIS1 are not sufficient to induce leukemia, the co-expression of HOXA9 and MEIS proteins reduces the latency of HOXA9-induced leukemia. These data suggest a key role of these two proteins in the initiation and maintenance of leukemic state (Roth et al, 2009). Recently, it has been discovered that murine Pbx3, another TALE family component, plays an important role in leukemia associated to Hoxa9 deregulation, in mice. Indeed, Pbx3 takes part to Hoxa9 and Meis1 interaction; it protects Meis1 from ubiquitination and proteasome-mediated degradation. Since Meis1 half-life is extended and the interaction with Hoxa9 is increased, their gene regulatory activity is enhanced (Garcia-Cuellar et al, 2015). HOXA9 and MEIS1 overexpression are inversely correlated with relapse and overall survival, thus these genes could become useful predictive
12
markers of the clinical development of acute leukemias (Adamaki et al, 2015).
1.4 The t(4;11)(q21;q23) ALL
Rearrangements of the MLL gene are common genetic events in hematological malignancies. They are present in around 10% of ALL and 5% of AML. About 50% of patients diagnosed with pro-B ALL aged 6 months or less harbors the t(4;11) chromosomal rearrangement. Frequency of the t(4;11) ALL decreases in older infants (10–20%) and drops to just 2% in children. In adult B-ALL, it accounts for about 10% of cases (Malouf et al, 2018). Leukemia blasts has a pro-B/mixed leukemia phenotype, lacking in CD10 and co-expressing B lymphoid markers (CD19, CD22, CD79a, Tdt) and myeloid markers (CD15, CD65). An interesting feature of t(4;11) infant patients is the expression of MLL-AF4 chimera in a subset of bone marrow mesenchymal stem cells (MSC). This was not observed in other types of B-ALL and seems to be unique to this group of patients. This finding suggests the initial translocation occurs in a precursor that is common for hematopoietic and stromal compartment (Malouf et al, 2018).The genetic landscape of t(4;11) infant patients shows that this highly aggressive leukemia contains remarkably few somatic mutations, having one of the lowest somatic coding mutation rates observed in a human cancer to date (Andersson et al, 2015). Thus, it is very likely that the t(4;11)(q21;q23) is the first driving mutation (Fig.7A). Notably, some epidemiological and genetic studies showed that exposure to the anti-cancer drug etoposide increases the susceptibility to breakage of the 11q23 locus. Etoposide inhibits topoisomerase II and, therefore, causes breaks in both DNA strands (Sanjuan-Pla et al, 2015).
The t(4;11)(q21;q23) balanced translocation fuses in frame the first 8-11 exons of MLL, at 11q23, with the last 13-20 exons of AFF1, at 4q21, producing a fusion transcript that encodes the oncogenic MLL-AF4 chimera (240 kDa). This oncoprotein retains MT, AT hook and SNL domains of MLL at the N-terminal, whereas the C-terminal is the transactivation domain of AF4, the AFF1 gene product (Lavau et al, 1997) (Fig.7B). The proposed mechanism by which MLL-AF4 chimera could provoke leukemia is based on the aberrant transcriptional activation of the MLL target genes driven by the fusion partner portion (Slany et al, 2009).
13
Figure 7. (A) On the left, G-banded karyotype showing the balanced t(4;11)(q21;q23)
translocation [arrows]; in the right panel, dual color FISH on a metaphase with t(4;11)(q21;q23)(http://atlasgeneticsoncology.org). (B) Schematic representation of the MLL-AF4 oncoprotein functional domains.
1.4.1 The AFF1 gene and the AF4 protein
The AFF1 gene at 4q21 locus is 134050 bp long and consists of 23 exons. The first 4 exons are alternatively spliced in the mature transcript. The mRNA is 9390 bp long, with an open reading frame of 3633 bp. It produces the AF4 protein of 1210 aminoacids with a molecular weight of 140 kDa. It is a ubiquitous, mainly nuclear, protein and its expression is particularly high
14
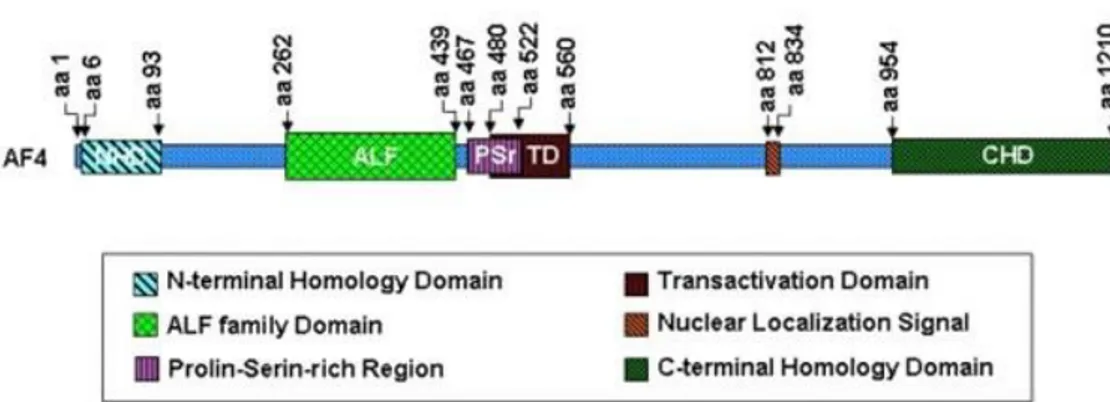
in lymphoid organs, placenta, CNS and kidney (Frestedt et al, 1996). AFF1 gene is critical for early events of normal lymphopoiesis in mice, such as precursor proliferation or recruitment. Indeed AFF1-knockout mice showed a reduced number of B and T lymphocytes in hematopoietic organs as bone marrow, thymus and spleen (Isnard et al, 2000). AF4, AF5q31, LAF4 and FMR belong to the ALF family protein. The ALF family members share the highly conserved N-terminal homology domain (NHD), C-terminal homology domain and the ALF domain, which is characterized by a serine-proline rich region (Fig.8). Each member of this family features a transactivation domain except for FMR2, which is the only one not found as MLL fusion partner. AF4, together with the other members of ALF family, associate to ENL and to p-TEFb in order to form SEC/AEP complex. ENL is a histone acetylation reader and contributes to promote transcription elongation (Zhou et al, 2018). P-TEFb, which is formed by cyclin-dependent kinase 9 (CDK9) and cyclin T1, promotes the transcription elongation phase by phosphorylating the Pol II C-terminal domain (CTD). AF4 stimulates kinase activity of p-TEFb and associates with DOT1L, a methyltranferase that metylates histone H3 at lysine 79. This epigenetic modification remodels and marks transcriptionally active chromatin (Yokoyama et al, 2010).
15
1.4.2 AF4 interactome
The AF4 function has been unclear for a long time. Many efforts have been done to unravel its physiologic role in cells. Some clues derive from the discovery and the study of its direct and indirect interactors. The AF4 interactome comprises mainly nuclear proteins, but also cytosolic ones. To date, AF4 is classified as a transcriptional activator. Immunoprecipitation experiments revealed that AF4 interacts with ENL and p-TEFb and forms the SEC/AEP (AF4 family/ENL family/p-TEFb complex) complex, which is physiologically recruited by MLL on some of its target genes (Yokoyama et al, 2010). P-TEFb phosphorylates C-terminal domain (CTD) of Pol II and promotes transcriptional elongation. In particular, AF4 interacts with CDK9 and stimulates its kinase activity. On the other hand, p-TEFb is able to phosphorylate N-terminus of AF4, thereby decreasing its transactivation activity. The MLL-AF4 chimera does not undergo to this negative regulation because the N-terminal domain of AF4 is lost (Esposito et al, 2011; Yokoyama et al, 2010). AF4 exerts its transcriptional activator function as a homodimer or heterodimer with AF5q31, another ALF homologue. The AF4 C-terminal region, which is retained in MLL-AF4 chimera, is responsible for dimerization. Therefore, MLL-AF4 and AF4/AF5q31 can form a dimeric complex in leukemic cells. AF9, which is also a fusion partner of MLL in leukemias, is a known interactor of AF4. AF9 associates with ENL and DOT1L, which form a complex involved in transcriptional elongation and chromatin remodeling (Yokoyama et al, 2010).
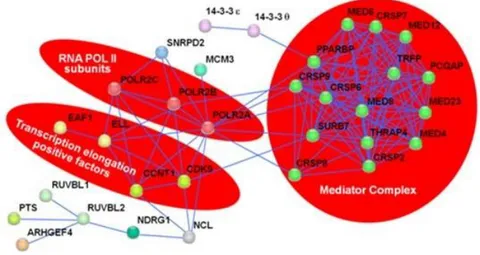
AF4 interactome contains proteins, such as ELL and EAF1, that are involved in transcription. ELL is a positive transcription factor that works by suppressing Pol II pauses along DNA filament. Interestingly, also ELL is a fusion partner of MLL in several ALL. EAF1 is a strong positive regulator of the ELL elongation activity; it binds the ELL C-terminal domain and activates transcription. ELL and EAF1, together with AF4, p-TEFb, ENL and AF5 q31, belong to super elongation complex (SEC). SEC has the major role in transcription elongation and could be constitutively recruited by MLL-AF4 chimera on MLL target genes (Yokoyama et al, 2010). Other information about AF4 interactome comes from a wide functional proteomic study, which identified 51 proteins that directly or indirectly interact with AF4 (Esposito et al, 2011) (Fig.9).
16
Figure 9. Schematic representation of various AF4 partner and their interaction network.
Proteins that are part of the same multiprotein complex or to protein family are highlighted (Esposito et al, 2011).
About 60% of these proteins are involved in Pol II-mediated transcription regulation. Among these, there are the two major subunits and a 33 kDa smaller one of the Pol II (POLR2A, POLR2C and POLR2E), CDK9, and several subunits of the Mammalian Mediator Complex (MED). The MED multiprotein is an evolutionarily conserved transcriptional regulator that plays important role in activation and repression of the Pol II transcription. In fact, it regulates the formation of transcription pre-initiation complex. It works as an adaptor that bridges Pol II and its several DNA binding regulatory proteins. MED transduces both positive and negative signals that turn on and off messenger RNA synthesis in response to the ever-changing microenvironment of the cell (Conaway et al, 2011). In line with this evidence, it has been recently proposed a new model in which the AF4 family proteins have a role in transcription initiation. Indeed, biochemical analysis identified a phosphoserine-rich (pSER) domain of AF4 that interacts with selective factor 1 (SL1). SL1 is a known component of Pol I pre-initiation complex (PIC) and it is constituted by TATA binding protein (TBP) and four TBP associated factor (TAF) of Pol I subunits. In MLL-FP dependent transcription, AF4 recruits SL1 and loads TBP onto TATA element promoter, activating transcription initiation by Pol I. The AF4 pSER domain, constituted by evolutionary conserved aminoacids 462-562, functions as a scaffold for SL1. When pSER binds to SL1, it is able to cause a conformational change of the target chromatin that leads to the substitution of TAF1B with transcription factor IIB (TFIIB). This substitution leads to the
17
formation of pre-initiation complex of Pol II that can initiate transcription (Okuda et al, 2015).
A small fraction (8%) of AF4 interactors are proteins with predominant cytosolic localization. Among these proteins, there are SIAH1 and SIAH2. They are responsible for AF4 proteasome-dependent degradation because of their ubiquitin ligase activity. The interaction between SIAH and AF4 proteins occurs at the ALF domain of AF4 and the SIAH binding domain of SIAH (Bursen et al, 2010). Other AF4 protein partners are 14-3-3 theta (θ) and 14-3-3 epsilon (ε), which belong to the 14-3-3 protein family (Esposito et al, 2011).
1.5 14-3-3 family proteins: a focus on 14-3-3 θ isoform
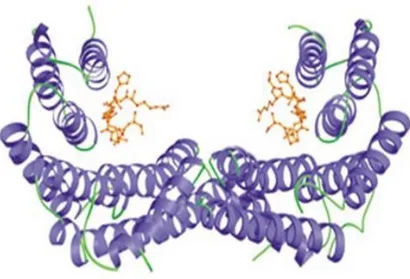
14-3-3 proteins are crucial regulators of intracellular signaling pathways. They are able to interact and regulate the activity of various target proteins. The different isoforms of 14-3-3 proteins accomplish different functions, which may be also tissue-specific (Aghazadeh et al, 2016). In mammalian, there are seven isoforms (β, γ, ε, σ, ζ, θ, η) encoded by closely related genes. 14-3-3 proteins work as homo- or hetero-dimers; however, because of steric compatibility, not all the combination are possible. The tertiary structure is made up of nine antiparallel helices; these helices are arranged to form a "U-shaped" structure. In a dimer, terminal helices of one subunit contact N-terminal of the other subunit forming the “floor” of a central groove; the C-terminal helices of two subunits contact one another forming “the wall” of the structure (Fig.10).
18
Figure 10. Representation of the “U-shaped” 14-3-3 dimer bound to a target
phopshopeptide (in orange) (Rittinger et al, 1999).
14-3-3s bind to specific phosphoSer (pSer) and phosphoThr (pThr) residues of target proteins (Mackintosh, 2004). It has been hypothesized that 14-3-3 dimers bind to two sites on the same target protein with different affinity. A 14-3-3 monomer binds to a first residue, which is indispensable for a stable 14-3-3 interaction; binding to weaker secondary sites facilitates a conformational change, which exposes one or more regions of the protein that are inaccessible in the free or monomer-bound form (Yaffe et al, 2002). Through these interactions, 14-3-3 proteins play important roles in a wide range of crucial physiological and pathological processes.
Notably, 14-3-3 proteins deregulation is associated to several human diseases and thus they undergo to a tight regulation in normal cells. One regulation mechanism of 14-3-3 proteins relies on the post-transcriptional modulation of its mRNA stability; accordingly, an emerging role in 14-3-3 regulation is attributed to microRNAs. Notably, 14-3-3θ is overexpressed in a wide range of human malignancies thus functioning as an oncogene. Indeed, this isoform is over-expressed in cancer cells, as well as patient samples (Zhao et al, 2011). In particular, 14-3-3θ is overexpressed in metastatic breast carcinoma (Li et al, 2014) and is involved in astrocytoma tumor progression (Yan et al, 2013). Recent studies conducted in our laboratory have demonstrated that 14-3-3θ plays a crucial role in SEC/AEP dependent transcription. Indeed, in the nucleus, 14-3-3θ binds to AF4 and controls its localization on target chromatin, thus contributing to transcriptional activation in MLL-r leukemic transformation (Fioretti et al, submitted). Notably, a negative regulator of
14-19
3-3θ is MiR-27a, which is able to bind 3’-UTR of 14-3-3θ transcript and reduce protein levels (Scheibner et al, 2012).
1.6 MicroRNA (miRNAs) and leukemia
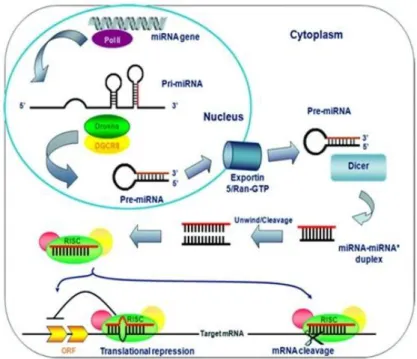
MicroRNAs (miRNAs) are non-coding RNAs that bind and regulate the fate of mRNAs. MiRNAs are transcribed from genomic DNA as long primary transcripts (pri-miRNAs) and then are processed by nuclear protein DROSHA into 60-70 nucleotides arranged to form a hairpin-shaped precursor RNAs (pre-miRNAs). Pre-miRNAs are then exported to the cytoplasm by EXPORTIN-5/Ran-GTP. After being exported to the cytosol, pre-miRNAs are further cleaved by DICER into a 22 nucleotide double strand mature miRNA. The following association of miRNA with RNA-induced silencing complex (RISC) causes the pairing of one strand of the duplex miRNA with 3’-untranslated region (3’-UTR) of target mRNA sequences (Cai et al, 2009). Notably, target mRNA sites can be also located in 5'-UTR and in coding sequence (CDS) (Scheibner et al, 2012). Interactions between miRNA and mRNA target usually occurs in the so-called “seed” sequence, near to the miRNA 5’-terminus. The seed sequence is 6-8 nucleotides long and is highly conserved among species. MiRNAs binding finally leads to either translational repression or degradation of the mRNA target (Fig. 11).
20
Figure 11. Representation of miRNA biogenesis: it begins inside the nucleus then its
processing and maturation take place in the cytoplasm of an eukaryotic cell (http://atlasgeneticoncology.org).
Numerous genes dispersed over the genome encode miRNAs. These genes are located in intergenic regions, in introns of protein-coding genes and in introns/exons of non-coding RNA genes. Some miRNA genes are clustered and tend to be co-expressed as polycistronic units; they may have functional relationship (Cai et al, 2009). Moreover, a single miRNA can regulate many mRNA targets and several miRNAs can regulate a single mRNA. MiRNAs control many biological processes, such as developmental transitions, neuronal patterning, apoptosis, adipogenesis, metabolism and hematopoiesis, in different organisms (Chhabra et al, 2010).
Over the last years, increasing evidence about the involvement of miRNAs in regulation of hematopoiesis has been found. This regulation results in the targeting of genes involved in cell proliferation, metabolism and apoptosis (Sun et al, 2013). Aberrant expression of many different miRNAs has been observed in several cancers, including hematological malignancies. Interestingly, many of these miRNAs and their targets are implicated in leukemic stem cell development, differentiation and activation (Han et al, 2011). Thus, changes in miRNA expression levels may play an important role in the genesis and evolution of ALL; so, they could be consider novel
21
biomarkers with potential use for diagnosis and tailored therapy in pediatric acute leukemia (Organista-Nava et al, 2016).
Therefore, it is not surprising the evidence that MLL/AF4 regulates, and is itself a target, of miRNAs. For example, miR-142-3p functions as a growth suppressor in t(4;11) ALL, primarily through repression of MLL-AF4 chimera expression (Dou et al, 2013). In addition, recent studies reveal that relapse may be triggered as a consequence of therapy-induced miRNA dysregulation and indeed there is a set of miRNAs associated with the risk of relapse in childhood ALL. This latter evidence also provides new insight into the molecular mechanisms of leukemia relapse (Han et al, 2011).
1.6.1 MicroRNA-27a
MicroRNA-27a (MiR-27a) is a member of a cluster composed by 2 other miRNAs, i.e. MiR-23a and MiR-24-2. The miR-23a~27a~24-2 cluster controls several processes during health and diseases. Indeed, its expression is linked to the modulation of cell cycle, proliferation, differentiation, hematopoiesis and cardiac hypertrophy (Chhabra et al, 2010).The cluster has altered expression in many diseases, among which there is ALL.
It is well documented that miR-23a~27a~24-2 cluster derived from a 2.2 kb long single primary transcript, but its expression pattern may vary, depending on different biological conditions. In some cases, all three miRNAs have similar expression pattern and in others, one or two of these miRNAs are preferentially expressed, giving rise to contrasting phenotypes in different cell types.
The transcription of miR-23a~27a~24-2 cluster can be Pol II dependent, however, the promoter, spanning from -603 and +36 bp, is a TATA-less promoter. In fact, it lacks not only TATA box, but also other promoter elements such as the initiator element, downstream promoter element (DPE), TFIIB recognition element (BRE), downstream core element (DCE), and MED.
MiR-27a is the miRNA sandwiched between the MiR-23a and MiR-24-2 (Fig.12).
22
Figure 12. Representation of the pre-miR hsa-23a~27a~24-2 cluster structure (Chhabra et
al, 2010).
Some cellular targets of MiR-27a are involved in cell cycle regulation, proliferation, apoptosis and differentiation. MiR-27a may have oncogenic and tumor suppressor functions. It is upregulated in estrogen receptor-positive breast cancers and gastric cancers, whereas it is down-regulated in malignant melanoma and in several acute leukemia cell lines and primary samples (Chhabra et al, 2010; Scheibner et al, 2012).
Very interestingly, low MiR-27a expression levels were detected in diagnostic specimens from leukemia patients who subsequently relapsed. Indeed, it has been demonstrated that MiR-27a is relevant to treatment outcome in vivo and its downregulation promotes ALL relapse by regulating genes in classical drug or multi-drug resistance pathways. Thus, MiR-27a downregulation leads to the accumulation of MULTI DRUG RESISTANCE PROTEIN 1 (MDR1), which, in turn, might promote leukemic cell proliferation or drug resistance, leading to leukemia recurrence (Han et al, 2011).
The relapse-associated miRNAs, as MiR-27a, and their targets might be used to optimize anti-leukemia therapy and might be novel targets for the development of new leukemia countermeasures.
Very interestingly, a known target of MiR-27a is RUNX1, a transcription factor that functions as key regulator of definitive hematopoiesis in embryo and adult (Ben-ami et al, 2008). It is involved in the t(4;11) ALL pathogenesis; indeed, the RUNX1 gene is directly activated by MLL-AF4 and the RUNX1 protein interacts with the product of the reciprocal AF4-MLL translocation, thereby contributing to leukemic transcription program
23
2. AIM
Over the past decade, alterations in biogenesis and activity of microRNAs (miRNAs) have been identified in cancer pathogenesis. Accordingly, some clinical trials use miRNA profiling for patient prognosis and clinical response, and the first miRNA mimic entered the clinic for cancer therapy in 2013. Considering the growing involvement of miRNAs in human tumorigenesis, this PhD thesis aims to investigate the potential role of MiR-27a in the molecular pathogenesis of t(4;11) ALL. Indeed, MiR-MiR-27a functions as tumor suppressor in various human leukemias and one of its targets is 14-3-3θ. Previous studies conducted in our laboratory demonstrated that the scaffold protein 14-3-3θ is a direct interactor of the AF4 protein and functions as an oncogene in t(4;11) leukemia cell lines (Esposito et al, 2011; Fioretti et al, submitted). The chromosomal translocation t(4;11) causes an aggressive form of acute lymphoblastic leukemia (ALL) which is particularly common in infants. In t(4;11) ALL, the MLL gene (KMT2A), on chromosome 11, is involved in a translocation with the AFF1 gene, on chromosome 4, and the resulting fusion gene expresses the chimeric oncoprotein MLL-AF4. Notably, MLL can translocate with different partner genes and all the resulting fusion proteins are potent oncogenes that cause sustained transactivation of most MLL target genes, including the HOX genes (Yokoyama et al, 2010), and many efforts have been made to understand the pathogenic mechanisms leading to hematopoietic progenitors transformation in the MLL-related (MLL-r) leukemia. MLL wild type is a transcriptional factor with histone methyltransferase activity that marks chromatin of active genes. AFF1, the main MLL translocation partner gene, encodes the nuclear protein AF4 that forms, with p-TEFb and ENL, the SEC/AEP complex, which is physiologically recruited by MLL wild type on target gene promoters, thereby enabling transcription initiation and elongation (Yokoyama et al, 2010; Yokoyama, 2017). In MLL-r leukemias, oncogenic chimeras constitutively recruit the SEC/AEP complex leading to aberrant expression of genes that are downregulated in normal hematopoiesis. Various studies demonstrated that AF4 has a key role in recruitment of the SEC/AEP complex in physiological condition and in MLL-r leukemia (Yokoyama et al, 2010) and identification of AF4 protein interactors strongly contributed in understanding its function. Accordingly, our previous studies have demonstrated that 14-3-3θ binds AF4 and favours its recruitment on MLL-AF4 target gene promoters; hence we proposed 14-3-3θ downregulation as potential therapeutic strategy to treat t(4;11) ALL. Because 14-3-3θ is downregulated by MiR-27a, we analyzed consequences of MiR-27a
24
overexpression on 14-3-3θ levels and MLL-AF4 activity, in t(4;11) cell lines. Moreover, we looked for known and unknown MiR-27a targets involved in the t(4;11) leukemia pathogenic mechanism and validated the putative novel targets by luciferase assay. Furthermore, we measured the impact of MiR-27a overexpression on clonogenic capability, proliferation and apoptosis rate of t(4;11) cells, thereby analyzing the resulting leukemia phenotype. Lastly, we analyzed relative expression level of MiR-27a in patients affected by t(4;11) ALL and in patients affected by a type of leukemia with very benign prognosis. Overall, data we obtained give proof of concept that enhancing MiR-27a cellular level could represent an innovative therapeutic strategy to treat this dismal type of leukemia.
25
3. MATERIALS AND METHODS 3.1 Cell lines
The cell lines were obtained from cell culture facility of the CEINGE - Biotecnologie Avanzate and the IRCCS SDN (Naples, Italy). RS4;11 acute lymphoblastic leukemia cells were grown in α-modification minimum essential medium (MEM) (Sigma-Aldrich), supplemented with 10% FBS and 1% penicillin/streptomycin. MV4;11 acute monocytic leukemia cells and REH acute lymphoblastic leukemia cells were grown in RPMI (Sigma-Aldrich), supplemented with 10% FBS and 1% penicillin/streptomycin. SEM acute lymphoblastic leukemia cells were grown in Iscove's Modified Dulbecco's Medium (IMDM) (Lonza) supplemented with 10% FBS and 1% penicillin/streptomycin. Leukemia cells were grown at 37°C in 5% CO2 and were subcultured as suggested by Leibniz-Institut DSMZ catalogues. The RS4;11, MV4;11 and SEM are t(4;11) leukemia cell lines.
3.2 Transfection
For MiR-27a transfection, hsa-pre-miR-27a-3p or has-pre-miR-negative control (Ambion) was added to 1.0 x 10⁷ cells at a final concentration of 50nM in a final volume of 100μL of opti-MEM (Gibco), not supplemented. For luciferase reporter assay transfection, 10µg of PsiCHEK-2 construct was added to 1.0 x 10⁷ cells in a final volume of 100μL of opti-MEM (Gibco), not supplemented. Cells were transfected by using the Gene Pulser Xcell™ Electroporation System (BioRad). Electroporation conditions were: voltage 330 or 500 mV, for MiR-27a or plasmids, respectively; impulse length, 1 or 3 ms; number of pulses, 1; interval between impulses, 0.
3.3 Quantitative RT-PCR (RT-qPCR) analysis
3.3.1 RNA extraction
Total RNA was extracted from cells with RNeasy Mini kit (Qiagen), according to the manufacturer’s protocol. The concentration of the RNA was determined using NanoDrop™ 2000/2000c Spectrophotometers (ThermoFisher Scientific).
26
3.3.2 Reverse transcription (RT) and real time - quantitative PCR (qPCR) analysis
For reverse transcription of MiR-27a, 150 ng of total RNA from cultured cells, or 40 ng of total RNA from patient samples, were retro-transcribed using TaqMan MicroRNA Reverse Transcription Kit (Applied Biosystems), according to manufacturer’s protocol. For the whole RNA reverse transcription, 200 ng of total extracted RNA were using. Reactions were performed using SuperScript™ III First-Strand Synthesis System (Invitrogen) with random hexamers. Reactions were perfrmed as suggeste by the manufacturer’s protocol.
For real time qPCR of MiR-27a, TaqMan® Universal Master Mix II were used. According to the manufacturer’s protocol, 1.33µL of each specific cDNA sample and 1 µL of TaqMan probe (TaqMan® MicroRNA Assays) specific for the MiR-27a or for the internal control, U18, were used.
For real time qPCR of total cDNA, iQ™ SYBR ® Green Supermix was used. According to the manufacturer’s protocol, 1μl of cDNA and 10µΜ of gene-specific primer pairs were used (Tab.1). Real time qPCR was carried out in iCycler iQ Real Time PCR Thermal Cycler (Bio‐Rad). Relative gene expression was normalized to POLR2A and ACTB genes and determined by 2-ΔΔCt method. Average values from at least three independent experiments were graphically reported as relative units (R.U.).
27
Primers Forward Reverse
14-3-3θ 5’ – AGCAGAAGACCGACACCTC – 3’ 5’ – ATCCAACAATTCCAGCACCG – 3’
HOXA9 5’ TGTGGTTCTCCTCCAGTTGATAGAGCG 3’ 5’ – TCGGTGAGGTTGAGCAGTCGAG – 3’
HOXA7 5’ – CGCCAGACCTACACGCG – 3’ 5’ – CAGGTAGCGGTTGAAGTGGAA – 3’
MEIS1 5’ – AGCATCTAACACACCCTTACC – 3’ 5’ – CCTTGACTTACTGCTCGGTTG -3’
AFF1 5’ – CTACAAAGACTCTCAGCATG – 3’ 5’ – TTCTCTGGGGTTTGTTCGACTG – 3’
ACTB 5’ – CGACAGGATGCAGAAGGAGA – 3’ 5’ – CGTCATACTCCTGCTTGCTG - 3’
POLR2A 5’ – CAACGCACACATCCAGAACG – 3’ 5’ – TCCTTGACTCCCTCCACCAC – 3’
Table 1. Primer sequences, designed using OligoExplorer 1.2 tool.
3.4 Proteins analysis 3.4.1 Protein extraction
Whole-cell protein extracts (WCE) for western blot analysis were prepared by disrupting cells using lysis buffer [50mM Tris/HCl pH 8, 150mM NaCl, 0.5 % NP-40, 2mM EDTA pH 8, 1mM Na3V04, 10mM NaF, 0.1% (v/v) protease inhibitor cocktail (Sigma Aldrich)]. Cells were incubated on ice for 30 min, then centrifuged at 16,000 rcf at 4°C for 5 min. Supernatant represented the WCE.
3.4.2 Western blot
Gel electrophoresis was performed in a SDS-polyacrylamide gel and transferred to nitrocellulose membrane (BioRad), by electro-blotting.
Binding to proper antibody was visualized using the ECL detection system (GE Healthcare). All images were acquired using X-Ray films (SantaCruz Biotechnologies). Densitometric analysis of images was carried out by using ImageJ software. Antibody concentrations for the western blot were chosen
28
according to the manufacturers ‘recommendations. All the antibodies used are indicated below.
3.4.3 Antibodies
Rabbit polyclonal anti-14‐3-3θ, mouse monoclonal anti-tubulin, mouse monoclonal vinculin (Santa Cruz Biotechnology); rabbit polyclonal anti-AF4 (Bethyl Laboratories); mouse monoclonal anti-MLLN and anti-MLLC (Merck Millipore); rabbit polyclonal anti-RUNX1 (Cell Signaling Technology); horseradish peroxidase-conjugated anti-mouse and anti-rabbit IgG secondary antibodies (GE Healthcare).
3.5 Molecular Cloning
3.5.1 Insert and vector preparation
Since AFF1-3’-UTR is 5353bp long, to enhance the cloning efficiency it was amplified in three overlapping fragments. Amplification were performed from genomic DNA, using PrimeSTAR GXL DNA Polymerase (Takara), as indicate by manufacturer’s protocol. Specific primer sequences are listed in Table 2. PCR products were visualized by electrophoresis on 1% agarose gel and recovered using Illustra GFX PCR DNA and Gel Band Purification Kits (GE Healthcare). Concentration was determined spectrophotometrically. Inserts and psiCHECK-2 vector were digested with the appropriate restriction endonucleases. Digestions were carried out with SgF1 (Promega) or XhoI (Roche) and NotI (Roche), according to the manufacturer’s recommendations. Finally, quantification of digested inserts and vector was performed using NanoDrop™ 2000/2000c Spectrophotometers (ThermoFisher Scientific).
29 FRAGMENT PRIMERS 3’-UTR-1 (1819bp) Forward - SgfI 5’-GCCGGCGAT/CGCTTTGCACATTGGAAGCCTCA-3' Reverse - NotI 5’-GCCGGC/GGCCGCTAAACATGAGGGACCAGACC-3’ 3’-UTR-2 (1915bp) Forward - XhoI 5’-GCCGC/TCGAGAGTGTGAGTGGTCTGTGTGA-3' Reverse - NotI 5’-GCCGGC/GGCCGCCAAAAAAACCCGAAAGCCCA-3’ 3’-UTR-3 (1872bp) Forward - XhoI 5’-GCCGC/TCGAGATACCGCTGTGTTTGTTTCG-3' Reverse - NotI 5’-GCCGGC/GGCCGCCAACCCCAATGATTTCTCGA-3’ Small-AFF1-3’-UTR (584bp) Forward - XhoI 5'-GCCGC/TCGAGTTCCCAAAGGCAAAATCTGT -3’ Reverse - NotI 5’- GCCGGC/GGCCGCATAAGTGCGGTCCAATCTGT -3’
Table 2. Primer used to amplify AFF1- 3’-UTR for luciferase reporter assay. In blue, anchor
nucleotides; in red, restriction enzyme’s recognition site; in black, specific AFF1 sequence.
3.5.2 Ligation and bacterial transformation
For each cloning procedure, three different ligation reactions were performed. The first reaction contained only the digested vector, to control for vector background; the second included digested vector and T4 DNA ligase, to evaluate cutting efficiency of a single restriction enzyme; the third reaction contained vector and insert (1:3 ratio).
Bacterial transformation was performed using E.coli Top-ten cells made competent with the CaCl2 protocol. In detail, 100 μl of competent cells were incubated on ice for 30 min with 20 μl of each ligation mixture. A heat shock (45 sec at 42°C followed by immediately transfer to ice, for 2 min) was then performed, to induce entry of plasmid DNA into bacterial cells. Next, 250 μl of LB culture medium (Bacto-Tryptone, Bacto Yeast-Extract, NaCl) was added and the mixture was incubated at 37°C for 1 h and 30 min with shake. All reactions were then plated on bacterial agar plates containing 100 mg/ml of ampicillin. After over-night incubation at 37°C, plasmid DNA from positive colonies was extracted by using Qiaprep spin miniprep kit (Qiagen), digested with restriction enzymes and analyzed by sequencing. Larger
30
amount of recombinant plasmids was obtained according to recommendations of the Plasmid Maxi Kit (Qiagen). Plasmid DNA concentration was determined by NanoDrop spectrophotometric reading.
3.6 Site-directed mutagenesis
Mutagenesis was performed using the QuickChange kit (Stratagene) and auto-complementary primers, according to the manufacturer’s instruction. Primers used to obtain mutated forms of psiCHECK-2-AFF1-3’-UTR were designed by using PrimeX online tool (Tab.3).
Primer sequence
Forward 5' – GTGTTTAATGTTTCTGTCCTTTATCTGTATTATTGAATTTAAGAGCCCTGC - 3'
Reverse 5' – GCAGGGCTCTTAAATTCAATAATACAGATAAAGGACAGAAACATTAAACAC - 3'
Table 3. Sequences of mutagenesis primers
3.7 Luciferase reporter assays
RS4;11 cells were co-transfected, as described before, with pre-MiR-27a and the psiCHECK-2-AFF1-3’-UTR or the mutated one (each with the appropriate controls). After 24 h, cells were harvested and assay was performed, using Dual-Luciferase® Reporter (DLR) Assay System, according to the manufacturer’s recommendation. In DLR Assay System, Renilla (Renilla reniformis) represents the experimental reporter and Firefly (Photinus pyralis) luciferase provides an internal control.
3.8 Chromatin Immunoprecipitation (ChIP) Assay
RS4;11 cells (30×106 for each experimental system) were transfected with MiR-27a as described before and after 36 h were fixed in optiMEM medium containing 1% formaldehyde for 10 min at room temperature; the reaction was stopped by glycine quenching (125 mM final concentration). Nuclei were collected, digested in 50 mM Tris‐HCL pH 8.1, 10 mM EDTA, 10% SDS, and then subjected to sonication (6 cycles of 30 s of sonication and 30 s
31
without sonication) using a Microson XL ultrasonic cell disruptor (Misonic). Protein-linked DNA fragments (ranging from 100-600 bp) were incubated overnight at 4°C with appropriate antibodies, then mixed with protein-G magnetic beads (Santa Cruz Biotechnology) and incubated for 2 h. Beads were washed with ChIP buffer (10mM Tris-HCl pH 8.1, 1mM EDTA, 10% SDS, 0.5% EGTA, 140mM NaCl, 10X Na-deoxycholate, 100X Triton). Immunoprecipitates were dissolved in elution buffer (0.5M EDTA, 1M Tris-HCl pH 8.0) and DNA harvested by phenol/chloroform/isoamyl alcohol extraction and ethanol precipitation. Real time quantitative PCR (qPCR) was performed with 1μL of DNA using a custom-made primer set, as already described (Yokoyama et al, 2010).
3.9 Cell viability assay
RS4;11, SEM and MV4;11 (4 × 10⁴ per well) leukemia cells were transfected with pre-MiR-27a or pre-MiR-negative control, and seeded in a 96-well plate. Cell proliferation was assessed using Cell Counting Kit 8 (CCK8), according to the manufacturer’s recommendation. To obtain a cell growth curve, absorbance was measured at 540 nm 24h-48h-72h after transfection, for each analyzed cell lines, using a Spectramax spectrophotometer (Biocompare). After appropriate testing, normalization of the cell viability, for each system, was performed using non-electroporated cells. The percentage of viability cells is expressed according to the equation:
Viability: [(sample well mean OD/background mean OD) / (control well mean OD/background mean OD)] x 100%
3.10 BrdU cell proliferation assay
RS4;11 cells transiently transfected with pre-MiR-27a or pre-MiR-negative control were plated in 24 multiwell (1 x 10⁶ cells/ml) in αMEM, with 10% FBS and 1% penicillin/streptomycin. Forty-eight hours after transfection, cells were treated with 10μl BrdU [1mM in 1x Dulbecco's phosphate-buffered saline (DPBS)]/ml of media for 45 min and stained with 7-aminoactomycin D (7-AAD) (BD Pharmingen). Cytofluorimetric analysis was carried out using the FACS Calibur system (Becton Dickinson).
32
3.11Apoptosis assay
RS4;11 cells were transfected with MiR-27a as described before; 72 h after transfection cells were incubated in annexin binding buffer (10mM HEPES, pH 7.4; 140mM NaCl; 2.5mM CaCl2) and centrifuged at 300xg at 4°C for 10 min. A solution of Annexin V-FITC (1:1000) (Miltenyi Biotec) and Propidium Iodide (PI) (2µg/mL) (BD Biosciences) was added to the cells. Positive staining was detected by flow cytometry, using FACS Calibur system (Becton Dickinson).
3.12 Colony-formation assay
RS4;11 cells were transiently transfected with 27a or pre-MiR-negative control, as described before. After 24 h, transfected cells (1.2 x 10⁴) were cultured in the MethoCult medium (STEMCELL Technologies), a semi-solid methylcellulose-based media, in a 6 well plate. Procedure was performed according to the manufacturer’s protocol.
After two weeks, obtained colonies was analyzed using LEICA DMIL LED Microscope, Objective 20X.
3.13 Statistical analysis
The data from repeated experiments were analyzed using one-way Student‘s T-test (for independent samples).
32
4. RESULTS
4.1 MiR-27a and 14-3-3θ expression level in t(4;11) leukemia cell lines
Our study started from literature data reporting that MiR-27a levels are low in several preB- and T-ALL cell lines. To evaluate MiR-27a baseline expression levels in t(4;11) leukemia cell lines (i.e. RS4;11, SEM and MV4;11) we performed a RT-qPCR with MiR-27a-specific TaqManTM probe. As 14-3-3θ is a known target of MiR-27a and considering its functional role in t(4;11) leukemia (Fioretti et al, submitted), we simultaneously evaluated 14-3-3θ transcript levels in the same cell lines, by RT-qPCR. Results revealed an inverse correlation between MiR-27a and 14-3-3θ transcript levels, which is particular relevant in t(4;11) leukemia cells (Fig.13A,B).
Figure 13. RT-qPCR to measure (A) MiR-27a and (B) 14-3-3θ levels in different leukemia
cell lines. PBL were used as reference system; REH and 697 cell lines were the positive and HL60 the negative control system. Normalization of MiR-27a level was performed to U18 endogenous control gene, whereas 14-3-3θ level was normalized to β-actin and RNA Pol2A endogenous control genes. Relative gene expression was determined using the 2-ΔΔCt method. Experiments were performed in triplicate. Error bars indicate standard deviations. Statistical significance was calculated by one-way two tail paired T-test. p‐ value are indicated as follows: *=p<0.05, **=p<0.01, *** p =<0.005, NS: not statistically significant.
33
In order to evaluate the potential effects of MiR-27a increase in the context of t(4:11) leukemia pathomechanism, we transiently transfected RS4;11 cells with pre-MiR-27a, by electroporation. To evaluate the expression profile of MiR-27a, we measured its levels 18, 24 and 36 h after transfection (Fig.14A), by RT-qPCR. We also performed western blot analysis and evaluated 14-3-3θ protein amounts after MiRNA transfection. Results indicated that 14-3-3θ decreased as a consequence of MiR-27a overexpression (Fig.14B).
Overall, these experiments indicate that MiR-27a targets 14-3-3θ also in RS4;11 cell lines.
Figure 14. (A) RT-qPCR to monitor the expression level of the MiR-27a. 18-24-36 h after
transfection in RS4;11 cells. Normalization was performed to U18 endogenous control gene. Relative gene expression was determined using the 2-ΔΔCt method. (B) Western Blot and densitometric analysis to measure 14-3-3θ protein level 36 h after MiR-27a transfection, on RS4;11 WCE. Densitometric measure was normalized to α-tubulin. Results are the mean values from three independent experiments. Error bars indicate standard deviations. Statistical significance was calculated by one-way two tail paired T-test. p‐ value are indicated as follows: *=p<0.05.
34
4.2 AF4 and MLL-AF4 are novel targets of MiR-27a
Searching for some other potential MiR-27a targets involved in leukemia pathogenesis, we performed a bioinformatic analysis by interrogating proper miRNA prediction tools (i.e. TargetScan, microRNA.org, Diana tools). TargetScan yielded a seed sequence of 7-mer in AFF1-3’-UTR, at position 2884-2890 from the stop codon. The MicroRNA.org interface considered the same sequence and yielded a 6-mer match in position 2870, which corresponded to TargetScan match, and another in position 5118 of AFF1 3’-UTR. DianaTarbase considered several putative 6-mer and 7-mer seed sequences, among which the seed in position 2869-2889 was shared with the aforementioned databases (Appendix A). The score associated to each putative seed sequence was different, according to the different score system parameters adopted by the tools. Thus, our bioinformatic analysis indicated that transcript of AFF1 could be a potential target of MiR-27a.
To demonstrate this hypothesis, we evaluated AF4 protein levels, after overexpression of MiR-27a in t(4;11) leukemia cells. To this aim, we transfected RS4;11 cells with pre-MiR-27a or pre-MiR-negative control; cells were then harvested and total proteins extracted and analyzed by western blot. Results revealed a strong reduction of AF4 protein levels as consequence of MiR-27a overexpression, in comparison to the control cells (Fig.15A). Because AFF1 shares the same 3’-UTR with the KTLM2-AFF1 fusion gene, we verified weather MiR-27a affected also MLL-AF4 chimera expression, by measuring its protein level in the same cell samples. Very interestingly, MLL-AF4 protein level significantly decreased after MiR-27a transfection (Fig.15B).
Notably, MiR-27a overexpression caused a decrease in AFF1 transcript levels of about 40%, thereby suggesting that MiR-27a likely works by inducing AFF1 mRNA degradation (Fig.15C).
35
Figure 15. Western Blot and densitometric analysis to evaluate (A) AF4 and (B) MLL-AF4
protein levels after MiR-27a transfection, in RS4;11 WCE. Densitometric measure was normalized to α-tubulin. (C) RT-qPCR to measure AF4 levels after MiR-27a transfection. Normalization was performed to β-actin and RNA Pol2A endogenous control genes. Relative gene expression was determined using the 2-ΔΔCt method. Each experiment was performed in triplicate. Error bars indicate standard deviations. Statistical significance was calculated by one-way two tail paired T-test. p‐ value are indicated as follows: **=p<0.01.
To identify the MiR-27a target sequence within the AFF1 transcript, we cloned the large UTR in the psiCHECK-2 vector. Since AFF1-3’-UTR length (5371bp) could affect cloning efficiency, we generated three different constructs, which, overall, contained three overlapping fragments that covered the entire AFF1-3’-UTR (Fig.16A). Preliminary luciferase assay results indicated that the central fragment of AFF1-3’-UTR was the best candidate to contain the putative seed sequence (APPENDIX B). This information was also consistent with the bioinformatic analysis that,
36
according to all the interrogated databases, localized the putative seed sequence in this portion of AFF1-3’-UTR.
Therefore, we cloned, in the psiCHECK-2 vector, the central fragment of AFF1-3’-UTR (584 bp long) that contained the 7-mer sequence identified by all the interrogated databases (Fig.16B). To create a negative control vector, we modified the putative 7-mer seed sequence by site-directed mutagenesis of the wild type construct and obtained the Mut_psiCHECK-2-AFF1-3’-UTR. Using these two constructs, we performed a dual-luciferase reporter assay to determine whether the predicted MiR-27a-binding sequence of AFF1 transcript was a functional target site.
To this aim, the reporter plasmid psiCHECK-2-AFF1-3’-UTR and the pre-MiR-27a or the pre-MiR-negative control were co-transfected into RS4;11 cells. The luciferase reporter assay demonstrated that co-transfection of psiCHECK-2-AFF1-3’-UTR vector and pre-miR-27a reduced Renilla activity, compared to the MiR-negative control. In contrast, co-trasfection of Mut_psiCHECK-2-AFF1-3’-UTR vector with both MiR-27a and pre-MiR-negative control did not result in reduction of Renilla activity (Fig.16C). To further demonstrate that AFF1 mRNA is an actual novel target of MiR-27a, we transfected RS4;11 cells with anti-MiR-MiR-27a, which binds to MiR-27a and blocks its function. After anti-MiR-27a transfection, AF4 protein levels are 2-fold higher than in control cells, which were transfected with the anti-MiR-negative control (Fig.16D).
These data ultimately demonstrate that MiR-27a directly binds AFF1-3’-UTR, thereby reducing AF4 and MLL-AF4 protein levels.