HOW NATIONAL INTEGRATED AIR
QUALITY MODELS CAN BE USED IN
DEFINING ENVIRONMENTAL POLICIES:
THE REVISION OF THE NEC DIRECTIVE
I. D’ELIA
Territorialand Production Systems Sustainability Department
Atmospheric Pollution Laboratory
Rome Headquarters
E. PESCHI
ISPRA – Environment Department
Emission projections,integrated modelling and indicators
Rome
RT/2016/30/ENEA
ITALIAN NATIONAL AGENCY FOR NEW TECHNOLOGIES, ENERGY AND SUSTAINABLE ECONOMIC DEVELOPMENT
I. D’ELIA Territorial and Production Systems Sustainability Department Atmospheric Pollution Laboratory Rome Headquarters
HOW NATIONAL INTEGRATED AIR
QUALITY MODELS CAN BE USED IN
DEFINING ENVIRONMENTAL POLICIES:
THE REVISION OF THE NEC DIRECTIVE
E. PESCHIISPRA – Environment Department
Emission projections, integrated modelling and indicators Rome
RT/2016/30/ENEA
ITALIAN NATIONAL AGENCY FOR NEW TECHNOLOGIES, ENERGY AND SUSTAINABLE ECONOMIC DEVELOPMENT
I rapporti tecnici sono scaricabili in formato pdf dal sito web ENEA alla pagina http://www.enea.it/it/produzione-scientifica/rapporti-tecnici
I contenuti tecnico-scientifici dei rapporti tecnici dell’ENEA rispecchiano l’opinione degli autori e non necessariamente quella dell’Agenzia
The technical and scientific contents of these reports express the opinion of the authors but not necessarily the opinion of ENEA.
Il presente rapporto è stato realizzato nell’ambito delle attività di supporto al Ministero dell’Ambiente e della Tutela del Territorio e del Mare per la negoziazione internazionale.
Si ringraziano per i contributi ed il lavoro svolto Luisella Ciancarella, Mario Contaldi, Riccardo De Lauretis, Giovanni Vialetto, Fabio Romeo e Cristina Leonardi.
HOW NATIONAL INTEGRATED AIR QUALITY MODELS CAN BE USED IN DEFINING ENVIRONMENTAL POLICIES:
THE REVISION OF THE NEC DIRECTIVE I. D’Elia, E. Peschi
Riassunto
L’inquinamento atmosferico è il principale fattore di rischio ambientale per la salute umana in Eu-ropa e l’Agenzia Internazionale per la Ricerca sul Cancro ha classificato il particolato atmosferico tra le sostanze accertate come cancerogene per l’uomo. Molte misure e politiche di contrasto
all’inquinamento atmosferico sono state adottate negli ultimi decenni, dal livello europeo a quello locale, ma gran parte della popolazione e degli ecosistemi europei è tuttora esposta ad elevate concentrazioni di inquinanti che eccedono i limiti di qualità dell’aria stabiliti nelle direttive europee e dall’Organizzazione Mondiale della Sanità. In questo contesto, nel 2013 la Commissione Europea ha adottato il Clean Air Policy Package con lo scopo di ridurre gli impatti sulla salute umana e sugli ecosistemi, il cui strumento principale per la riduzione delle emissioni è rappresentato dalla proposta di una nuova Direttiva NEC (National Emission Ceilings – Tetti Nazionali di Emissione) che pone degli obiettivi al 2030, espressi come percentuali di riduzione rispetto ai livelli registrati nel 2005. Tali obiettivi riguardano le emissioni di SO2, NOX, NMVOC, NH3, come nella versione vigente della direttiva, cui si aggiungono anche il PM2.5 e il CH4. L’elaborazione di possibili scenari di riduzione delle emissioni è stata realizzata con il modello GAINS-Europa attraverso un’analisi costi-benefici che ha consentito alla Commissione europea di formulare la proposta di una nuova direttiva NEC contenente gli obiettivi di riduzione delle emissioni per il 2020 e il 2030 rispetto all’anno base 2005. Nel processo di negoziazione per la nuova Direttiva NEC, l’Italia ha elaborato diversi scenari di riduzione delle emissioni utilizzando il sistema modellistico integrato nazionale sulla qualità dell’aria, sviluppato nell’ambito del progetto MINNI. Nel presente lavoro tutti gli scenari e le differenti proposte di riduzione delle emissioni per l’Italia verranno presentate e discusse con l’obiettivo di evidenziare come, durante un processo negoziale, un sistema modelli-stico nazionale possa influenzare la definizione di politiche di contrasto all’inquinamento
atmosferico.
Parole chiave: inquinamento atmosferico, scenari emissivi, direttiva NEC, modelli di valutazione integrata, analisi costi-benefici
Abstract
Air pollution represents the single largest environmental health risk in Europe and particulate matter has become a major concern for public health whose carcinogenicity has been recognized by the International Agency for Research on Cancer. Many measures and policies have been adopted in the past decades at European, national, regional and even local level but a large portion of European population and ecosystems is still exposed to concentrations that exceed the European Union and the World Health Organization air quality standards. In this view, in 2013, the European Commission adopted the Clean Air Policy Package with the aim to further reduce the impacts of harmful
emissions on human health and the environment, where the proposal for a revised National Emis-sion Ceilings (NEC) Directive plays a major role. Different emisEmis-sion reduction scenarios have been elaborated with the GAINS-Europe model through a cost-benefit analysis. To achieve the wished health and environmental impact reductions, the proposal for the new NEC Directive sets national emission reduction commitments to be reached by 2020 and 2030, with respect to the year 2005, for SO2, NOX, NMVOC, NH3, as in the current version of the Directive, but adding also PM2.5 and CH4. In order to participate to the negotiation process and to be able to compare the national results with those elaborated by the Commission, Italy has calculated different emission scenarios using the National Integrated Air Quality modelling system, developed during the MINNI project. In the present report all the scenarios and all the different proposals of emission reduction commitments for Italy are presented and discussed with the aim to highlight how a national modelling system can influence the negotiation process in defining air pollution policies. Keywords: air pollution, emission scenarios, NEC Directive, integrated assessment modelling, cost-benefit analysis
1 INTRODUCTION 2 METHODOLOGY
3 THE NEW ITALIAN REFERENCE SCENARIO 3.1 The energy scenario
3.2 The scenario of non-energy activities 3.3 The control strategy definition 3.4 The harmonization process
3.5 The new national emission scenario 3.6 PM2.5 concentration maps
3.7 Life Expectancy Reduction
4 THE NEGOTIATION OF THE NEW NEC DIRECTIVE 5 SENSITIVITY ANALYSES
5.1 Wood combustion in the domestic sector 5.2 The agricultural scenario
5.3 The road transport scenario 6 CONCLUSIONS REFERENCES 7 9 11 11 15 17 19 22 25 26 27 36 36 38 40 42 44 INDEX
7
1
INTRODUCTION
The 2015 Air Quality Report of the European Environmental Agency stated that air pollution is the single largest environmental health risk in Europe (EEA, 2015a) and particulate matter has become a major concern for public health (WHO, 2015). Many measures and policies have been adopted in the past decades at European, national, regional and even local level but a large portion of European population and ecosystems is still exposed to concentrations that exceed the World Health Organization (WHO, 2005) and the European Union air quality standards (EC, 2008).
As asserted in the 2015 Air Quality Report (EEA, 2015a), air pollution is a complex problem that poses multiple challenges in terms of management and mitigation. Although the national total emissions of most pollutants are decreasing, the ambient air concentrations are following less steep paths. This is due to several factors concerning the chemistry and the physics of the atmosphere, the specific contribution of the different humanactivities and the effectiveness of the measures adopted to contrast atmospheric pollution. Effective action to reduce the impacts of air pollution requires a good understanding of the sources, as well as up-to-date knowledge of air quality status and its impact on humans and on ecosystems. Solutions must be found relying on, but not limited to, technological development, urban planning, optimization of infrastructures.
In this view, in 2013, the European Commission adopted the Clean Air Policy Package (COM, 2013) with the aim to further reduce the impacts of harmful emissions on human health and the environment, where the proposal for a revised National Emission Ceilings Directive (NECD) plays a major role.
The adopted package includes
- a new Clean Air Programme for Europe with measures to ensure that existing targets are met in the short term, and new air quality objectives for the period up to 2030;
- a revised National Emission Ceilings Directive with stricter national emission ceilings for the six main pollutants, sulphur dioxide (SO2), nitrogen oxides (NOX), fine particulate matter
(PM2.5), non-methane volatile organic compounds (NMVOC), ammonia (NH3) and methane
(CH4);
- a proposal for a new Directive to reduce pollution from medium-sized combustion installations.
In order to elaborate this new package, the European Commission asked the International Institute for Applied Systems Analysis (IIASA) to elaborate emission scenarios with GAINS-Europe (Greenhouse Gas and Air Pollution Interactions and Synergies Model), so to explore the potential for environmental improvements offered by emission control measures that are not yet part of current legislation. In fall 2013 it was so produced a comprehensive impact assessment for the revision of the EU air quality Directive that laid out the main policy options (COM, 2013).
Among main results, by 2030 the clean air policy package, compared to the business as usual scenario, is estimated to avoid 58000 premature deaths, save 123000 km2 of ecosystems from
8
nitrogen pollution, save 56000 km2 protected Natura 2000 areas from nitrogen pollution and save 19000 km2 of forest ecosystems from acidification. Moreover, health benefits alone will save €40-140 billion in external costs and provide about €3 billion in direct benefits (Amann et al., 2014c). More information and link to the draft proposal and to the impact assessment used for the proposal can be found on the following link http://ec.europa.eu/environment/air/clean_air_policy.htm.
More information about the GAINS methodology and interactive access to input data and results are available at the link http://gains.iiasa.ac.at/TSAP. All detailed data of the scenarios used in the Impact Assessment for the Clear Air Policy Package are online and can be retrieved from the GAINS-online model (http://gains.iiasa.ac.at/gains/EUN7index.login?logout=1).
Italy has its own integrated air quality assessment model, GAINS-Italy (Greenhouse Gas and Air
Pollution Interactions and Synergies Model over Italy, www.minni.org; Ciucci et al., 2016; D’Elia et al., 2009; D’Elia and Peschi, 2013), run by ENEA in collaboration with ISPRA. GAINS-Italy estimated independently the impact of the revision of the NEC directive, therefore an in-depth comparison between IIASA scenarios for Italy and national scenarios has been carried out. All the scenarios elaborated for the revision of the NEC Directive are online and could be retrieved from the GAINS-Italy on line model (http://gains-it.bologna.enea.it/gains/IT/index.login).
The aim of the present report is to highlight how a national integrated air quality modelling system can influence the negotiation process in defining air pollution policies. In the negotiation processes, the integrated air quality modelling system has become fundamental in helping decision-makers to develop environmental policies with acceptable environmental and socioeconomic outcomes (Hamilton et al., 2015). Scenarios can so provide scientifically defensible description of future developments under certain hypotheses on major driving forces and of their impacts; they represent tools for analyzing plausible alternative future trajectories in a complex system in which there is a high degree of uncertainty (Schweizer and Kurniawan, 2016). In such a contest, the scenarios elaborated by IIASA for each Member State are robust and suitable for an EU wide analysis, but they could differ from the ones produced at national level for various reasons. Having a national model like GAINS-Italy, that mirrored the characteristics of the European model but is tailored to the Italian peculiarities (not only on activity data and emission factors, but also on orography and meteorology with a higher spatial resolution), makes the comparison easier and the scenarios more reliable. Being able to produce and discuss a national scenario allowed Italy to negotiate emission reduction targets with a realistic ambition level.
In this report the modelling system used in Italy and its updates is described in section 2, the new and most updated reference scenario is presented and discussed in section 3, while sections 4 and 5 focus on the negotiation process for the revision of the NEC Directive, presenting respectively the Directive and some sensitivity analyses.
9
2
METHODOLOGY
Over the past three decades the negotiation process of the Protocols to the Convention on Long-Range Transboundary Air Pollution (CLRTAP) and of the NEC Directive has gone through a number of phases. The last two main important negotiation processes, the Gothenburg Protocol at the international level and the NEC Directive at the European level, have introduced cost-effectiveness and effect-based principles as the rationale to derive quantitative and differentiated national reduction obligations based on the reduction of health impact (Amann et al., 2011; COM, 2013; Amann et al., 2015). The emission scenarios have become increasingly important in the definition of international, European and national policies on atmospheric pollution.
To support the methodological aspects of the policy design through this new approach and make it applicable to the regional context within a country, the Italian National Agency for New Technologies, Energy and Sustainable Economic Development (ENEA) has developed MINNI (National Integrated Model to support the International Negotiation on atmospheric pollution) (www.minni.org), funded by the Italian Ministry of Environment, Territory and Sea. MINNI is an Integrated Modelling System that links atmospheric science with the economics of emission abatement measures and policy analysis and consists of several interdependent and interconnected components: the national AMS (Atmospheric Modeling System, Mircea et al., 2014) and the national GAINS-Italy (Ciucci et al., 2016; D’Elia et al., 2009). They interact in a feedback system through ATMs (Atmospheric Transfer Matrices) and RAIL (RAINS-Atmospheric Inventory link).
More in detail, the AMS simulates meteorological fields and computes gas and aerosol transport, diffusion and chemical reactions in atmosphere. It is composed by the meteorological model RAMS (Regional Atmospheric Modelling System, Cotton et al., 2003); the emission processor EMMA (EMission MAnager, ARIA/ARIANET, 2008); the three-dimensional Eulerian model FARM (Flexible Air Quality Regional Model, Silibello et al., 2008; Gariazzo et al., 2007; Kukkonen et al., 2012) that includes transport and multiphase chemistry of pollutants in the atmosphere. The AMS has been applied to build the ATMs, providing a simplified relation between emissions and concentrations, in order to get near real-time concentration estimates after emission scenario hypotheses (Briganti et al., 2011). ATMs allow the GAINS-Italy model to calculate regional background concentrations of PM2.5 and NO2 from emission scenarios of the whole Italian territory
with a spatial resolution of 20 km. As base case for the AMS calculations, the emissions for the year 2015 of the baseline “No Climate Policy scenario” (MATTM, 2011) were used. ATMs have been calculated separately on four meteorological years, 1999, 2003, 2005, 2007. In addition, the concentration fields of the four meteorological years have been averaged to generate a new set of ATMs, which in the following we refer to as the meteorology-average ATM.
The GAINS-Italy (fig. 1) model explores cost‐effective multi‐pollutant emission control strategies (Ciucci et al., 2016) that meet environmental objectives on air quality impacts (on human health and ecosystems) and greenhouse gases. The current legislation (CLE) scenario represents the ‘baseline’ and reflects all policies legally in force, both those affecting activity levels (such as energy and agriculture policies), as well as pollution control policies for the period 1990-2050.
10
Fig. 1 – The GAINS-Italy model scheme.
At a national level, the Legislative Decree n. 155 of 2010, art. 22 paragraph 4 states that ISPRA (Institute for Environmental Protection and Research) has to develop the energy scenario and the scenario of national production activities and, based on these scenarios, ENEA has to calculate the emission projections using the methodology developed for these purposes at the European level. In this framework, ENEA and ISPRA have jointly developed the new national reference emission scenario using the GAINS-Italy model which was used for the negotiation of the NEC Directive and will be presented in the following paragraphs .
The GAINS-Italy model is accessible online at http://gains-it.bologna.enea.it/gains/IT/index.login
11
3
THE NEW ITALIAN REFERENCE SCENARIO
The development of an emission scenario with the GAINS-Italy model requires the definition of anthropogenic activity levels, both for energy production and non-energy sectors, and of a control strategy with a 5-years interval for the period 1990-2050. Starting from these information, GAINS-Italy produces future emission and air quality scenarios and abatement costs.
3.1 The energy scenario
The energy scenario used as input to the GAINS-Italy model has been produced by ISPRA with the partial equilibrium model TIMES (The Integrated MARKAL-EFOM1 System / EFOM Energy Flow Optimization Model, Loulou et al., 2004; Loulou et al., 2005). TIMES is a model generator for local, national or multi regional economies finalized to the analysis of a whole energy system (electricity generation and consumption, heat distribution, transports, industries, civil, etc.). The model belongs to the family of MARKAL (Market Allocation, http://www.iea-etsap.org/web/Markal.asp) models and so-called 3e models (energy, economy, environment) and was developed by the International Energy Agency (IEA) under the program Energy Technology Systems Analysis Program (ETSAP) and it is recognized by the International Panel on Climate Change ( IPCC).
A national version of the TIMES model has been developed by ISPRA and tailored to the Italian context in order to investigate possible future energy scenarios (ISPRA, 2015). The simulated energy system is composed of a number of different sectors and subsectors (e.g. electricity production, industrial activities, residential buildings, etc.), each consisting in a series of technologies connected by input-output linear relationships. Inputs and outputs can be energy carriers, materials, emissions or requests for services. TIMES is a bottom-up demand-driven model in which each technology is identified by technical and economic parameters and the production of a good is linked to the effective demand by the end users.
A simplified scheme of the energy system used for this exercise is given in fig. 2.
The structure of the energy scenarios is defined by the variables and the equations determined by the input data that constitute the regional database. The database contains qualitative and quantitative data that describe the interaction between the different components of the energy system.
TIMES identifies the optimal solution to provide energy services at the lowest cost, simultaneously producing investments in new technologies or more intensively using the technologies available in each region defined by the user. For example, an increase in electricity demand for residential use can be satisfied with a more intensive use of available power plants or the installation of new power plants. The choice of the model will be based on an analysis of the technological characteristics of the available alternatives, the economy of energy supply and environmental criteria and bounds.
12
Fig. 2 – Simplified scheme of the Italian energy system.
The model has been developed considering the detailed energy input needed by GAINS-Italy so that the two models are fully integrated and all the information needed by GAINS-Italy can be found in the TIMES output, that describes, for each sector, the amount of energy carriers, raw materials used, and goods or services produced.
The energy scenario used for the present work is based on the National Energy Strategy adopted by the Ministry of Economic Development (SEN, 2013) and its updates made by the Inter-ministerial Committee for European Affairs. As an example, in figure 3 the amount of fuel used to produce electricity in the thermal power plants is reported.
13
Fig. 3 – Energy used (in PJ) for electricity production by thermal power plants.
In the year 2015 the 59% of electricity production in thermal power plants is satisfied by gas followed by coal with the 22%. In the year 2030 coal contribution decrease to 7% while gas increase to 81%. Anyway, a general decrease of the total amount of fuel used is observed due to a huge decrease in oil and coal consumption while gas consumption is almost stable.
The energy scenario considers also the updates of the time series of biomass consumption in the civil sector, as reported in fig. 4, occurred in June 2015 (http://ec.europa.eu/eurostat/data/databasehttp://ec.europa.eu/eurostat/data/database) as a consequence of a specific national survey on family energy consumption (ISTAT, 2014).
14
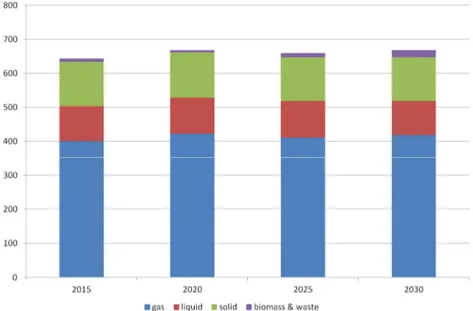
The domestic fuel consumption, reported in fig. 5, remains approximately constant in the medium term with a slow decrease of gas and a slow increase of biomass, that represent, in the year 2030, the 71% and 22%, respectively, of total consumption.
Fig. 5 – Fuel used (in PJ) in the civil sector.
Even in the industrial sector (fig. 6), fuel consumption is almost stable and gas is the predominant fuel in all the years accounting for 63% of total consumption followed by solid fuels with 20% and liquid fuels with 15%.
15
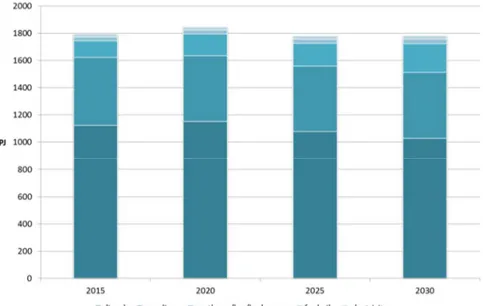
Considering all the transports (fig. 7), diesel is projected to maintain its share in total final energy demand in transport, representing almost the 60% of total fuel consumption, followed by gasoline with the 27% in the year 2030.
Fig. 7 – Energy used (in PJ) for transports.
3.2 The scenario of non-energy activities
In order to develop an emission scenario, the GAINS-Italy model requires projections of non-energy activities and some industrial processes as well. The definition of such projections is based on economic variables (e.g. gross domestic product, value added), population trends or specific sector statistics (e.g. physical production).
Livestock projections have been carried out with a statistical model where the number of animals has been linked to the projections of other variables, like meat consumption and production, or milk consumption and production. All the details about this methodology are provided in D’Elia and Peschi (2013).
The evolution of the main agricultural indicators is summarized in figure 8, while the trend of the main industrial production is reported in fig. 9.
16
Fig.8 – Main agricultural indicator trends for the national reference scenario.
Fig. 8 shows an increase in poultry and pig livestock while cows are supposed to constantly decrease till the year 2030. The urea and other nitrogen fertilizer consumptions show a decrease till the year 2010 followed by a new increase till the year 2020, from the year 2020 to 2030 they are supposed to remain constant.
Fig. 9 shows a huge decrease till the year 2015 in all the main industrial productions due to the economic crisis. After the year 2015, a new production increase is projected even though far from the 2005 level.
17
3.3 The control strategy definition
In order to elaborate an emission scenario with the GAINS-Italy model, the last required step is the definition of a control strategy. Given a specific sector/activity and an emission abatement technology, the control strategy is expressed as percentage of application of the abatement technology on the sector/activity. In a baseline scenario it is assumed that all the European and national regulations will be fully complied according to the foreseen time schedule. In this way, the current legislation (CLE) scenario reflects all policies that affect activity levels (such as energy and agriculture policies) and pollution control.
Fig. 10 shows how the control strategy is built for gas power plants. The first step consists in assigning gas consumption among the different available technologies (boilers, gas turbines, combined cycles and engines), and then the application of the end of pipe technologies for a particular pollutant is defined (in the example of fig. 10, the application percentage to Combined Cycle Gas Turbines of the Selective Catalyst Reduction to abate NOX emissions is showed).
Fig. 10 – Evolution of the gas power plants in the national reference scenario and definition of the SCR technology in the CCGT (combined cycle gas turbine) plants.
In fig. 11, the evolution of the technologies for wood combustion in the domestic sector, as assumed in the national reference scenario, is reported. The traditional technologies are supposed to be gradually replaced especially by pellet stoves and closed fireplaces.
18
Fig. 11 – Control strategy definition in the domestic sector for wood combustion.
For the transport sector, the definition of the control strategy is slightly different from all other sectors: the Euro classes percentages do not represent the number of vehicles but the fleet composition weighted on mileage of each Euro class. Examples of the control strategy for the road transport sector are reported in figg. 12-13. It is worth noting that the diffusion of diesel Euro 6 cars in the year 2030 is quite optimistic considering the effects of the economic crisis and the present selling statistics.
19
Fig. 13 – Control strategy for diesel heavy (left) and light (right) duty tracks.
3.4 The harmonization process
The first step for the preparation of a new national emission scenario is to align at a given base year the latest national emission inventory submission and the GAINS-Italy emissions, estimated with a top-down approach. Being a Party of the United Nations Economic Commission for Europe (UNECE) Convention on Long Range Transboundary Air Pollution (CLRTAP), Italy has to annually submit an emission inventory of air pollutants and provide a report on its data according to the Guidelines for reporting emissions and projections data (UNECE, 2015). On the other hand, in order to produce a reliable emission scenario, GAINS model produces its own emission estimates, for the years considered in the model, with its own classification system. Discrepancies between the inventory and the GAINS output exist and are due to different reasons, such as, for example, different coverage and aggregation of emission sources, different emission calculation methodologies. These discrepancies need so to be solved and the emission estimates to be aligned. This alignment step is called harmonization and is needed to validate the emission scenario, in order to base time trends of emissions in GAINS on a reliable starting point. In the harmonization process, activity data, emission factors and technologies for each sector are compared. If discrepancies emerge (for example in fuel allocation across sectors or different assumptions on control measures in place in the year of comparison), the model parameters will be modified according to the inventory with the attempt to let GAINS reproduce emissions as closely as possible to the national emission inventory. Further details about the harmonization method are reported in D’Elia and Peschi (2013). For all these reasons, an in-depth comparison between the last national emission inventory (IIR, 2016) and the GAINS-Italy emission estimates has been carried out considering two historical years, 2005 and 2010. Results are summarized in Table 1.
20
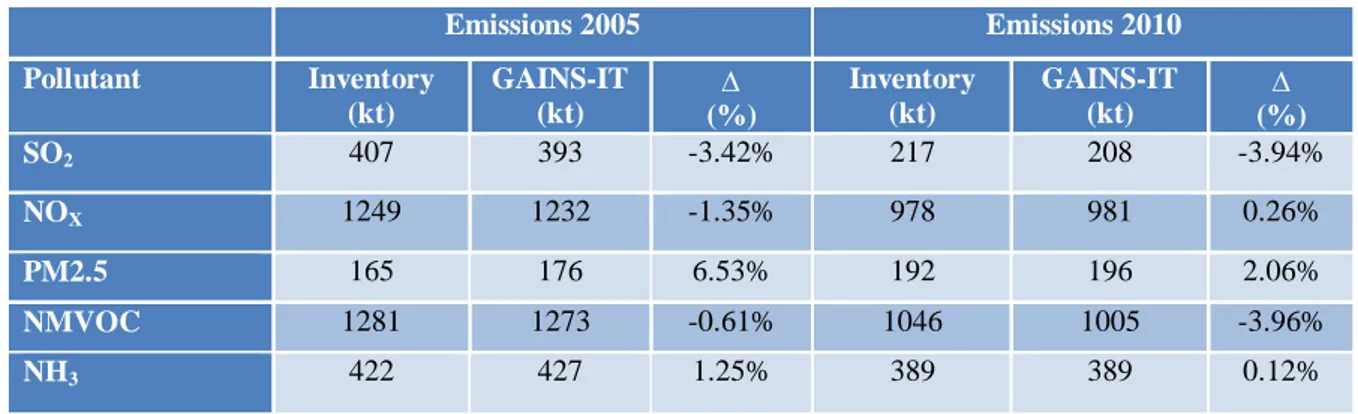
Table 1 –Comparison of total emissions in the last submission of the national inventory report (IIR, 2016) and in GAINS-Italy estimates, for the years 2005 and 2010.
Emissions 2005 Emissions 2010 Pollutant Inventory (kt) GAINS-IT (kt) D (%) Inventory (kt) GAINS-IT (kt) D (%) SO2 407 393 -3.42% 217 208 -3.94% NOX 1249 1232 -1.35% 978 981 0.26% PM2.5 165 176 6.53% 192 196 2.06% NMVOC 1281 1273 -0.61% 1046 1005 -3.96% NH3 422 427 1.25% 389 389 0.12%
Discrepancies in reproducing the national emission inventory have been considered acceptable if differences remain within a few percentage points, i.e. in the interval between ± 5%. The higher differences in PM2.5 emissions for the year 2005 have been considered acceptable because the model estimates emissions from sectors that are not considered in the emission inventory for their high uncertainties, like fireworks, barbecue and agricultural activities.
In the following plots, details on sectoral emissions are reported for the years 2005 and 2010.
In 2005 energy industries represent the main emitting sector of SO2 while in 2010, due to a reduction
in oil and coal consumption of existing power plants, the industrial sector becomes the main contributor followed by energy industries and off-road transport, i.e. maritime transportation. A good alignment has been reached in SO2 sectoral emissions. Small differences between model and
inventory remain in energy industries and manufacturing industries, essentially due to different allocation of activities in the two sectors.
Figure 14 – SO2 national emission harmonization between the last emission inventory and GAINS-IT detailed by sectors for the year 2005 (left) and 2010 (right).
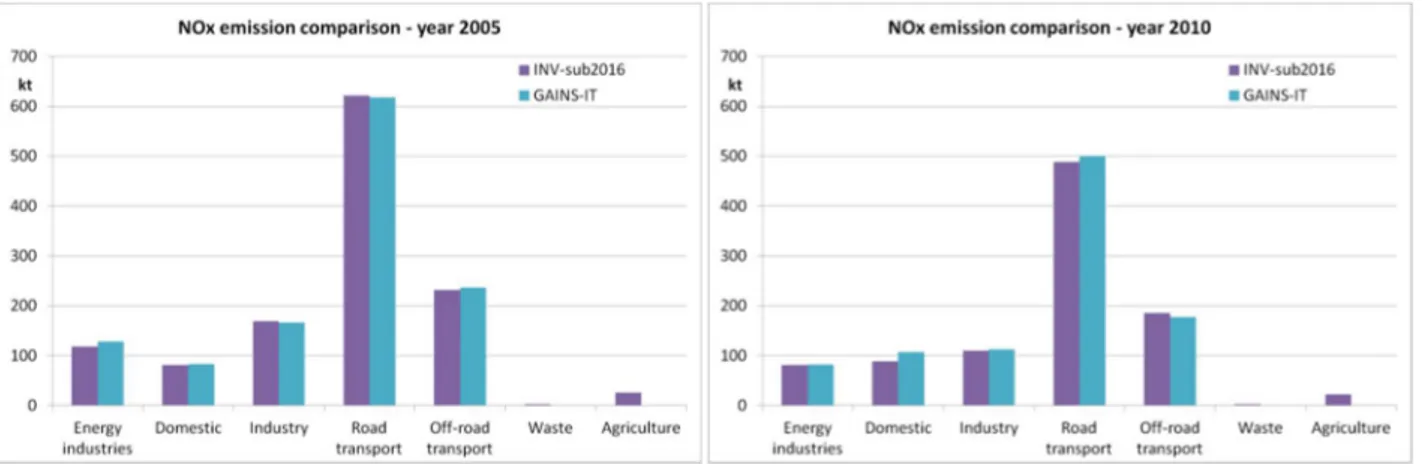
The harmonization of NOx emissions shows a good agreement not only in total emissions but also by
sectors. Road transport is the main emitting sector for both years even if a decrease of 21% is noticed at the year 2010 with respect to the year 2005. Relevant emissions come also from off-road transport, especially maritime and agricultural sector, and from industry. It is worth noting the increase in the
21
civil sector, due to the increase in biomass consumption whose emissions are close to industrial figures.
Figure 15 – NOx national emission harmonization between the last emission inventory and GAINS-IT detailed by sectors for the year 2005 (left) and 2010 (right).
With the exception of the “other sector”, PM2.5 emissions from GAINS-Italy are very close to those reported in the national emission inventory (fig. 16). It should be noted that, due to the increase in biomass consumption for domestic heating, emissions are almost doubled in five years.
In the forthcoming years, even if biomass consumption may continue to increase, PM emission should not increase with the same pace thanks to technological innovation of the appliances used for biomass burning.
Figure 16 – PM2.5 national emission harmonization between the last emission inventory and GAINS-IT detailed by sectors for the year 2005 (left) and 2010 (right).
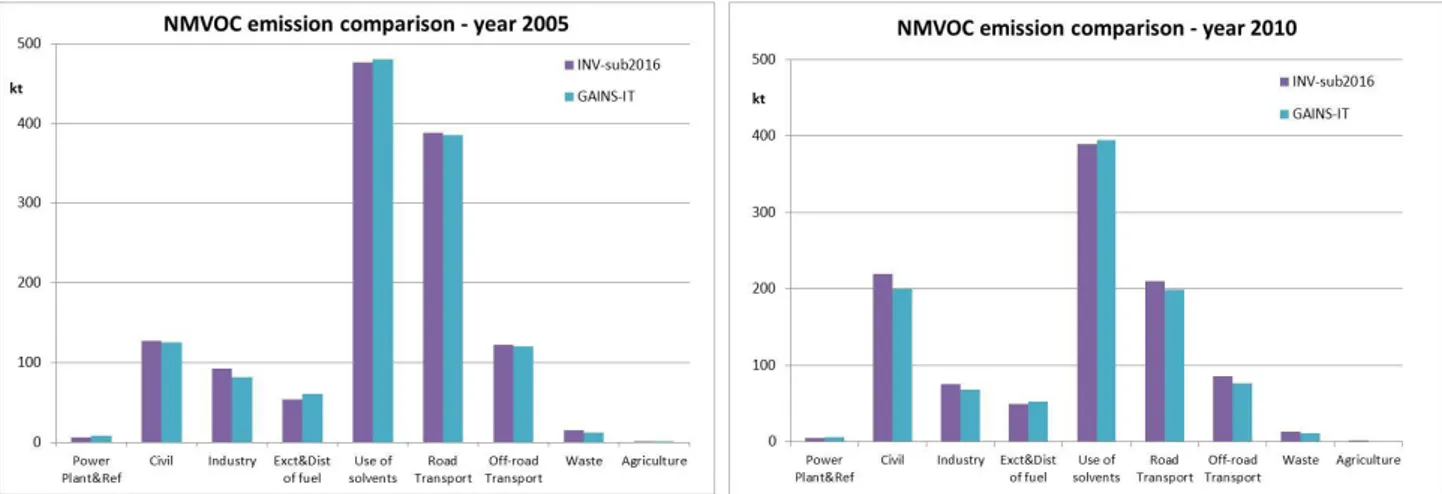
Also for NMVOC it is possible to observe a good agreement between emission modelled and estimated in the inventory. The use of solvent (in domestic and industrial sector) remains the main emitting sector both for 2005 and 2010 followed by the road transport sector in 2005 and by the civil sector in 2010.
22
Figure 17 – NMVOC national emission harmonization between the last emission inventory and GAINS-IT detailed by sectors for the year 2005 (left) and 2010 (right).
A good agreement also at a sectoral level is observed for NH3 emissions where the agriculture sector
represents the main source with more than 95% of total NH3 emissions for both years.
Figure 18 – NH3 national emission harmonization between the last emission inventory and GAINS-IT detailed by sectors for the year 2005 (left) and 2010 (right).
3.5 The new national emission scenario
The result of the input scenarios and of the harmonization process is an emission scenario. In figures 19-23 the emissions reported for 2005, 2010 and 2014 and the projection for 2015 - 2030 are presented.
The emissions projected for 2015 are slightly higher than emissions reported for 2014 for SO2 and
NOx while a good agreement could be noticed for PM2.5, NMVOC and NH3.These modifications
can both be explained by a small increase in the level of activities, that can be seen in preliminary data available for 2015, or by the anticipated effects of the policies considered in the scenario.
23
A huge decrease in SO2 emissions from power plants and the maritime sector is projected for the
year 2020 and 2030 while the industrial sector represents the main emitter (fig. 19). The road transport sector still represents the principle NOX source (fig. 20) even though a huge decrease is
estimated due to the diffusion of Euro 6 vehicles.
Figure 19 – Reported and projected SO2 emissions in the new national emission scenario.
Figure 20 – Reported and projected NOx emissions in the new national emission scenario.
The civil sector continues to represent the main emitting sector for PM2.5 emissions whose contribution remains around 60% both for 2020 and 2030 (fig. 21). The main emitting sector for NMVOC is still represented by domestic and industrial solvent use (fig. 22) whose emissions are not projected to decrease and represent the 45% and 51% of total NMVOC emissions for 2020 and 2030, respectively. NH3 scenario does not present a significant variation in emissions where the
contribution of the agricultural sector to total NH3 emissions is around 96% (fig. 23). Cattle continue
24
Figure 21 – Reported and projected PM2.5 emissions in the new national emission scenario.
Figure 22 – Reported and projected NMVOC emissions in the new national emission scenario.
25
3.6 PM2.5 concentration maps
The PM2.5 mean annual air quality limit value required by the Air Quality Directive 2008/50/EC (EC, 2008) is 25 mg/m3
. The GAINS-Italy model allows to calculate PM2.5 concentration maps for the whole Italian territory at a resolution of 20 km for 5 meteorological years.
The considered Atmospheric Transfer Matrix is the meteorology-average ATM so that the results are not influenced by a specific meteorological year (see chapter 2). Under these conditions and although the improvements from the implementation of the current air legislation, the PM2.5 mean annual limit value in the baseline 2030 scenario will not be met in different areas of the Italian territory (figure 24).
Fig. 24 – Mean annual PM2.5 concentrations (mg/m3
) for the years 2005 (top left) and 2030 (top right), PM2.5 concentration absolute differences (mg/m3
, bottom left) and reductions (%, bottom right) between the year 2030 and 2005 calculated by the GAINS-Italy model with a resolution of 20 km and the average meteorological year.
26
Exceedances in the 2030 baseline scenario are estimated in the area of Milan and values around the limit are foreseen in the Po valley and in the area of Naples.
3.7 Life Expectancy Reduction
The GAINS-Italy model allows to elaborate the Life Expectancy Reduction (LER), a health indicator that correlates PM2.5 concentrations to population to calculate the months of life lost. Fig. 25 shows the months of life lost in the years 2005 and 2030 that move from a maximum of 29 months in the year 2005 to a maximum of 14 months in the year 2030.
Fig. 25 – Life Expectancy Reduction linked to PM2.5 concentrations calculated by the GAINS-Italy model with a resolution of 20 km and the average meteorological year for the years 2005 (top left) and 2030 (top right) and months
27
4
THE NEGOTIATION OF THE NEW NEC DIRECTIVE
The present National Emission Ceilings Directive, 2001/81/EC (EC, 2001), sets annual national emission ceilings for each Member State to be attained by 2010, covering emissions of SO2, NOX,
NMVOC and NH3, giving Member States the flexibility to determine how to reach the targets. But,
while most of the ceilings have now been reached (EEA, 2015b), air quality problems are quite far from being solved. To achieve the reduction needed to comply with the Union's international commitments for 2020 under the Gothenburg Protocol and to address the outstanding health and environmental impacts, the Annex II of the proposal for the new NEC Directive sets national emission reduction commitments to be reached by 2020 and 2030 for SO2, NOX, NMVOC, NH3, as
in the current version of the Directive, but adding also PM2.5 and CH4.
The impact assessment accompanying the clean air policy package (COM, 2013) presented many different emission reduction scenarios calculated by IIASA with the GAINS-Europe model, which has a broad scope and captures the interactions among the various pollutants and impacts. These scenarios have been defined considering different ambition levels and the associated costs and benefits.
The first scenario is the baseline where no new measures are taken at EU level beyond the source controls established in the current legislation and the NECD ceilings for 2020 (transposed from the Gothenburg Protocol). The other scenarios involve setting more stringent objectives to further reduce health and environmental impacts. These scenarios have been defined considering the “gap closure” approach. The starting point of the gap closure approach is that the feasible range of scenarios lies between the baseline and the Maximum Technically Feasible Reduction (MTFR) scenario. This range represents the gap between what is currently planned and what is feasible. It can be calculated for each impact indicator in each receptor region. The absolute value of the gap will be different for different receptor regions, but the main idea of the gap closure concept is to require that the gap between baseline and MTFR scenario is to be reduced by the same percentage in all regions. In this way, heavily polluted areas benefit more in absolute terms than comparatively clean areas, but in relative terms in all areas the same progress towards MTFR effect levels is made so that the benefits of a policy are shared proportionally by all affected areas (Wagner et al., 2013). The gap closure percentages represent ambition levels, ranging from 0% (no ambition) to 100% (maximum ambition), and policy makers may choose different ambition levels for different impact indicators. As each of these indicators depends on the emissions of different sets of pollutants, and as each of the impact indicators has a different geographic distribution, different costs for each of the impact indicators should be expected in the gap closure procedure results. Anyway, the proposal of an appropriate impact indicator and ambition level for further measures remains a political choice and has to reflect implicit value judgements of decision makers. In the Thematic Strategy review and in the Clean Air Policy Package proposal, the GAINS optimization analysis has been conducted for a series of increasingly stringent ‘gap closure’ targets using PM health impacts as indicator.
The health benefits related to the different ambition levels have also been quantified (Amann et al., 2014a). In Amann et al. (2014a), it was stated that for the year 2025 “a comparison of the marginal costs of increasingly stringent gap closure targets for human health with their marginal benefits indicates a range for the optimal ambition level between a 75% and 92% gap closure, depending on
28
the choice of the methodology for the benefit assessment”. The inability to quantify monetary benefits, e.g., to ecosystems, does not imply that improvements for these impacts are without value, so in the IIASA impact assessment different sensitivity analyses have been carried out to quantify the effect of the different health gap closure on the other environmental impacts. Since the optimization for PM health impacts, that is linked to population exposure to ambient PM2.5, addresses all precursor emissions for ambient PM2.5 concentrations, reductions of the precursor emissions will also result in benefits for ground‐level ozone, eutrophication and acidification. In conducting its analyses, IIASA found out that the most conservative estimate of marginal health benefits to equalize marginal costs occurs at a 75% YOLL (Years Of Life Lost) gap closure for the year 2025 and at 72% for the year 2030 (Amann et al., 2014c). In order to take into account all the uncertainties of the modelling and to be conservative, in December 2013 (COM, 2013), the college of the European Commission reached an agreement on a gap closure level for health effects five percent lower than the theoretically optimal 75% (2025) and 72% (2030), choosing a gap closure of 70% (2025) and of 67% (2030). Following these assumptions, the European Commission published the first NEC Directive proposal (COM, 2013). The negotiation process of both the amended Gothenburg protocol and the NEC Directive has shown how the cost-effectiveness analysis has become a rationale to assign differential national obligations that is based for the first time on the health impact of particulate matter now recognized as carcinogenic (IARC, 2015).
Although emission scenarios elaborated by IIASA for each Member State are robust and suitable for an EU wide analysis, the projections differ from the ones produced at national level for various reasons and several bilateral meetings among national and IIASA experts and the Commission have taken place in these three negotiation years in order to discuss differences and align the national and IIASA scenario results. In the following paragraphs, the negotiation process with the different scenarios elaborated at a national level and by IIASA for Italy will be presented.
4.1 The first phase of the NEC Directive negotiation – from December 2013 to January 2015
As already underlined, according to the impact assessment and to the IIASA reports, while for 2020 there is no room for going beyond the commitments set in the Gothenburg Protocol, for 2030 the scenario that performs best in the costs/benefits analysis is the one that reduces the gap closure on the health impact by 67%. This scenario provides a continuing trajectory towards the Union's long-term objective and should reduce the health impacts of atmospheric pollution (premature mortality due to particulate matter and ozone) by 52% in 2030 relative to 2005 and the ecosystem area exceeding eutrophication limits by 35% (Amann et al., 2014c). The emission reduction commitments for Italy presented in the first NEC Directive proposal of December 2013 (COM, 2013) are reported in table 2 with a comparison of the Italian proposal coming from the emission scenario available at that time.
29
Table 2 – Emission reduction commitments for Italy in the Annex II of the NEC Directive Commission Proposal of December 2013 (COM, 2013) and the Italian Proposal in May 2014.
Pollutant COMM Proposal Dec 2013 Italy Proposal May 14 SO2 -75% -61% NOX -69% -55% PM2.5 -45% -13% NMVOC -54% -38% NH3 -26% -7%
The numbers presented in the impact assessment have been questioned by Members States because of some discrepancies on historical data and national specificities. At the beginning of the year 2014, the European Commission launched different bilateral meetings. The technical bilateral meetings between IIASA and national experts took place during April/May 2014; their results were presented by IIASA (Amann et al., 2014a and b) allowing in January 2015 a new Commission proposal (Amann et al., 2015).
4.2 The second phase of the NEC Directive negotiation – from January 2015 to nowadays
After the technical bilateral meetings (Amann et al., 2014a and b), in January 2015 IIASA issued a report with the adjusted historical emission data, projections, and optimized emission reduction targets for 2030 (Amann et al., 2015).
All the different reference emission scenarios elaborated by IIASA and Italy during the three-year NEC negotiation are reported in the following figures, where the European scenario elaborated by IIASA for Italy starts with the words “EU” while scenarios elaborated at national level are indicated with “IT”.
The “EU_REF_DIC2013” represents the scenario of the first NEC Directive Proposal that has been modified during the technical bilateral meeting in the new “EU_REF_JAN2015” that represents the scenario of the new Commission Proposal of January 2015. The “IT_NEC_2014” scenario was the national scenario available during the technical bilateral meeting in May 2014 and discussed with IIASA. The results of the bilateral meeting are reflected in the new “IT_NEC_2015” scenario where an update in the activity levels and, partially, in the control strategy occurs.
After the technical bilateral meeting the “EU” and “IT” baseline emission scenarios got closer especially for NOX and NH3, even if some discrepancies still remain especially for PM2.5 estimates.
In the European scenario a higher and quicker technological renewal for biomass fired domestic equipments has been hypothesized, resulting in lower PM2.5 and NMVOC emissions for the year 2030.
30
Fig. 26 – SO2 emission (kt/y) scenario comparison among the European scenarios for Italy and the two different revisions of the national reference emission scenario.
Fig. 27 – NOX emission (kt/y) scenario comparison among the European scenarios for Italy and the two different revisions of the national reference emission scenario.
31
Fig. 28 – PM2.5 emission (kt/y) scenario comparison among the European scenarios for Italy and the two different revisions of the national reference emission scenario.
Fig. 29 – NMVOC emission (kt/y) scenario comparison among the European scenarios for Italy and two different revisions of the national reference emission scenario.
32
Fig. 30 – NH3 emission (kt/y) scenario comparison among the European scenarios for Italy and the two different revisions of the national reference emission scenario.
In table 3 a comparison of the emission reduction commitments between the Annex II Directive proposal of January 2015 and the new national proposal of July 2015 has been reported. Apart from SO2, the two proposals highly diverge especially for PM2.5 and NH3, so other bilateral meetings
took place between the Commission and the Italian national experts. Those meetings were a good chance to explain the remaining differences in data and to exchange additional information that almost closed the gap between the two proposals. In order to reach an agreement among the majority of the Member States in the Council, the overall ambition level had been lowered and some of the targets for the different Member States were changed. For Italy the new emission reduction commitments, agreed in the COREPER (Committee of the Permanent Representatives of the Governments of the Member States to the European Union) meeting on 29 June 2016, are reported in table 3.
Table 3 – Emission reduction commitments for Italy in the Annex II of the NEC Directive Commission Proposal of January 2015 (Amann et al., 2015), the Italian Proposal in July 2015 and the proposal voted in the COREPER meeting on
29 June 2016.
Pollutant COMM Proposal Jan 15 Italy Proposal Jul 15 COREPER Jun 16 SO2 -71% -71% -71% NOX -68% -60% -65% PM2.5 -54% -21% -40% NMVOC -49% -38% -46% NH3 -22% -12% -16%
33
The emissions reduction commitments presented in the Commission proposal were estimated to achieve a 52% reduction of negative health impacts between 2005 and 2030 (measured as a reduction of premature deaths caused by air pollution), while the targets agreed in the COREPER meeting of June 2016 lowered the ambition level to 49.6%.
To compare the ambition levels of the different proposals, the PM-equivalent (PMeq) approach had been used. The idea behind the PMeq is that, similar to the case of CO2 equivalents in the greenhouse
Kyoto mechanism, the five precursor emissions of fine particulate matter, i.e., primary PM2.5, SO2,
NOX, NH3 and NMVOC, can be converted into PM‐equivalent emission quantities, using the
appropriate weighting factors (Amann and Wagner, 2014). Although this approach has been accepted by almost all Member States as a flexibility mechanism and introduced in the Directive, it is of the utmost importance to underline the differences between PMeq and CO2eq.
For greenhouse gases a unique effect is taken into account, measured by the Global Warming Potential (GWP), i.e. an index, based on radiative properties of greenhouse gases, measuring the radiative forcing following a pulse emission of a unit mass of a given greenhouse gas in the present-day atmosphere integrated over a chosen time horizon, relative to that of carbon dioxide. The GWP represents the combined effect of the differing times these gases remain in the atmosphere and their relative effectiveness in causing radiative forcing. The Kyoto Protocol is based on GWPs from pulse emissions over a 100-year time frame. The GWP is not influenced by where and when the emissions occur. In contrast to long‐lived greenhouse gases, for which the location of emission reductions does not affect their impact on global climate, the effects of air pollutants are highly site‐specific, since they are strictly linked to chemical and physical characteristics of the atmosphere that may change in few kilometres. As a consequence the presence of different pollutants, the meteorology, the population distribution and the ecosystem vulnerability can lead to very different effects.
For these reasons using unique weighting factors for all EU Member States can be profitable for the negotiation, but it should be clear that it is a mere mathematical expedient which can hardly be used to predict health effects of air pollution in the real world.
The weighting factors used for the PMeq calculation are reported in table 4.
Table 4 – PM-equivalent weighting factors used for the NECD negotiations (Amann and Wagner, 2014)
Pollutant Weighting factor
SO2 0.298
NOX 0.067
PM2.5 1.000
NMVOC 0.009
NH3 0.194
In table 5 for all the Member States, the 2005 SO2, NOX, NMVOC, PM2.5 and NH3 emissions of the
last inventory submission (CLRTAP, 2016) and the January 2015 and June 2016 Annex II proposals of the new NECD are summarized.
3 4 T a b le 5 – C o m p a ri so n o f th e re d u ct io n c o m m it m e n ts a t th e y ea r 2 0 3 0 w it h r e sp e ct t o t h e b a se y ea r 2 0 0 5 b et we e n t h e NECD Co m m is si o n p ro p o sa l o f Ja n u a ry 2 0 1 5 a n d t h e NECD a g re e d d u ri n g t h e CORE P ER m e et in g o f Ju n e 2 0 1 6 i n t er m s o f to ta l a m b it io n l ev el , ta rg et a n d P M eq f o r ea c h M em b e r S ta te s. YEA R 2 0 0 5 – CLRTAP S UBM IS S IO N 2 0 1 6 CO M M IS S IO N TS A P1 6 – 2 0 3 0 ta r g e ts CO REPER J u n 2 0 1 6 – 2 0 3 0 ta r g e ts Di ffe r e n c e s in PM e q k to n (5 2 % a m b it io n l e v e l) (4 9 .6 % a m b it io n l e v e l) M e m b e r S ta te S O2 NO x PM 2 .5 NM V O C NH 3 PM e q S O2 NO x PM 2 .5 NM V O C NH 3 PM e q S O2 NO x PM 2 .5 NM V O C NH 3 PM e q Au str ia 2 7 2 2 9 2 2 1 3 5 6 6 5 9 -4 1 % -7 1 % -4 9 % -4 0 % -1 8 % -4 6 .9 0 % -4 1 % -6 9 % -4 6 % -3 6 % -1 2 % -4 3 .7 2 % -3 .1 7 % Be lg iu m 1 4 3 3 0 5 3 6 1 4 8 6 9 1 1 4 -6 6 % -5 9 % -4 1 % -3 5 % -1 3 % -5 0 .3 0 % -6 6 % -5 9 % -3 9 % -3 5 % -1 3 % -4 9 .5 8 % -0 .6 7 % Bu lg a r ia 7 7 9 1 8 5 2 8 8 6 4 7 2 8 3 -9 3 % -6 3 % -6 6 % -6 9 % -1 8 % -8 6 .5 0 % -8 8 % -5 8 % -4 1 % -4 2 % -1 2 % -7 9 .3 7 % -7 .1 1 % Cr o a ti a 5 8 7 9 1 5 7 6 3 5 4 5 -8 6 % -6 2 % -6 2 % -5 0 % -2 3 % -6 3 .9 0 % -8 3 % -5 7 % -5 5 % -4 8 % -2 5 % -6 1 .4 0 % -2 .5 2 % Cy p r u s 3 8 2 1 3 1 1 6 1 7 -9 5 % -7 0 % -7 8 % -5 0 % -2 1 % -8 4 .7 0 % -9 3 % -5 5 % -7 0 % -5 0 % -2 0 % -8 0 .8 1 % -3 .8 9 % Cz e c h Re p u b li c 2 0 8 2 7 9 3 5 2 0 9 7 4 1 3 2 -7 3 % -6 4 % -5 0 % -5 0 % -3 8 % -6 1 .5 0 % -6 6 % -6 4 % -6 0 % -5 0 % -2 2 % -5 9 .0 8 % -2 .4 0 % De n m a r k 2 6 1 8 8 2 9 1 1 2 8 9 6 7 -6 2 % -6 6 % -5 6 % -4 9 % -3 2 % -5 2 .4 0 % -5 9 % -6 8 % -5 5 % -3 7 % -2 4 % -4 9 .6 8 % -2 .7 0 % Es to n ia 7 6 4 0 1 4 2 8 1 1 4 2 -7 2 % -4 6 % -4 1 % -2 8 % -1 % -5 4 .2 0 % -6 8 % -3 0 % -4 1 % -2 8 % -1 % -5 2 .9 1 % -1 .3 2 % Fi n la n d 6 9 1 8 7 3 5 1 3 4 3 9 7 7 -3 4 % -4 7 % -3 4 % -4 8 % -1 5 % -3 4 .3 0 % -3 4 % -4 7 % -3 4 % -4 8 % -2 0 % -3 4 .9 5 % 0 .6 9 % Fr a n c e 4 6 7 1 4 2 9 2 5 5 1 1 8 9 6 8 6 6 3 3 -7 7 % -6 9 % -5 6 % -5 2 % -2 3 % -5 5 .2 0 % -7 7 % -6 9 % -5 7 % -5 2 % -1 3 % -5 3 .8 9 % -1 .3 4 % G e r m a n y 4 7 4 1 4 5 8 1 3 1 1 1 3 5 6 7 8 5 1 1 -5 7 % -6 4 % -4 2 % -3 5 % -3 8 % -4 9 .3 0 % -5 8 % -6 5 % -4 3 % -2 8 % -2 9 % -4 7 .4 4 % -1 .9 0 % G r e e c e 5 4 1 4 1 7 6 1 2 2 0 6 8 2 6 5 -9 2 % -6 9 % -7 1 % -6 4 % -3 1 % -8 4 .7 0 % -8 8 % -5 5 % -5 0 % -6 2 % -1 0 % -7 1 .7 8 % -1 2 .8 9 % H u n g a r y 4 1 1 5 6 2 7 1 2 3 8 9 6 8 -7 3 % -6 6 % -6 4 % -5 8 % -4 3 % -6 0 .6 0 % -7 3 % -6 6 % -5 5 % -5 8 % -3 2 % -5 4 .1 8 % -6 .4 3 % Ir e la n d 7 4 1 3 6 1 9 6 2 1 1 0 7 2 -8 2 % -7 1 % -3 9 % -3 2 % -1 0 % -4 7 .2 0 % -8 5 % -6 9 % -4 1 % -3 2 % -5 % -4 7 .2 3 % 0 .0 6 % Ita ly 4 0 7 1 2 2 3 1 6 5 1 2 8 1 4 2 1 4 6 1 -7 1 % -6 8 % -5 4 % -4 9 % -2 2 % -5 5 .3 0 % -7 1 % -6 5 % -4 0 % -4 6 % -1 6 % -4 8 .4 8 % -6 .7 9 % La tv ia 9 4 2 2 3 5 6 1 7 3 2 -4 2 % -4 1 % -4 6 % -4 2 % -3 % -4 2 .1 0 % -4 6 % -3 4 % -4 3 % -3 8 % -1 % -3 8 .1 3 % -3 .9 3 % Li th u a n ia 3 2 5 4 1 9 7 0 4 5 4 1 -6 5 % -5 1 % -4 8 % -4 7 % -2 % -4 2 .4 0 % -6 0 % -5 1 % -3 6 % -4 7 % -1 0 % -3 7 .5 1 % -4 .9 3 % Lu x e m b o u r g 2 5 8 3 1 3 6 9 -4 5 % -8 5 % -4 3 % -4 9 % -2 4 % -6 0 .4 0 % -5 0 % -8 3 % -4 0 % -4 2 % -2 2 % -5 7 .2 4 % -3 .1 3 % M a lta 1 1 9 1 3 2 6 -9 5 % -7 9 % -7 6 % -2 7 % -2 4 % -8 4 .5 0 % -9 5 % -7 9 % -5 0 % -2 7 % -2 4 % -7 8 .4 0 % -6 .1 4 % Ne th e r la n d s 6 4 3 6 7 2 1 1 8 0 1 6 0 9 8 -5 8 % -6 1 % -4 0 % -2 2 % -2 1 % -4 2 .2 0 % -5 3 % -6 1 % -4 5 % -1 5 % -2 1 % -4 2 .4 7 % 0 .2 7 % Po la n d 1 2 4 6 8 4 2 1 6 5 5 8 4 2 7 4 6 5 2 -7 7 % -5 1 % -4 6 % -5 5 % -2 2 % -6 2 .0 0 % -7 0 % -3 9 % -5 8 % -2 6 % -1 7 % -5 9 .6 0 % -2 .4 1 % Po r tu g a l 1 7 7 2 5 5 5 7 2 1 2 5 0 1 3 8 -8 3 % -6 1 % -6 8 % -4 4 % -1 9 % -6 9 .1 0 % -8 3 % -6 3 % -5 3 % -3 8 % -1 5 % -6 2 .7 5 % -6 .3 9 % Ro m a n ia 6 0 1 3 1 6 1 1 5 2 9 9 2 0 5 3 5 8 -9 2 % -6 2 % -6 9 % -6 7 % -2 8 % -7 5 .5 0 % -8 8 % -6 0 % -5 8 % -4 5 % -2 5 % -6 9 .4 0 % -6 .1 3 % S lo v a k ia 8 9 1 0 2 3 9 1 0 8 4 3 8 2 -8 2 % -4 8 % -6 3 % -3 2 % -4 3 % -6 6 .5 0 % -8 2 % -5 0 % -4 9 % -3 2 % -3 0 % -5 7 .6 2 % -8 .9 1 % S lo v e n ia 4 1 5 0 1 3 4 1 2 1 3 3 -8 8 % -6 5 % -7 6 % -5 9 % -2 6 % -7 3 .3 0 % -9 2 % -6 5 % -6 0 % -5 3 % -1 5 % -6 6 .7 4 % -6 .5 5 % S p a in 1 2 5 5 1 3 1 0 9 4 8 0 7 3 8 3 6 3 7 -8 7 % -6 6 % -6 2 % -3 9 % -2 1 % -7 2 .3 0 % -8 8 % -6 2 % -5 0 % -3 9 % -1 6 % -6 9 .8 8 % -2 .4 4 % S w e d e n 3 6 1 7 1 2 6 1 9 0 5 7 6 1 -1 4 % -6 6 % -1 7 % -3 9 % -1 7 % -2 6 .5 0 % -2 2 % -6 6 % -1 9 % -3 6 % -1 7 % -2 8 .4 0 % 1 .8 8 % Un ite d K in g d o m 7 1 1 1 6 1 7 1 0 8 1 0 3 6 3 0 7 4 9 7 -8 9 % -7 4 % -5 3 % -3 9 % -2 4 % -6 9 .6 0 % -8 8 % -7 3 % -4 6 % -3 9 % -1 6 % -6 6 .0 6 % -3 .5 1 % EU 7 7 0 2 1 1 5 2 4 1 5 6 0 8 5 4 8 4 0 5 5 5 4 9 0 -8 1 % -6 5 % -5 4 % -4 6 % -2 5 % -6 2 .7 0 % -7 9 % -6 3 % -4 9 % -4 0 % -1 9 % -5 9 .0 8 % -3 .6 0 % (1 ) F o r th e p u rp o se o f c o m p ly in g w it h t h e N ECD re d u ct io n c o m m it m e n ts , N Ox a n d NM V O C e m is si o n s fr o m a ct iv it ie s fa ll in g u n d e r th e N o m e n cl a tu re fo r th e R e p o rt in g a s p ro v id e d b y t h e LRT AP C o n v en ti o n (N F R) (2 0 1 4 ) ca te g o ri e s 3 B ( m a n u re m a n a g e m e n t) a n d 3 D (a g ri cu lt u ra l so il s) h a v e b ee n s u b tra c te d i n t h e p re se n t ta b le .
35
As highlighted in table 5, among the six biggest European emitters (France, Germany, Spain, United Kingdom, Italy and Poland), a lower PM2.5 emission target has been agreed for Italy since a revision of the national statistics on biomass consumption had been carried out in 2015. Moreover, during the bilateral meetings, the hypotheses on biomass consumption future trends and renewal rate of household equipment of the European model were corrected so that the PM2.5 target had been revised to a more realistic level. A model that reflects national characteristics and data and that is comparable with the European one has allowed Italy to negotiate ambitious but realistic targets. In table 6 the emission reduction commitments, with respect to the base year 2005, of the amended Gothenburg Protocol for the year 2020 and agreed in the last version of the new NEC Directive proposal for the year 2030 (COREPER meeting of June 2016) are compared with the emission reductions projected in the last national reference emission scenario illustrated in chapter 3.
Table 6 - Comparison between the latest national emission reductions and the amended Gothenburg Protocol reduction commitments for the year 2020 and the last NEC Revision Proposal of June 2016 for the year 2030 with respect to the
base year 2005.
Pollutant Gothenburg Protocol emission reduction commitments for 2020 with respect to the base year 2005
National reference scenario 2005-2020
NEC Revision Proposal of June 2016 for 2030 with respect to the base
year 2005 National reference scenario 2005-2030 SO2 -35% -64% -71% -74% NOX -40% -44% -65% -64% PM2.5 -10% -17% -40% -30% NMVOC -35% -35% -46% -43% NH3 -5% -7% -16% -12%
As shown in table 6 and according to the last projections, the 2020 Gothenburg ceilings should be reached with the reference scenario while additional efforts and policies should be put in place in order to reach the 2030 NEC ceilings especially for PM2.5 and NH3.
36
5
SENSITIVITY ANALYSES
Models used to calculate future emissions need input data on many different parameters going, for example, from detailed fuel consumption in industrial sector to the fleet composition and turn-over of road vehicles. Moreover, many assumptions are needed when thinking about future years, especially when the effectiveness of the EU policies is involved and when Member States have some flexibilities in applying them. In order to define effective emission reduction targets and cost efficient measures, it is essential to take into consideration the most important national specificities, as the contribution of the different sectors to the national emissions and their emission reduction potential, and the interaction with other policies, especially on climate change and energy. Many of these data are the output of other models and the emission projections may change greatly depending on the assumptions made on the future trends of all the parameters involved. We should keep in mind that scenarios are tools for analyzing plausible alternative future trajectories in a complex system in which there is considerable uncertainty of outcomes when determining future developments (Schweizer and Kurniawan, 2016). Scenarios can provide scientifically defensible narratives that describe future developments based on major driving forces and their impacts, they are not forecasts. For this reason, sensitivity analyses made at national level are unavoidable in order to define the additional reduction needed and the most efficient measure that should be put in place to reach the emission reduction commitments.
5.1 Wood combustion in the domestic sector
The role played by the emissions generated by biomass combustion is increasing in recent years. According to national statistics, people are using more and more biomass as integration or substitution of natural gas and LPG for heating because of rising fossil fuel prices and due to climate change mitigation policies (Denier van der Gon et al., 2015). The used equipment are sometimes obsolete and in many cases old open fireplaces are still used. Moreover, the life-time of these kind of equipment is quite long and in general the older equipment are simpler and last longer.
New kind of equipment are now being sold and pellet use is increasing even if fuel wood still covers most of the biomass demand, since wood and wood fired appliances are quite cheaper. In the forthcoming years the effects of the implementation of the Ecodesign Directive (EC, 2009; COM, 2015) together with the policies and measures put in place by the Italian central and regional authorities will influence the emissions of this peculiar sector.
For this reason, a sensitivity analysis has been carried out considering the average life-time period of the equipment (that can be influenced for example by incentive programs), the role of open fire-places (that can be limited by local authorities) and the amount of pellet used. In fig. 31 the PM2.5 emissions achieved in 2030 in different hypotheses are shown.
37
Fig. 31 – PM2.5 emission (kt/y) comparison in 2030 in three different hypotheses: the new reference, the low and high pellet consumption scenarios.
38
In the “low pellet consumption” scenario, pellet is kept at 15% of the total residential wood combustion, while in the “high pellet consumption” scenario pellet accounts for the 50%. In the reference scenario, pellet consumption rises from 15% in 2015 to 33% in 2030.
Obviously, PM2.5 emissions are not influenced only by the amount of wood fired for residential heating, but also by the renewal rate of the equipment, so it is important to formulate different hypotheses on all the factors and evaluate their impact on PM2.5 national total emissions. In fig. 32, 2030 national emission reductions with respect to the base year 2005 are compared with the target proposed for Italy in the Annex II of the new NEC directive (-40%, violet line) and with the new national reference emission scenario (-30%, red line). The figure shows that the success of the Ecodesign standards is fundamental to reach the target, but further action are needed. Each point that falls inside the violet fence shows a possible mix of condition that can be satisfied to successfully reduce the emissions. For example, if no action on open fireplaces are taken and pellet consumption does not increase, the only way to reduce emissions beyond 40% will be to double the renewal rate of the appliances; on the other hand, if pellet consumption substitutes fuelwood consumption, the renewal is sustained by incentive programs and open fireplaces are in line with Ecodesign standards or banned, the total PM2.5 national emissions will drop by more than 55%.
Fig. 32 – PM2.5 national total emission reduction (%) comparison for the year 2030.
5.2 The agricultural scenario
Looking at the emission time series of the NEC pollutants, ammonia shows the lower decrease. Since agriculture is the foremost responsible of ammonia emissions (roughly more than 90%) and in the
39
present national reference scenario the reduction is not in line with the targets, new policies have to be put in place. The main sources of NH3 emissions at national level are urea (widely used as
fertilizer) and livestock, especially cattle.
Urea can be replaced by other fertilizers with lower ammonia emission factors, but often these fertilizer are not welcomed by farmers because of their higher prices and of different agricultural practice. In some cases new fertilizers reduce the emission into air but increase the contamination of superficial and ground waters. For these reasons, in the sensitivity analysis the measure considered for the urea-based fertilizers is the incorporation. The Guidance document on preventing and abating ammonia emissions from agricultural sources (ECE, 2014), approved by the Executive Body as one of the document of the amended Gothenburg Protocol, estimates an ammonia emission reduction of 50%- 80% whose efficiency is influenced especially by the soil texture, the delay of the injection after fertilizer application or the injection depth. In the present analysis, we have considered the minimum (50%) and maximum (80%) possible emission reduction.
Regarding livestock, pig and poultry farms are in part already covered by the Industrial Emission Directive (EC, 2010), while it seems quite hard to act on emissions coming from cattle because of the peculiar characteristics of this farming activities. In recent years, for different reasons, livestock feeding strategies are growing and especially the low-protein animal feeding is now one of the most cost-effective and strategic ways of reducing NH3 emissions (ECE, 2014).
In the present sensitivity analysis, different hypotheses on urea incorporation and low N diet have been formulated and their effect on ammonia emissions has been evaluated. The results are shown in fig. 33.
Fig. 33 – NH3 national total emission reduction in the year 2030 with respect to the base year 2005 in different scenario hypotheses regarding low N feeding and urea incorporation and comparison with the reference scenario reduction (-12%,