© The Author(s) 2018. Published by Oxford University Press on behalf of the Maryland Psychiatric Research Center. All rights reserved. For permissions, please email: [email protected]
Cross-cultural Validation of the 5-Factor Structure of Negative Symptoms in
Schizophrenia
Anthony O. Ahmed*,1, Brian Kirkpatrick2, Silvana Galderisi3, Armida Mucci3, Alessandro Rossi4,
Alessandro Bertolino5, Paola Rocca6, Mario Maj3, Stefan Kaiser7, Martin Bischof8, Matthias N. Hartmann-Riemer8, Matthias Kirschner8, Karoline Schneider8, Maria Paz Garcia-Portilla9,10, Anna Mane10–12, Miguel Bernardo10,13–15, Emilio Fernandez-Egea10,14,16,17, Cui Jiefeng18, Yao Jing18, Tan Shuping18, James M. Gold19, Daniel N. Allen20, and Gregory P. Strauss21
1Department of Psychiatry, Weill Cornell Medicine, 21 Bloomingdale Road, White Plains, NY 10605; 2Department of Psychiatry and
Behavioral Sciences, University of Nevada, Reno School of Medicine, Reno, NV; 3Department of Psychiatry, University of Campania
Luigi Vanvitelli, Naples, Italy; 4Department of Biotechnological and Applied Clinical Sciences, Section of Psychiatry, University of
L’Aquila, L’Aquila, Italy; 5Department of Neurological and Psychiatric Sciences, University of Bari, Bari, Italy; 6Department of
Neuroscience, Section of Psychiatry, University of Turin, Turin, Italy; 7Division of Adult Psychiatry, Department of Mental Health
and Psychiatry, Geneva University Hospitals, Geneva, Switzerland; 8Department of Psychiatry, Psychotherapy and Psychosomatics,
Psychiatric Hospital, University of Zurich, Zurich, Switzerland; 9Department of Psychiatry, University of Oviedo, Oviedo, Spain; 10Centro de Investigación Biomédica en Red, Área de Salud Mental (CIBERSAM), Madrid, Spain; 11Institut de Neuropsiquiatria
i Adiccions, Parc de Salut Mar, Barcelona, Spain; 12Fundació IMIM, Barcelona, Spain; 13Barcelona Clinic Schizophrenia Unit,
Neuroscience Institute, Hospital Clinic of Barcelona, Barcelona, Spain; 14Institut d’Investigacions Biomediques August Pi i Sunyer
(IDIBAPS), Barcelona, Spain; 15Psychiatry Unit, Department of Medicine, University of Barcelona, Barcelona, Spain; 16Department
of Psychiatry, Behavioural and Clinical Neuroscience Institute, University of Cambridge, Cambridge, UK; 17Clozapine Clinic.
Cambridgeshire and Peterborough NHS Foundation Trust, Cambridge, UK; 18Psychiatry Research Center, Beijing Huilongguan
Hospital, Peking University Huilongguan Clinical College, Beijing, China; 19Department of Psychiatry, University of Maryland School
of Medicine and Maryland Psychiatric Research Center, Baltimore, MD; 20Department of Psychology, University of Nevada, Las Vegas,
Las Vegas, NV; 21Department of Psychology, University of Georgia, Athens, GA
*To whom correspondence should be addressed; tel: 914-997-5251, fax: 914-682-6906, e-mail: [email protected] Objective: Negative symptoms are currently viewed as
having a 2-dimensional structure, with factors reflecting diminished expression (EXP) and motivation and pleasure (MAP). However, several factor-analytic studies suggest that the consensus around a 2-dimensional model is pre-mature. The current study investigated and cross-culturally validated the factorial structure of BNSS-rated nega-tive symptoms across a range of cultures and languages.
Method: Participants included individuals diagnosed with
a psychotic disorder who had been rated on the Brief Negative Symptom Scale (BNSS) from 5 cross-cultural samples, with a total N = 1691. First, exploratory fac-tor analysis was used to extract up to 6 facfac-tors from the data. Next, confirmatory factor analysis evaluated the fit of 5 models: (1) a 1-factor model, 2) a 2-factor model with factors of MAP and EXP, 3) a 3-factor model with inner world, external, and alogia factors; 4) a 5-factor model with separate factors for blunted affect, alogia, anhedonia, avolition, and asociality, and 5) a hierarchical model with 2 second-order factors reflecting EXP and MAP, as well as 5 first-order factors reflecting the 5 aforementioned domains.
Results: Models with 4 factors or less were mediocre fits
to the data. The 5-factor, 6-factor, and the hierarchical second-order 5-factor models provided excellent fit with an edge to the 5-factor model. The 5-factor structure dem-onstrated invariance across study samples. Conclusions: Findings support the validity of the 5-factor structure of BNSS-rated negative symptoms across diverse cultures and languages. These findings have important implications for the diagnosis, assessment, and treatment of negative symptoms.
Key words: negative symptoms/5 factors/
anhedonia/avolition/asociality/alogia/
blunted affect/Brief Negative Symptoms Scale (BNSS)/ confirmatory factor analysis/exploratory factor analysis Introduction
Early factor-analytic studies indicated that negative symptoms are a domain of psychopathology that is dis-tinct from psychosis and disorganization in individuals with schizophrenia.1–3 These studies relied on
Syndrome Scale (PANSS) and the Brief Psychiatric Rating Scale (BPRS) that assess negative symptoms along with other symptoms of schizophrenia. However, the use of broad-bandwidth measures to adjudge the factor structure of negative symptoms is flawed because covariance patterns in the symptom data cause negative symptom items to aggregate together, making the con-struct arbitrarily unidimensional.
Factor analyses evaluating the structure of negative symptoms with narrow-bandwidth scales—ie, measures of negative symptoms alone, with no items included from other constructs—suggest that the structure of negative symptoms is multidimensional.4 A 2-factor solution has
commonly been reported for a range of narrow-band-width measures, including the Scale for the Assessment of Negative Symptoms (SANS), Schedule for the Deficit Syndrome (SDS), Brief Negative Symptom Scale (BNSS), Clinical Assessment Interview for Negative Symptoms (CAINS), and negative symptom items of the PANSS.5–15
The 2 dimensions reflect: (1) diminished expressivity (EXP), consisting of alogia and blunted affect items and (2) motivation and pleasure (MAP), consisting of avoli-tion, asociality, and anhedonia.5–12 These findings have led
the field to widely accept the 2-dimensional structure of negative symptoms.4 This 2-dimensional model has been
very influential, impacting important decisions, such as how negative symptoms are described in the DSM-5, how treatment targets are defined, how scales are scored for statistical analysis, and how studies search for pathophys-iological mechanisms.13
However, the 2-dimensional conceptualization of neg-ative symptoms may be statistically or theoretically insuf-ficient. Support for the 2-dimensional structure comes from studies using exploratory factor analysis (EFA), a data reduction method that infers the presence of latent factors responsible for shared variance among items in a scale.14,15 EFA is limited in that it does not specify an
underlying structure of negative symptoms, but rather assumes that each item in a scale could be related to each underlying latent factor.15 Prior EFA studies were
impor-tant for generating hypothesis about dimensions in neg-ative symptoms. They are not, however, actual tests of the validity of a 2-factor structure and their exploratory nature does not allow direct assessment of their factorial validity relative to competing factor models of negative symptoms.13 Moreover, Garcia-Portilla and colleagues16
using EFA concluded that a 3-factor structure that dis-tinguished inner-world experiences (ie, avolition and blunted affect) from external features (anhedonia and asociality), and alogia was preferable to a 2-factor model. The 3-factor model has yet to be replicated, but it shows that the consensus that 2 factors best describe the multi-dimensionality of negative symptoms is premature.
Confirmatory factor analysis (CFA) is required to test competing models and evaluate the dimensional struc-ture of BNSS-rated negative symptoms. Published CFA
studies have examined the SANS, and were problematic because they included items not part of the negative symptom construct, which limits conclusions that can be drawn.17,18 Axelrod and colleagues19,20 conducted 2 early
CFA studies of negative symptoms measured with the Negative Symptom Assessment (NSA). In the first study of a 26-item NSA, they found that a multidimensional model that included communication, emotion/affect, social involvement, motivation, retardation, and gross cognition as 6 separable factors best described nega-tive symptoms. In the second study, they used a 16-item version of the measure which now excluded items that originally loaded onto the “gross cognition” factor. The authors replicated 5 of the original factors—communica-tion, emotion/affect, social involvement, motivafactors—communica-tion, and retardation. The statistical fit indices obtained in both studies favored their chosen 5 or 6-factor models over 1- to 4-factor solutions. Their chosen models, however, proved to be mediocre fits to the data based on statistical fit indices. Further, both 26- and 16-item versions of the NSA did not include items that assess anhedonia.
The 2005 NIMH-MATRICS consensus conference on negative symptoms sought to establish the scope of negative symptoms to advance the development of evi-dence-based measures and treatments.21 The conference
identified affective flattening, alogia, asociality, avolition, and anhedonia as domains of negative symptoms. These domains subsequently informed the content coverage of the BNSS and the CAINS. Strauss et al (Unpublished data) conducted CFA of 3 current negative symptoms scales, the BNSS (n = 192), CAINS (n = 400), and SANS (n = 268). The study found that with all 3 measures, a 5-factor model consistent with the NIMH-MATRICS domains and a hierarchical 5-factor model with MAP and EXP as second-order factors that influence the 5 tors provided excellent fit and outperformed other fac-tor models. These findings suggest that the recent trend toward conceptualizing negative symptoms in relation to the MAP and EXP does not capture the complexity of negative symptoms.
The current study attempted to determine the correct factorial structure of BNSS-rated negative symptoms using data obtained across a range of cultures and lan-guages. The study took both an empirical exploratory (EFA) and a model-based (CFA) approach to deter-mining the correct factor structure. A model-based approach allowed (1) a comparison of the NIMH con-sensus 5-factor model with alternate models including— the unidimensional/1-factor model, MAP/EXP 2-factor, Garcia-Portilla et al.’s 3-factor model, and the hierarchi-cal 5-factor model; and (2) testing the cross-cultural mea-surement invariance of the correct factor structure using data from 5 samples including N = 1691 participants from Italy, Spain, China, Switzerland, and the United States. The EFA extracting 1–6 factors from the data allowed (1) an examination of the relative viability of several factor
models (eg, 4-factor and 6-factor models) in the absence of guiding theory or a priori evidence; (2) searching for converging evidence of the preferred factor structure from CFA and EFA; (3) an assessment of the preferential loading of BNSS items; and (4) in the absence of guiding theory the loading preference of item 4 “Lack of Normal Distress” in fitted factor models. Although not adjudged as a negative symptom in the 2005 NIMH-MATRICS conference, item 4 “Lack of Normal Distress” was included in the BNSS because of its association with reduced emotional expression and deficit symptoms. In previous studies, item 4 loads with BNSS factors albeit with lower saturation than other items.11 EFA was used to
adjudicate the correct factor location of this item. It was predicted that EFA and CFA will demonstrate prefer-ence for a 5-factor model of BNSS-rated negative symp-toms over alternate models. In concert with Strauss et al (Unpublished data), the 5-factor and hierarchical models were expected to provide excellent fit to the data, with the 5-factor model producing the best fit. It was further predicted that the preferred factor structure would be cross-culturally invariant and produce strong fits in mul-tinational cross-validation samples.
Methods Participants
The data sets used to investigate the factorial structure of negative symptoms in the current study were drawn from several international investigations of the psycho-metric properties of the BNSS and its clinical utility. These included samples obtained from collaborations in Italy (n = 937), Spain (n = 115), China (n = 163), and Switzerland (n = 119) that used versions of the BNSS for-mally translated into Italian, Spanish, Chinese (simpli-fied script), and German, respectively.22–25 The study also
included a USA-based sample (n = 357) obtained with
the original English version.11 Additional sample details
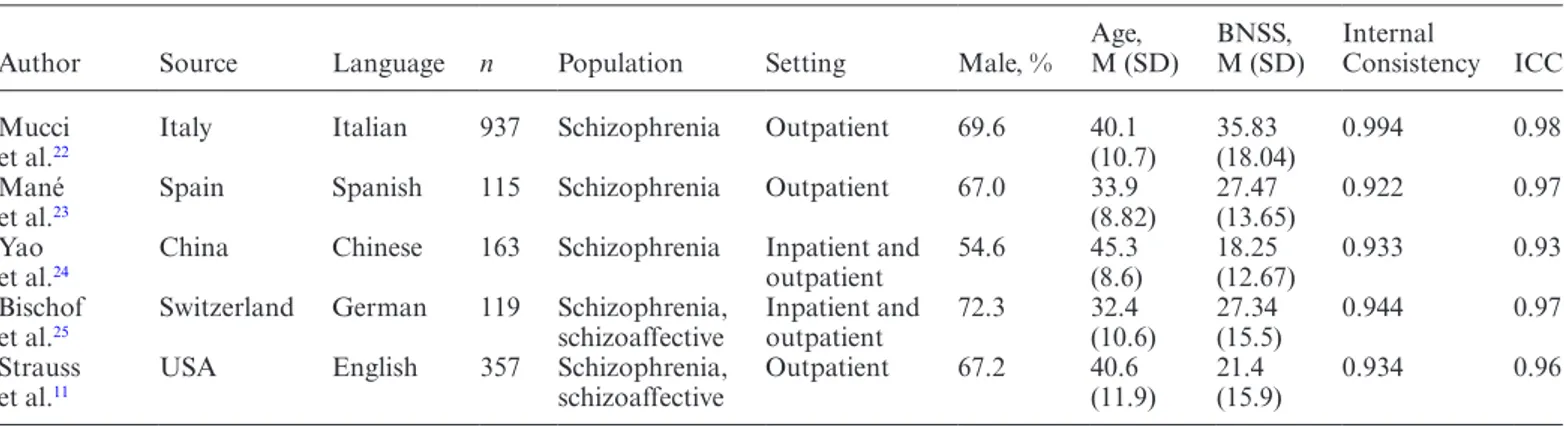
are provided in the supplementary material. Table 1
summarizes the demographic characteristics and clini-cal composition of the study samples. Participants from Italy, Spain, and the United States were evaluated to ensure that they met Diagnostic and Statistical Manual of Mental Disorders (DSM-IV) criteria for schizophre-nia or schizoaffective disorder using the Structured Clinical Interview for DSM-IV (SCID). Swiss partici-pants were adjudged as meeting DSM diagnostic criteria using the Mini-International Neuropsychiatric Interview (MINI). Participants from China were assessed with the International Classification of Diseases and Related Health Problems, Tenth Revision (ICD-10) criteria.
Procedures
Each study administered the BNSS as part of broader research aims to illuminate the phenomenology and treat-ment of negative symptoms. Given that investigators in Italy, Spain, Switzerland, and China administered lated versions of the BNSS, a standard method of trans-lation served to ensure the equivalence of the translated versions to the original English version. First, the BNSS was forward translated to the target language. Next, the translated version was independently back-translated and forwarded to the scale authors (BK and GS), who worked with the translators to reconcile the translation with the original English version.
The inter-rater reliability of the BNSS was established at each site through the use of gold-standard training videos and ratings of face-to-face interviews completed by the BNSS authors. All raters completed BNSS train-ing ustrain-ing standardized traintrain-ing materials and received feedback from completing ratings on gold-standard vid-eos. Raters in each study had at minimum, bachelors-level training, and/or extensive experience completing
Table 1. Characteristics of the Brief Negative Syndrome Scale (BNSS) Study Samples Used in the Analyses
Author Source Language n Population Setting Male, % Age, M (SD) BNSS, M (SD) Internal Consistency ICC Mucci
et al.22 Italy Italian 937 Schizophrenia Outpatient 69.6 40.1 (10.7) 35.83 (18.04) 0.994 0.98
Mané
et al.23 Spain Spanish 115 Schizophrenia Outpatient 67.0 33.9 (8.82) 27.47 (13.65) 0.922 0.97
Yao
et al.24 China Chinese 163 Schizophrenia Inpatient and outpatient 54.6 45.3 (8.6) 18.25 (12.67) 0.933 0.93
Bischof
et al.25 Switzerland German 119 Schizophrenia, schizoaffective Inpatient and outpatient 72.3 32.4 (10.6) 27.34 (15.5) 0.944 0.97
Strauss
et al.11 USA English 357 Schizophrenia, schizoaffective Outpatient 67.2 40.6 (11.9) 21.4 (15.9) 0.934 0.96 Note: ICC: intraclass correlation coefficient. Internal consistency values are Cronbach’s alpha estimates. When a scale has more than
5 response categories, Cronbach’s alpha produces robust estimates of internal consistency comparable to other methods of computing internal consistency for categorical outcomes such as ordinal alpha or McDonald’s alpha.
psychiatric interviews. BNSS raters in each parent study met minimum standards of inter-rater reliability with intraclass correlation coefficients that exceed 0.90
(table 1).
Data Analysis
The overall analytic strategy was to establish the factor structure of BNSS-rated negative symptoms in a calibra-tion sample and then cross-validate the established factor structure across languages and cultures. Rather than test all factor models in every study sample, the decision was made to first estimate alternate factor models in a cali-bration sample and then cross-validate best fit models to: (1) decrease the number of separate factor models that would need to be estimated; and (2) decrease the likeli-hood that models with apparent fit in one sample but had capitalized on chance (type I error) are interpreted. The calibration sample included 566 cases (60.4%) drawn ran-domly from the largest study sample, the Italian dataset. The remaining 371 cases in the Italian dataset were des-ignated as 1 of the 5 cross-validation samples; therefore, each language and data source served in the cross-valida-tion of the preferred factor structure.
To examine the fits of evaluated models, BNSS ratings were factor analyzed with model estimation methods that are robust to distributional non-normality in BNSS ratings. EFA models ranging from 1 to 6 classes were esti-mated first excluding and then including item 4 “Lack of Normal Distress” to identify the item’s preferred factor location. EFAs were completed with the oblique Quartimin rotation. Unlike previous EFA studies, the preferred factor structure was adjudged by examining
pattern loadings and objective fit indices (discussed below). Next, CFA was used to test competing hypoth-eses about the factor structure of negative symptoms. Five models estimated included a unidimensional/1-factor, MAP/EXP 2-unidimensional/1-factor, Garcia-Portilla et al’s 3-fac-tor, the NIMH consensus 5-fac3-fac-tor, and the hierarchical 5-factor models. Items included on each factor within the 5 models are presented in table 2. The estimators were the weighted least squared estimator with stan-dard errors and mean-and variance adjusted chi-square test (χ2) that use a full-weight matrix (WLSMV), and the maximum likelihood with robust standard errors (MLR). All model estimations were carried out in Mplus Version 5.0.26 Model modification indices were obtained
to assess and evaluate all fixed parameters (eg, specified loading patterns) to determine which fixed parameters if freely estimated would have improved the model being evaluated. By convention, modification indices are used jointly with theory to guide attempts to re-specify poor fitting models.
Several indices served to evaluate the goodness-of-fit of estimated factor models.27–33 These include the χ2 test, the root-mean-square error of approximation (RMSEA), the comparative fit index (CFI), the Tucker–Lewis index (TLI), the standardized root mean squared residual (SRMR), and the weighted root mean squared residual (WRMR), all of which help to access the absolute fit. Information criteria including Akaike information crite-ria (AIC), Bayesian information critecrite-ria (BIC), and the sample-size adjusted BIC (aBIC) are used for comparing the relative fits of alternate models. Models with lower values are preferred. RMSEA values of 0.08 and lower are considered adequate fit. CFI and TLI values of 0.95 Table 2. Confirmatory Factor Analysis Models of the Brief Negative Symptom Scale (BNSS)
BNSS Items and Domains CFA Models
1-Factor 2-Factor 3-Factor 5-Factor 5-Factor Hierarchical
First Order Second Order Anhedonia
1. Intensity of past-week pleasure 1 1 1 1 1 1
2. Frequency of past-week pleasure 1 1 1 1 1 1
3. Intensity of expected pleasure 1 1 1 1 1 1
Asociaility
5. Asociality behavior 1 1 1 2 2 1
6. Asociality internal experience 1 1 1 2 2 1
Avolition
7. Avolition behavior 1 1 2 3 3 1
8. Avoliton internal experience 1 1 2 3 3 1
Blunted affect 9. Facial expression 1 2 2 4 4 2 10. Vocal expression 1 2 2 4 4 2 11. Expressive gestures 1 2 2 4 4 2 Alogia 12. Quality of speech 1 2 3 5 5 2 13. Spontaneous elaboration 1 2 3 5 5 2
and higher are considered indicative of strong fitting models. SRMR values range from 0 to 1 with values of 0.08 or lower indicative of good fitting models. WRMR values of about 1.00 and lower are considered strong fits. Additional details of fit indices are provided in the
supplementary material.
Multi-group CFA was used to assess the measure-ment invariance of the BNSS-preferred factor structure across the multi-national samples. This comprised tests of configural, metric, scalar, and residual invariance that are conducted sequentially.34,35 Configural invariance
requires that items load on the same factor across sub-samples. Metric invariance requires that factor loadings be equivalent across the multi-national samples. Scalar invariance requires that both factor loadings and inter-cepts are equivalent across study samples. Residual fac-torial invariance adds an additional constraint requiring that residual variances are equal across samples. Changes in chi-square (χ2 diff), CFI, TLI, and RMSEA estimates as constraints were imposed on the model were used to evaluate the invariance models. CFI change has the most empirical support and values not exceeding 0.01 pro-vide epro-vidence that constraints imposed on model are tenable.34–36
Results
The study aims were addressed in 3 stages. First, EFA was used to extract up to 6 factors from the BNSS using the calibration sample. Two sets of EFAs were completed at this stage—BNSS ratings first excluding, and then includ-ing item 4 “Lack of Normal Distress.” Next, model-based CFAs were used to compare the relative fits of the 1-, 2-,
3-, 5-factor, and hierarchical models in the calibration sample. The favored factor models were tested in each of the 5 cross-validation samples. Finally, measurement invariance of the preferred factor structure across study samples was sequentially evaluated for metric, scalar, and residual invariance.
Table 1 summarizes the characteristics of the study
samples. Cronbach’s alpha exceeded 0.90 in every study sample, suggesting that raters were able to reliable assess negative symptoms with the BNSS regardless of the lan-guage of administration or participants’ country of ori-gin. Save for one participant in the Italian sample who was subsequently excluded from the analysis due to miss-ing data, complete ratmiss-ings were obtained for all BNSS items in all of the study samples. The variability in BNSS total score across samples likely reflects the illness acuity of participants recruited in the particular parent study.
EFA of the BNSS Calibration Sample
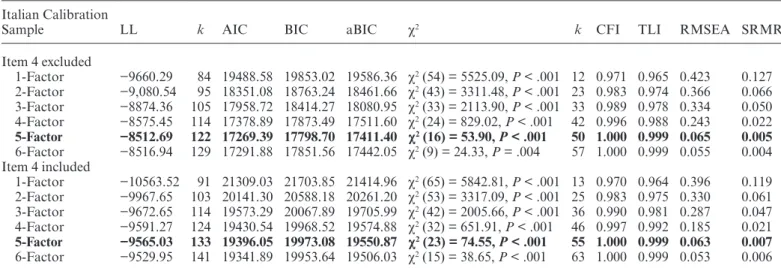
The results of EFA runs in the calibration sample are summarized in table 3. Although CFI and TLI estimates were acceptable for 1 through 4-factor models, high RMSEA estimates suggested that these were mediocre fits to the data. With or without item 4, the EFA 5-fac-tor and 6-fac5-fac-tor models were strong fits to the data with CFI, TLI, RMSEA, and SRMR that fell in the excellent-fit range. Without item 4, the AIC and other information criteria favored a 5-factor model over the 6-factor model. Moreover, the 6-factor solution produced 2 factors with single items.
With item 4 included in the model, the information cri-teria slightly preferred the 6-factor solution. Subsequent Table 3. Model Fit Results of the Exploratory Factor Analysis of BNSS Items
Italian Calibration
Sample LL k AIC BIC aBIC χ2 k CFI TLI RMSEA SRMR
Item 4 excluded 1-Factor −9660.29 84 19488.58 19853.02 19586.36 χ2 (54) = 5525.09, P < .001 12 0.971 0.965 0.423 0.127 2-Factor −9,080.54 95 18351.08 18763.24 18461.66 χ2 (43) = 3311.48, P < .001 23 0.983 0.974 0.366 0.066 3-Factor −8874.36 105 17958.72 18414.27 18080.95 χ2 (33) = 2113.90, P < .001 33 0.989 0.978 0.334 0.050 4-Factor −8575.45 114 17378.89 17873.49 17511.60 χ2 (24) = 829.02, P < .001 42 0.996 0.988 0.243 0.022 5-Factor −8512.69 122 17269.39 17798.70 17411.40 χ2 (16) = 53.90, P < .001 50 1.000 0.999 0.065 0.005 6-Factor −8516.94 129 17291.88 17851.56 17442.05 χ2 (9) = 24.33, P = .004 57 1.000 0.999 0.055 0.004 Item 4 included 1-Factor −10563.52 91 21309.03 21703.85 21414.96 χ2 (65) = 5842.81, P < .001 13 0.970 0.964 0.396 0.119 2-Factor −9967.65 103 20141.30 20588.18 20261.20 χ2 (53) = 3317.09, P < .001 25 0.983 0.975 0.330 0.061 3-Factor −9672.65 114 19573.29 20067.89 19705.99 χ2 (42) = 2005.66, P < .001 36 0.990 0.981 0.287 0.047 4-Factor −9591.27 124 19430.54 19968.52 19574.88 χ2 (32) = 651.91, P < .001 46 0.997 0.992 0.185 0.021 5-Factor −9565.03 133 19396.05 19973.08 19550.87 χ2 (23) = 74.55, P < .001 55 1.000 0.999 0.063 0.007 6-Factor −9529.95 141 19341.89 19953.64 19506.03 χ2 (15) = 38.65, P < .001 63 1.000 0.999 0.053 0.006
Note: LL, loglikelihood; k, number of free parameters; AIC, Akaike information criterion; BIC, Bayesian information criterion; aBIC,
sample size adjusted BIC; CFI, comparative fit index; TLI, Tucker–Lewis index; RMSEA, root mean square error of approximation; SRMR, standardized root mean square residual; WRMR = weighted root mean square residual. The preferred factor models are presented in bold. Both weighted least square (WLSMV) and maximum likelihood (MLR) estimators were used in the analyses. Chi-square for the baseline EFA model with item 4 excluded:
examination of the matrix of rotated loadings of the 6-factor solution showed that all BNSS items including item 4 weakly loaded on the sixth factor with all loading coefficients less than an absolute value of 0.11. This sug-gests that a sixth factor contributes little to explaining the pattern of covariances of BNSS items and the 6-factor solution should be rejected in favor of the more parsimo-nious 5-factor model.
The rotated 5-factor matrices for all factor solutions are presented in supplementary tables S1–S12. Item 4 cross-loaded onto 2 BNSS factors—anhedonia and asociality.
CFA of the BNSS-Rated Negative Symptoms in the Calibration Sample
The results of the CFAs conducted in the calibration sample are summarized in table 4. All CFA models excluded item 4 given that it was not a recognized neg-ative symptom in the NIMH-MATRICS conference. The 1-factor, 2-factor, and the 3-factor models proved to be mediocre fits to the data. The 1-factor models were a poor fit due to mediocre CFI, RMSEA, and WRMR values. Although the CFI and the TLI for the 2-factor and 3-factor models exceeded the 0.95 threshold, both were poor fits to the data based on high RMSEA and WRMR values.
The 5-factor and the hierarchical models produced CFI and TLI values that suggest strong fit to the data. The RMSEA values for both factor models just fell under the 0.08 threshold, suggesting adequate fits to the data. Both the 5-factor and hierarchical models also produced WRMR estimates that fell below 1.00, suggesting strong fits to the data.
The AIC and other information criteria favored the 5-factor model and the hierarchical model over the 1-, 2-, and 3-factor models. The information criteria slightly favored the 5-factor model over the hierarchical model.
Cross-validation in Multi-National Samples
Given their strong performance in the calibration sample, we tested both the 5-factor and hierarchical models in cross-validation samples. Table 4 summarizes the results of cross-validating the BNSS 5-factor and the hierar-chical models. Both factor models proved to be strong fits to the data based on CFI and TLI estimates that far exceeded the 0.95 threshold in each sample. Across sam-ples, the RMSEAs frequently fell below the 0.08 thresh-old that would suggest an adequate fit. The exceptions were the 5-factor models in the Chinese and American sample and the hierarchical model in the Chinese sample. Table 4. Confirmatory Factor Analysis of BNSS Items: Model Fit Results
LL k AIC BIC aBIC χ2 CFI TLI RMSEA WRMR
Italian calibration sample
1-Factor −9659.56 84 19487.13 19851.57 19584.91 χ2 (8) = 818.89, P < .001 0.944 0.965 0.423 4.727
2-Factor −9188.17 85 18546.35 18915.13 18645.29 χ2 (13) = 660.10, P < .001 0.955 0.983 0.297 2.924
3-Factor −9051.64 87 18277.27 18654.73 18378.54 χ2 (11) = 548.36, P < .001 0.963 0.983 0.294 2.734
5-Factor −8715.77 94 17619.54 18027.36 17728.96 χ2 (19) = 77.43, P < .001 0.996 0.999 0.074 0.487
2nd-Order 5-factor −8909.74 86 17991.48 18364.60 18091.59 χ2 (15) = 93.26, P < .001 0.995 0.998 0.080 0.878
Cross validation samples 5-Factor model Italian sample −5801.92 107 11817.86 12236.89 11897.42 χ2 (18) = 50.49, P = .001 0.997 0.999 0.070 0.399 American sample −5222.13 94 10632.25 10996.76 10698.55 χ2 (19) = 105.47, P = .000 0.989 0.995 0.110 0.709 Spanish sample −2162.97 91 4507.94 4779.45 4491.48 χ2 (19) = 34.30, P = .017 0.994 0.998 0.074 0.385 Swiss sample −1701.47 91 3584.94 3837.84 3550.15 χ2 (12) = 12.69, P = .3919 1.000 1.000 0.022 0.309 Chinese sample −2055.19 88 4286.38 4558.63 4280.04 χ2 (18) = 48.07, P < .001 0.989 0.996 0.101 0.468 2nd order 5-factor Italian sample −5951.24 99 12100.49 12488.20 12174.10 χ2 (13) = 28.48, P = .008 0.998 0.999 0.057 0.502 American sample −5288.10 86 10748.20 11081.69 10808.85 χ2 (17) = 63.49, P = .000 0.994 0.997 0.088 0.824 Spanish sample −2254.80 84 4677.61 4928.23 4662.42 χ2 (16) = 20.11, P = .215 0.998 0.999 0.042 0.462 Swiss sample −1754.72 83 3675.43 3906.10 3643.70 χ2 (12) = 27.43, P = .007 0.996 0.997 0.084 0.682 Chinese sample −2168.61 77 4491.24 4729.46 4485.69 χ2 (15) = 83.38, P < .001 0.975 0.990 0.167 0.942
Note: LL, loglikelihood; k, number of free parameters; AIC, Akaike information criterion; BIC, Bayesian information criterion;
aBIC, sample size adjusted BIC; CFI, Comparative fit index; TLI, Tucker–Lewis index; RMSEA, root mean square error of
approximation; WRMR, weighted root mean square residual. Preferred factor structures in the calibration sample based on fit indices are presented in bold font. Chi-square for the baseline model: χ2 (5) = 14458.07, P < .001 (item 4 excluded). Both weighted least
square (WLSMV) and maximum likelihood (MLR) estimators were used in the analyses. Monte Carlo-based numerical integration was used in the estimation of models to ease computation time. The number of Monte Carlo generated integration points ranged from 5000 to 6000. Chi-square for the baseline model in the Italian sample: χ2 (5) = 9279.67, P < .001. Chi-square for the baseline
model in the American sample: χ2 (9) = 7885.97, P < .001. Chi-square for the baseline model in the Spanish sample: χ2 (7) = 2531.37,
P < .001. Chi-square for the baseline model in the Swiss sample: χ2 (8) = 4029.90, P < .001. Chi-square for the baseline model in the
Like the CFI and TLI however, the WRMR suggested strong fits for both models in all samples.
The AIC and other information criteria produced values that were lower for the 5-factor model than the hierarchical model in all of the samples. This suggests that although both the 5-factor and hierarchical models are cross-culturally valid, the 5-factor model is slightly stronger. Supplementary table S13 includes internal con-sistency estimates of the 5 factors for each of the study samples.
Assessment of Measurement Invariance Across Samples
We conducted tests of factorial invariance among the 5 multinational samples using the 5-factor model. The analysis was completed on the full study sample. Due to the unequal group sizes, which may bias estimates in favor of the larger Italian and USA-based samples, the analysis was also completed in a subsample of 575 indi-viduals with 115 indiindi-viduals from each subsample. To this end, 115 individuals were randomly drawn from the Italian, Chinese, Swiss, and American samples, whereas the entire Spanish sample was included. The results were not remarkably different. Table 5 summarizes all the fit indices of the measurement invariance model. Fit val-ues from the configural model showed that the 5-factor model held across all samples with CFI and TLI that exceed 0.99 and RMSEA falling below the 0.08 thresh-old. Metric invariance (equivalence of factor loadings) was similarly supported with CFI and TLI that exceed 0.99 and RMSEA close to 0.08. Scalar (equivalence of factor loading and intercepts) and residual (equivalence of loadings, intercepts, and factor residual variances) invariance was supported by high CFI and TLI values that decreased by less than 0.01 from the configural and metric models. The RMSEA value suggested a slight loss of absolute model fit however when assumptions of sca-lar invariance are violated. Using modification indices, it was determined that item 2 in the Italian sample had a higher intercept than in the other samples. When item 2 was freely estimated in the multigroup CFA, the RMSEA for scalar invariance model improves (CFI = 0.989, TLI = 0.998, RMSEA = 0.082). This suggests that Italian participants (all outpatients) tended to be rated as more
impaired on item 2 “Frequency of Pleasurable Activities” compared to participants in other samples, particularly the Chinese sample (inpatients/outpatients).
Discussion
Factor analysis served to investigate latent dimensions in BNSS-rated negative symptoms obtained from 5 sam-ples of different cultures and languages. In both EFA and CFA runs, the 5-factor model proved to be the pre-ferred structure of BNSS-rated negative symptoms. The hierarchical second-order 5-factor model also provided excellent fit, similarly supporting its factorial validity. Although a 2-factor model consistent with the MAP and EXP dimensions emerged from the EFA, this was rejected on the basis of its poor objective fit to the data. Previous studies erroneously accepted this solution for its parsimony and logic in the absence of objective fit indi-ces. Evidence of factorial invariance across multinational samples indicated that the 5-factor loading pattern holds cross-culturally and can be studied across translations. The current study extends evidence of the 5-factor model of negative symptoms across 5 cultures and languages using translated or original English versions of the BNSS.
There are several important implications for these findings. First, the 5-factor structure is not culturally bound. This suggests that these 5 domains reflect core processes inherent to the diagnosis that are not depen-dent on language or cultural influences. Second, these results also demonstrate that not only are early views of negative symptoms as a single construct inaccurate, but the current trend toward viewing negative symptoms as a 2-dimensional construct is also not fully justified. Rather, negative symptoms are best conceptualized in relation to the 5 negative symptom domains identified in the 2005 NIMH consensus conference: anhedonia, avolition, aso-ciality, alogia, and blunted affect.21 The 2-dimensional
conceptualization has had an important, but statisti-cally unjustified influence on the field. For example, the DSM-5 describes negative symptoms in relation to the broad MAP and EXP dimensions, rather than the 5 consensus domains. This procedure may lead to under-specified diagnoses that do not capture the granularity of the construct. Future versions of the DSM should Table 5. Goodness-of-Fit Indices for the Invariance Testing of the BNSS 5-Factor Structure
Invariance Model χ2 χ2 Difference Test CFI CFI Change TLI TLI Change RMSEA
Configural model χ2 (87) = 252.36, P <.0001 — 0.996 0.999 0.074
Metric invariance χ2 (88) = 304.29, P <.0001 χ2 (27) = 121.44, P <.0001 0.995 0.001 0.998 0.001 0.083
Scalar invariance χ2 (164) = 805.06, P <.0001 χ2 (114) = 704.40, P < .0001 0.986 0.010 0.997 0.002 0.107
Residual invariance χ2 (163) = 681.81, P <.0001 χ2 (36) = 282.13, P <.0001 0.988 0.008 0.998 0.001 0.090
Note: N = 1691. CFI, comparative fit index; TLI, Tucker–Lewis index; RMSEA, root mean square error of approximation. Chi-square
list and define each domain separately. Failure to do so will probably hamper efforts to identify the psychologi-cal and pathophysiologipsychologi-cal mechanisms of each domain. Treatments may also have differential efficacy for these 5 domains, and failing to evaluate the 5 domains sepa-rately may prevent observation of meaningful treatment effects that are domain-specific, rather than tied to the 2 broader dimensions. Treatment development efforts will be advanced by pharmacological and psychological treat-ments targeted to specific factors. Clinical trials testing such treatments should specify which of the 5 factors rep-resent the primary target(s)/outcome(s).
The NIMH RDoC initiative provides a framework for exploring neurobiological processes associated with aspects of “positive valence systems” and “social pro-cesses” that map onto these 5 clinical domains.37,38 Some
of these pathophysiological processes may be broadly related to the MAP and EXP dimensions, whereas oth-ers may be tied to 1 of the 5 domains more specifically. Future investigations are needed to explore pathophys-iology tied to each domain to promote targeted treat-ment developtreat-ment. Such trials should focus on one of the domains specifically. It is possible that trials already conducted have observed treatment effects, but these were masked by procedures for calculating overly broad scores. Reanalysis of large past studies with appropriate instru-ments may be warranted, and interpretation of future treatment trials would be strengthened by calculating scores for each of the 5 domains, rather than a global total score, or MAP and EXP dimensional scores, alone.
Strauss et al (Unpublished data) demonstrated that other measures besides the BNSS—the SANS and the CAINS—similarly captured the 5 domains. Developers of future negative symptom scales should endeavor to generate candidate items that capture each of these 5 domains. This will support a more focused creation of items for initial review and psychometric testing. It will also ensure that rating scales are brief yet comprehen-sive in their coverage of negative symptoms. The factorial validity of the hierarchical model also has implications for scale development. The MAP and EXP second-order factors represent higher-order broad dimensions that subsume the lower-order, narrow 5 domains. Measures like the BNSS and the CAINS that capture both narrow and broader facets of negative symptoms are potentially more comprehensive in their scope and maintain the relative advantages of capturing both broad and nar-row facets of negative symptoms. Such measures have potentially better reliability and fidelity given that more items assess the broader, higher-order dimensions, and the narrow bandwidth domains within broad dimensions are inter-correlated.39 These measures also maintain the
relative advantages of narrow bandwidth assessments including: (1) severity ratings and differences on specific domains are captured; (2) the specific effects of narrow-band domains within broader dimensions on external
variables can be captured when the same effects may be attenuated in broader dimensions; and (3) better inter-pretability when specific narrow facets are linked to exter-nal variables.39,40
The use of a multinational sample to cross-validate the 5-factor and hierarchical 5-factor models lends strong credence to conclusions about the factorial structure of negative symptoms. The results suggest that the 5-factor model is unbounded by culture, language, or setting. It represents rather a structure of negative symptoms that is pervasive, universal, and likely linked to distinct psycho-logical and/or pathophysiopsycho-logical processes found across cultures. The strong cross-validation results provide addi-tional evidence of the excellent psychometric characteris-tics of the translated versions of the measure. Practically, these findings suggest that the 5 factors are domains that exist globally and are assessable in different languages with good reliability and validity. Observed differences in the intercepts of item 2 is informative rather than prohib-itive of the use of the BNSS cross-culturally. It may sug-gest that cultural norms impact the definition of “normal” vs “impaired” in adjudging the frequency of pleasurable activities. Sociocultural and contextual factors have been shown to influence the expression and clinical trajectory of schizophrenia symptoms.41–44 It is therefore possible
that the frequency of pleasurable activities exhibits cul-tural and contextual variation that warrants further study. The current study did not evaluate the measurement invariance of the 5-factor model across other sources of symptom heterogeneity such as sex, diagnosis, and illness stage. These were adjudged as worthwhile for further val-idation of the 5-factor model but beyond the scope of the current study. In addition, the study did not examine the 5 factors in relation to the origin or form of negative symptoms.45,46 Next is to determine if the 5-factor model
is valid regardless of sex, negative symptom type, illness stage, or illness severity. Any determination of equiva-lence or nonequivaequiva-lence of the 5 domains would be infor-mative about the phenomenology of negative symptoms. Supplementary Material
Supplementary data are available at Schizophrenia
Bulletin online. Acknowledgments
The authors wish to thank the patients and staff at each of the data collection sites that made this work possi-ble. Gratitude is expressed to team members of each site who contributed to recruitment and data collec-tion efforts: Julio Bobes, Leticia Garcia-Alvarez, Daniel Berge, Gisela Mezquida, Clemente Garcia-Rizo, George Savulich, Robert Buchanan, James Waltz, Sally Vogel, Erik Ringdahl, Griffin Sutton, Nick Thaler, Kathryn Ossenfort, Elizabeth Dickinson, Adam Culbreth,
Lauren Catalano, Katherine Visser, Kayla Whearty, Sara Sullivan, Lindsay Morra.
References
1. Andreasen NC, Arndt S, Miller D, Flaum M, Nopoulos P. Correlational studies of the Scale for the Assessment of Negative Symptoms and the Scale for the Assessment of Positive Symptoms: an overview and update. Psychopathology. 1995;28:7–17. 2. Arndt S, Alliger RJ, Andreasen NC. The distinction of
posi-tive and negaposi-tive symptoms. The failure of a two-dimensional model. Br J Psychiatry. 1991;158:317–322.
3. Grube BS, Bilder RM, Goldman RS. Meta-analysis of symp-tom factors in schizophrenia. Schizophr Res. 1998;31:113–120. 4. Blanchard JJ, Cohen AS. The structure of negative symptoms
within schizophrenia: implications for assessment. Schizophr
Bull. 2006;32:238–245.
5. Kelley ME, van Kammen DP, Allen DN. Empirical valid-ation of primary negative symptoms: independence from effects of medication and psychosis. Am J Psychiatry. 1999;156:406–411.
6. Kimhy D, Yale S, Goetz RR, McFarr LM, Malaspina D. The factorial structure of the Schedule for the Deficit Syndrome in schizophrenia. Schizophr Bull. 2006;32:274–278.
7. Nakaya M, Ohmori K. A two-factor structure for the Schedule for the Deficit Syndrome in schizophrenia. Psychiatry Res. 2008;158:256–259.
8. Strauss GP, Horan WP, Kirkpatrick B, et al. Deconstructing negative symptoms of schizophrenia: avolition-apathy and diminished expression clusters predict clinical presentation and functional outcome. J Psychiatr Res. 2013;47:783–790. 9. Horan WP, Kring AM, Gur RE, Reise SP, Blanchard JJ.
Development and psychometric validation of the Clinical Assessment Interview for Negative Symptoms (CAINS).
Schizophr Res. 2011;132:140–145.
10. Kring AM, Gur RE, Blanchard JJ, Horan WP, Reise SP. The Clinical Assessment Interview for Negative Symptoms (CAINS): final development and validation. Am J Psychiatry. 2013;170:165–172.
11. Strauss GP, Hong LE, Gold JM, et al. Factor structure of the Brief Negative Symptom Scale. Schizophr Res. 2012;142:96–98.
12. Liemburg E, Castelein S, Stewart R, van der Gaag M, Aleman A, Knegtering H; Genetic Risk and Outcome of Psychosis (GROUP) Investigators. Two subdomains of negative symp-toms in psychotic disorders: established and confirmed in two large cohorts. J Psychiatr Res. 2013;47:718–725.
13. Marder SR, Galderisi S. The current conceptualization of negative symptoms in schizophrenia. World Psychiatry. 2017;16:14–24.
14. Schmitt TA. Current methodological considerations in exploratory and confirmatory factor analysis. J Psychoeduc
Assess. 2011;29:304–321.
15. Mulaik SA. A brief history of the philosophical founda-tions of exploratory factor analysis. Multivariate Behav Res. 1987;22:267–305.
16. Garcia-Portilla MP, Garcia-Alvarez L, Mané A, et al. The negative syndrome of schizophrenia: three-under-lying components are better than two. Schizophr Res. 2015;166:115–118.
17. Sayers S, Curran P, Mueser K. Factor structure and construct validity of the scale for the assessment of negative symptoms.
Psychol Assess. 1996;8:269–280
18. Peralta V, Cuesta MJ. Negative symptoms in schizophrenia: a confirmatory factor analysis of competing models. Am J
Psychiatry. 1995;152:1450–1457.
19. Axelrod BN, Goldman RS, Alphs LD. Validation of the 16-item negative symptom assessment. J Psychiatr Res. 1993;27:253–258.
20. Axelrod BN, Goldman RS, Woodard JL, alphs LD. Factor structure of the negative symptom assessment. Psychiatry
Res. 1994;52:173–179.
21. Kirkpatrick B, Fenton WS, Carpenter WT Jr, Marder SR. The NIMH-MATRICS Consensus Statement on Negative Symptoms. Schizophr Bull. 2006;32:214–219.
22. Mucci A, Galderisi S, Merlotti E, et al.; Italian Network for Research on Psychoses. The Brief Negative Symptom Scale (BNSS): independent validation in a large sample of Italian patients with schizophrenia. Eur Psychiatry. 2015;30:641–647. 23. Mané A, García-Rizo C, Garcia-Portilla MP, et al. Spanish
adaptation and validation of the Brief Negative Symptoms Scale. Compr Psychiatry. 2014;55:1726–1729.
24. Yao J, Cui JF, Chen N, et al. Reliability and validity of the Chinese version of Brief Negative Symptom Scale. Chin
Ment Health J. 2014;28:302–307.
25. Bischof M, Obermann C, Hartmann MN, et al. The Brief Negative Symptom Scale: validation of the German transla-tion and convergent validity with self-rated anhedonia and observer-rated apathy. BMC Psychiatry. 2016;16:415. 26. Muthen LK, Muthen BO. Mplus User’s Guide. 5th ed. Los
Angeles, CA: Muthen & Muthen; 1998–2007.
27. Steiger JH. Structural model evaluation and modification: an interval estimation approach. Multivariate Behav Res. 1990;25:173–180.
28. Browne MW, Cudeck R. Alternative ways of assessing model fit. In: Bollen KA, Long JS, eds. Testing Structural Equation
Models. Newbury Park, CA: Sage; 1993:136–162.
29. Tucker L, Lewis C. A reliability coefficient for maximum like-lihood factor analysis. Psychometrika. 1973;38:1–10.
30. Bentler PM. Comparative fit indexes in structural models.
Psychol Bull. 1990;107:238–246.
31. Akaike H. Factor analysis and AIC. Psychometrika. 1987;52:317–332.
32. Raftery AE. Approximate Bayes factors and accounting for model uncertainty in generalised linear models. Biometrika. 1996;83:251–266.
33. Yu CY. Evaluating cutoff criteria of model fit indices for latent
variable models with binary and continuous outcomes [Doctoral
dissertation]. Los Angeles: University of California; 2002. 34. Byrne BM. Testing for multigroup equivalence of a
meas-uring instrument: a walk through the process. Psicothema. 2008;20:872–882.
35. Horn JL, McArdle JJ. A practical and theoretical guide to measurement invariance in aging research. Exp Aging Res. 1992;18:117–144.
36. Cheung GW, Rensvold RB. Evaluating goodness-of-fit indexes for testing measurement invariance. Struct Equ Model 2002;9:233–255.
37. Cuthbert BN. Research domain criteria: toward future psychiatric nosologies. Dialogues Clin Neurosci. 2015;17:89–97.
38. Cuthbert BN, Insel TR. Toward the future of psychiatric diag-nosis: the seven pillars of RDoC. BMC Med. 2013;11:126. 39. Chapman BP. Bandwidth and fidelity on the NEO-five factor
inventory: replicability and reliability of Saucier’s (1998) item cluster subcomponents. J Pers Assess. 2007;88:220–234.
40. Paunonen SV, Ashton MC. Big five factors and fac-ets and the prediction of behavior. J Pers Soc Psychol. 2001;81:524–539.
41. Bauer SM, Schanda H, Karakula H, et al. Culture and the prevalence of hallucinations in schizophrenia. Compr
Psychiatry. 2011;52:319–325.
42. Bae SW, Brekke JS. Characteristics of Korean-Americans with schizophrenia: a cross-ethnic comparison with African-Americans, Latinos, and Euro-Americans. Schizophr Bull. 2002;28:703–717.
43 . Brekke JS, Barrio C. Cross-ethnic symptom differences in schizophrenia: the influence of culture and minority status.
Schizophr Bull. 1997;23:305–316.
44. Bae SW, Brekke JS, Bola JR. Ethnicity and treatment out-come variation in schizophrenia: a longitudinal study of community-based psychosocial rehabilitation interventions.
J Nerv Ment Dis. 2004;192:623–628.
45. Ahmed AO, Strauss GP, Buchanan RW, Kirkpatrick B, Carpenter WT. Are negative symptoms dimensional or cat-egorical? Detection and validation of deficit schizophrenia with taxometric and latent variable mixture models. Schizophr
Bull. 2015;41:879–891.
46. Ahmed AO, Strauss GP, Buchanan RW, Kirkpatrick B, Carpenter WT. Schizophrenia heterogeneity revisited: clinical, cognitive, and psychosocial correlates of statistically-derived negative symptoms subgroups. J Psychiatr Res. 2018;97:8–15.