1
UNIVERSITÀ DEGLI STUDI DEL PIEMONTE ORIENTALE
Dipartimento di Medicina Traslazionale
Corso di Dottorato di Ricerca in Scienze e Biotecnologie Mediche
Ciclo XXIXTitolo tesi
NEUROPHYSIOLOGICAL STUDY
OF EPILEPTOGENIC NETWORKS IN EPILEPSY
SSD: MED/26 Neurologia
Coordinatore Tutor
Chiar.ma Prof.ssa Marisa Gariglio Chiar.mo Prof. Roberto Cantello
Dottorando Gionata Strigaro Matricola: 20009417
2 A Zdeňka
3
CONTENTS
ABSTRACT ... 4 INTRODUCTION ... 6 PHOTOSENSITIVE EPILEPSY ... 7 Epidemiology ... 7 Diagnosis ... 8Epileptic syndromes with photosensitivity ... 10
Pathophysiology of photosensitivity... 11
TRANSCRANIAL MAGNETIC STIMULATION (TMS) IN EPILEPSY ... 12
Single pulse ... 12 Paired pulse ... 13 Functional connectivity ... 14 Cortical plasticity ... 14 TMS AND PHOTOSENSITIVITY ... 15 Single pulse TMS ... 15 Paired pulse ... 16
Connectivity and plasticity ... 16
AIM OF THE THESIS ... 17
SELECTED PUBLICATIONS: ... 18
INTERACTION BETWEEN VISUAL AND MOTOR CORTEX: A TMS STUDY ... 19
OVERACTIVE VISUOMOTOR CONNECTIONS UNDERLIE THE PHOTOPAROXYSMAL RESPONSE ... 38
DEFECTIVE INTERHEMISPHERIC INHIBITION IN DRUG-TREATED FOCAL EPILEPSIES ... 52
ABNORMAL MOTOR CORTEX PLASTICITY IN JUVENILE MYOCLONIC EPILEPSY ... 71
CONCLUSIONS ... 81
4
ABSTRACT
Introduction
Epilepsy is one of the most common serious brain disorders characterized by recurrent seizures. The current understanding of its pathophysiology is based on the “system
hypothesis” that goes beyond the classical dichotomy between focal and generalized epilepsy: some types of epilepsy may depend on the susceptibility to epileptogenic factors within a specific brain system. The mechanism underlying these processes are still obscure.
To increase understanding into the specific networks involved in the pathophysiology of different types of epilepsy, we proposed extensive neurophysiological studies on patients with epilepsy. First, we studied patients with photosensitive epilepsy since they represent a “model” of system epilepsy. Then, we focused on patients with focal (FE) and generalized epilepsies (GE) to unravel the neurophysiological basis of seizure generalization. Finally, we explored the motor cortex plasticity in juvenile myoclonic epilepsy (JME), the most common subtype of GE in adults.
Methods
We used the paired transcranial magnetic stimulation (paired-TMS), i.e. a safe, painless and non-expensive neurophysiologic tool to investigate the time related changes in functional connectivity between primary motor cortex and other distant brain areas. We developed a novel methods to examine the functional connection linking visual to the motor areas in healthy subjects and in patients with photosensitivity to study the visuomotor integration. We also studied the interhemispheric connection involved in seizure
generalization in FE and GE; to explore the motor cortex synaptic plasticity in patients with JME we used the paired associative stimulation.
Results
The findings support a physiologically relevant visuomotor functional connectivity, which likely contributes to visuomotor integration. Substantial physiologic changes in this network likely underlies the photosensitivity, which may finally justify the origin of epileptic motor phenomena, such as myoclonus.
We found significant differences in the interhemispheric connection of drug-treated patients with FE and those with IGE. Whilst interhemispheric inhibition changes would not be
5 crucial for the IGE pathophysiology, they may represent one key factor for the contralateral spread of focal discharges, and seizure generalization.
As to the patients with JME, we provided evidence of a defective long term potentiation-like plasticity, which may be primarily involved in the pathogenesis of myoclonus.
Conclusions
To our knowledge, these are the first studies evaluating the excitability of various epileptogenic networks using paired-TMS in patients with focal and generalized epilepsy.We documented substantial changes in the epileptogenic networks involved in different types of epilepsy. Further investigation into the pathophysiology of these diseases would increase understanding into the ictogenesis of human epilepsies and the neural networks involved and eventually open new therapeutic targets.
6
INTRODUCTION
Epilepsy is one of the most common serious brain disorders characterized by recurrent seizures. In Italy 30000 new cases are diagnosed each year, with an incidence higher in infants and elderly people. Around 500000 people are affected. Epilepsy has negative effects on quality of life, function, and increases risk of mortality despite available treatments (Duncan et al., 2006). It is refractory to the treatment in about one‐third of cases and the mechanisms underlying this drug resistance are not understood (Duncan et al., 2006).
The pathophysiology of epilepsy rely on the epileptogenic process in which changes at the molecular level ultimately translate into an unbalance between excitatory and inhibitory neural circuits leading to cortical hyperexcitability in specific networks and maladaptive plasticity. The mechanism underlying these processes are still obscure.
The current understanding of the pathophysiology of epilepsies is based on the “system hypothesis” that goes beyond the classical dichotomy between focal and generalized epilepsy: some types of epilepsy may depend on the susceptibility to epileptogenic factors within a specific brain system (Avanzini et al., 2012).
Photosensitive epilepsy (Verrotti et al., 2005) represents an ideal model of system epilepsy because the flickering light stimuli consistently induce an epileptic response. In this syndrome, the involvement of a widespread epileptogenic visuomotor network has been recently suggested (Koepp et al., 2015).
Unravelling how the epileptogenic process is affecting the brain networks will invaluably advance our understanding of epilepsy and will lead to development of improved therapeutic perspectives.
In the following parts we aim to introduce the photosensitivity and then the
neurophysiological methods that proved to be the most useful to unravel the pathophysiology of epilepsy. Later, we aim to discuss the most recent evidences coming from non-invasive brain stimulation studies in photosensitivity.
7
PHOTOSENSITIVE EPILEPSY
Photosensitivity is a condition in which epileptic seizures are triggered by natural or artificial intermittent lights, such as flickering sunlight (Gowers, 1885), flashes of television programs (Livingston, 1952), or computer games (Takada et al., 1999; Hughes, 2008).
The first scientific description of a “photoconvulsive” response dates back to 1946 by Grey Walter and colleagues (Walter et al., 1946). Since then, in EEG laboratories different techniques have been used to detect the response to the intermittent photic stimulation (IPS) (Harding, 1994). Usually, the sensitivity of the technique increases between 15 and 20 flashes per second, with a binocular stimulation of the central visual field and patterned stimuli (Harding, 1994). In most cases, a diagnosis of photosensitivity is made in the EEG laboratory. However, some patients experience their first seizure while watching TV programs or playing video games (Harding, 1994).
Photosensitive epilepsies came to public attention after December 16, 1997, when approximately 700 children were transferred to hospital in Tokyo, Japan, after watching a made-for television cartoon called “Pocket Monster”. Immediately after watching the
program, children experienced the sudden onset of convulsions, headache, nausea and blurred vision (Ishida et al., 1998). An official governmental report concluded that
low-luminance/red-blue stimuli alternating at 12 Hz triggered seizures in Japanese children (Ishida et al., 1998).
Photosensitivity is part of the reflex epilepsy spectrum in which seizures can be triggered by external stimuli (Berg et al., 2010). Its most elementary and common form is the photoparoxysmal response (PPR) to IPS.
Epidemiology
A PPR in patients with epilepsy is a relatively common phenomenon, occurring in up to 10% of patients (Buchthal & Lennox, 1953; Wolf & Goosses, 1986; Obeid et al., 1991; Gregory et al., 1993). It is more common in children (Hughes, 2008), female (Zifkin & Kasteleijn-Nolst Trenite, 2000), and Caucasians (Hughes, 2008). Quirk et al. (1995) reported that approximately 2% of new diagnosis of epilepsy show a PPRs on their first EEG (Quirk et al., 1995). Besides, a PPR may be detected in healthy subjects between 0,5% to 8,9% of cases (Kooi et al., 1960; Verrotti et al., 2002).
8 A genetic component in photosensitivity has become clear in the last few decades (Italiano et al., 2016). There is an higher occurrence in the same families, in genetic disorders and in siblings (Covanis, 2005). The risk of having PPRs in the general population is about 3%, but it increases at about 20% in siblings of children with generalized PPR (Waltz & Stephani, 2000). This phenomenon is characterized by genetic heterogeneity and complexity.
The highest rate is observed during puberty until the age of 15 years and in female, likely because of hormonal differences (Wolf & Goosses, 1986; Kasteleijn-Nolst Trenite, 1989; Clement & Wallace, 1990). According to some authors (So et al., 1993; Verrotti et al., 2002), the presence of PPRs is not a risk factor for the development of epilepsy: in fact none of the subjects who showed PPRs without any other EEG abnormalities suffered from epileptic seizure during the follow-up.
Diagnosis
The PPR is routinely assessed during standard EEG registration. After the Consensus Meeting in Heemstede in 1996 and in Aix-en-Provence in 1999, some guidelines were elaborated (Kasteleijn-Nolst Trenite et al., 1999; Rubboli et al., 2004; Kasteleijn-Nolst Trenite et al., 2012). Table 1 shows the most recent practical recommendation on IPS (Kasteleijn-Nolst Trenite et al., 2012).
The importance of the eyes closure state is likely related to the interposition of the eyelid red filter that has a provocative effect on PPR (Kasteleijn-Nolst Trenite et al., 2012). In some cases a PPR can be observed only when the eyes are closed because the light is spread over the entire retina and the excitability of the brain increases (Wilkins et al., 1980;
Kasteleijn-Nolst Trenite, 1989). An important recommendation is to turn off the stimulator immediately at the appearance of generalized epileptiform discharges on EEG, to avoid the development of a seizure. Subsequently, it is possible to restart the IPS again with a frequency of 60 Hz and go down in frequencies to find the upper PPR threshold (Kasteleijn-Nolst
9 Table 1
Photostimulator Grass PS22 stimulator
Lamp Xenon lamp, with circular reflector (diameter 13 cm)
Flashes intensity At least 0.70 Joule
Viewing distance 30 cm
Patient position Upright
EEG montage 16 channels
Flash frequencies
required 1 - 2 - 8 - 10 - 15 - 18 - 20 - 25 - 40 - 50 - 60 Hz Eye conditions Eye closure, eye closed, eye open
Frequency duration Trains of flashes of 5 s + 5 s rest, each eye condition (30s)
Total IPS duration 5 ½ min
Additional requirements Electrodes for recording eye movements and surface electrodes to detect myoclonus
Summary of the practical recommendation on the photic stimulation technique (Kasteleijn-Nolst Trenite et al., 2012).
PPR classification
The type of PPR are commonly divided into 4 types (Waltz et al., 1992; Doose & Waltz, 1993) (Figure 1):
- type I: occipital spikes within the occipital alpha rhythm; - type II: parieto-occipital spikes with a biphasic slow wave;
- type III: parieto-occipital spikes with a biphasic slow wave and spread to the frontal region; - type IV: generalised spikes and waves or polyspikes and waves.
Figure 1
Example of PPR type II and type IV according to the classification of Waltz et al., 1992. IPS, intermittent photic stimulation.
10 Epileptic syndromes with photosensitivity
In patients with epilepsy, a PPR can be found in different cases (Covanis, 2005; Verrotti et al., 2012): in epilepsies without seizures induced by IPS, in epilepsies with and without seizures induced by IPS and in pure photosensitive epilepsies.
In general, it is known that PPR rates are higher in patients with generalized epilepsy than in focal epilepsy (Wolf & Goosses, 1986; Lu et al., 2008). Seizures elicited by IPS are usually generalized tonic-clonic, myoclonic and absences (Covanis, 2005). The group of epilepsies without seizures induced by IPS is a miscellanea of different epileptic syndromes with no importance on the aetiology. The second group, in which seizures both induced and not induced by IPS coexists, contains: juvenile myoclonic epilepsy (JME), epilepsy with grand mal on awakening, eyelid myoclonia with absences (EMA), progressive myoclonic epilepsy (PME), Dravet syndrome, childhood absence epilepsy (CAE) (Verrotti et al., 2012). In JME, the most common subtype of idiopathic generalized epilepsy (IGE) in youngsters between 8 and 36 years (Banerjee et al., 2009; Camfield et al., 2013), the incidence of
photosensitivity ranges from 30% (Wolf & Goosses, 1986) to 90% (Appleton et al., 2000). In EMA, the presence of photosensitivity, together with eyelid myoclonias with and without absences and eye closure induced seizures, is a diagnostic criteria of this syndrome (Covanis, 2005). In CAE the incidence of photosensitivity is between 17% (Wolf & Goosses, 1986) and 44% (Lu et al., 2008). In Dravet syndrome, also known as severe myoclonic epilepsy of infancy, the PPR is observed in 40-60% of patients (Dravet, 2012; Specchio et al., 2014).
The group of pure photosensitive epilepsies includes epilepsies with generalized seizures only provoked by IPS or flickering lights. According to Jeavons (Jeavons et al., 1986), 40% of photosensitive patients suffer from this kind of epilepsy; a wide range of IPS frequencies (5-60 Hz) are effective (Covanis, 2005).
Most patients are sensitive at IPS between 10 and 30 Hz (Harding, 1994) and patients sensitive to higher frequencies are at risk of having seizures during fluorescent light
stimulation or during TV programs (Kasteleijn-Nolst Trenite et al., 2012). A PPR at 1-2 Hz, is a typical detection in progressive myoclonic epilepsies (Rubboli et al., 1999). In adult patients without epilepsy, a late onset PPR at low frequencies (<5 Hz) can be found in the context of a severe progressive neurologic deterioration due to encephalopathies (Creutzfeldt-Jakob disease, MELAS) or neurodegenerative disorders (Lewy body disease) (Guellerin et al., 2012).
11 Pathophysiology of photosensitivity
Photosensitivity has always attracted the attention of epileptologists. Indeed, it represents an ideal model of network epilepsy (Avanzini et al., 2012), in which adequate visual stimuli trigger an epileptic event in the brain. The epileptogenic network underlying the PPR is primarily based on a hyperexcitable visual cortex in response to flickering lights (Strigaro et al., 2012) and defective cortical mechanisms of contrast gain control (Porciatti et al., 2000). The stimuli have two main salient features, the quantity of light (luminance) (Harding & Fylan, 1999) and the wavelength (Takahashi et al., 1999), that contribute in evoking a PPR. Therefore, the maximal provocative effects can be obtained by either high luminance stimuli, like the IPS easily practiced in the EEG laboratories around the world, or deep-red colours whose epileptogenicity was highlighted in the Pokémon incident (Ishida et al., 1998). However, hyperexcitability of the visual cortex do not explain how the PPR discharge propagates from posterior to anterior regions of the brain to generate the allied myoclonic jerks (Koepp et al., 2015). Although the involvement of the peri-rolandic area in the PPR was showed in the Papio papio baboon, a model of generalized epilepsy with photosensitivity (Naquet et al., 1995), human evidence have been scarce until recently.
12
TRANSCRANIAL MAGNETIC STIMULATION (TMS) IN EPILEPSY
Epilepsies are a complex group of syndromes characterized by episodic brain dysfunction manifesting as recurrent seizures (Engel, 2006). Admittedly, the underlying process is mediated by changes in both excitatory and inhibitory neural circuits leading to hyperexcitable seizure networks (Clark & Wilson, 1999). Sometimes, the primary motor cortex is a crucial part of these networks. More often, it can be influenced at a distance by non-motor epileptogenic areas (Hamer et al., 2005). Besides, cortical area 4 (M1) is easily studied by transcranial magnetic stimulation (TMS), i.e. a safe, painless and non-expensive neurophysiologic tool (Macdonell et al., 2002; Tassinari et al., 2003; Schrader et al., 2004). TMS was initially used to evaluate the integrity of the cortico-spinal tract through conduction studies (Barker et al., 1985). Then, it was applied to measuring the excitatory and inhibitory properties of the cortex itself. Several TMS protocols were developed to study different properties of M1, such as the resting motor threshold (RMT) (Rossini et al., 1999), the cortical silent period (CSP) (Cantello et al., 1992) and paired-pulse measures such as short intracortical inhibition (SICI) and intracortical facilitation (ICF) (Kujirai et al., 1993). These physiologic variables, over the past 25 years, proved much informative in terms of both physiology and disease, particularly movement disorders and epilepsy (Cantello et al., 1992; Valls-Sole et al., 1992; Kujirai et al., 1993; Wilson et al., 1993; Hallett, 1995; Ziemann et al., 1998; Macdonell et al., 2002).
The most robust findings across epilepsy studies came from one of these testing protocols, i.e. paired-pulse TMS (Brodtmann et al., 1999; Cantello et al., 2000a; Manganotti et al., 2000; Werhahn et al., 2000; Manganotti et al., 2001; Hamer et al., 2005; Badawy et al., 2007; Badawy et al., 2014). TMS has at a later stage evolved in a tool to study cortical
plasticity (Ziemann et al., 2008) and functional connectivity (Rothwell, 2011).
Single pulse
In the context of assessment of excitability of the primary motor area (M1), single pulse TMS applied over the cortical representation of a given muscle (usually the first dorsal interossesous, FDI) can be used to measure RMT, active motor threshold (AMT) and CSP. RMT is defined as the minimum stimulation intensity required to obtain a motor evoked potential (MEP) of at least 50 µV in approximately 5 out of 10 trials while the target muscle is
13 at rest (Rossini et al., 1999). RMT is probably dependent on the intrinsic excitability of neural elements directly activated by TMS, i.e. cortico-cortical axons, their excitatory synaptic contacts with the corticospinal neurons and the initial axon segments of the corticospinal neurons (Amassian et al., 1987; Di Lazzaro & Ziemann, 2013). RMT is thus mostly dependent on the state of voltage-gated sodium channels (VGSC), which directly regulate axon excitability (Hodgkin & Huxley, 1952) and of a-amino-3-hydroxy-5-methyl-4 isoxazolepropionic acid receptors (AMPA-R), which are responsible for fast excitatory synaptic transmission in the neocortex (Ozawa et al., 1998). This is suggested by the observation that VGSC blocking agents increase RMT (Ziemann et al., 2015) whereas enhancement of AMPA-R transmission reduces RMT (Di Lazzaro et al., 2003). Single pulse can also be used to evaluate M1 inhibitory circuitry by measuring the CSP, which is defined as a TMS-induced interruption of activity in the EMG of voluntarily contracting muscles. It has been hypothesized that the late part of the CSP is caused by a long-lasting cortical inhibition mediated by GABAb receptors and thus it can be used to probe inhibitory
mechanisms within M1 (Nakamura et al., 1997; Siebner et al., 1998). Single pulse TMS can also be delivered to the primary visual cortex (V1) to elicit perceptual excitatory phenomena called phosphenes (Meyer et al., 1991; Merabet et al., 2003) and to suppress visual perception (Amassian et al., 1989); both are used as measures of V1 excitability.
Paired pulse
It is possible to use TMS to probe M1 intracortical circuitry with paired pulse paradigms. Among them, SICI measures the suppression of a suprathreshold TMS stimulus by a preceding subthreshold pulse, with an interstimulus interval (ISI) of 1-5 ms (Kujirai et al., 1993). It has been hypothesized that the first pulse activates low-threshold inhibitory interneurons, which in turn suppress activity in corticospinal neurons through inhibitory post-synaptic potentials (IPSPs) mediated by GABAa receptors (Ilic et al., 2002; Di Lazzaro & Ziemann, 2013). When the two pulses are applied with the same intensity but with an ISI of 10-15 ms inhibition turns to facilitation. This phenomenon is called ICF and mostly relies on glutamatergic neurotransmission (Ziemann et al., 1996b). By contrast, long intracortical inhibition (LICI) is tested by applying two suprathreshold stimuli at an ISI between 50 and 200 ms (Valls-Sole et al., 1992) and is thought to reflect slow IPSPs mediated by GABA-B receptors (Werhahn et al., 1999).
14 Functional connectivity
The mentioned studies using single- or paired-pulse TMS paradigms (delivered with a one coil) investigated the excitability of a single brain area, mostly M1 and V1. More
recently, two coils (“twin coil” approach) have been used to investigate the time related changes in functional connectivity between primary motor cortex and other distant brain areas. A conditioning stimulus (CS) is first used to activate the interested area, while the test stimulus (TS), given at different times afterward, is used to probe the excitability of motor cortical projections to contralateral hand muscles. This method has been successfully conducted and proved the existence of various pathways in humans (Rothwell, 2011),
especially the functional connectivity between primary motor cortex and the controlateral M1 (Ferbert et al., 1992), the cerebellum (Ugawa et al., 1995), the premotor cortex (Civardi et al., 2001) and the posteriorparietal cortex (Koch et al., 2007a) with a milliseconds time
resolution.
Cortical plasticity
Abnormal cortical plasticity has been frequently hypothesized to play a crucial role in the pathogenesis of epilepsy (Sutula, 2004; Lopantsev et al., 2009). However, direct
evidences supporting these hypothesis have been scarce so far in human epilepsy, possibly for experimental difficulties. TMS offers the unique opportunity to study non-invasively cortical plasticity. A variety of TMS protocols have been developed to probe mechanisms of synaptic plasticity in the intact human brain. Between these, paired associative stimulation (PAS) (Stefan et al., 2000; Wolters et al., 2003) involves repeated pairing of an electrical stimulus to the median nerve with a later TMS stimulus over the contralateral motor cortex inducing changes in cortical excitability. The effect depends on the interval between median nerve and TMS stimuli: intervals of 25 ms (PAS25) increase excitability whereas intervals of around 10 ms (PAS10) reduce excitability (Stefan et al., 2000; Wolters et al., 2003; Weise et al., 2006). Pharmacological manipulations suggest that the effects involve temporary changes in synaptic efficacy that are equivalent to long term potentiation (LTP) and long term depression (LTD) described in animal preparations (Muller-Dahlhaus et al., 2010). For example, sensorimotor cortex synaptic plasticity is abnormal in patients with progressive myoclonic epilepsy (Danner et al., 2011).
15
TMS AND PHOTOSENSITIVITY
TMS proved to be an excellent method to study the cortical excitability in patients with epilepsy (Macdonell et al., 2002; Tassinari et al., 2003; Badawy et al., 2014), but it has received relatively little attention in the study of photosensitivity in particular.
Single pulse TMS
Single pulse TMS measures were used by several authors to investigate M1
excitability in photosensitive patients at rest. Manganotti and coworkers found no difference in MEP amplitude and CSP between patients with juvenile myoclonic epilepsy, and healthy subjects (Manganotti et al., 2000). However not all the examined patients had
photosensitivity. Similarly, Groppa and coworkers (Groppa et al., 2008) found no difference in MEP amplitude, and CSP duration between PPR-positive patients with idiopathic
generalized epilepsy (IGE), PPR-negative patients with IGE, and PPR-negative healthy controls under resting conditions. This was confirmed by other investigators (Siniatchkin et al., 2007) comparing PPR-negative and PPR-positive healthy subjects. While an increase in RMT was found in IGE patients with PPR compared with IGE patients without PPR (Groppa et al., 2008) and with healthy subjects (Strigaro et al., 2013), this has been attributed to the effect of antiepileptic medications on RMT (Ziemann et al., 2015).
The same single pulse TMS measures were investigated in relation to IPS. IPS at frequencies of 50 and 60 Hz was able to decrease CSP duration in healthy subjects, while IPS at 5 and 30 Hz was not effective (Entezari-Taher & Dean, 2000). However, IPS at 50 Hz was not able to shorten CSP in PPR-positive and PPR-negative patients with IGE (Groppa et al., 2008); the authors speculated that patients with IGE had an altered responsiveness of
GABAergic inhibitory circuits in M1. This result argue against a specific increase in M1 excitability of M1 due to PPR. Other authors suggested that PPR might be linked to
excitability alterations in V1. It was found that healthy individuals with PPR propagating to frontal regions had lower phosphene threshold, steeper stimulus-response curves and showed a stronger suppression of visual perception following TMS pulses compared with healthy individuals with PPR with occipital spikes only (Siniatchkin et al., 2007). Subjects with propagating PPR also showed no CSP change during IPS, while in subjects without PPR CSP was shortened under the same conditions. This last finding was confirmed by our group in a
16 later study, where IPS at 20 Hz failed to modulate CSP only in patients showing type III or IV PPR (i.e. with frontal or generalized diffusion) (Strigaro et al., 2013).
Paired pulse
SICI was smaller in patient with JME treated with antiepileptic drugs (AEDs), while the ICF and LICI were normal (Manganotti et al., 2000); unfortunately the patient were not stratified according to the presence of PPR. Groppa and coworkers found no difference in SICI and ICF between PPR-positive patients with IGE, PPR-negative patients with IGE and PPR-negative healthy controls, both at rest and during IPS (Groppa et al., 2008). In our study SICI and ICF were normal both at rest and during IPS, and this was true for patients with a PPR limited to occipital regions as well as for those having an anterior spread of PPR (Strigaro et al., 2013).
Connectivity and plasticity
The mentioned studies using single- or paired-pulse TMS paradigms mostly investigated the excitability of M1 in patients with PPR; however, there are evidences suggesting hyperexcitability in the visual cortex of these patients (Porciatti et al., 2000; Cantello et al., 2011; Strigaro et al., 2012). How the discharge propagates from posterior to frontal cortical regions, to generate the allied myoclonic jerks? We believe that valid answers may come from our recent electrophysiological studies on the mechanisms of visuo-motor integration presented in this thesis.
Some other evidences come from recent studies on physiological visuomotor integration with visual paired associative stimulation (V-PAS) (Suppa et al., 2015a). This novel protocol induces long-term changes in the M1 excitability, which reflect long-term potentiation (LTP) and long-term depression (LTD) due to early visuomotor integration processes (Suppa et al., 2015a). In patients with IGE and PPR, but not in PPR-negative
patients, the V-PAS-induced plasticity was abnormal in M1. This may suggest that PPR arises from abnormal activity in a complex cortical network physiologically responsible for
17
AIM OF THE THESIS
The aim of the present thesis was to increase understanding into the specific networks involved in the pathophysiology of different types of epilepsy with non-invasive brain
stimulation (TMS). From this, we aimed to define specific neurophysiological phenotypes and translate the findings into clinically useful parameters.
First, we studied patients with photosensitive epilepsy since they represent a “model” of system epilepsy. Then, we focused on patients with focal and generalized epilepsies to unravel the neurophysiological basis of seizure generalization. Finally, we explored the motor cortex plasticity in juvenile myoclonic epilepsy, the most common subtype of generalized epilepsy in adults.
Further investigation into the pathophysiology of these diseases would increase understanding into the ictogenesis of human epilepsies and the neural networks involved and eventually open new therapeutic targets.
18
SELECTED PUBLICATIONS:
19
INTERACTION BETWEEN VISUAL AND MOTOR CORTEX: A TMS
STUDY
Strigaro G, Ruge D, Chen JC, Marshall L, Desikan M, Cantello R, Rothwell JC. J Physiol. 2015;593:2365-77.
Abstract
The major link between the visual and motor systems is via the dorsal stream pathways from visual to parietal and frontal areas of cortex. Although the pathway appears indirect, there is evidence that visual input can reach the motor cortex at relatively short latency. To shed some light on its neural bases, we studied the visuo-motor interaction using paired transcranial magnetic stimulation (paired-TMS).
Motor evoked potentials (MEPs) were recorded from the right FDI in sixteen healthy volunteers. A conditioning stimulus (CS) was applied over the phosphene hotspot of visual cortex, followed by a test stimulus (TS) over left M1 at random interstimulus intervals (ISIs, 12-40 ms). The effects of paired stimulation were re-tested during visual and auditory reaction-time tasks (RT). Finally, we measured the effects of a CS on short-interval intracortical inhibition (SICI).
At rest, a CS over the occiput significantly (p<0.001) suppressed test MEPs at ISIs 18-40ms. In the visual RT, inhibition at ISI=40ms (but not 18ms) was replaced by a time-specific facilitation (p<0.001) whereas in the auditory RT the CS no longer had any effect on MEPs. Finally, an occipital CS facilitated SICI with an ISI=40ms (p<0.01).
We conclude that it is possible to study separate functional connections from visual to motor cortices using paired-TMS at ISI=18-40ms. The connections are inhibitory at rest and possibly mediated by inhibitory interneurones in motor cortex. The effect at ISI=40ms reverses into facilitation during a visuomotor, but not audiomotor RT. This suggests that it plays a role in visuomotor integration.
20 Introduction
Corticospinal excitability is modulated by a variety of sensory inputs, including auditory (Furubayashi et al., 2000), somatosensory (Tokimura et al., 2000), visual (Cantello et al., 2000b), and even gustatory (Mistry et al., 2006). This likely contributes to the
sensorimotor integration underlying hand/limb movements (Goodale, 2011). In particular, somatosensory input has often been given special prominence, in view of its direct and short latency inputs. A large proportion of motor cortex neurones recorded in non-human primates respond at short latency to somatosensory inputs (Cheney & Fetz, 1984), and such responses are likely to be involved in long-latency transcortical stretch and cutaneous reflexes in
humans (Macefield et al., 1996). In contrast, visual inputs are classically viewed as relatively indirect and weak, with only about 3% neurones in primate motor cortex responding to visual stimulation (Lamarre et al., 1983). However, later studies found visually responsive neurones in many areas of the cerebral cortex not directly involved in vision (i.e. premotor cortex, supplementary motor area, prefrontal cortex, frontal ocular fields) (Fadiga et al., 2000). How these areas are involved in visuomotor integration is still largely unknown.
In humans there have been relatively few direct investigations of the effects of visual input on motor cortex (M1), but those that have been done suggest that moderately strong effects can be observed at a relatively short latency. The earliest studies were conducted in patients with photic reflex myoclonus in whom flashes of light can evoke a generalised myoclonic jerk (Shibasaki & Neshige, 1987; Artieda & Obeso, 1993). In a series of investigations on 6
patients, Artieda and Obeso (Artieda & Obeso, 1993) suggested that visual input was reaching the motor cortex rapidly from primary visual areas since transcranial magnetic stimulation (TMS) over the occiput during 1 Hz flash stimuli (to increase visuo-motor excitability) provoked a muscle twitch some 7 ms later than direct TMS over M1. A later study by
Cantello et al (2000) in healthy volunteers followed up on these observations by using single pulses of TMS to assess the excitability of the motor cortex after a light flash. They found that excitability was reduced some 55-70 ms after the flash and pointed out that the response to a flash reaches visual cortex at about 40 ms, so that if a cortico-cortical pathway was involved from visual (V1) to motor cortex (M1), the transit time would be of the order of 15 ms, at least in normal subjects. These effects might be interpreted as the physiological counterpart of a pathological visuomotor connectivity seen earlier in patients with photic reflex myoclonus (Artieda & Obeso, 1993). Rapid access of visual input to motor areas of cortex is also evident from reaction time studies (Thut et al., 2000; Makin et al., 2009) and many event-related potential (ERP) studies (Saron et al., 2001; Foxe & Simpson, 2002; Ledberg et al., 2007). Yet
21 the precise neural basis of these phenomena is still largely obscure. Intuitively, the primary visual area would be the first cortical relay of the circuit and the primary motor cortex would represent the final output.
The aim of the present study was to devise a method to examine visuo-motor interaction in healthy participants. We used a “twin coil” TMS approach to test whether a conditioning pulse over the occiput influences the amplitude of the muscle twitches evoked from a later TMS pulse applied over M1. Connectivity was tested at rest as well as during the warning period prior to a simple visual reaction time task in order to examine whether it showed any task-related changes in excitability.
Materials and Methods Subjects
A total of 16 healthy volunteers (8 women, 21–51 years old) were recruited. One subject was excluded since he reported no phosphenes. All of the remaining 15 participated in Exp. 1; 10 of these then participated in Experiments 3-5 (same individuals in all 3
experiments). All subjects were right-handed based on the Edinburgh Handedness Inventory and gave written informed consent. Experiments were approved by the Ethical Committee of University College London and were performed in accordance with the Declaration of Helsinki.
TMS
For paired-TMS we used two high-power Magstim 200 machines (Magstim,
Whitland, UK). The magnetic stimulus had a nearly monophasic pulse configuration with a rise time of ~ 100 µs, decaying back to zero over ~ 0.8 µs. The stimulators were connected to a figure-of-eight coil (outer winding diameter 70 mm).
Test stimuli
MEPs were recorded from the first dorsal interosseous (FDI) muscles using 9 mm diameter Ag-AgCl surface-cup electrodes, in a typical belly-tendon montage. Responses were amplified by a Digitimer D360 device (Digitimer, Welwyn Garden City, UK). Filters were 20 Hz - 3 kHz, and the sampling rate was 10 kHz. The signal was then recorded by a PC using Signal software ver. 4.08 (Cambridge Electronic Devices, Cambridge, UK). The test coil was placed tangentially to the scalp at a 45° angle to the midline, to induce a posterior-anterior
22 (PA) current flow across the central sulcus. The hand motor area of the left M1 was defined as the point where stimulation consistently evoked the largest MEP. We defined the resting motor threshold (RMT) as the lowest intensity that evoked 5 small responses (~50 µV) in the relaxed FDI muscle in a series of 10 stimuli (Rossini et al., 1994). The intensity of the TS was finally adjusted to evoke an MEP of ~ 1 mV peak-to-peak amplitude in the relaxed right FDI.
Experiment 1 (n =15).
Paired-TMS stimulation was conducted as in the pilot trial. The TS alone and CS plus TS were randomly intermixed at each ISI. Fifteen responses were collected for TS and 12 responses for CS plus TS. There was a 5 s (±20%) intertrial interval. For each trial we measured the average peak-to-peak MEP amplitude. The conditioned MEP was expressed as a percentage of the unconditioned MEP size. The centre of the conditioning coil was placed over the phosphene hot spot. This was located and the phosphene threshold (PT) determined according to the method of Stewart et al. (Stewart et al., 2001). Subjects wore a blindfold and a cap whilst seated in a comfortable chair in a dimly lit room. Three points were marked over the occipital midline 2, 3 and 4 cm above the inion. The coil handle pointed upwards and was parallel to the subject’s spine. The coil centre was first positioned 2 cm above the inion, then moved anteriorly across the marks, to determine the best site to elicit phosphenes (“hot spot”). Stimuli were initially applied at 60% of the stimulator output and at a maximum frequency of 0.2 Hz. The subject was asked about the presence of phosphenes immediately after each pulse. If a phosphene was reported 5 or more times out of 10, the pulse intensity was reduced by steps of 5%, then stimuli were repeated another 10 times. This protocol progressed until no phosphene was reported. The minimum intensity at which the subject perceived a phosphene 5 times out of 10 was the PT. If the initial intensity of 60% was ineffective, it was increased by steps of 5% maximum power, till phosphenes appeared. If the subject still failed to perceive a phosphene on the midline, the coil was shifted to a lateral position and the procedure was repeated at this location. One subject was excluded since he reported no phosphenes. The intensity of the CS was adjusted to be 80% PT or 90% PT. ISIs were 12, 15, 18, 21, 24, 27, 30, 35 and 40 ms. There were two sessions: one with eyes open and another with eyes closed.
Experiment 2 (n =8).
From Exp.1, 8 subjects were selected because they showed the strongest inhibition at ISI 18 and 40 ms. We then studied the effects of changing the CS site, in a setting otherwise
23 identical to Exp. 1. There were two sessions: conditioning stimuli with an intensity of 80% PT were applied to the phosphene hot spot or to a site 3 cm lateral to Pz (according to the 10-20 international system) on the right side. The subjects’ eyes were open.
Experiment 3 (n=10).
The protocol described in Exp. 1 was then repeated during a visuo-motor RT task. We hypothesized that a physiologically relevant connectivity would show time-specific changes in such a context. We used a task similar to that of Touge et al (1998). Subjects sat relaxed in a chair with their right forearm lying comfortably on a pillow and their right hand on a button box. Eyes were open. Surface EMG was recorded from the FDI, APB (abductor pollicis brevis) and ADM (abductor digiti minimi) muscles. We ensured that there was no EMG activity at baseline. A black screen was placed in front of the subjects at a distance of 50 cm, which carried two light-emitting diodes (LEDs) separated by 1.5 cm. The red LED was the warning signal (WS) and the green LED was the response signal (RS). Subjects were
instructed to use the WS to prepare for the upcoming response and to contract their right FDI muscle as quickly as possible in order to press the button with their right index finger as soon as they saw the RS. Each trial began with a WS followed by a RS given randomly 600±50 ms later. The intertrial interval was 5 s (±20%). We had two randomized sessions separated by at least one week. In each session we measured the effects of the CS on TS while subjects were at rest, outside of the reaction time task. CS was 90% PT. ISIs of 18 and 40 ms (the most effective in previous experiments) were randomly intermingled. Subjects also performed 4 blocks of the RT task. Each block had 4 conditions that were randomised within the block. Condition 1: subjects received a WS, followed 600±50 ms later by a RS, to which they had to react as quickly as possible. Condition 2: a TS alone given at -300, -150, -50 or +50 ms relative to RS (depending on the block, see below). Condition 3: same as condition 2, but the TS was preceded by a CS with an ISI of either 18 or 40 ms (depending on the block, see below). Condition 4: a TS alone was given in the intertrial interval (Figure 1). Thirty trials were recorded for each condition for a total of 120 trials. In one of the experimental sessions, the four trial blocks were: (1) TS at -300 ms, CS 18 ms before test; (2) TS at -150 ms, CS at 18 ms; (3) TS at -300 ms, CS at 40 ms before test; (4) TS at -150 ms, CS at 40 ms. The other experimental session contained TS at -50 ms and +50 ms. Before each session, at least 50 practice trials were given.
The responses to each single trial were stored on a computer and analysed off-line at the end of the experiment. Rejection criteria were: 1) baseline EMG levels ≥ 50 µV; 2)
24 reaction time < 100 ms and > 1000 ms; 3) failure to react. Later we analysed the RMS values of baseline EMG in the 100 ms before the TMS pulses in each trial to ensure the task specific conditioned MEP data were not contaminated by background EMG activity.
Figure 1
A, the setting of Experiment 3. In condition 1, subjects received a warning signal (WS), followed 600±50 ms later by a response signal (RS), after which they had to react as fast as possible. In condition 2, a test stimulus (TS) alone given at one of four different “times” (-300, -150, -50 or +50 ms). In condition 3, same as condition 2, but the TS was preceded by a conditioning stimulus (CS) with an ISI of either 18 or 40 ms. In condition 4 a TS alone was given in the intertrial interval. B, typical example of changes in the MEP (grandaverage of the recorded trials) during the reaction time task. In this particular subject, a clear MEP increase can be seen 50 ms before the RS at an ISI of 40 ms (condition 3).
25 Experiment 4 (n=10)
We tested the paired-TMS protocol during an auditory RT task. The subjects, settings and conditions were the same as in Exp. 3. First, we measured the effects of the CS on TS with an ISI of 40 ms while subjects were at rest outside of the reaction time task. There followed two sessions: in one we used an auditory RT task, where the first tone (500 Hz, 50 ms) was the WS and the second tone (1000 Hz, 50 ms) was the RS; in the other, we re-tested the visual RT task. We also restricted our timings to TS at -50 ms (i.e. just prior to the RS) using an ISI between CS and TS of 40 ms since these parameters had produced large effects in Exp. 3.
Experiment 5 (n=10)
This experiment investigated the effects of a CS over the visual cortex on short interval intracortical inhibition (SICI) in the left M1 (Kujirai et al., 1993). We used three high-power Magstim 200 machines. The first conditioning stimulus (CS1) was delivered with an intensity of 90% PT over the phosphene hot spot and the second one (CS2) over the left M1. Finally, the TS was applied over the left M1 with an intensity to elicit a MEP of ~ 1 mV. The intensity of CS2 was set to the relatively low value of 70% active motor threshold (AMT), to avoid floor effects on the percentage SICI. AMT was defined as the lowest intensity that evoked five small responses (about 100 µV) in a series of ten stimuli when the subject made a 10% of the maximum voluntary contraction of the right FDI. The ISIs between CS1 and CS2 were 18 and 40 ms, whilst the ISI between CS2 and TS was 2.2 ms. A
randomized conditioning-test design was used. First we tested the effects on the test MEP (MEP1) of giving CS1 alone (with an ISI of 40, CS140ms ; or ISI of 18 ms, CS118ms) or CS2
alone (MEP2). Then, the intensity of the TS was re-adjusted so that when CS118ms +TS or
CS140ms +TS were applied the combined effect would elicit a MEP of ~ 1 mV (MEP31mV).
Finally, two conditions were randomly intermingled: CS1(18ms or 40ms) + TS (MEP31mV) and
CS1(18ms or 40ms) + CS2 + TS (MEP4). Fifteen trials were recorded for each condition. The ratio
of MEP4/MEP31mV was the amount of SICI in the presence of CS1(18ms or 40ms), whereas the
ratio MEP2/MEP1 was the baseline SICI.
Data analysis.
All data were expressed as mean ± standard error of the mean (SEM). Student’s paired t tests (two-tailed) were used to compare mean RMT with eyes open and closed obtained from all the participants. Spearman's rho was applied to study the correlation between motor and
26 phosphene threshold. In general, the effects of the CS on MEP amplitude were analysed with separate one-way ANOVAs for any given stimulation intensity and eyes state, with “ISI” (TS alone, CS plus TS at various ISIs) as the main factor. A significant main effect in these ANOVAs was followed by post hoc tests with Bonferroni corrections. Based on the
conditions of the various experiments, we performed preliminary two or three-ways repeated-measures (rm) ANOVAs that accounted for the various factors to be analysed. Supplementary ANOVAs or rmANOVAs were finally carried out as dictated by the specific experiment, to assess the effects of additional confounders, e.g. in Exp. 3, a two-way rmANOVA explored the “time” (Figure 1) x “ISI” interactions. Mauchley’s test was used to examine for sphericity. The Greenhouse-Geisser correction was used for nonspherical data. Occasionally, two-tailed paired Student t tests were used (Exp. 5). A p value < 0.05 was considered significant. Data were analysed using software (SPSS v. 19.0 for Windows; SPSS Inc.).
Results
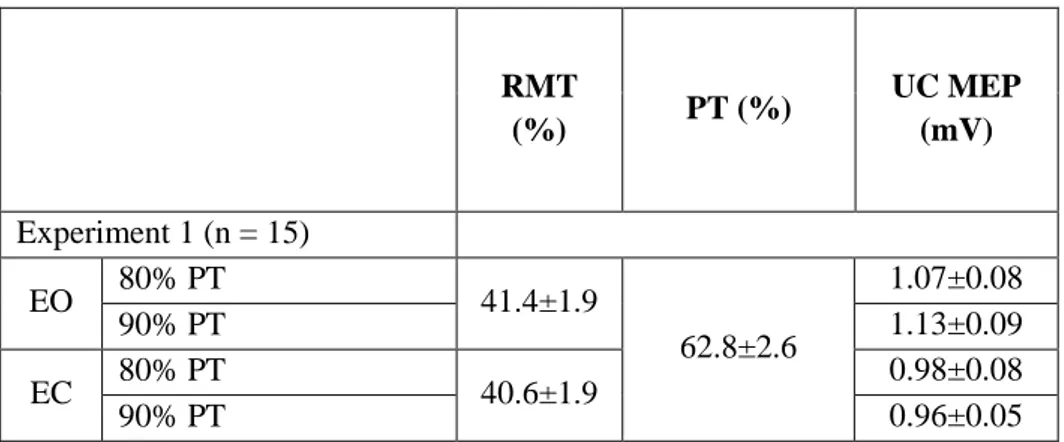
Baseline physiological data are shown in Table 1. No differences were found between each experimental session. All subjects completed the experiments without complications.
Mean RMT with eyes open was 41.4% (range, 30–52%), the same as with eyes closed (40.6%; range 30-53%) (Student t = 0.50, p = 0.63). The phosphene hotspot was located in the midline in all subjects: it was 3 cm above the inion in 10/15 subjects, 2 cm in 4/15 and 4 cm in 1 subject (Figure 2, phosphene hotspot in a representative subject). Phosphenes were reported across both sides of the visual field. Mean PT was 62.8% (range, 40–76%). Motor and phosphene thresholds did not correlate (Spearman's rho = -0.15, p = 0.62 with eyes open; rho = 0.07 p = 0.82 with eyes closed).
Table 1. Physiological data (mean±SEM)
RMT (%) PT (%) UC MEP (mV) Experiment 1 (n = 15) EO 80% PT 41.4±1.9 62.8±2.6 1.07±0.08 90% PT 1.13±0.09 EC 80% PT 40.6±1.9 0.98±0.08 90% PT 0.96±0.05
27
AMT, active motor threshold; CS, conditioning stimulus; EO, eyes open; EC, eyes closed; ISI; interstimulus interval; MEP, motor evoked potential; PT, phosphene threshold; RMS, root mean square; RMT, resting motor threshold; TS, test stimulus.
Figure 2
MRI reconstruction of a single subject. The red mark indicates the orientation of the magnetic field at the phosphene hot spot (striate cortex). The anterior green dot is at the hand area of the left motor cortex.
Experiment 2 (n = 8) CS over control site
36.3±1.6 65.7±2.5 1.11±0.14
CS over phosphene hotspot 1.06±0.05
Experiment 3 (n = 10) TS at rest 39.1±1.6 62.3±2.7 1.09±0.07 TS -300 ms 1.15±0.09 TS -150 ms 1.04±0.07 TS at rest 40.8±2.1 65.2±2.3 1.13±0.10 TS -50 ms 1.10±0.12 TS +50 ms 1.17±0.06 Experiment 4 (n = 10) TS at rest 39.8±1.5 63.5±2.1 1.11±0.06 Auditory task 0.98±0.08 Visual task 1.08±0.05 Experiment 5 (n = 10) AMT (%) TS 35.8±1.4 66.5±3.4 1.15±0.08 ISI 18 ms 1.14±0.08 ISI 40 ms 1.01±0.06
28 Experiment 1 (Conditioning MEPs with stimuli over the phosphene hot spot at rest).
In this experiment, the CS was placed over the phosphene hot spot. The effect of two different intensities of CS was measured on MEPs evoked from the left M1 with eyes open or closed throughout the testing (Figure 3a-d). A preliminary three-way rmANOVA showed a significant main effect of “ISI” (F (5, 67) = 10.93, p < 0.001), but no effect of “eye state” (F (1, 14) = 1.50, p = 0.24) or “intensity” (F (1, 14) = 0.32, p = 0.58) and no significant
interactions (p > 0.05). Thus the time course of MEP suppression was the same at each intensity of CS and was unaffected by eye closure. The graphs also indicate the ISIs in each state where post hoc testing revealed significant (p < 0.05) effects compared to control (Figure 3a-d). Because ISIs of 18 and 40 ms were effective in all states these two intervals were then used in experiments 2-5.
29 Figure 3
A-D, effects of a conditioning stimulus (CS) applied over the phosphene hot spot at different
intensities (80% or 90% PT) and eye states (eyes open or closed) on the test MEPs with subjects at rest. Amplitude of MEPs (mV) is normalized and expressed as a percentage of control. Errors bars indicate SEM. Asterisks indicate a p value < 0.05 on post hoc analysis.
E, effects of changing the location of the conditioning stimulus (CS, 90% of the phosphene threshold,
PT) on the test MEPs with subjects at rest. Grey line: CS applied to a scalp site 3 cm lateral to Pz on the right side. Black line: CS applied to the phosphene hot spot. Amplitude of MEPs (mV) is
normalized and expressed as percentages of control. Errors bars indicate SEM. Asterisks indicate a p value < 0.05 on post hoc analysis.
30 Experiment 2 (Changing the site of the conditioning stimulus).
To confirm that the effect of the CS was spatially specific, we compared the effect of conditioning over the phosphene hot spot with conditioning over a point 3 cm lateral to Pz. Figure 3e shows that stimulation over the parietal site at this intensity had no effect whereas there was clear MEP suppression if the CS was over V1. A two-way rmANOVA showed a significant main effect of “stimulation site” (F (1, 7) = 37.52, p < 0.001), as well as a significant interaction between “stimulation site” and “ISI” (F (8, 56) = 2.475, p = 0.02), indicating that the time course of the effect on MEPs differed between sites. Follow up one-way ANOVAs revealed a significant main effect of ISI (F (9, 63) = 4.73, p < 0.001) at the phosphene hot spot but no effect of ISI over the parietal site (F (9, 63) = 1.65, p = 0.12). On post hoc analysis, the size of the MEP conditioned from V1 was significantly reduced at ISI 18 ms (p = 0.001), 21 ms (p = 0.014) and 40 ms (p = 0.002). No subject reported phosphenes after the control (parietal) stimulus.
Experiment 3 (Visuomotor functional connectivity during a visual RT task)
We next tested whether the effect of the CS varied during the course of a warned simple visual reaction time task. MEPs were conditioned by stimulation over the phosphene hot spot during the warning interval prior to the onset of the RS and at 50 ms following the RS prior to onset of movement. The effects were compared with those seen at complete rest outside the reaction task. MEPs to the M1 stimulus given alone were the same at rest at all intervals tested during the task (one-way rmANOVA, first session of task: (F (3, 27) = 0.62, p = 0.61); second session (F (3, 27) = 0.24, p = 0.87).
Figure 4a plots the size of the conditioned MEP as a percent of the test MEP alone for the two ISIs between CS and TS (18 and 40 ms). There are five bars for each ISI
corresponding to suppression at rest and at -300, -150, -50 and +50 (with respect to the time of the RS) during the reaction task. The percentage suppression of MEP at an ISI of 18 ms was unchanged during the task whereas suppression at ISI = 40 ms gradually shifted to facilitation around the time of the RS.
This was confirmed by a two-way rmANOVA showing a significant main effect of “time” (F (4, 36) = 39.64, p < 0.001), “ISI” (F (1, 9) = 25.40, p = 0.001) and a significant “time” x “ISI” interaction (F (2, 18) = 12.20, p < 0.001). Follow up one-way ANOVAs showed no effect of “time” with an ISI = 18 ms (F (3, 25) = 0.44, p = 0.73) and no effects of “background EMG” both on the unconditioned (F (1, 25) = 0.017, p = 0.90) and conditioned
31 MEPs (F (1, 25) = 0.007, p = 0.93) (Table 2). On the contrary, there was a significant effect at ISI = 40 ms (F (3, 25) = 9.44, p < 0.001) and no effects of “background EMG” on the
unconditioned (F (1, 25) = 0.28, p = 0.60) and conditioned trials (F (1, 25) = 0.32, p = 0.574) (Table 2). Post hoc analysis showed that the conditioned MEP was significantly larger 300 ms (p = 0.034), 150 ms, and 50 ms before and after the RS (p < 0.001).
32 Figure 4
A, effects of the conditioning stimulus (CS, phosphene hot spot) on the test MEP amplitude at rest and
at different times during the behavioural task (-300, -150, - 50 and +50 ms). Left, ISI 18 ms. Right, ISI 40 ms. Amplitude of MEPs (mV) is normalized and expressed as percentage of control. Errors bars indicate SEM.
B, effects of the conditioning stimulus (CS, phosphene hot spot) with an ISI of 40 ms on the MEP
33 (RS). Amplitude of MEPs (mV) is normalized and expressed as a percentage of control. Errors bars indicate SEM.
C, comparison of the effects on short-interval intracortical inhibition (SICI) of conditioning stimuli
applied over the visual cortex with an ISI of 18 and 40 ms. Errors bars indicate SEM.
Experiment 4 (Visuomotor functional connectivity during an auditory RT task)
In the visual task the CS (ISI = 40 ms) facilitated the conditioned MEP 50 ms prior to the RS. In the same subjects, we compared this with the effect when using the same timing in an auditory reaction task. The unconditioned MEP at rest was the same as during the visual and auditory task (50 ms before the RS) (F (2,18) = 1.20, p = 0.323). Figure 4b shows that the CS suppressed the MEP when subjects were tested at rest. However, during performance of the auditory task (-50 ms) there was no longer any effect of the CS on the TS whereas in the visual task it was facilitated. A one-way rmANOVA on the data confirmed that the effect of the CS differed between the three conditions (F (2, 18) = 49.26, p < 0.001). Follow-up
analysis showed that although there was a significant difference between the effect at rest and at the -50 ms time points in both tasks (visual, p < 0.001; auditory, p < 0.001), the effect was larger in the visual task compared with the auditory task (p < 0.001).
Experiment 5 (Effects on SICI)
A CS over the phosphene hot spot increased the amount of SICI compared to baseline (baseline SICI, 77.5%; SICI in the presence of CS, 56%) (Student t = 6.86, p < 0.001) at an ISI of 40 ms, but not at 18 ms (t = 0.254, p = 0.80) (Figure 4c). As a result of intensity re-adjustment, the MEP31mV size was 1.01 ± 0.1 mV (ISI 40 ms) and 1.14 ± 0.1 (ISI 18 ms), i.e.
it was not statistically different from the MEP1 (1.15 ± 0.1 mV) (F (2, 18) = 1.11, p = 0.35).
Discussion
The present data show that TMS over the occipital region affects excitability of M1 when tested 18-40 ms later. Since the TMS coil was located over the optimal point to elicit stationary phosphenes (Afra et al., 1998; Stewart et al., 2001; Franca et al., 2006), and an intensity below phosphene threshold was used, we suggest that the effect depends on activation of primary visual cortex (V1). We assumed that both hemispheres were activated since the coil position was on the midline in all the subjects and phosphenes were reported
34 across both sides of the visual field. The effect was present at both 80% and 90% phosphene threshold (PT) but was not significantly influenced by whether the eyes were open or closed. It was not caused by the auditory click made by the coil when discharged (Furubayashi et al., 2000), as it was no longer present when the site of stimulation was moved 3 cm lateral to Pz.
Our results confirm the evidence reviewed in the Introduction that activity in visual cortex can modulate corticospinal excitability at short latency in subjects at rest. One of the limits of previous approaches is that they used natural visual stimuli and there is some
uncertainty about the precise time at which these arrive in visual cortex. Most studies indicate that the first occipital visual evoked potentials begin around 35-40 ms (ffytche et al., 1995), while intracranial electrodes recorded a latency of about 31-33 ms (Ducati et al., 1988). Using these figures, the earliest TMS effect at ISI = 18 ms is compatible with the data on flash evoked suppression of MEPs noted by Cantello and colleagues at 55-70 ms after a flash (Cantello et al., 2000b; Makin et al., 2009) but later than the very rapid (7 ms) visuo-motor connectivity described in photic reflex myoclonus (Nakashima et al., 1985; Shibasaki & Neshige, 1987; Artieda & Obeso, 1993; Kanouchi et al., 1997). The shorter occipitomotor conduction time in the patients might well be explained by a pathological exaggeration of the normal physiological mechanism, resulting in a shorter latency response and a shift from inhibition to excitation of the motor cortex. A similar connection might explain the spread of the epileptic discharge from the hyperexcitable visual cortex to the motor cortex in
photosensitive idiopathic epilepsies (Strigaro et al., 2012; Strigaro et al., 2013).
The later phase of interaction at ISI = 40 ms is compatible with the earliest signs of visual effect on motor cortex excitability described in a number of behavioural studies (e.g. 70 ms in Makin et al., 2009). Longer latency visuo-motor effects have also been described by Suppa et al (2013) who showed that it was possible to induce long-term potentiation (LTP) and depression (LTD)-like plasticity in the primary motor cortex in healthy humans after repetitive pairing of a patterned visual stimulus and a TMS stimulus at specific time intervals around the latency of the P100 evoked potential. These varied between 40 and 140 ms after the individual P100 latency (i.e. between 140 and 240 ms after onset of the visual stimulus) (Suppa et al., 2013) and are therefore longer than the ISIs we deal with in the present paper.
Apart from estimates of transit time, our data do not provide any information about the possible anatomical pathways that might mediate these functional effects. Connections in the dorsal visual stream via parietal and premotor cortex could provide one route. In addition, diffusion tensor imaging (DTI) techniques (Catani et al., 2002) and anatomical dissection studies (Martino et al., 2010; Sarubbo et al., 2011) demonstrated the existence in humans of
35 the inferior fronto-occipital fascicle (IFOF), a long associative bundle connecting the occipital cortex and other posterior areas to the frontal lobe (Martino et al., 2010). Although often seen as playing a role in transmitting information from frontal cortex to occiput for the purposes of “top down” control, the IFOF might also contain a direct efferent pathway from the occipital cortex, which can rapidly transmit visual information to the frontal regions (Martino et al., 2010).
Most long range cortico-cortical connections are thought to be excitatory, as in the transcallosal pathway (Asanuma & Okuda, 1962; Ferbert et al., 1992). The fact that we obtained an overall inhibitory effect in the present experiments would therefore be compatible with the idea that these excitatory projections synapse onto inhibitory interneurones in M1 that suppress corticospinal excitability. This is supported by our findings that a CS over the visual cortex increased SICI in the left M1, at least for ISI = 40 ms (not 18 ms). SICI is thought to test a GABAa-ergic form of intracortical inhibition in motor cortex (Ziemann et al., 1996a). Thus the fact that SICI is made more effective by stimulation over visual cortex suggests that occipital input has access to inhibitory circuits in M1 and that this may
contribute to the MEP suppression we have described. Visuo-motor suppression at 18 ms presumably does not depend on activity in the same set of interneurones since it has no effect on SICI. However, there are a number of possibilities that can be tested with TMS methods, including a GABAb-ergic system (tested with the long interval intracortical inhibition
paradigm) (Valls-Sole et al., 1992; Werhahn et al., 1999) and a further pathway modulated by cholinergic input (tested with short afferent inhibition) (Tokimura et al., 2000). Further work could tease apart these possibilities. At the present time, we conclude that the two phases of inhibition are caused by activity in two distinct pathways.
To assess the potential physiological role of this visuo-motor pathway, we examined connectivity during a visual RT task using ISIs of 18 and 40 ms since they produced the most consistent inhibitory effects. The task had no effect on MEP suppression at ISI = 18 ms at any of the time points studied during the task. This was not true for ISI = 40 ms. The inhibitory effect at rest (MEP reduced by 30-40%) gradually reversed into facilitation during movement preparation. Facilitation appeared to begin about 150 ms prior to the RS and was very clear at +50 ms (MEP increased by 40-50%). This contrasts with the results in an equivalent auditory reaction task. The usual visuo-motor suppression observed at rest was absent 50 ms prior to the RS, but there was no clear facilitation of the MEP as in the visual task. We suggest that rapid visuomotor connectivity is suppressed during an auditory task but becomes facilitatory during a visual task, perhaps improving access of visual input to motor areas. It is unclear
36 why connectivity at ISI = 18 ms was unaffected in the visual reaction task. Nevertheless, the finding does confirm the conclusion that these two effects are mediated by quite separate pathways.
During the RT tasks, we saw no significant changes in the unconditioned MEP at the time intervals we studied. In some previous studies, the MEP has been suppressed in the interval between the WS and RS (Hasbroucq et al., 1997; Touge et al., 1998; Davranche et al., 2007). However, suppression is best observed when the WS-RS interval is constant and subjects can anticipate precisely when the RS is about to be delivered (Touge et al., 1998). In the present task the timing of the RS was not predictable since it was randomised to come 550-650 ms after the WS. MEPs also are known to increase following the RS prior to onset of EMG. However the effect usually starts more than 50ms after the RS which was beyond the time range studied in the present experiments.
There was one slightly unexpected feature of the present results: the excitability of the occipito-motor connection was the same when it was tested with the eyes open or closed. Previous work had shown that transient removal of vision increases the amplitude of early components of the flash-evoked EEG potential (Cantello et al., 2011), and we had initially anticipated that it might also increase the size of any effects we observed. However, the amplitude of the VEP may well be influenced by subcortical rather than cortical changes. For example, eye closure produces effects on retinal sensitivity which could affect the flash-evoked input without affecting the excitability of V1 to TMS. We propose that although ambient light levels may affect the excitability of inputs to visual cortex, they do not influence the excitability of the output elements activated by TMS. One study noted that blindfolding increases excitability of M1, as tested by its effect on the amplitude of TMS-evoked muscle twitches (Leon-Sarmiento et al., 2005). The effect was larger after 30 min of blindfolding than immediately after eye closure. In the present experiments the eyes were only closed for a short period and we did not detect any change of RMT or baseline MEPs between open and closed eyes. We are less certain why the responses to conditioning stimuli of 80% and 90% PT were similar. It seems possible that this was due to a lack of statistical power, given the tendency for more inhibition to occur at 90% PT whether the eyes were open or closed.
37 Conclusions
Our findings support the existence of physiologically relevant occipitomotor connections, which can be activated by means of TMS. They may contribute to rapid
integration of visual input into motor tasks as well as being involved in the spread of a seizure from visual to motor areas in certain types of visual epilepsy.
38
OVERACTIVE VISUOMOTOR CONNECTIONS UNDERLIE THE
PHOTOPAROXYSMAL RESPONSE
Strigaro G, Falletta L, Varrasi C, Rothwell JC, Cantello R. Epilepsia. 2015;56:1828-35.
Abstract
Objective. The photoparoxysmal response (PPR) involves rapid spread of epileptic activity from visual to parietal and frontal areas. We used a transcranial magnetic stimulation (TMS) technique to assess the physiological connections between primary visual (V1) and motor (M1) areas in patients with idiopathic generalized epilepsy (IGE). We hypothesized that in PPR-positive patients, M1 would respond excessively to inputs from V1.
Methods. Eleven photosensitive patients with IGE who had a PPR at the time of the study were compared with 10 similar patients without a PPR, and with 11 healthy subjects of similar age and sex. The connection between V1 and M1 was assessed in resting participants by delivering a conditioning stimulus (CS) over the phosphene hotspot of the visual cortex (intensity 90% phosphene threshold, PT) followed at random interstimulus intervals (ISIs) (15, 18, 21, 24, 27, 30, 35 and 40 ms) by a test stimulus (TS) over the left motor cortex to elicit a motor evoked potential (MEP) of ~ 1 mV from the right FDI.
Results. In healthy subjects, a CS over V1 suppressed M1 at ISIs between 18 and 40 ms. Similar effects occurred in IGE patients without a PPR. This was not true in PPR-positive IGE patients, in whom this type of physiological inhibition was significantly (p<0.05) reduced.
Significance. IGE patients with a PPR have an overactive functional response of M1 to inputs travelling from V1. This may represent one core factor for the anterior spread of the PPR itself and for the origin of the abnormal epileptic motor phenomenon, such as myoclonus.
39 Introduction
Epileptic photosensitivity is an exaggerated neural response to visual stimuli. Its most elementary and common form is the photoparoxysmal response (PPR) to intermittent light stimulation (ILS). Among patients with epilepsy, a PPR is found in about 10–20% of children and 5–10% of adults, and it is more common among female patients at any age (Verrotti et al., 2005). It is usually associated with idiopathic generalized epilepsies (IGE), notably juvenile myoclonic epilepsy (JME), and it is a diagnostic criterion of the syndrome of eyelid myoclonia with absences (EMA) (Striano et al., 2009).
There are few studies of the pathophysiology of PPR. Defective inhibition in the visual system has been recently described as one background factor contributing to the PPR (Strigaro et al., 2012). A second factor may be exaggerated transmission of visual inputs to other brain areas. For example, previous authors have described an exaggerated response of M1 to visual inputs that might have a pivotal role in spread of activity during the PPR (Artieda & Obeso, 1993; Verrotti et al., 2005). We recently proposed a paired transcranial magnetic stimulation (TMS) method to study the time course of visual inputs on M1. Conditioning stimuli delivered to the occipital region suppressed M1 activity while the subject was at rest, while it reversed into facilitation in the context of a visuomotor reaction task (Strigaro et al., 2015c).
The present study was designed to examine the excitability of these connections in epileptic patients with a PPR.
Materials and Methods
Methods were fully described in a previous paper (Strigaro et al., 2015c). Briefly, all neurophysiologic studies took place between 2:00 and 6.30 p.m. in a quiet room, at a standard temperature of 22°C. Subjects lay comfortably in a dimly illuminated (=ca. 30 Lux) room.
Subjects
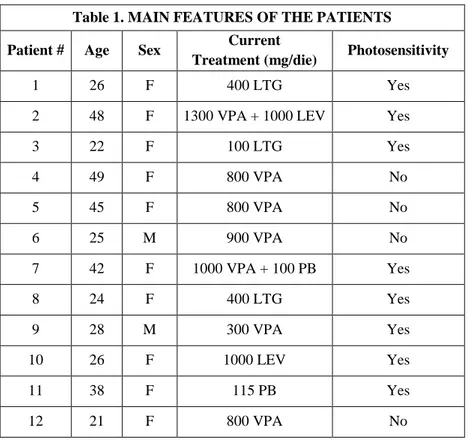
We studied a total of 21 adult patients with IGE referred to the Epilepsy Clinic of the University Department of Neurology, Novara, Italy: 11 had IGE with PPR (9 women, mean age 36.5 years, standard deviation [SD] 14.3) and 10 had IGE without PPR (7 women, mean age 35.1 years, SD 11.4). They were selected because their updated profile, in the Clinic database, included the terms “idiopathic generalized epilepsy” with or without
40 (6 women, mean age 34.2 years; SD 8.5). They had no family or personal history of
neurologic disease or epilepsy. Reportedly, both patients and controls had not been taking neuroactive drugs (alcohol and caffeine included) for 72 h prior to the study, except for the patient antiepileptic treatment. Their general, neurological and ophthalmological
examinations were normal. All subjects were right-handed based on the Edinburgh
Handedness Inventory and gave written informed consent. Experiments were approved by the local Ethics Committee and were performed in accordance with the Declaration of Helsinki.
Patient features
These are reported in Table 1. Eleven of the 21 patients were classified as photosensitive (IGE+PPR) because they showed a PPR to ILS, which did never entail clinical phenomena. Of this group, seven patients had a definite diagnosis of juvenile myoclonic epilepsy (JME) and one had a diagnosis of EMA, whereas we labelled the remaining three as (undefined) “photosensitive IGE”. Ten of the 21 patients were not photosensitive (IGE-PPR), and just three of them had a definite diagnosis of JME. In general, their clinical course was favourable, since 19 of the 21 patients reported being seizure-free, whereas one patient from each group still had isolated myoclonia exclusively upon awakening (n. 10 and 17). All were on a standard antiepileptic treatment. Valproate, alone or in combination with levetiracetam, was the most frequent choice.