Proteomic analysis as a tool for investigating arsenic
stress in
Pteris vittata roots colonized or not by arbuscular
mycorrhizal symbiosis
Elisa Bona
a,⁎
, Francesco Marsano
a, Nadia Massa
a, Chiara Cattaneo
a, Patrizia Cesaro
a,
Emanuele Argese
b, Luigi Sanità di Toppi
c, Maria Cavaletto
a,1, Graziella Berta
a,1aDipartimento di Scienze dell'Ambiente e della Vita, Università del Piemonte Orientale“A. Avogadro”, Alessandria, Novara, Vercelli, Italy bDipartimento di Scienze Ambientali, Università Ca' Foscari, Venezia, Italy
cDipartimento di Biologia Evolutiva e Funzionale, Università di Parma, Parma, Italy
A R T I C L E I N F O
A B S T R A C T
Article history:
Received 12 January 2011 Accepted 23 March 2011 Available online 30 March 2011
Pteris vittata can tolerate very high soil arsenic concentration and rapidly accumulates the metalloid in its fronds. However, its tolerance to arsenic has not been completely explored. Arbuscular mycorrhizal (AM) fungi colonize the root of most terrestrial plants, including ferns. Mycorrhizae are known to affect plant responses in many ways: improving plant nutrition, promoting plant tolerance or resistance to pathogens, drought, salinity and heavy metal stresses. It has been observed that plants growing on arsenic polluted soils are usually mycorrhizal and that AM fungi enhance arsenic tolerance in a number of plant species. The aim of the present work was to study the effects of the AM fungus Glomus mosseae on P. vittata plants treated with arsenic using a proteomic approach. Image analysis showed that 37 spots were differently affected (21 identified). Arsenic treatment affected the expression of 14 spots (12 up-regulated and 2 down-regulated), while in presence of G. mosseae modulated 3 spots (1 up-regulated and 2 down-regulated). G. mosseae, in absence of arsenic, modulated 17 spots (13 up-regulated and 4 down-regulated). Arsenic stress was observed even in an arsenic tolerant plant as P. vittata and a protective effect of AM symbiosis toward arsenic stress was observed.
© 2011 Elsevier B.V. All rights reserved. Keywords:
Arsenic tolerance Proteome Roots Pteris vittata
Arbuscular mycorrhizal fungi Thiols
1.
Introduction
Arsenic (As) is a metalloid occurring in the earth crust and naturally released in the environment as consequence of erosion, volcanic emissions, etc. Elevated arsenic concen-trations in soils have been found also in areas impacted by mining and smelting industries, by coal burning[1]and by the use of arsenic containing agrochemicals [2]. Arsenic is highly toxic to most biological systems and carcinogenic for
man [3] and can diffuse in soils and groundwater, so entering the food chain through drinking water and con-taminated vegetables[4].
Plants have different sensitivity to arsenic, with legumes known to be highly sensitive[5]. Pteris vittata L. (Chinese brake fern), the first known arsenic-hyperaccumulating plant, is able to remove large amounts of arsenic from soil [6]. The fern shows interesting growth characteristics, including a large biomass, extensive root system, high growth rate and ⁎ Corresponding author at: Dipartimento di Scienze dell'Ambiente e della Vita, Università del Piemonte Orientale “A. Avogadro”, Viale T. Michel 11, 15121 Alessandria, Italy. Tel.: + 39 0131360210; fax: + 39 0131360243.
E-mail address:[email protected](E. Bona). 1These authors have contributed equally to the work.
1874-3919/$– see front matter © 2011 Elsevier B.V. All rights reserved. doi:10.1016/j.jprot.2011.03.027
a v a i l a b l e a t w w w . s c i e n c e d i r e c t . c o m
perennial habit. Typical of hyperaccumulators, arsenic in P. vittata is mostly concentrated in the fronds [6,7] even if arsenic concentration in roots can be high (near 100 mg/kg). This arsenic concentration can be considered very toxic for the majority of plant species but not for P. vittata that can tolerate up to 10,000 mg/kg [8]. By contrast, as reported in Kabata-Pendias 2001[9], in plant tissues, non toxic arsenic concen-tration range between 1 and 1.7 mg/kg (ppm) and toxic concentration range between 5 and 20 mg/kg[9]. However, in spite of the very high capability of P. vittata to tolerate arsenic, this tolerance is not complete, as recently shown by proteome analyses of the fronds[7].
Roots are the sole access point to below-ground trace elements and as such they play a vital role in hyperaccumula-tion. Their role as an effective trace element scavenger is achieved through interactions in the rhizosphere with bacte-ria and fungi, among which arbuscular mycorrhizal (AM) fungi, a monophyletic group of soil fungi in the Glomeromy-cota phylum[10]that colonize most terrestrial plants[11,12]. This symbiosis not only plays a central role in soil nutrient uptake but also improves plant tolerance to biotic and abiotic stresses[13–15].
Proteomic analysis has been used extensively to investi-gate the protein expression pattern under several abiotic stresses. The expression pattern of maize root proteins in response to arsenic stress has been described for the first time by Requejo and Tena (2005) [16] and the arsenic-induced differentially expressed proteins in rice roots have been described[17]. Some information exists on protein expression profile induced by AM fungi in plant roots [18–20] and a number of reports show the influence of AM fungi and other soil microorganisms in protection against protein modifica-tion induced by heavy metals[7,21,22]. Nevertheless, as far as we know, no data are available on AM fungi effects on arsenic absorption at root level in the fern P. vittata and on physiological changes and protein expression profile modifi-cations induced by these fungi. Therefore, the aim of this study was to investigate the effects induced in the protein expression profile of P. vittata roots by the AM fungus Glomus mosseae in presence and in absence of arsenic contamination.
2.
Materials and methods
2.1. Experimental design and plant material
The plants used in these experiments were obtained from spores collected at the Botanical Garden of Genoa (Italy) and grown in controlled conditions (16/8 h light/dark photoperiod, 150μmol/m2s light irradiance and 24 °C/20 °C light/dark thermoperiod). At least twelve replicates per each treatment were analyzed.
The experimental design included four different theses: control plants (C) (plants grown on quartz sand fed only with Long Ashton nutrient solution [23] containing 32μM phos-phate (added as NaH2PO4·2H2O) three times a week); arsenic treated plants (As) (plants fed once a week with 25 mL of nutrient solution containing 334μM arsenate (25 mg/l arsenic added as NaHAsO4·7H2O) pH 5.6, and two times a week with normal nutrient solution); G. mosseae mycorrhizal plants (Gm)
(plants inoculated with the AM fungus G. mosseae and fed three times a week with nutrient solution); G. mosseae treated with arsenic plants (GmAs) (plants inoculated with G. mosseae fungus and fed with arsenic solution once a week as shown before). Plants (indicated as Gm and GmAs) were inoculated with G. mosseae inoculum (Inoq GmbH, Solkau, Schnega, Germany) mixed 10% (v/v) with quartz sand (full volume) before transplanting. Arsenic treatments started one month after transplanting.
After 60 days of arsenic treatment, plants were harvested; roots were separated from fronds and washed with deionized water. At least twelve plants per each treatment were analyzed. Root and frond fresh weights were taken and a part of root samples was conserved in 50% ethanol for mycorrhizal evaluation. Part of the samples (roots and fronds) was dried at 60 °C for 72 h and used for arsenic concentration analysis and a part was used for glutathione (GSH) and phytochelatins extraction. Finally the remaining parts of roots were frozen in liquid nitrogen and stored at−80 °C for proteomic analysis.
2.2. Evaluation of mycorrhizal infection
Samples of roots of 1 cm in length were subjected to clarification in 10% KOH at 60 °C for 1 h and at room temperature for one week, due to the high content of tannins, and stained with 1% methyl blue in lactic acid; analysis was performed using optical microscopy. Twelve replicates were performed.
The percentage of root colonization (M%), percentage of arbuscules (A%) and frequency of mycorrhization (F%) were measured according to Trouvelot et al. (1986)[24].
2.3. Determination of arsenic concentrations in plant tissues
Milli-Q (Millipore) water with a resistivity of 18.2 MΩ cm was used for the preparation of reagents and standards. High purity reagents were used for sample digestion. Pyrex, polyethylene and Teflon containers were treated before use with 0.1 M HNO3over 48 h and then washed thoroughly with Milli-Q water.
Aliquots of about 0.15 g of plant tissue samples, accurately weighted, were digested completely with 2 ml of concentrated H2SO4, 2 ml of 30% H2O2and 4 ml of H2O in closed Teflon PFA vessels for 30 min at T = 170 °C, using a microwave sample preparation system (CEM MDS 2000) with a maximum operating power of 630 W, equipped with a temperature control device. The resulting digests were quantitatively transferred into 25-ml volumetric flasks and made up to volume with H2O. Arsenic determination was performed by hydride generation-atomic absorption spectrometry (HG-AAS) using a Varian SpectrAA-250 Plus spectrometer equipped with a Varian VGA-77 vapor generation accessory.
2.4. Separation and quantification of GSH and phytochelatins
Root and frond samples (300 mg each) were homogenized in a mortar in the presence of ice-cold 5% (w/v) 5-sulfosalicylic acid
1339
containing 6.3 mM diethylene-triaminepenta-acetic acid (DTPA), mainly following the method of De Knecht et al. (1994)[25]. After centrifugation at 10,000× g for 10 min at 4 °C, the supernatants were filtered through Minisart RC4 0.45μm filters (Sartorius, Goettingen, Germany) and immediately assayed by an autosampler-equipped HPLC system (model 200/225, Perkin-Elmer, Norwalk, CT). Thiol peptide com-pounds were separated through a reverse-phase Purospher LiChroCART C18 column (Merck GmbH, Darmstadt, Germany), by injecting 200μL of each extract. Separation was achieved by means of a 0–26% acetonitrile gradient (Merck, Germany) containing 0.05% trifluoroacetic acid, at a flow rate 0.7 mL min− 1. Thiol–peptide compounds were detected by post-column derivatization with 300μM Ellman's reagent [5,5′dithio(2-nitrobenzoic acid)] at 412 nm (Series 200 detector, PerkinElmer). Identification of GSH and individual phytoche-latins was based on the comparison of their retention times with standard GSH (Merck) and phytochelatin samples from Silene vulgaris. A calibration curve for standard-SH groups was used for quantification of thiol peptides in extracts.
2.5. Protein extraction and 2DE analysis
Proteins were extracted according to Bestel-Corré et al. (2002)
[18], with modifications in solubilization process. Briefly, 2 g of P. vittata roots were ground with liquid nitrogen and homog-enized in 10 mL of 0.5 M Tris–HCl, pH 7.5 lysis buffer, contain-ing 0.7 M sucrose, 50 mM EDTA, 0.1 M KCl, 10 mM thiourea, 1% protease inhibitor cocktail for plant tissue (Sigma), and 2% v/v β-mercaptoethanol. Ten milliliters of Tris–HCl pH 8.8 saturat-ed phenol (Fluka) were addsaturat-ed. After mixing for 45 min the phenolic phase was separated by centrifugation and rinsed with another 10 mL of lysis buffer. After centrifugation, the phenolic phase was separated for the second time. Proteins were precipitated overnight at −20 °C after adding five volumes of methanol containing 0.1 M ammonium acetate. The pellet recovered by centrifugation, was rinsed with cold methanol and acetone. Finally, the pellet dried for 10 min under vacuum, was resuspended in solubilization buffer (7 M Urea, 2 M Thiourea, 100 mM DTT, 4% CHAPS, 2% v/v IPG Buffer (GE Healthcare Bio-Sciences, Cologno Monzese (MI), Italy))[26]
and centrifuged at 16,000× g, 4 °C, 5 min. Protein content of the samples was quantified by the method of Bradford (1976)[27]. 550μg of protein extracts were used for analytical/prepar-ative gels. IEF was performed on IPG strips in an IPG-Phor unit (GE Healthcare Bio-Sciences) on precast 13 cm non-linear pH 3–11 strips. The second dimension was carried out with a Protean Plus Dodeca Cell (BioRad); 12% gels were run at 10 °C under constant amperage (30 mA). At least ten replicates were run, two analytical replicates per five biological replicates. Gels were stained with Blue Silver colloidal Coomassie, according to Candiano et al. (2004)[28], and scanned in a GS 710 densitometer (Bio-Rad). The gel images were recorded and computationally analyzed using SameSpot (Progenesis). After normalization and background subtraction, a matchset was created for C (control), As (arsenic), Gm (plant inoculated with G. mosseae), GmAs (plant inoculated with G. mosseae and treated with arsenic).
The differential expression analysis was performed com-paring the quantity of matched spots in the As treated versus
the control gels, Gm gels versus control gels, GmAs gels versus Gm and As. The program created a quantitative table with all normalized optical spot densities that allowed us to perform an analysis of variance (ANOVA) to detect statistical differences between the quantitation of the same spot in all replicates. We performed ANOVA using StatView 4.5 (Abacus Concepts, Berkeley, CA, USA) and p≤0.05 was adopted as the level of significance.
2.6. Protein identification by nano-LC-Q-TOF MS/MS For MS analysis, spots of interest were cut from the gel and destained overnight with a solution of 25 mM ammonium bicarbonate and 50% ACN. The proteins were in-gel digested with trypsin (Roche, Segrate, Milano, Italy) as described by Hellmann et al. (1995)[29]. All nano-HPLC-MS/MS experiments were performed on a Q-TOF mass spectrometer Q-Star XL (AB Sciex, Concord, Ontario Canada) controlled by the Analyst QS 1.1 software (AB Sciex) connected to an Ultimate 3000 nano-HPLC system, managed by Chromeleon software, version 6.70 SP2a (LC Packings, Amsterdam, NL). The peptide pellets were resuspended immediately before analysis in 10μL of solvent A (95% v/v water, 5% v/v ACN, 0.1% v/v formic acid). Five microliters of each sample were loaded onto the precolumn, 300μm i.d.×5 mm, C18 PepMap, 5μm beads, 100 Å, (LC-Packings) and washed for 5 min using a flow rate of 40μL/min solvent A. The peptides were subsequently eluted at 300 nL/min from the precolumn over the analytical column, 15 cm×75μm, C18 PepMap100, 3 μm beads, 100 Å (LCPackings) using a 35 min gradient from 5 to 60% solvent B (5% v/v water, 95% v/v acetonitrile, 0.1% v/v formic acid) delivered by the LPG-3600 micro pump at 300μL/min and splitted at 1:1000 ratio in the flow manager FLM-3100 (LC-Packings). The analytical column was connected with a 15μm inner diameter Silica Tip (Pico Tip) nanospray emitter (New Objective, Woburn, MA). The spray voltage (usually set between 1800 and 2000 V) was applied to the emitter through the stainless steel union and tuned to get the best signal intensity using a standard BSA tryptic digest (Laser Biolabs, Sophia-Antipolis, France) before every samples' batch submission. The QStar-XL was operated in information-dependent acquisition (IDA) mode. Mass spectra were acquired from 400 to 1800 m/z. The two most intense ions with charge states between 1 and 4 in each survey scan were selected for the MS/MS experiment. MS/MS data were acquired from 60 to 1800 m/z. Each acquisition cycle was comprised of a 1 s MS and a 3 s MS/MS. The MS to MS/MS switch threshold was set to 15 counts per second (c.p.s.). All precursor ions subjected to MS/MS in the previous cycle were automatically excluded for 60 s using a 3 amu.
2.7. Homology-driven proteomics
Mascot Distiller (Matrix Science, London, UK) was used to create peak lists from MS and MS/MS raw data. Mascot Server (Matrix Science) was used for database searching versus NCBInr. Carbamidomethylation of cysteine residues, oxida-tion of methionine, deamidaoxida-tion of asparagine and glutamine were set as possible variable modifications and trypsin was selected as protease. One missed trypsin cleavage site was allowed, and the peptide MS and MS/MS tolerance was set respectively to 100 ppm and 0.2 Da.
Widely accepted positive identifications of proteins by MS/MS analysis require a minimum of two unique peptides with at least one peptide having a significant ion score. Considering that few protein sequences of P. vittata are present in the database, sequence tags were manually interpreted from the ESI-MS/MS spectra if we obtained a hit without a significant score to confirm the hypothetical assignment. We also accepted hits identified by at least one peptide with a significant ion score according to the MASCOT MS/MS ion search algorithm as being confident assignments. All single-peptide hits and hits matched by a few poor scoring peptides were considered borderline and were independently analyzed in sequence similarity searches[30]. 2.8. Statistical analysis
Statistical analyses were performed with StatView 4.5 (Abacus Concepts, Berkeley, CA, USA); data on root and frond dry weight, As concentration in all plant organs, GSH and phytochelatin concentration in root and frond and spot optical densities were compared by ANOVA, followed by a post-hoc PLSD test with p≤0.05 as a significance cut off.
3.
Results
3.1. Effect of arsenic and AM fungi on morphological parameters
Ferns were treated weekly (after a month of acclimation), for sixty days, with 25 mg/l of arsenic, a non-lethal dose for P. vittata, in order to evaluate the effect of chronic arsenic contamination. As plants showed a statistically significant higher biomass both in roots and in fronds compared to C plants (Fig. 1). Gm plants showed a statistically significant higher dry weight compared to C plants both in frond but especially in roots that showed a dry biomass about three times higher compared to control plants (C). Arsenic induced a statistical significant increase of root biomass in Gm plants (GmAs) compared to the As ones.
3.2. Mycorrhizal colonization
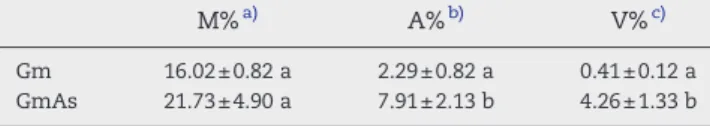
Percentages of root colonization (M%) were 16% in Gm plants (Table 1). Arsenic induced an increase of M% in GmAs plants,
but not statistically significant. In GmAs plants the percent-ages of both A% and V% were higher in comparison to Gm plants.
3.3. Arsenic concentration in fern tissues
P. vittata hyperaccumulated arsenic in fronds as shown in
Fig. 2. After sixty days of arsenic treatment, the metalloid concentration was 5066.33 (± 769.68) mg/kg in fronds and 92.81 (± 8.60) mg/kg in roots of non-mycorrhizal plants treated with arsenic (As plants). Fungal colonization decreased arsenic concentration in roots but not in fronds (Fig. 2). In particular, arsenic concentration was 4896.33 (± 307.97) mg/kg in fronds and 35.13 (± 2.51) mg/kg in roots of GmAs plants.
3.4. As induction of thiol–peptide compounds
In C plants, GSH concentrations of 5.1 and 9.1 nmol SH g−1FW were measured in roots and fronds, respectively. Arsenic (As) treatment induced a significant increase of GSH concentration in fronds (16.1 nmol SH g−1FW), but not in roots (4.7 nmol SH g−1 FW). Control GSH concentration in mycorrhizal plants (Gm) was 3.8 nmol SH g−1FW in roots and 12.6 nmol SH g−1FW in fronds. An upward trend in GSH concentration (however not statistically significant) appeared to be produced by As treatment in fronds of mycorrhizal plants (16.7 nmol SH g−1 FW), whereas the GSH content in As-exposed mycorrhizal roots remained substantially constant (5.4 nmol SH g−1FW) (Fig. 3).
Following As exposure, phytochelatins were induced only in fronds, but not in roots, and PC2 was the sole oligomer detected. PC2concentration was equal to 14.9 nmol SH g− 1FW in As plants. AM symbiosis did not induce a significant increase of PC2(13.8 nmol SH g− 1FW) in GmAs.
3.5. Comparative protein expression analysis
Comparative analysis of the root proteome was performed on colloidal Coomassie-stained 2-DE maps. The positions of the differentially expressed spots are indicated in the representa-tive map ofFig. 4. Image analysis (SameSpot) revealed that 470 spots were reproducibly separated. Image analysis and statistical validation indicated statistical significant variation of 37 spots (see Fig. 1S for all replicated gel images and Table 1S for optical density and p values) in all treatments (As, Gm, and GmAs). 59.5% (21 protein spots) of modulated spots were MS/ MS identified, since the P. vittata genome is still unsequenced. Fig. 1– Root and frond dry weights (g) of Pteris vittata plants.
Equal letters (a, and a) indicate no significant statistical differences and different letters (a, and b) indicate significant statistical differences. C (control plant), As (arsenic treated plant), Gm (plant inoculated withG. mosseae), and GmAs (plant inoculated withG. mosseae and treated with arsenic). Averages of twelve replicates are shown for each treatment.
Table 1– Evaluation of mycorrhizal colonization.
M%a) A%b) V%c)
Gm 16.02 ± 0.82 a 2.29 ± 0.82 a 0.41 ± 0.12 a GmAs 21.73 ± 4.90 a 7.91 ± 2.13 b 4.26 ± 1.33 b Equal letters (a, a) indicate no significant statistical differences and different letters (a, b) indicate significant statistical differences. a) M%: Mycorrhizal degree: percentage of root system colonized by the fungus (hyphae, arbuscules and vesicles).
b) A%: Arbuscul percentage. c) V%: Vesicle percentage.
1341
Table 2 lists the identified proteins in alphabetical order. Table 2S of supporting information lists the detail of each protein identification including peptide sequence and score, while in Table 3S alignments from Blast results are shown.
Fig. 5shows for all the identified spots the details for C, As, Gm and GmAs maps and relative graphs of the ratio of protein abundance in As maps versus C maps (As/C), Gm maps versus C maps (Gm/C), GmAs maps versus Gm maps (GmAs/Gm) and versus As maps (GmAs/As).
3.6. Arsenic effect on P. vittata root proteome
Among the identified proteins (21), arsenic modulated the expression of 14 compared to the control (As/C). In particular 12 were up-regulated (enolase (775), 3 forms of malate dehydrogenase (903, 2422, and 2438), 3 forms of glyceralde-hyde 3-P dehydrogenase (905, 994, and 2431), glutamine synthetase (920), GTP-binding protein yptV4 (1657), aldehyde dehydrogenase (2416), S-adenosylmethionine synthase (2419), F1-ATP synthase beta subunit (2453)) and 2 down-regulated (ATP-synthase beta subunit (1324) and chaperonin 60 alpha chain (2405)).
3.7. Effect of AM symbiosis on root protein profiles AM symbiosis induced the statistical significant modulation of seventeen protein spots compared to C plants (Gm/C); in particular, 13 protein spots were up-regulated (enolase (775),
putative acetyl-CoA carboxylase (781), 3 forms of malate dehydrogenase (903, 2422, 2438), 2 forms of glyceraldehyde 3-P dehydrogenase (905, 945), phenylalanine-tRNA ligase (940), GTP-binding protein yptV4 (1657), 26 S proteasome non-ATPase regulatory subunit (1755), translationallly controlled tumor protein (1794), aldehyde dehydrogenase (2416), F1-ATP synthase beta subunit (2453)) and 4 down-regulated (ATP-synthase beta subunit (1324), chaperonin 60 alpha chain (2405), endo-1,4-beta glucanase (2412) and ribosomal protein (2478)).
3.8. Synergistic effect of arsenic and G. mosseae mycorrhization on root proteome
Arsenic induced in mycorrhizal plants (GmAs/Gm) the statis-tical significant modulation of 3 protein spots, 2 down-regulated and 1 up-down-regulated; in particular a glyceraldehyde 3-P dehydrogenase (905) and 26 S proteasome non-ATPase Fig. 2– Arsenic concentration in fronds and roots of Pteris vittata plants treated or not with 25 mg/l of arsenic and inoculated or not withGlomus mosseae (Gm). Concentration is expressed in mg/kg dry weight (ppm). Equal letters (a, and a) indicate no significant statistical differences and different letters (a, and b) indicate significant statistical differences. Averages of twelve replicates are shown for each treatment.
Fig. 3– Glutathione (GSH) concentration (nmol SH g-1 FW) in roots and fronds ofP. vittata plants. Equal letters (a, and a) indicate no significant statistical differences and different letters (a, and b) indicate significant statistical differences. C (control), As (arsenic), Gm (plant inoculated with
G. mosseae), and GmAs (plant inoculated with G. mosseae and treated with arsenic). Averages of seven replicates are shown for each treatment.
Fig. 4– 2-DE reference map of P. vittata root proteins (550 μg) stained with Blue silver, colloidal Coomassie. The IEF was performed with 13 cm NL IPG strip pH 3–11, followed by SDS-PAGE on 12% gel. The position of the differently expressed spots is highlighted.
Table 2– List of the P. vittata root proteins, identified by MS/MS analysis.
Spota) Proteinb) AC number (gi NCBI) and
reference organismc) Scored) N. pep.e) Seq. cov.f) MW(Da)/ pI theorg) Mw(Da) exph) ANOVA p-valuei)
Blast resultsl) Biological processm)
1324 ATP synthase beta subunit gi|12004115
Douglasia nivalis
300 9 19% 52382/5.21 43410 0.0165 – ATP synthesis coupled proton
transport
2405 Chaperonin 60 alpha chain gi|145353092
Ostreococcus lucimarinus
41 1 2% 58458/4.80 73413 0.0222 – Protein refolding
2412 Endo-1,4-beta-glucanase precursor gi|924622 Solanum lycopersicum 39 1 1% 56247/9.05 20800 0.0500 – Carbohydrate metabolic process
775 Enolase gi|780372
Oryza sativa
402 7 20% 47956/5.42 57114 0.0476 – Glycolysis
2453 F1-ATP synthase, beta subunit gi|4388533 Sorghum bicolor 495 13 43% 49105/5.25 57938 0.0084 – ATP synthesis coupled
proton transport
905 Glyceraldehyde-3-phosphate dehydrogenase gi|192382810 Cheilanthes covillei 134 2 34% 10456/6.78 46930 0.0006 – Glucose metabolic process
945 Glyceraldehyde-3-phosphate dehydrogenase gi|192383193 Pteris vittata
166 3 38% 10372/8.04 45560 0.0102 – Glucose metabolic process
994 Glyceraldehyde-3-phosphate dehydrogenase gi|192383193 Pteris vittata 92 1 20% 10372/8.04 44725 0.0184 – Glucose metabolic process
2431 Glyceraldehyde-3-phosphate dehydrogenase gi|192383193 Pteris vittata 297 4 50% 10372/8.04 44725 0.0116 – Glucose metabolic process
1657 GTP-binding protein yptV4 gi|549811 Volvox carteri 50 1 6% 23682/7.01 26183 0.0159 – Small GTPase mediated
signal transduction 2478 Hypothetical protein SELMODRAFT_115495 gi|302800449 Selaginella moellendorffii 65 2 25% 13020/9.69 17498 0.0031 Ribosomal
protein
Translation
903 Malate dehydrogenase gi|126896 Citrullus lanatus 82 3 12% 36178/8.88 46930 0.0142 – Malate metabolic process
2422 Malate dehydrogenase gi|7798706 Vitis vinifera 149 5 20% 36851/8.79 44919 0.0062 – Malate metabolic process
2438 Malate dehydrogenase gi|126896 Citrullus lanatus 50 2 9% 36178/8.88 47635 0.0230 – Malate metabolic process
940 Predicted protein gi|224123942 Populus trichocarpa 52 1 1% 67314/5.23 45560 0.0076 Phenylalanine-tRNA ligase Translation
1755 Predicted protein gi|168017768 Physcomitrella patens subsp. patens 47 1 5% 30559/5.34 25436 0.0061 26 S proteasome non-ATPase
regulatory subunit
proteolysis
2416 Predicted protein gi|168067494 Physcomitrella patens subsp. patens 64 2 4% 57408/6.62 66038 0.0151 Aldehyde
dehydrogenase
Oxidation-reduction process
781 Putative acetyl-CoA carboxylase gi|13430734 Arabidopsis thaliana 55 2 6% 58349/7.16 57114 0.0097 – Lipid synthesis
2419 S-adenosylmethionine synthase gi|75306070 Dendrobium crumenatum 124 5 17% 43183/5.42 57020 0.0341 – Transfer one-carbon unit
1794 TCTP (TRANSLATIONALLY CONTROLLED TUMOR PROTEIN)
gi|15228276 Arabidopsis thaliana 149 5 17% 18898/4.52 23118 0.0076 – Cell proliferation
920 Unknown gi|116779848 Picea sitchensis 81 2 5% 39448/5.96 47635 0.0028 Glutamine synthetase Amino acid biosynthesis
a) Spot numbers. b) Protein name.
c) Accession number (NCBI) and reference organism. d) Mascott score.
e) Number of identified peptides. f) Sequence coverage.
g) Theoretical molecular weight and pI. h) Experimental molecular weight (MW) (Da). i) Anova p-Value (significant threshold≤0.05).
l) Blast name (Blast results were presented in Table 2 of supplemental material). m) Biological process with GO Gene ontologies according to UniProt.
1343
JOURN A L O F P ROT E OM IC S 7 4 ( 20 11) 1338 – 1350regulatory subunit (1755) were down-regulated and an endo-1,4-beta glucanase was up-regulated.
G. mosseae symbiosis induced in arsenic treated plants compared to arsenic treated one (GmAs/As) the statistical
significant modulation of 4 protein spots, all down-regulated (glyceraldehyde 3-P dehydrogenase (905), glutamine synthe-tase (920), S-adenosylmethionine synthesynthe-tase (2419) and ribo-somal protein (2478)).
Fig. 5– (A, B, and C). Identified spot details from C, As, Gm and GmAs gels and graphical representation of the ratio of the protein abundance: As/C (arsenic treated versus Control), Gm/C (inoculated withG. mosseae versus Control), GmAs/Gm (inoculated withG. mosseae and As-treated versus Gm), and GmAs/As (inoculated with G. mosseae and As-treated versus As). Positive values are given as such, while negative values are given according to the following formula: given value =−1/ratio.Asterisk indicates a ratio derived from statistically significant values.
4.
Discussion
4.1. Arsenic tolerance in ferns inoculated or not with G. mosseae
Our experimental design has been planned in order to improve G. mosseae colonization and relieve transplanting stress, the acclimation time has been prolonged to one month,
differing from previous data on P. vittata frond proteome[7]. So M% and A% increased in GmAs plants, in accordance to the process referred as priming [31]. The higher colonization percentage leads to a statistical significant increase of dry weight of Gm roots and fronds.
Arsenic content evaluation confirmed that P. vittata hyperaccumulated arsenic in the fronds, but accumulated it also in the roots, though at very lower concentration (about 100 mg/kg). The presence of AM fungus induced a significant
Fig. 5 (continued).
1345
decrease of arsenic content in the roots (GmAs), which could be explained by: i) an enhancement of the As translocation factor as previously demonstrated in P. vittata [32]; ii) a “dilution effect”, as root dry weight significantly increased in the presence of mycorrhization, in agreement with Aloui et al. (2009) [21] who showed a similar behavior in Medicago truncatula root stressed by cadmium in presence of G. intraradices.
After sixty days of arsenic treatment, GSH concentration did not change in roots, even in the presence of
mycorrhiza-tion; instead in fronds arsenic induced an increase of GSH, in both As and GmAs plants, suggesting glutathionylation as a possible arsenic detoxification strategy. The increased GSH pool renders tolerant plants more resistant to different stresses, Singh et al. (2006)[33]observed GSH increased levels upon arsenic exposure in P. vittata fronds. Moreover GSH can directly reduce AsV to AsIII in vitro[34], although this is a too slow process to account for the efficient reduction taking place in plant cells. Bleeker et al. (2006)[35]found that at least 90% of the As reduction capability in the root protein extracts of
H. lanatus was enzymatic. GSH capability of reducing AsV to AsIII in solution using arsenate reductase[36]could explain the GSH concentration increase in fronds of As plants.
As far as phytochelatins are concerned, in our study PC2 was the only phytochelatin oligomer detected in P.vittata fronds, in accordance with Zhao et al. (2003)[37]. In addition, also the absence of PC2in roots of our samples was supported by the very low levels of PC2found by Zhao et al. (2003)[37]. Thus, AM fungus could drive P. vittata arsenic detoxification toward a very moderate PC complexation in fronds, although a different strategy has to be postulated in roots, as shown by the proteomic data. As a matter of fact, phytochelatins could play a role in As detoxification in P. vittata fronds, but this is not the main mechanism to support the As hypertolerance present in this fern. In other words, while in non hyperaccu-mulating and non hypertolerant plants As detoxification can be mainly given by phytochelatins, the“real” tolerance that is found in the As hyperaccumulating fern cannot be inferred to a super-synthesis of phytochelatins, but to other adaptive mechanisms, like the ones revealed by proteomic data, developed in long times under selection pressure[38]. 4.2. Responses of P. vittata root proteome
Comparative analysis of arsenic- and mycorrhizal-induced proteins in P. vittata roots revealed that glycolytic enzymes were strongly involved. Three isoforms of glyceraldedehyde-3P-dehydrogenase (GAPDH) were up-regulated by arsenic and one specifically increased in presence of AM symbiosis. As previously suggested in Bona et al. (2010)[7], GAPDH can operate as an arsenate reductase in P. vittata tissue. GAPDH which normally catalyzes the formation of 1,3-bisphosphoglycerate from glyceraldehyde-3-phosphate and phosphate, can use arsenate instead of phosphate, converting glyceraldehyde 3-phosphate into 1-arseno-3-phospho-glycerate. Furthermore, arsenylated metabolites are more readily reduced to arsenite by all the enzymes that catalyze phosphorolytic–arsenolytic pro-cesses[39]. In other experimental systems, GAPDH was found to be a target enzyme for salt stress in soybean root[40]and for cadmium toxicity in tomato roots [41] and in M. truncatula mychorrizal roots[21].
Enolase, another glycolytic enzyme, was up-regulated both by arsenic (As) and by G. mosseae colonization (Gm) in roots, while in frond proteome it resulted up-regulated by arsenic treatment in mychorrizal ferns (GmAs) [7]. Enolase is a multifunctional enzyme. In fact, also the arsenomethyl analogs of 2-phosphoglycerate can be the substrate for enolase [42]. Recently, high-dormancy L. rigidum seeds, constitutively prepared to survive environmental stresses
[43], and chilled rice roots[44], showed a higher expression of enolase. In these cases enolase can act as a transcription factor specifically involved in cold tolerance.
Two proteins belonging to bioenergetics metabolism were differently modulated in P. vittata roots, following the same pattern disclosed by frond proteome analysis [7]. Three isoforms of malate dehydrogenase showed increased abun-dance in either As or Gm roots, also ATP synthase beta subunit was up-regulated in As and Gm roots. The increased expression of malate dehydrogenase was in accordance with the analysis of metabolite levels in AM roots of M. truncatula, in
which a decrease in fumarate and malate indicative for an increased activity of the tricarboxylic acid cycle has been shown[45]. It is interesting to point out that in P. vittata root a fragment of ATP synthase was down-regulated, a similar fragment appeared also in frond proteome[7], further studies are needed to elucidate the meaning of this repressed fragmentation. As much as regard the direct influence of arsenic on ATP synthase expression, Requejo and Tena (2005)
[16] showed its up-regulation in maize roots treated with arsenic.
Since P. vittata is an arsenic hyperaccumulator, proteomic analysis did not detect enzymes involved in ROS scavenging, the only response to oxidative stress is represented by the up-regulation of aldehyde dehydrogenase. Aldehyde dehydroge-nases constitute a diverse protein family found in various organisms[46]. ALDHs catalyze the oxidation of aldehydes to their corresponding carboxylic acids and require NAD or NADP as a cofactor [47]. ALDHs have been considered as general detoxifying enzymes, which eliminate toxic biogenic and xenobiotic aldehydes[47]. Plant ALDHs have been correlated with stress responses based on transcript accumulation, but their direct function is often unknown[48–51]. Plant turgor-responsive ALDHs are expressed in response to water stress
[49,51]. The steady-state transcript level of ALDH21A1 in
Tortula ruralis was increased in response to dehydration, NaCl, ABA, and UV. Moreover, up-regulation of aldehyde dehydrogenase was detected in cadmium-exposed poplar plants[52]and in aluminum stress in tomato roots[53].
To complete the group of proteins which were up-regulated by both arsenic and G. mosseae colonization, we have identified a GTP-binding protein, which could be involved in signaling the process mediating plant defense reactions, as suggested in several root systems[16,21,54].
Another set of P. vittata root proteins has been specifically modulated by G. mosseae colonization, including acetylCoA carboxylase, phenylalanine-tRNA ligase, an isoform of GAPDH and a translationally controlled tumor protein (TCTP). The up-regulation of acetylCoA carboxylase was indicative of activation of plant fatty acid biosynthesis in AM roots, confirming the result of Lohse et al. (2005)[45]which found increased transcript levels for acetylCoA carboxylase, ACP malonyl transferase and enoyl ACP reductase in AM M. truncatula roots. As much as TCTP is concerned, it is a ubiquitously expressed and distributed protein in eukaryotes, but knowledge of its function in plants is very limited, this is the first evidence of its up-regulation in AM roots. In plants TCTP has retained its GTPase binding property and therefore GTPase activity-regulating function for the control of cellular growth. Several studies in plants have provided evidence that differential expression of TCTP occurs under abiotic stresses, such as aluminum exposure, cold, salinity, and water limitation
[55]. An increase in abundance of phenylalanine-tRNA ligase or phenylalanyl-tRNA synthetase has been detected in G. mosseae colonized roots, indicating that protein synthesis was fully activated in mycorrhizal root, as shown by the root DW increase. Phenylalanine tRNA ligase has a proofreading activity and protect against the mistranslation of Phe codons as Tyr[56].
A 26 S proteasome regulatory subunit was up-regulated in AM roots, but when AM roots were exposed to arsenic its expression was reduced, as occurred in M. truncatula roots treated with cadmium [21]. The ubiquitin/proteasome
1347
pathway represents one of the most important proteolytic systems in eukaryotes. It has been proposed as being involved in the deposition of cell wall components[57]. AM symbiosis improved root growth in AM ferns, this implies new cell wall synthesis as new roots formation. In addition, it has been shown that AM symbiosis can improve root turn-over [11]. Again this implies the deposition of new cell wall material as well as root cell degradation, in which proteasomes could be involved, as important proteasome functions in cellular protein turnover have been suggested. Moreover, the analysis of transcript levels during the development of symbiosis revealed that genes involved in cell wall modifications were specifically induced in AM roots[58]. By contrast in the AM colonized root of M. truncatula 26S proteasome resulted down-regulated[21].
A fragment of beta-glucanase was down-regulated by AM colonization, while its expression increased in GmAs plants, in agreement with the results of Aloui et al. (2009) [21] on M. truncatula.
A chaperonin 60 alpha chain was down-regulated by arsenic and G. mosseae colonization, suggesting that not only abiotic stresses regulated the production of heat shock proteins in plants as an adaptive mechanism[59], but also AM fungi can affect heat shock protein expression.
Finally two proteins showed the same specific pattern of expression: glutamine synthetase, the key enzyme controlling the use of nitrogen inside cells, and S-adenosylmethionine (SAM) synthase, which catalyzes S-adenosyl-methionine formation from methionine and ATP. These two proteins were increased by arsenic treatment, while the same arsenic up-regulation did not happen in the presence of G. mosseae colonization, mycorrhization alleviated metalloid effect and a decrease of expression was detected when comparing GmAs to As plants. The increased expression of glutamine synthe-tase could be linked to a higher protein degradation induced by arsenic, as it was shown in tomato root affected by prolonged hypoxia[60].
Mostly relating SAM synthase up-regulation another strat-egy of arsenic tolerance is depicted: the possibility of arsenic methylation. As reported in Bona et al. (2010) and in Ashan et al. (2008)[7,17], SAM-synthase plays a central role in protecting cells against arsenic stress, forming S-adenosyl-methionine which is a primary methyl donor group. Indeed, methylation has been described as a possible final step in the arsenic detoxification process[61]. Furthermore, the up-regulation of genes involved in arsenate methylation and GSH conjugation has been shown in a transcriptomic study, concerning the response of rice seedling to arsenate[62]. This pathway was not only involved in arsenic detoxification but also in aluminum detoxification process as reported in a study concerning aluminum stress in tomato roots. In this study, Zhou et al.
[53] proposed that SAM is related to ethylene-mediated inhibition of root growth and/or the alteration of cell wall structures and polymers in roots[53].
4.3. Concluding remarks
Concluding arsenic tolerance shown by P. vittata roots consists of different strategies catalyzed by different enzymes: thiol-dependent reduction of arsenate esters formed by arsenolysis
via glycolytic enzymes, methylation employing SAM synthethase, removal of toxic aldehydes, and enhancement of primary metabolism. In this way multiple enzymes are involved in defining P. vittata hyperaccumulating features. The high redundancy of cellular metabolic networks has been already described[63], the majority of the redundant reactions are preserved because they have differential maximal effi-ciencies at different conditions, this genetic robustness of metabolism is likely an evolutionary by-product and reflects the ability of P. vittata to survive in arsenic contaminated environment. AM colonization of fern root alleviated arsenic stress both up-regulating many arsenic-induced enzymes and modulating the process of protein degradation/turnover. Future investigations on the effect of different AM fungi will be useful in defining if one of the different metabolic strategies, highlighted in this study, is the most important arsenic tolerance mechanism of P. vittata.
Supplementary materials related to this article can be found online atdoi:10.1016/j.jprot.2011.03.027.
Acknowledgments
This research was funded by the Italian Minister for Education and Scientific Research, PRIN 2007 program- prot. 2007PKFAAT, Project title: mechanisms of response to arsenic and cadmium in model plants: from molecular level to in field investigation.
The authors have declared no conflict of interest.
R E F E R E N C E S
[1] Chen B, Xiao X, Zhu YG, Smith FA, Xie ZM, Smith SE. The arbuscular mycorrhizal fungus Glomus mosseae gives
contradictory effects on phosphorus and arsenic acquisition by Medicago sativa Linn. Sci Total Environ 2007;379:226–34. [2] Fitz WJ, Wenzel WW. Arsenic transformations in the
soil-rhizosphere-plant system: fundamentals and
potential application to Phytoremediation. J Biotechnol 2002;99: 259–78.
[3] Ng JC, Wang J, Shraim A. A global health problem caused by arsenic from natural sources. Chemosphere 2003;52(9): 1353–9.
[4] Meharg AA, Hartley-Whitaker J. Arsenic uptake and metabolism in arsenic resistant and non-resistant species. New Phytol 2002;154:29–43.
[5] Adriano DC. Arsenic. Trace elements in the terrestrial environment. New York, NY: Springer-Verlag; 1986. p. 46–72. [6] Ma LQ, Komar KM, Tu C, Zhang W, Cai Y, Kennelley ED.
A fern that hyperaccumulates arsenic. Nature 2001;409:579.
[7] Bona E, Cattaneo C, Cesaro P, Marsano F, Lingua G, Cavaletto M, et al. Proteomic analysis of Pteris vittata fronds: two arbuscular mycorrhizal fungi differentially modulate protein expression under arsenic contamination. Proteomics 2010;10: 3811–34.
[8] Yong JW, Tan SN, Ng YF, Low KK, Peh SF, Chua JC, et al. Arsenic hyperaccumulation by Pteris vittata and Pityrogramma calomelanos: a comparative study of uptake efficiency in arsenic-treated soils and waters. Water Sci Technol 2010;61(12):3041–9.
[9] Kabata-Pendias A. Trace elements in soils and plants. III edition. Florida: CRC Press Boca Raton; 2001. p. 394.
[10] Schlüßler A, Schwarzott D, Walker C. A new fungal phylum, the Glomeromycota: phylogeny and evolution. Mycol Res 2001;105:1413–21.
[11] Berta G, Trotta A, Fusconi A, Hooker JE, Munro M, Atkinson D, et al. Arbuscular mycorrhizal induced changes to plant growth and root system morphology in Prunus cerasifera. Tree Physiol 1995;15:281–93.
[12] Smith SE, Read DJ. Mycorrhizal symbiosis. 3 rd edn. London: Academic Press; 2008.
[13] Leyval C, Joner EJ, del Val C, Haselwandter K. Potential of arbuscular mycorrhizal fungi for bioremediation. In: Gianinazzi S, Schüepp H, Barea JM, Haselwandter K, editors. Mycorrhizal technology in agriculture. Basel, Switzerland: Birkhäuser Verlag; 2002.
[14] Berta G, Sampò S, Gamalero E, Massa N, Lemanceau P. Suppression of Rhizoctonia root-rot of tomato by Glomus mosseae BEG12 and Pseudomonas fluorescens A6RI is associated with their effect on the pathogen growth and on the root morphogenesis. Eur J Plant Pathol 2005;111:279–88.
[15] Hodge A, Berta G, Doussan C, Merchan F, Crespi M. Plant root growth, architecture and function. Plant Soil 2009;321:153–87. [16] Requejo R, Tena M. Proteome analysis of maize roots reveals
that oxidative stress is a main contributing factor to plant arsenic toxicity. Phytochem 2005;66:1519–28.
[17] Ahsan N, Lee DG, Alam I, Kim PJ, Lee JJ, Ahn YO, et al. Comparative proteomic study of arsenic-induced differentially expressed proteins in rice roots reveals glutathione plays a central role during As stress. Proteomics 2008;8:3561–76.
[18] Bestel-Corre G, Dumas-Gaudot E, Poinsot V, Dieu M. Proteome analysis and identification of symbiosis-related proteins from Medicago truncatula Gaertn. by two-dimensional electrophoresis and mass spectrometry. Electrophoresis 2002;23:122–37. [19] Campos- Soriano L, Garcia-Garrido JM, San Segundo B. Activation of basal defence mechanism of rice plants by Glomus intraradices does not affect the arbuscular mycorrhizal symbiosis. New Phytol 2010;188:597–614.
[20] Chi F, Yang P, Han F, Jing Y, Shen S. Proteomic analysis of rice seedlings infected by Sinorhizobium meliloti 1021. Proteomics 2010;10:1861–74.
[21] Aloui A, Recorbet G, Gollotte A, Robert F, Valot B,
Gianinazzi-Pearson V, et al. On the mechanisms of cadmium stress alleviation in Medicago truncatula by arbuscular mycorrhizal symbiosis: a root proteomic study. Proteomics 2009;9:420–33.
[22] Farinati S, DalCorso G, Bona E, Corbella M, Lampis S, Cecconi D, et al. Proteomic analysis of Arabidopsis halleri shoots in response to the heavy metals cadmium and zinc and rhizosphere microorganisms. Proteomics 2009;9:1–14. [23] Trotta A, Varese GC, Gnavi E, Fusconi A, Sampò S, Berta G.
Interactions between the soilborne root pathogen
Phytophthora nicotianae var. parasitica and the arbuscular mycorrhizal fungus Glomus mosseae in tomato plants. Plant Soil 1996;185:199–209.
[24] Trouvelot A, Kough JL, Gianinazzi-Pearson V. Mycorrhizae: Physiology and Genetics, Recherche de méthods d'estimation ayant une signification fonctionnelle. In: Gianninazzi-Pearson V, Gianninazzi S, editors. Paris: INRA; 1986. p. 217–21. [25] De Knecht JA, Van Dillen M, Koevoets PLM, Schat H,
Verkleji JAC, Ernst WHO. Phytochelatins in
cadmium-sensitive and cadmium-tolerant Silene vulgaris: chain length distribution and sulphide incorporation. Plant Physiol 1994;104:255–61.
[26] Vâlcu CM, Schlink K. Efficient extraction of proteins from woody plant samples fort two-dimensional electrophoresis. Proteomics 2006;6:4166–75.
[27] Bradford MM. A rapid and sensitive method for the quantitation of microgram quantities of protein utilizing the principle of protein-dye binding. Anal Biochem 1976;72:248–54.
[28] Candiano G, Bruschi M, Musante L, Santucci L, Ghiggeri GM, Carnemolla B, et al. Blue silver: a very sensitive colloidal Coomassie G-250 staining for proteome analysis. Electrophoresis 2004;25:1327–33.
[29] Hellmann U, Wernstedt C, Gonez J, Heldin CH. Improvement of an“In Gel” digestion procedure for the micropreparation of internal protein fragments for amino acid sequencing. Anal Biochem 1995;224:451–5.
[30] Shevchenko A, Sunyaev S, Loboda A, Shevchenko A, Bork P, Ens W, et al. Charting the proteomes of organisms with unsequenced genomes by MALDI-Quadrupole Time-of-Flight mass spectrometry and BLAST homology searching. Anal Chem 2001;73:1917–26.
[31] Pozo MJ, Azcon-Aguilar C. Unravelling mycorrhiza-induced resistance. Curr Opin Plant Biol 2007;10:393–8.
[32] Trotta A, Falaschi P, Cornara L, Minganti V, Fusconi A, Drava G, et al. Arbuscular mycorrhizae increase the arsenic translocation factor in the As hyperaccumulating fern Pteris vittata L. Chemosphere 2006;65:74–81.
[33] Singh N, Ma LQ, Srivastava M, Rathinasabapathi B. Metabolic adaptations to arsenic-induced oxidative stress in Pteris vittata L. and Pteris ensiformis L. Plant Sci 2006;170:274–82. [34] Delnomdedieu M, Basti MM, Otvos JD, Thomas DJ. Reduction
and binding of arsenate and dimethylarsinate by glutathione— a magnetic resonance study. Chem Biol Interact 1994;90:139–55.
[35] Bleeker PM, Hakvoort HWJ, Bliek M, Souer E, Schat H. Enhanced arsenate reduction by a CDC25 like tyrosine phosphatase explains increased phytochelatin
accumulation in arsenate-tolerant Holcus lanatus. Plant J 2006;45:917–29.
[36] Scott N, Hatlelid KM, MacKenzie NE, Carter DE. Reactions of arsenic(iii) and arsenic(v) species with glutathione. Chem Res Toxicol 1993;6:102–6.
[37] Zhao FJ, Wang JR, Barker JHA, Schat H, Bleeker PM, McGrath SP. The role of phytochelatins in arsenic tolerance in the hyperaccumulator Pteris vittata. New Phytol 2003;159:403–10. [38] Sanità di Toppi L, Gabbrielli R. Response to cadmium in higher
plants. Env Exp Bot 1999;41:105–30.
[39] Gregus Z, Roos G, Geerlings P, Nemeti B. Mechanism of thiol-supported arsenate reduction mediated by
phosphorolytic–arsenolytic enzymes II. Enzymatic formation of arsenylated products susceptible for reduction to arsenite by thiols. Toxic Sci 2009;110(2):282–92.
[40] Sobhanian H, Razavizadeh R, Nanjo Y, Ehsanpour AA, Jazii FR, Motamed N, et al. Proteome analysis of soybean leaves, hypocotyls and root under salt stress.
Prot Sci 2010;8:2–15.
[41] Rodriguez-Celma J, Rellan-Alvarez R, Abadia A, Abadia J, Lopez-Millan AF. Changes induced by two levels of cadmium toxicity in the 2-DE protein profile of tomato roots. J Prot 2010;73:1694–706.
[42] Chawla S, Dixon HB. Enolase and the arsonomethyl analogue of 2-phosphoglycerate. J Enzyme Inhib 1995;8(4):255–9. [43] Goggin DE, Powles SB, Steadman KJ. Selection for low or high
primary dormancy in Lolium rigidum Gaud seeds results in constitutive differences in stress protein expression and peroxidase activity. J. Exp. Bot. 2011;62:1037–47. [44] Lee DG, Ahsan N, Lee SH, Lee JJ, Bahk JD, Kang KY, et al.
Chilling stress-induced proteomic changes in rice roots. J Plant Physiol 2009;166:1–11.
[45] Lohse S, Schliemann W, Ammer C, Kopka J, Strack D, Fester T. Organization and metabolism of plastids and mitochondria in arbuscular mycorrhizal roots of Medicago truncatula. Plant Physiol 2005;139(1):329–40.
[46] Sunkar R, Bartels D, Kirch HH. Overexpression of a stress-inducible aldehyde dehydrogenase gene from Arabidopsis thaliana in transgenic plants improves stress tolerance. Plant J 2003;35:452–64.
1349
[47] Yoshida A, Rzhetsky A, Hsu LC, Chang C.
human aldehyde dehydrogenase family. Eur J Biochem 1998;251:549–57.
[48] Chen X, Zeng Q, Wood AJ. The stress-responsive Tortula ruralis gene ALDH21A1 describes a novel eukaryotic aldehyde dehydrogenase protein family. J Plant Physiol 2002;159:677–84. [49] Guerrero FD, Jones JT, Mullet JE. Turgor-responsive gene
transcription and RNA levels increase rapidly when pea shoots are wilted. Sequence and expression of three inducible genes. Plant Mol Biol 1990;15:11–26.
[50] Kirch HH, Nair A, Bartels D. Novel ABA- and
dehydration-inducible aldehyde dehydrogenase genes isolated from the resurrection plant Craterostigma
plantagineum and Arabidopsis thaliana. Plant J 2001;28:555–67. [51] Stroeher VL, Boothe JG, Good AG. Molecular cloning and
expression of a turgor-responsive gene in Brassica napus. Plant Mol Biol 1995;27:541–51.
[52] Kieffer P, Dommes J, Hoffmann L, Hausman JF, Renaut J. Quantitative changes in protein expression of
cadmium-exposed poplar plants. Proteomics 2008;8(12):2514–30. [53] Zhou S, Sauvé R, Thannhauser TW. Proteome changes induced by aluminium stress in tomato roots. J Exp Bot 2010;60:1849–57. [54] Yang Q, Wang Y, Zhang J, Shi W, Qian C, Peng X. Identification
of aluminium-responsive proteins in rice roots by a proteomic approach: cysteine synthase as a key player in Al response. Proteomics 2007;7(5):737–49.
[55] Berkowitz O, Jost R, Pollmann S, Maslea J. Characterization of TCTP, the translationally controlled tumor protein, from Arabidopsis thaliana. Plant Cell 2008;20:3430–47.
[56] Reynolds NM, Ling J, Roy H, Banerjee R, Repasky SE, Hamel P, et al. Cell-specific differences in the requirements for translation quality control. PNAS 2010;107:4063–8. [57] Sheng X, Hu Z, Lü H, Wang X, Baluska F, Samaj J, et al.
Roles of the ubiquitin/proteasome pathway in pollen tube growth with emphasis on MG132-induced alterations in ultrastructure, cytoskeleton, and cell wall components. Plant Physiol 2006;141(4):1578–90.
[58] Liu J, Blaylock LA, Endre G, Cho J, Town CD, VandenBosch KA, et al. Transcript profiling coupled with spatial expression analyses reveals genes involved in distinct developmental stages of an arbuscular mycorrhizal symbiosis. Plant Cell 2003;15(9):2106–23.
[59] Timperio AM, Egidi MG, Zolla L. Proteomics applied on plant abiotic stresses: role of heat shock proteins (HSP). J Proteomics 2008;71(4):391–411.
[60] Horchani F, Aschi-Smiti S. Prolonged root hypoxia effects on enzymes involved in nitrogen assimilation pathway in tomato plants. Plant Signal Behav 2010;5(12).
[61] Qin J, Rosen BP, Zhang Y, Wang G, Franke S, Rensing C. Arsenic detoxification and evolution of trimethylarsine gas by a microbial arsenite S-adenosylmethionine
methyltransferase. PNAS 2006;103(7):2075–80.
[62] Norton GJ, Lou-Hing DE, Meharg AA, Price AH. Rice-arsenate interactions in hydroponics: whole genome transcriptional analysis. J Exp Bot 2008;59(8):2267–76.
[63] Wang Z, Zhang J. Abundant indispensable redundancies in cellular metabolic networks. Genome Biol Evol 2009:23–33.