2020-05-27T10:05:38Z
Acceptance in OA@INAF
Accretion and Ejection in Black-Hole X-Ray Transients
Title
Kylafis, N. D.; BELLONI, Tomaso Maria Melchiorre
Authors
10.1007/978-3-319-10356-3_10
DOI
http://hdl.handle.net/20.500.12386/25217
Handle
ASTROPHYSICS AND SPACE SCIENCE LIBRARY
Series
414
Number
transients
N. D. Kylafis and T. M. Belloni
Abstract A rich phenomenology has been accumulated over the years regarding
accretion and ejection in black-hole X-ray transients (BHTs). Here we summarize the current observational picture of the outbursts of BHTs, based on the evolution traced in a hardness - luminosity diagram (HLD), and we offer a physical interpre-tation with two assumptions, easily justifiable. The first is that the mass-accretion rate to the black hole in a BHT outburst has a generic bell-shaped form. This is guaranteed by the observational fact that all BHTs start their outburst and end it at the quiescent state, i.e., at very low accretion rate. The second assumption is that at low accretion rates the accretion flow is geometrically thick, ADAF-like, while at high accretion rates it is geometrically thin. Both, at the beginning and the end of an outburst, a strong poloidal magnetic field develops locally in the ADAF-like part of the accretion flow, and this explains naturally why a jet is always present in the right part of the HLD. “Memory” of the system explains naturally why BHTs traverse the q-shaped curves in the HLD always in the counterclockwise direction and that no BHT is expected to ever traverse the entire curve in the clockwise direction. The only parameter in our picture is the accretion rate.
1 Introduction
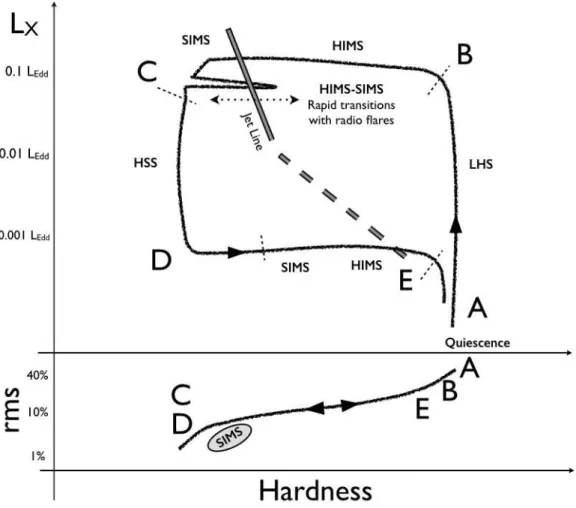
The spectral evolution of black-hole X-ray transients (BHTs) has been presented using a hardness - luminosity diagram (HLD), where the sources often exhibit a q-shaped curve, complicated by small excursions (see Fig. 1, top curve; Homan et N. D. Kylafis
University of Crete, Physics Department & Institute of Theoretical & Computational Physics, 71003 Heraklion, Crete, Greece, e-mail: [email protected]
T. M. Belloni
INAF-Osservatorio Astronomico di Brera, Via E. Bianchi 46, I-23807 Merate (LC), Italy e-mail: [email protected]
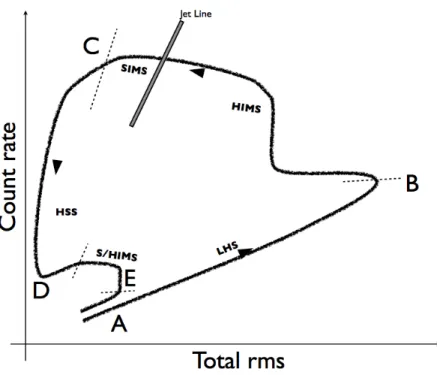
al. 2001; Belloni et al. 2005; Homan & Belloni 2005; Gierli´nski & Newton 2006; Remillard & McClintock 2006; Fender et al. 2009; Motta et al. 2009; Belloni 2010; Munoz-Darias et al. 2011a; Stiele et al. 2011). Such a hysteresis was first noticed by Miyamoto et al. (1995). Complementary to HLDs are the hardness - fractional-rms-variability diagrams (HRDs) (Fig. 1, bottom curve; Belloni et al. 2005) and the absolute-rms-variability - luminosity diagrams (RLDs) (Fig. 2; Munoz-Darias et al. 2011a; Munoz-Darias et al. 2011b). The last ones exhibit curves topologically sim-ilar to the curves in HLDs. These three types of diagrams, especially the HRDs and the RLDs, have shown that the BHTs exhibit some characteristic states (Belloni et al. 2005; Belloni 2010; Belloni et al. 2011). These are the quiescent state (QS), the hard state, which historically is called low/hard state (LHS) but the word “low” has been proven inappropriate, the hard intermediate state (HIMS), the soft intermediate state (SIMS), and the soft state, which historically is called high/soft state (HSS), but again the word “high” has been proven inappropriate. A different classification scheme, based on quantitative criteria regarding the energy spectrum and the vari-ability, was introduced by Remillard & McClintock (2006) and McClintock et al. (2009). A comparison between the two classification schemes has been provided by Motta et al. (2009). For the purposes of this paper, we will use the first classification. A simple, generic model (see, e.g., Gilfanov 2010) assumes that, at all times during an outburst, there is a hot corona near the black hole and further out an accretion disk, which is geometrically thin, optically thick, relatively cool, and well described by the work of Shakura & Sunyaev (1973). The relative sizes of the corona and the accretion disk determine the spectral state. In the HSS the corona is small and the accretion disk extends all the way to the inner stable circular orbit (ISCO). In the LHS, the corona is large and the accretion disk is restricted to the outer region. A more realistic and quantitatively successful model for the various spectral states was provided by Esin et al. (1997; see also Narayan et al. 1996; Narayan et al. 1997; Esin et al. 1998, 2001), who identified the unphysical corona with a physical Advection Dominated Accretion flow (ADAF). For the interpretation of the q-shaped curve (Fig. 1, top panel) we make use of the picture of Esin et al. (1997), but we also improve it and expand it, taking into account the knowledge that has been accumulated in the intervening years.
For the traversal of the q-shaped curve, we want to make the following remark. Imagine taking a video of a BHT as it traverses the q-shaped curve (Fig. 1, top curve) from quiescence (below point A), vertically to high luminosity (point B), left to small hardness ratio at about constant luminosity (point C), vertically down to a significantly lower luminosity (point D), horizontally to large hardness ratio (point E), and finally vertically to quiescence (below point A). If the video is shown backwards, then the left turn occurs at low luminosity (point E) and the rest of the q-shaped curve is traversed in the clockwise direction. No law seems to be violated in this time-reversed video. Thus, some sources ought to be observed to traverse the q-shaped curve clockwise and others counterclockwise. However, all BHTs and in all their outbursts, if more than one outburst have been observed, traverse the q-shaped curve in the counterclockwise direction. It is therefore important to understand what breaks this time-reversal symmetry. In our interpretation of the q-shaped curve, we
Fig. 1 Schematic representation of the q-shaped curve in a hardness-luminosity diagram (top curve) and a hardness - fractional-rms diagram (bottom curve) for black-hole X-ray binaries. The dotted lines mark the transition between states.
address this point. We remark that not all sources exhibit a nice q-shaped curve during their outbursts (see Belloni 2010). In this paper we will restrict ourselves to sources exhibiting a nice q-shaped curve in a HLD, with GX 339-4 as the prototype. Our work is based on two assumptions: 1) The accretion rate into BHTs as a function of time has a generic bell-shaped curve. It starts from a very low accretion rate, it increases steadily up to an accretion rate comparable to the Eddington rate, and ends again with a very low accretion rate. This is justified by the fact that BHTs start and end their outbursts at very low luminosity. 2) At high accretion rates, the accretion disk is optically thick, geometrically thin, and it is described well by the model of Shakura & Sunyaev (1973). At low accretion rates, the accretion flow is ADAF (Narayan & Yi 1994, 1995; Abramowitz et al. 1995) or ADAF-like.
Fig. 2 Schematic representation of the curve traversed by black-hole X-ray binaries in a luminosity versus total-integrated-rms diagram. The dotted lines mark the transition between states.
Both of these assumptions are well accepted, have been verified by numerical simulations (Ohsuga et al. 2009), and have been applied quantitatively to observa-tions many times in the past.
As mentioned above, our knowledge has increased significantly in recent years. Thus, despite its success, the Esin et al. (1997) model has some shortcomings. In particular, the very high state in their picture is now identified with the HIMS and the SIMS transitions, which come before the HSS, not after. A second shortcom-ing is the fact that their picture is “one-dimensional”, i.e., in a hardness luminosity diagram, the sources traverse the same curve forward and backward, they do not tra-verse a loop (see their Fig. 1). Finally, jet formation and destruction is not addressed. In our work, we extend the model of Esin et al. (1997) and subsequent work (for a comprehensive recent review see Done et al. 2007) to account for: 1) The return
path of the q-shaped curve (see Fig. 1, top panel, from point C to points D and E).
To our knowledge, the outburst decay has not been modeled theoretically, despite the fact that it has been studied observationally in detail (Kalemci et al. 2001, 2003, 2004, 2005, 2006). 2) Jet formation, destruction, and re-formation. By taking into
account a novel mechanism for magnetic field generation in the ADAF, we offer an explanation for a) the formation and evolution of a compact jet as the sources move from quiescence, to the hard, and then to the hard intermediate state, b) the eruptive disappearance of the compact jet before the sources reach point C in Fig. 1 (HIMS to SIMS transition) and c) the smooth re-appearance of the compact jet before the sources reach point E. As we will show in detail below, the only parameter in our model is the mass-accretion rate.
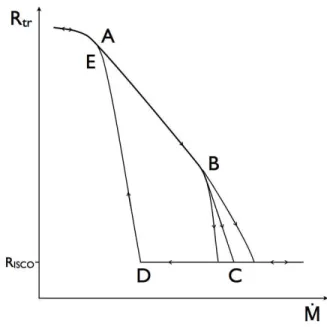
An inferred quantity, which is a function of the accretion rate, is the transition ra-dius Rtr(Esin et al. 1997) between the outer thin disk and the inner ADAF. Work on Rtr, taking into account evaporation, has been done by Liu et al. (1999; see also Meyer et al. 2000; Hofmeister & Meyer 2001; Qian et al. 2007; Meyer-Hofmeister et al. 2009). According to this work, we show in Fig. 3 a schematic of Rtr versus mass-accretion rate ˙M. In quiescence, ˙M is small and Rtr is large. In the LHS, say at points between A and B, ˙M increases and Rtr decreases. In the HIMS and the SIMS, i.e., at points between B and C, ˙M keeps increasing until it
reaches its maximum value (here we have allowed for three different maximum val-ues), while Rtrkeeps decreasing until it reaches the innermost stable circular orbit at RISCO. Then, ˙M decreases, but Rtrremains at RISCOuntil point D is reached. There,
the inner part of the accretion disk becomes radiatively inefficient and puffs up (Das & Sharma 2013). As ˙M keeps decreasing, an increasing part of the inner flow
be-comes ADAF-like and therefore Rtrincreases. Finally, at point E the sources reach the LHS.
Fig. 3 Schematic representation of the transition radius Rtrbetween the inner ADAF and the outer
thin disk as a function of mass-accretion rate ˙M. The points A, B, C, D, and E reflect the same
Our presentation is qualitative, but it relies on well-accepted theoretical ideas and calculations. We concentrate on the “zeroth order effects”, while for the “first order ones” we either speculate and say so or leave them unexplained. In many respects, especially jet formation and destruction, our picture is applicable to neutron-star and white-dwarf X-ray binaries (Kylafis et al. 2012).
In § 2 we describe our main ideas and explain the “zeroth order” phenomenology, in § 3 we make some remarks, and in § 4 we present our conclusions.
2 Following BHTs along an outburst
BHTs spend most of their time in the QS (see Levine et al. 2006), where the X-ray luminosity is very low and the sources are usually undetected within short observing times. Then, a significant amount of matter begins accreting into the black hole and an outburst occurs. The fact that BHTs start their outbursts in the QS, increase their luminosity, and come back to the QS means that the mass-accretion rate has, to “zeroth order”, the form of a bell-shaped curve, beginning and ending at the accretion rate of the QS. This does not mean a Gaussian, but rather any curve that starts at low values, increases, reaches a maximum or a plateau or multiple local maxima and minima, and returns to low values.
Using multi-wavelength observations, it has been demonstrated (McClintock et al. 2003; see also Marsh et al. 1994; Orosz et al. 1994) that in quiescence the matter that leaves the companion star forms a thin disk at large radii (r >∼ 2 × 10⁴Rg), where Rg= GM/c2 is the gravitational radius and M is the mass of the black hole. At
radii interior to this disk, and for the relatively small amount of matter that accretes into the black hole in quiescence, the flow is according to our second assumption ADAF-like.
It is generally considered that, matter accumulates in the above thin disk and, through the ionization instability (Meyer & Meyer-Hofmeister 1981; Smak 1984; for a review see Lasota 2001), matter is released, falls into the black hole, and pow-ers the X-ray outburst.
Before proceeding to a discussion of the outburst, we will comment on the for-mation of the hard and the soft X-ray spectra in BHTs and on their observed time variability.
2.1 X-ray spectra of BHTs
The soft X-ray spectra of BHTs (i.e., below a few keV) are generally believed to be multi-temperature blackbody spectra emitted by a geometrically thin and optically thick accretion disk, of the type proposed by Shakura and Sunyaev (1973).
For the hard X-ray power-law spectra of BHTs, observed in the LHS, there is no general agreement for their formation, though a consensus is forming (see below).
In models where a corona is assumed (see Gilfanov 2010 for a review), the hard X-ray spectra are produced by inverse Comptonization of soft seed photons by thermal or non-thermal electrons in the corona. In view of the fact that simple corona models cannot explain the time-reversal asymmetry, discussed in the Introduction, we will not consider them further.
Since all BHTs exhibit a compact radio jet when they are in the LHS or in the HIMS, and the jet originates in an advection dominated accretion flow (ADAF; Narayan & Yi 1994, 1995; Abramowicz et al. 1995), it is natural to assume that the jet and/or the ADAF play a significant role in the formation of the hard X-ray spectrum. The ADAF always plays a role. On the other hand, the jet clearly has the potential to play a role. It has been demonstrated (Reig et al. 2003) that a simple jet model can easily explain the hard X-ray spectra of BHTs in the LHS and the HIMS. The same is true for ADAF models (for a review see Done et al. 2007). Thus, there is no need to invoke a thermal or non-thermal corona, when an ADAF and a jet are present, which can explain observational facts that corona models do not ever address (Giannios et al. 2004; Giannios 2005; Kylafis et al. 2008; Ingram et al. 2009; Ingram & Done 2011; 2012).
Markoff et al. (2005) proposed that the upscattering of soft photons, to create the hard spectrum, takes place at the base of the jet. However, if the seed photons enter the base of the jet, there is nothing to prevent them from “exploring” the entire body of the compact jet. Indeed, Compton upscattering of soft seed photons in the
entire body of the jet fits nicely the observed spectra from radio to hard X-rays
and explains in a natural way many other observational facts (Giannios et al. 2004; Giannios 2005). Thus, we will assume that the hard X-ray spectrum in the LHS and the HIMS is produced by inverse Compton scattering of soft seed photons mainly in the ADAF and possibly in the compact jet. After all, there is hardly any energetic difference if the Comptonization takes place in the ADAF or the jet, since it is the ADAF that creates the jet and one expects that, to “zeroth order”, the mean electron energy in the jet and the ADAF is about the same.
Before closing, we remark that the steep power-law, high-energy spectra ob-served in the HSS of BHTs constitute only a small fraction of the total luminosity. Thus, a limited attention has been paid to them and a possible explanation is that these spectra are formed by inverse Compton scattering in non-thermal flares above and below the thin accretion disk (Poutanen et al. 1997; Gierli´nski et al. 1999). If a jet is ever detected in the HSS, then the above interpretation must be re-considered.
2.2 Time variability of BHTs
The properties of fast (< 1 s) time variability change regularly during an outburst,
following a well repeated pattern (see Belloni 2010; Belloni et al. 2011). These variations can be best followed by producing in addition to the HLD, two more dia-grams: the HRD (Fig. 1, bottom curve) and the RLD (Fig. 2). As already mentioned, the HRD shows the total fractional rms variability integrated over a broad frequency
range, as a function of hardness. Here, to “zeroth order”, one can notice the absence of hysteresis: all observations of a source lie along a line which goes from 40% rms in the LHS, down to ∼ 1% in the HSS, and back up to 40% when the source re-turns to the LHS. The SIMS points occupy a separate “cloud” at lower % rms than the main line. The power density spectra (PDS) in the LHS show large variability in the form of band-limited noise components, usually fitted with broad Lorentzian models (see Belloni et al. 2002). As the source brightens and slightly softens, the total rms decreases and the characteristic frequencies of all Lorentzian components increase (see, e.g., Belloni et al. 2005). In the HIMS, when the source experiences a fast and strong softening (see below), the rms further decreases down to 10%, while all Lorentzians continue increasing their frequency. In this state, quasi-periodic os-cillations (QPOs) appear together with the noise. This type of QPO is called type-C (Casella et al. 2005). The transition to the SIMS is very fast, it can take place on time scales below one hour (see Nespoli et al. 2003. Also, Casella et al. 2004, Bel-loni et al. 2005, and Motta et al. 2011 show fast transitions), and is characterized by a radical change in the timing properties: the broad-band noise disappears to be replaced by a weaker power-law component, while the type-C QPO is replaced by a so-called type-B QPO, whose properties are radically different (see Motta et al. 2011). Minor transitions between HIMS and SIMS are often observed later, and the timing properties change accordingly. As the source moves to the HSS, weak QPOs of yet another type (type-A) (see Motta et al. 2011 and references therein) and re-duced noise level in the form of a power law are observed. In the bottom branch, the sequence is reversed and there is little evidence for hysteresis in the HRD.
Complementary to the HRD is the RLD (Fig. 2), where the horizontal axis shows the total (not the fractional) integrated rms, and the vertical axis the luminosity. All transitions described above are clearly visible in this diagram, which has the advantage of not requiring any spectral resolution. Minor transitions between HIMS and SIMS can be seen in such a diagram also (see Mu˜noz-Darias, et al. 2011).
2.3 Quiescent state
In the HLD (Fig. 1), we are now at a point well below point A (see also Fig. 3). The accretion rate in the QS is very low and the accretion flow inside Rtris radiatively inefficient, hot, geometrically thick, and optically thin. Such flows are described very well by advection dominated accretion flows (ADAF, Narayan & Yi 1994, 1995; Abramowicz et al. 1995). As a rule, when BHTs are in the QS, they exhibit a radio jet. Soft, cyclotron photons from the jet are upscattered by the electrons in the jet (Giannios 2005) or the ADAF (Done et al. 2007) and produce the observed power-law, hard X-ray spectrum. Since the thin disk outside Rtr emits optical and infrared radiation, a fraction of it will also be upscattered, but the majority of the soft seed photons is expected to come from the jet, which is directly above and below the ADAF.
Three-dimensional magnetohydrodynamic simulations of astrophysical accret-ing systems (Machida et al. 2006; Hawley 2009; Romanova et al. 2009; Mignone et al. 2010) have shown that jet formation is due to one of two types of physical mech-anisms: either plasma gun/magnetic tower (Contopoulos 1995; Lynden-Bell 1996) or centrifugal driving (Blandford & Payne 1982). In either case, a strong, large-scale magnetic field is absolutely necessary. Such strong magnetic fields can either come from far away, in which case the flow, via advection, brings them in and amplifies them (Igumenshchev 2008; Lovelace et al. 2009; Tchekhovskoy et al. 2011) or they are produced locally. We favor the second possibility because we consider it simple and elegant. It produces a strong, poloidal magnetic field where it is needed and when it is needed (see below). We find it awkward to rely on a random process rather than a direct one to create an ordered magnetic field.
The mechanism for the formation of a strong, poloidal magnetic field is the Poynting-Robertson Cosmic Battery (PRCB, Contopoulos & Kazanas 1998; see also Contopoulos et al. 2006; Christodoulou et al. 2008). The battery works very efficiently, because the inner part of the flow is geometrically thick. Thus, most of the radiation emitted near the ISCO participates in the mechanism of the battery. The formation timescale of the magnetic field, in the various states of a BHT, is discussed in Kylafis et al. (2012). Since BHTs spend most of their time in the QS, there is ample time for the formation of the strong, poloidal magnetic field needed for the jet.
The efficiency of the Cosmic Battery is proportional to the luminosity of the source. Thus, an increase in the luminosity, as the source moves from quiescence to the hard state, results in the PRCB producing a stronger magnetic field, which can support a stronger jet, with an increased radio emission (e.g., Giannios 2005). Thus, it is natural to expect the radio luminosity to be positively correlated with the X-ray luminosity (see Gallo et al. 2006).
2.4 Hard state
In the HLD (Fig. 1, top panel), we are now at point A (see also Fig. 3). As the mass-accretion rate increases, the accretion flow remains ADAF-like, the X-ray lu-minosity increases, the PRCB works more efficiently, the jet becomes stronger, but the X-ray spectrum (power law in the 2 − 20 keV band with a photon-number spec-tral indexΓ ∼ 1.5) remains almost the same (almost the same hardness ratio). Thus,
in the HLD, the track that the BHTs follow is an almost vertical line (upwards from point A in Fig. 1, top panel). There is some softening as the source brightens, but it is much less compared to that in the HIMS, see Motta et al. 2009). Since the jet produces the radio spectrum and also provides seed photons for the hard X-rays, it is natural that the two are correlated (see Gallo 2010 and references therein). Further-more, since the up-scattering of the seed photons steals energy from the jet and/or the ADAF (Compton cooling; Done et al. 2007), the high-energy cutoff Ecof the
X-ray spectrum should decrease. This is exactly what has been observed by Motta et al. (2009).
With increasing mass-transfer rate, the transition radius Rtrmoves inward (Esin et al. 1997; Liu et al. 1999; Das & Sharma 2013). The thin, outer part of the accretion flow has no direct contribution to the hard X-ray spectrum, though it has an indirect one, because it provides a fraction of the soft seed photons for Comptonization (Sobolewska et al. 2011). The ADAF-like flow at r< Rtris permeated by a poloidal magnetic filed, which is very strong, near equipartition, at the ISCO (Kylafis et al. 2012) and drops off with radius. This poloidal magnetic field not only supports the jet, but also increases the strength of the magneto-rotational instability (Bai & Stone 2013). As a result, there is efficient transport of matter inwards, which keeps the density low. Thus, the source goes upwards in the q-diagram (from point A to point B in the upper panel of Fig. 1) and does not turn left, i.e., towards points E and D. In other words, the poloidal magnetic field, which is created by the PRCB
forces the source to remain in the hard state and, until something changes, there is
no transition to the soft state.
As the source moves from point A to point B (Fig. 1, top panel), the luminosity increases, the cutoff of the power-law X-ray spectrum decreases significantly (Motta et al. 2009), the photon-number spectral index increases slightly, and the thin disk begins to contribute to the band measured by RXTE (typically 3 − 20 keV). As a result, the hardness ratio decreases abruptly and the source turns left (point B in the upper panel of Fig. 1) in the HLD (see also Fig. 3). The source then enters the HIMS.
It has been suggested (Miller et al. 2006a; Miller et al. 2006b) that in the LHS the thin disk is not truncated at several tens Rg, but it extends all the way in, to the ISCO. However, the derived thin-disk inner radius in the LHS is quite sensitive to the assumed continuum shape. Thus, the above suggestion has been challenged by Done et al. (2007). There are recent claims (Reis et al. 2010; Reynolds & Miller 2013) insisting that in the LHS the thin disk extends all the way to the ISCO, but also work with the opposite conclusion (Plant et al. 2013). In our view, the fact that the truncated thin-disk model explains physically not only the X-ray spectra and the observed time variability (Done et al. 2007; Ingram et al. 2009; Ingram & Done 2011; 2012), but also the formation and destruction of jets (Kylafis et al. 2012), makes it more favorable.
During the LHS, the PDS is fitted with a small number (typically 3 to 4) of very broad Lorentzians plus, in some cases, a low-frequency type-C QPO peak (e.g., Cui et al. 1999). The thin-disk emission can only vary on a viscous timescale, which is of order hundreds seconds. This has been confirmed by Uttley et al. (2011; see also Wilkinson & Uttley 2009). Therefore, the above variability comes from the component that produces the hard X-rays, i.e., from the ADAF and/or the jet. This has been confirmed by Axelsson et al. (2013).
2.5 Hard intermediate state
In the HLD (Fig. 1, top panel), we are now at a point to the left of B, say, halfway between points B and C (see also Fig. 3). In the HIMS, and as time progresses, ˙M
increases, Rtrdecreases, the ADAF part of the accretion flow shrinks, and the thin disk extends to progressively smaller radii. This means that if x is the fraction of the power-law, hard X-ray luminosity in the RXTE band, then 1 − x is the fraction of the soft X-ray luminosity produced by the thin accretion disk, and x decreases monotonically with time. This is exactly what is observed by Munoz-Darias et al. (2011b) for MAXI J1659-152.
As the ADAF part of the accretion flow shrinks, there is an additional reason for the decrease of the power-law luminosity. The smaller the transition radius Rtr, the narrower the jet becomes, the smaller its optical depth, the less efficient the Comptonization becomes, and the steeper the high-energy power law (Γ increases to ∼ 2, Kylafis et al. 2008). A similar argument can be made if the Comptonization takes place in the ADAF. In addition, as the ADAF shrinks to smaller and smaller radii, a point is reached where the disk cannot sustain the magnetic field produced by the PRCB (Kylafis et al. 2012), the jet becomes eruptive, emitting discrete blobs with Lorentz factorsγ> 2 (Fender et al. 2004). As the sources reach the so-called
jet line (Fender et al. 2004; Fig. 1), the thin disk extends all the way to the ISCO. Since the thin disk may support energetic flares (Poutanen et al. 1997; Gierli´nski et al. 1999), the high-energy cutoff Ecis no longer determined by the electrons in the jet or the ADAF, but rather by the non-thermal electrons in the flares. This may explain the increase of Ecin the HIMS (Motta et al. 2009). It is a different spectrum, and therefore a different Ecin the HIMS than that in the LHS.
The PDS in the HIMS can be viewed as a high-frequency extension of the PDS in the LHS. It can be decomposed into a number of broad Lorentzian components, which correspond to those found in the LHS (e.g. Belloni et al. 2011), only they have higher frequencies. The characteristic frequencies of all these components vary in unison (see Belloni et al. 2005; in Cyg X-1, not a transient system, an additional Lorentzian component remains fixed, see Pottschmidt et al. 2003), so they are re-ally one frequency! The total fractional rms variability is lower (10 − 20%) than in the LHS. The most prominent feature in the PDS is a type-C QPO (e.g., Motta et al. 2011), with centroid frequency varying between ∼ 0.2 and ∼ 20 Hz. As in the
LHS, the Lorentzian components and the QPO vary together (Belloni et al. 2005; Belloni et al. 2011). However, in the HIMS they are strongly correlated with hard-ness. Softer spectra correspond to higher frequencies and to lower integrated rms variability. These two correlations are explained naturally in our picture. The spec-trum becomes softer, because the thin disk occupies an increasingly larger part of the accretion flow. Since the rms variability of the thin disk is very small (Gilfanov 2010), the total rms variability decreases. Furthermore, since the variability (at least the high-frequency one) appears to come from the jet/ADAF, the higher the energy of observation, the larger the variability, as it is observed (see e.g. Gilfanov 2010; Belloni et al. 2011). We remark here that at high energies we have two contributions
to the spectrum: one from the jet/ADAF and one from the energetic flares discussed above.
In addition to the X-ray spectra, an accretion flow consisting of an inner ADAF part and an outer part of the Shakura-Sunyaev type (the so-called truncated disk model) explains very well the broad-band noise and the type-C QPO. Ingram & Done (2012, see also Ingram & Done 2011; Ingram et al. 2009) have demostrated that the type-C QPO can be explained as Lense-Thirring precession of the inner, ADAF part of the accretion flow. It is therefore natural to expect a correlation be-tween the high-energy power-law spectrum and the QPO frequency, as they are both produced in the same region, the ADAF. If the high-energy power-law X-ray spectrum is produced in the jet, the characteristic frequency of the QPO has been interpreted in the case of Cyg X-1 (Kylafis et al. 2008) as the inverse of the ejec-tion timescale of the jet, which could be related to the Lense-Thirrring precession frequency.
The broad-band noise spectrum has been interpreted by Ingram & Done (2011; 2012) as propagating mass-accretion rate fluctuations in the ADAF part of the ac-cretion flow. This explains the fact that the features in the power spectrum and the QPO vary in unison.
Our picture makes the prediction that in the upper branch of the q-shaped curve (between points B and C in Fig. 1, top panel), the average timelag of the hard X-rays with respect to the soft X-rays should dercrease as the hardness ratio decreases. This is because the ADAF shrinks in size in the HIMS and therefore the light-travel time of the upscattered photons is reduced.
2.6 First jet-line crossing
The jet line (Fig. 1, top panel) is a sharp transition between the HIMS and the SIMS. It marks the end of a detectable compact jet. For a detailed study of this transition see Miller-Jones et al. (2012). As discussed above, the thin disk cannot sustain the magnetic field produced by the PRCB or any other mechanism and it is expelled. The transition between HIMS and SIMS is marked only by the timing properties (Belloni 2010). The spectrum shows no noticeable change during the transition, apart from a minor softening. At this time of the outburst, the accretion disk is geometrically thin, the energy spectrum is soft, and the hardness ratio is rather low. The observed variability is detected only at high energies, so it must come from the invoked magnetic flaring activity above and below the thin accretion disk. The characteristic values of the hardness ratio of the jet line depend on the energy bands used for the definition of the hardness ratio.
2.7 Soft intermediate state
Before our discussion of the soft intermediate state, it is important to point out that the HIMS and the SIMS are what was called very high state (VHS) in the Ginga era (see Miyamoto et al. 1993; Takizawa et al. 1997). However, now we know that these two states are reached before the soft state is entered, which has tremendous implications for our understanding of the physical picture. The Ginga coverage was not sufficient to show this and the Esin et al. (1997) model was affected by this interchange of states.
In the HLD (Fig. 1, top panel), we are now just to the left of the jet line. The energy spectrum in the SIMS is nearly the same as in the HIMS, only slightly softer. On the other hand, significant changes occur in the PDS. A type-B QPO is now present in the power spectrum, which is not an evolution of the type-C QPO ob-served in the SIMS (see Motta et al. 2011 and references therein). The characteristic frequency of the type-B QPO is in the narrow (compared to the type-C) range of 1 − 6 Hz (see Motta et al. 2011 and references therein) while at high-flux intervals the range becomes even narrower (4 − 6 Hz) (Casella et al. 2004; Motta et al. 2011). Unlike type-C QPOs, which are fitted with Lorentzians, type-B QPOs are fitted with Gaussians. This is due to the fact that type-B QPOs jitter in time on short timescales. Thus, in the average PDS, which is the usual that is fitted, the peak is broadened (Nespoli et al. 2003). As in the HIMS, the fractional rms increases with energy. This can be understood, if we invoke that most of the rms variability comes from the flares above and below the disk.
In view of the qualitative differences between type-B and type-C QPOs, and taking into account that the type-B QPOs are seen only during the SIMS, we are tempted to speculate that the type-B QPO is associated with the last “gasps” of the jet.
2.8 Soft state
In the HLD (Fig. 1, top panel), we are now at point C (see also Fig. 3). In outbursts like those of GX 339-4, our prototype source, the HSS marks the highest reached accretion rate, which then starts to decrease. There are sources where the accretion rate keeps increasing after the HSS is entered. Those are the ones that enter the anomalous state (Belloni 2010). We do not address this state, because it is not seen in GX 339-4 and we consider it as a “first-order effect”. We stress, however, that this anomalous state is not the VHS of Esin et al. (1997).
In the soft state, the BHTs are characterized by a dominant soft X-ray spec-trum and an energetically negligible (about 5% of the total X-ray luminosity) steep power-law spectrum (Γ > 2.2) extending to more than 1 MeV (see Grove et al.
1998). As it was mentioned in §2.1 above, it is generally accepted that the soft X-ray spectrum comes from the thin accretion disk and the power-law spectrum comes
from Comptonization of the soft disk photons by the non-thermal electrons in the flares above and below the thin disk.
As the mass-accretion rate decreases, the X-ray luminosity decreases and the entire accretion disk remains geometrically thin, emitting progressively less lumi-nosity. Since luminosity decreases, its temperature will also decrease, resulting in a decrease in hardness, which is observed (see Motta et al. 2010; Stiele et al. 2012). This brings the BHTs to point D (Fig. 1, top panel, and Fig. 3).
Fourier-resolved energy spectra in the HSS (see Churazov et al. 2001) show that the observed variability comes from the power-law spectrum and not from the multi-temperature blackbody of the thin disk. This is consistent with our interpretation that the power-law spectrum comes from magnetic flaring above and below the thin accretion disk. Sometimes, a type-A QPO is observed (see Motta et al. 2011).
2.9 Soft intermediate state again
In the HLD (Fig. 1, top panel), we are now at a point to the right of point D (see also Fig. 3). As the mass-accretion rate decreases further, a point is reached (point D in Fig. 1, top panel, and Fig. 3) where the inner part of the accretion disk becomes radiatively inefficient and puffs up (Das & Sharma 2013). Evaporation also plays a role (Liu et al. 1999). In any case, the simulations of Das & Sharma (2013) have shown that the transition from a geometrically thick inner flow to a geometrically thin outer disk moves outward as the accretion rate decreases. In other words, in the lower branch of the q-shaped curve (i.e., from point D to point E in Fig. 1, top panel, and Fig. 3) we have the reverse of what we had in the upper branch (from point B to point C in Fig. 1, top panel, and Fig. 3). The transition radius Rtr now moves outwards with time (Fig. 3).
We remark here that, according to the above, the source will always turn right at point D (i.e., at a specific accretion rate), independent of how high the luminosity was in the upper branch of the q-shaped curve (points B and C in Fig. 1, top panel). This is exactly what has been seen in the multiple outbursts of GX 339-4 (Motta et al. 2011).
With the establishment of an ADAF-like structure at the inner part of the accre-tion flow, the PRCB operates efficiently and creates the magnetic field needed for the establishment of a jet. Type-B QPOs are seen once again (Stiele et al. 2011; Motta et al. 2011). Extending our previous speculation (Sect. 2.7), we propose that the type-B QPOs observed in this part of the HLD are again due to the jet, at its first
appearence. We note here that a compact jet is formed much later, when the source
has approached the hard state and the jet has become strong enough to be detected as such. This gradual development of the jet was recently observed in detail (Corbel et al. 2013).
2.10 Hard intermediate state again
In the HLD (Fig. 1, top panel), we are now at a point, say, halfway between points D and E (see also Fig. 3). The transition from the SIMS to the HIMS in the lower branch of the q-shaped curve is uneventful. No eruptive jet, similar to those in the upper branch, has ever been seen and, our prediction is that, one will never be seen. This is because the ADAF-like part of the accretion flow increases continuously, the PRCB continues working, and the jet builds up smoothly. No instability occurs in the lower branch of the q-shaped curve, though variability is naturally expected as the jet forms.
The thick and hot part of the flow inside Rtrintroduces a hard component in the X-ray spectrum. This comes from up-scattering of soft photons from the thin disk in the hot, thick, inner part of the flow or the forming jet. Thus, the hardness ratio increases with time. As in the HIMS at higher luminosity, if x′ is the fraction of the power-law, hard X-ray luminosity in the RXTE band, then 1 − x′is the fraction of the soft X-ray luminosity produced by the thin accretion disk, and x′ increases
monotonically with time. This is exactly what is observed by Munoz-Darias et al. (2011b) for MAXI J1659-152.
Type-C QPOs are seen in this HIMS also (Motta et al. 2011). Their explanation is naturally provided by Lense-Thirring precession of the inner ADAF-like part of the accretion flow (Ingram et al. 2009; Ingram & Done 2011; 2012).
Our picture makes the prediction that in the lower branch of the q-shaped curve (between points D and E in Fig. 1, top panel), the average timelag of the hard X-rays with respect to the soft X-rays should increase as the hardness ratio increases. This is because the ADAF, where the upscattering of the soft photons occurs, moves to progressively larger radii in the HIMS (Rtrincreases; Das & Sharma 2013) and the light travel time of the upscattered photons increases.
2.11 Second jet-line crossing
In the HLD (Fig. 1, top panel), we are now at a point, say, a bit to the left of point E. As we discussed above, the jet line in the hard to soft transition (transition from HIMS to SIMS) has no counterpart in the soft to hard transition (SIMS to HIMS). Thus, in the “return” track, we define the jet line as the line indicating the estab-lishment of a compact radio jet. This line occurs before the sources reach the LHS (Miller-Jones et al. 2012).
By this time, the major part of the accretion flow is geometricaly thick and Rtr has increased to tens or hundreds of gravitational radii. Thus, the hardness ratio at this jet line is significantly larger than the one at the jet line at higher luminosity. As a result, the line joing the disappearence of the compact jet (upper branch) and the appearence of a compact jet (lower branch) is slanted (Fig. 1, top panel).
2.12 Hard state again
When the geometrically thick accretion flow occupies most of the accretion flow, the sources reach the LHS (point E in Fig. 1, top panel). As at the beginning of the outburst, the soft seed photons are mainly cyclotron photons from the jet and the up-scattering occurs in the ADAF and/or the jet. The thin disk has a small contribution of soft photons.
2.13 Return to the quiescent state
As the mass-accretion rate continues to decrease, the flow remains ADAF like, the magnetic field produced by the PRCB weakens, the jet also weakens, but the hard X-ray spectrum (power law) remains approximately the same. Thus, the sources trace a nearly vertical path from point E downwards (Fig. 1, top panel). To “zeroth order”, this path is identical to the one at the beginning of the outburst, because in both cases the accretion flow inside Rtris ADAF-like.
3 Remarks
The q-shaped curve exhibited by BHTs in a hardness - luminosity diagram is a hys-teresis curve, like those seen in many branches of science. Such curves are exhibited when the system’s future development depends not only on its current state, but also on its past history.
In our case, the poloidal magnetic field that is created by the PRCB in the ADAF during the quiescent state and persists in the hard state, “reminds” the flow that it should remain ADAF-like, despite the fact that the accretion rate has increased significantly. Only at accretion rates near the Eddington limit the thin accretion disk prevails everywhere.
In view of the above, we can describe the stability of the two main spectral states (soft and hard) at the same luminosity as follows. Consider an accretion rate such that the observed luminosity is between the upper and lower branches of the q-shaped curve, i.e., between points D and C or points E and B in Fig. 1, top panel. For such an accretion rate, the accretion flow is happy to be either ADAF-like (points between E and B in Fig. 1) or Shakura-Sunyaev - type (points between D and C in Fig. 1). Which of the two it will be, depends on its previous history. In going from point A to point B in Fig. 1, the system is “reminded” by the poloidal magnetic field that it is on an ADAF-like solution and that it should remain on it. Similarly, in going from point C to point D in Fig. 1, the system is happy with the ShakuraSunyaev -type solution that it is on and continues on it.
In summary, “memory” of the system plus one parameter, the accretion rate, are enough to explain the q-shaped curve in BHTs.
We remark however that astrophysical models and ideas do not explain all the observational details. Our proposed picture here is no exception. Thus, we leave it to future work by us or others to address “first order” observations, like the anomalous state (Belloni 2010), the fact that the loops in the HLD traversed by GX 339-4 in its four recent outbursts are one inside the other, the repeated crossings of the first jet line, and so on.
4 Conclusions
By making two rather obvious and generally accepted assumptions, we have been able to explain the major effects observed in the HLD of BHTs. The assumptions are the following:
1) The accretion rate onto BHTs as a function of time has a generic bell-shaped curve. It starts from a very low accretion rate, it increases steadily up to an accretion rate comparable to the Eddington rate, and ends again with a very low accretion rate. This is justified by the fact that BHTs start and end their outbursts at very low luminosity, where the sources are usually undetected within short observing times. About midway into the outburst, the luminosity reaches an approximate plateau and has a value comparable to the Eddington luminosity.
2) At high accretion rates, the accretion disk is optically thick, geometrically thin, and it is described well by the model of Shakura & Sunyaev (1973). At low accretion rates, the accretion flow is radiatively inefficient, geometrically thick, optically thin, and advection dominated (ADAF; Narayan & Yi 1994, 1995; Abramowitz et al. 1995). Both of these pictures are well accepted and have been verified by numerical simulations (Ohsuga et al. 2009).
According to Kylafis et al. (2012), when the accretion flow has an inner ADAF-like part, the PRCB works efficiently. Thus, a strong, poloidal magnetic field is established and a jet forms within hours or days, depending on the luminosity. This is exactly what is observed in a HLD. In the right part of the q-shaped curve in a HLD, the accretion rate is relatively low, part or all of the accretion flow is ADAF-like, and a jet is always present.
At high accretion rates, the accretion disk is of the Shakura-Sunyaev (1973) type, the PRCB works inefficiently, and a strong, poloidal magnetic field that would form a jet is not established. This is consistent with our current knowledge. No jet has ever been detected in the soft state.
Because of the above, it is natural to expect a flaring jet in the first jet-line cross-ing, but not in the second one. As the sources approach the first jet line, the ADAF part of the accretion flow, that feeds the jet, shrinks. On the other hand, since the thin accretion disk cannot sustain the existing magnetic field, the thin disk becomes unstable to Rayleigh-Taylor-type instability modes, and the accumulated magnetic field escapes to the outer disk in the form of magnetic “strands” (Kylafis et al. 2012). Magnetic reconnection then produces the flare. This is not the case though in the second jet-line crossing. There, due to the low luminosity, the magnetic field builds
up slowly in the ADAF part of the accretion flow, and continues increasing as the ADAF part of the flow grows outwards and eventually occupies most of the flow.
In summary, we have shown that the main phenomena observed in the q-shaped curve in a HLD of BHTs can be explained with only one parameter, the accretion rate. Furthermore, we have shown that the q-shaped curved will always be traversed in the counterclockwise direction and we predict that no source will ever be seen to traverse the entire q-shaped curve in the clockwise direction. In addition, we predict that the average timelag of the hard X-rays with respect to the soft X-rays will decrease with time in the upper branch and increase with time in the lower branch of the q-shaped curve.
Regarding jet formation and destruction, our picture is applicable to neutron-star and white-dwarf X-ray binaries as well (Kylafis et al. 2012).
Acknowledgements We thank an anonymous referee for helpful suggestions and comments, which have improved our paper in both content and readability. We have also profited from dis-cussions with Iossif Papadakis. One of us (NDK) acknowledges useful disdis-cussions with P. Casella, I. Contopoulos, B. F. Liu, S. Motta, R. Narayan, and A. Zdziarski. This research has been sup-ported in part by EU Marie Curie projects no. 39965 and ITN 215212 (“Black Hole Universe”), EU REGPOT project number 206469, a Small Research Grant from the University of Crete, a COST-STSM-MP0905 grant and a grant from the European Astronomical Society in 2012. TMB acknowledges support from INAF-PRIN 2012-6.
References
1. Abramowicz, M. A., Chen, X., Kato, S., & Regev, O. 1995, ApJ, 438, L37 2. Axelsson, M., Hjalmarsdotter, L., & Done, C. 2013, MNRAS, 431, 1987 3. Bai, X.-N. & Stone, J. M. 2013, ApJ, 767, 30
4. Belloni, T., Psaltis, D., & van der Klis, M. 2002, ApJ, 572, 392
5. Belloni, T., Homan, J., Casella, P., van der Klis, M., Nespoli, E., Lewin, W.H.G., Miller, J.M., & M´endez, M. 2005, A&A, 440, 207
6. Belloni, T. 2010, LNP, 794, 53
7. Belloni, T., Motta, S., & Mu˜noz-Darias, T. 2011, BASI, 39, 409 8. Blandford, R. D., & Payne D. G. 1982, MNRAS, 199, 883
9. Cabanac, C., Fender, R. P., Dunn, R. J. H., & K¨ording, E.G. 2009, MNRAS, 404, 738 10. Casella, P., Belloni, T., Homan, J., & Stella, L. 2004, A&A, 426, 587
11. Casella, P., Belloni, T., & Stella, L. 2005, ApJ, 629, 403
12. Christodoulou, D. M., Contopoulos, I., & Kazanas, D. 2008, ApJ, 674, 388 13. Churazov, E., Gilfanov, M., & Revnivtsev, M. 2001, MNRAS, 321, 759 14. Contopoulos, I. 1995, ApJ, 450, 616
15. Contopoulos, I., & Kazanas, D. 1998, ApJ, 508, 859
16. Contopoulos, I., Kazanas, D., & Christodoulou, D. M. 2006, ApJ, 652, 1451 17. Corbel, S. Aussel, H., Broderick, J. W., et al. 2013, MNRAS, 431, L107 18. Cui, W., Zhang, S.N., Chen, W., & Morgan, E.H. 1999, ApJ, 512, L43 19. Das, U., & Sharma, P. 2013, MNRAS, submitted, arXiv:1304.1294 20. Done, C., Gierli´nski, M., & Kubota, A. 2007, A&ARv, 15, 1
21. Esin, A. A., McClintock J. E., Drake, J. J., Garcia, M. R., Haswell, C. A., Hynes, R. I., & Muno, M. P. 2001, ApJ, 555, 483
23. Esin, A. A., Narayan, R., Cui, W., Grove, J. E., & Zhang, S.-N. 1998, ApJ, 505, 854 24. Fender, R. P., Belloni, T. M., & Gallo, E. 2004, MNRAS, 355, 1105
25. Fender, R. P., Homan, J., & Belloni, T. M. 2009, MNRAS, 396, 1370 26. Gallo, E. 2010, LNP, 794, 85
27. Gallo, E., Fender, R. P., Miller-Jones, J. C. A., Merloni, A., Jonker, P. G., Maccarone, T. J., & van der Klis, M. 2006, MNRAS, 370, 1351
28. Gilfanov, M. 2010, LNP, 794, 17 29. Giannios, D. 2005, A&A, 437, 1007
30. Giannios, D., Kylafis, N. D., & Psaltis, D. 2004, A&A, 425, 163 31. Gierli´nski, M. & Newton, J. 2006, MNRAS, 370, 837
32. Gierli´nski, M., Zdziarski, A. A., Poutanen, J., Coppi, P. S., Ebisawa, K., & Johnson, W. N. 1999, MNRAS, 309, 496
33. Grove, J.E., Johnson, W.N., Kroeger, R.A., McNaron-Brown, K., Skibo, J.G., & Phlips, B.F. 1998, ApJ, 500, 899
34. Hawley, J. F. 2009, Ap& SS, 320, 107
35. Homan, J., Wijnands, R., van der Klis, M., Belloni, T., van Paradijs, J., Klein-Wolt, M., Fender, R., & M´endez, M. 2001, ApJSuppl., 132, 377
36. Homan, J., & Belloni, T. 2005, Ap&SS, 300, 107 37. Igumenshev, I. V. 2008, ApJ, 677, 317
38. Ingram, A., Done, C., & Fragile, P. C. 2009, MNRAS, 397, L101 39. Ingram, A., & Done, C. 2011, MNRAS, 415, 2323
40. Ingram, A., & Done, C. 2012, MNRAS, 419, 2363
41. Kalemci, E., Tomsick, J. A., Rothschild, R. E., Pottschmidt, K., & Kaaret, P. 2001, ApJ, 563, 239
42. Kalemci, E., Tomsick, J. A., Rothschild, R. E., Pottschmidt, K., Corbel, , Wijnands, R., Miller, J. M., & Kaaret, P. 2003, ApJ, 586, 419
43. Kalemci, E., Tomsick, J. A., Rothschild, R. E., Pottschmidt, K., & Kaaret, P. 2004, ApJ, 603, 231
44. Kalemci, E., Tomsick, J. A., Buxton, M. M., Rothschild, R. E., Pottschmidt, K., Corbel, S., Brocksopp, C., & Kaaret, P. 2005, ApJ, 622, 508
45. Kalemci, E., Tomsick, J. A., Rothschild, R. E., Pottschmidt, K., Corbel, S., & Kaaret, P. 2006, ApJ, 639, 340
46. Kylafis, N. D., Contopoulos, I., Kazanas, D., & Christodoulou, D. 2012, A&A, 538, 5 47. Kylafis, N. D., Papadakis, I. E., Reig, P., Giannios, D., & Pooley, G. G. 2008, A&A, 489, 481 48. Lasota, J.-P. 2001, NewAR, 45, 449
49. Levine, A.M., Bradt, H, Morgan, E.H., & Remillard, R. 2006, Adv. Sp. Rev., 38, 2970 50. Liu, B. F., Taam, R. E., Meyer-Hofmeister, E., & Meyer, F. 2007, ApJ, 671, 695 51. Liu, B. F., Yuan, W., Meyer, F., Meyer-Hofmeister, E., & Xie, G. Z. 1999, ApJ, 527, L17 52. Lovelace, R. V. E., Rothstein, D. M., & Bisnovatyi-Kogan, G. S. 2009, ApJ, 701, 885 53. Lynden-Bell, D. 1996, MNRAS, 279, 389L
54. Machida, M., Nakamura, K., & Matsumoto, R., 2006, PASJ, 58, 193 55. Markoff, S., Nowak, M. A., & Wilms, J. 2005, ApJ, 635, 1203 56. Marsh, T. R., Robinsin, E. L., & Wood, J. H. 1994, MNRAS, 266, 137
57. McClintock, J. E., Narayan, R., Garcia, M. R., Orosz, J. A., Remillard, R. A., & Murray, S. S. 2003, ApJ, 593, 435
58. McClintock, J. E., Remillard, R. A., Rupen, M. P., Tores, M. A. P., Steeghs, D., Levine, A. M., & Orosz, A. 2009, ApJ, 698, 1398
59. Meyer, F., Liu, B. F., & Meyer-Hofmeister, E. 2000, A&A, 361, 175 60. Meyer, F., & Meyer-Hofmeister, E. 1981, A&A, 104, L10
61. Meyer-Hofmeister, E., Liu, B. F., & Meyer, F. 2009, A&A, 508, 329 62. Meyer-Hofmeister, E., & Meyer, F. 2001, A&A, 380, 739
63. Mignone, A., Rossi, P., Bodo, G., Ferrari, A., & Massaglia, S. 2010, MNRAS, 402, 7 64. Miller, J. M., Homan, J., & Miniuti, G. 2006a, ApJ, 652, L113
65. Miller, J. M., Homan, J., Steeghs, D., et al. 2006b, ApJ, 653, 525
67. Miyamoto, S., Iga, S., Kitamoto, S., & Kamado, Y. 1993, ApJ, 403, L39 68. Miyamoto, S., Kitamoto, S., Hayashida, K., & Egoshi, W. 1995, ApJ, 442, L13 69. Motta, S., Belloni, T., & Homan, J. 2009, MNRAS, 400, 1603
70. Motta, S., Mu˜noz-Darias, T., & Belloni, T. 2010, MNRAS, 408, 1796
71. Motta, S., Mu˜noz-Darias, T., Casella, P., Belloni, T., & Homan, J. 2011, MNRAS, 418, 2292 72. Munoz-Darias, T., Motta, S., & Belloni, T. M. 2011a, MNRAS, 410, 679
73. Munoz-Darias, T., Motta, S., Stiele, H., & Belloni, T. M. 2011b, MNRAS, 415, 292 74. Narayan, R., Barret, D., & McClintock, J. E. 1997, ApJ, 482, 448
75. Narayan, R., McClintock, J. E., & Yi, I. 1996, ApJ, 457, 821 76. Narayan, R., & Yi, I. 1994, ApJ, 428, L13
77. Narayan, R., & Yi, I. 1995, ApJ, 452, 710
78. Nespoli, E., Belloni T., Homan, J., Miller, J.M., Lewin, W.H.G., M´endez, M., & van der Klis, M. 2003, A&A, 412, 235
79. Ohsuga, K., Mineshige, S., Mori, M., & Kato, Y. 2009, PASJ, 61, L7
80. Orosz, J. A., Bailyn, C. D., Relillard, R. A., McClintock, J. E., & Foltz, C. B. 1994, ApJ, 436,848
81. Plant, D. S., Fender, R. P., Ponti, G., Munoz-Darias, T., & Coriat M. 2013, MNRAS, submit-ted, arXiv1309.4781
82. Pottschmidt, K., Wilms, J., , Nowak, M. A., Pooley, G. G., Gleissner, T., Heindl, W. A., Smith, D. M., Remillard, R., & Staubert, R. 2003, A&A, 407, 1039
83. Poutanen, J., Krolik, J. H., & Ryde, F. 1997, MNRAS, 292, L21 84. Reig, P., Kylafis, N. D., & Giannios, D. 2003, A&A, 403, L15 85. Qian, L., Liu, B. F., & Wu, X.-B. 2007, ApJ, 669, 1145
86. Reis, R. C., Fabian, A. C., & Miller, J. M. 2010, MNRAS, 402, 836 87. Remillard, R. A., & McClintock, J. E. 2006, ARA&A, 44, 49 88. Reynolds, M. T., & Miller, J. M. 2013, ApJ, 769, 16
89. Romanova, M. M., Ustyugova, G. V., Koldova, A. V., & Lovelace, R. V. E. 2009, in Protostel-lar Jets in Context, ed. K. Tsinganos, O. Ray, & M. Stute, Ap& SS, Proc. (Berlin: Springer), 153
90. Shakura, N. I., & Sunyaev, R. A. 1973, A&A, 24, 337 91. Smak, J. 1984, Acta Astron., 34, 161
92. Sobolewska, M. A., Papadakis, I. E., Done, C., & Malzac, J. 2011, MNRAS, 417, 280 93. Stiele, H., Motta, S., Munoz-Darias, T., & Belloni, T. M. 2011, MNRAS, 418, 1746 94. Stiele, H., Mu˜noz-Darias, T., Motta, S., & Belloni, T. 2012, MNRAS, 422, 679 95. Takizawa, M., Dotani, T., Mitsuda, K., et al. 1997, ApJ, 489, 272
96. Tchekhovskoy, A., Narayan, R., & McKinney, J. C. 2011, MNRAS, 327, L79
97. Uttley, P., Wilkinson, T., Cassatella, P. Wilms, J., Pottschmidt, K., Hanke, M., & Bck, M. 2011, MNRAS, 414, L60