M A J O R A R T I C L E
Predicting Trends in HIV-1 Sexual
Transmission in Sub-Saharan Africa Through
the Drug Resource Enhancement Against AIDS
and Malnutrition Model: Antiretrovirals for
Reduction of Population Infectivity, Incidence
and Prevalence at the District Level
Leonardo Palombi,1Giuseppe M. Bernava,2Andrea Nucita,4Pietro Giglio,5Giuseppe Liotta,1Karin Nielsen-Saines,6
Stefano Orlando,2Sandro Mancinelli,1Ersilia Buonomo,1Paola Scarcella,1Anna Maria Doro Altan,1Gianni Guidotti,2 Susanna Ceffa,2Jere Haswell,7Ines Zimba,8Nurja Abdul Magid,8and Maria Cristina Marazzi3
1
Department of Epidemiology and Public Health, Tor Vergata University;2DREAM Program, Sant’Egidio Community,3Department of Preventive Medicine, LUMSA University, Rome;4Department of Physics, Università degli Studi di Messina,5Departmetnt of Public Health, Università degli Studi di Perugia, Italy;6Department of Pediatrics, David Geffen UCLA School of Medicine, Los Angeles, California;7DREAM Program, Blantyre, Malawi; and
8
DREAM Program, Maputo, Mozambique
Background. The use of antiretrovirals to reduce the incidence of human immunodeficiency virus (HIV)
in-fection has been evaluated in mathematical models as potential strategies for curtailing the epidemic. Cohort data from the Drug Resource Enhancement Against AIDS and Malnutrition (DREAM) Program was used to generate a realistic model for the HIV epidemic in sub-Saharan Africa.
Methods. Two combined stochastic models were developed: patient and epidemic models. Models were
com-bined using virus load as a parameter of infectivity. DREAM data that assessed patient care in Mozambique and Malawi were used to generate measures of infectivity, survival, and adherence. The Markov chain prediction model was used for the analysis of disease progression in treated and untreated patients. A partnership model was used to assess the probability that an infected individual would transmit HIV.
Results. Data from 26 565 patients followed up from January 2002 through July 2009 were analyzed with the
model; 63% of patients were female, the median age was 35 years, and the median observation time was 25 months. In the model, a 5-fold reduction in infectivity (from 1.6% to 0.3%) occurred within 3 years when triple ART was used. The annual incidence of HIV infection declined from 7% to 2% in 2 years, and the prevalence was halved, from 12% to 6%, in 11 years. Mortality in HIV-infected individuals declined by 50% in 5 years. A cost
analysis demonstrated economic efficiency after 4 years.
Conclusions. Our model, based on patient data, supports the hypothesis that treatment of all infected
individ-uals translates into a drastic reduction in incident HIV infections. A targeted implementation strategy with massive population coverage is feasible in sub-Saharan Africa.
A recent article by Granich et al [1] tested, through a
mathematical model, the hypothesis that universal voluntary testing and treatment represents a chance to
eradicate the human immunodeficiency virus (HIV)
epidemic in an acceptable period of time. Based on actual cohort data from the Drug Resource Enhance-ment Against AIDS and Malnutrition (DREAM) Program, we generated a new model and assessed its validity in the sub-Saharan Africa context. The Received 10 October 2011; accepted 24 February 2012.
Presented in part: 17th Conference on Retroviruses and Opportunistic Infec-tions, San Francisco, CA, 16–19 February 2010.
Correspondence: Karin Nielsen-Saines, MD, MPH, Division of Infectious Diseases, David Geffen UCLA School of Medicine, MDCC 22-442 10833 LeConte Ave, Los Angeles, CA 90095 ([email protected]).
Clinical Infectious Diseases
© The Author 2012. Published by Oxford University Press on behalf of the Infectious Diseases Society of America. All rights reserved. For Permissions, please e-mail: [email protected].
DOI: 10.1093/cid/cis380
Clinical Infectious Diseases Advance Access published May 21, 2012
at University of California, Los Angeles on May 23, 2012
http://cid.oxfordjournals.org/
extrapolation of parameters obtained in the field, based on real data from public health programs, is paramount for key variables such as mortality, retention, and adherence. These measures affect the epidemic trend and, consequently, the reli-ability of the model. Given that the proposal for rapid imple-mentation of treatment is challenging due to cost constraints and need for high-skilled personnel, we tested the effects of a district-based strategy followed by gradual scale-up with
high-prevalence areas targetedfirst. Our hypothetical model differs
from that of Granich [1], in that we propose to initiate
antire-troviral therapy (ART) using the World Health Organization
(WHO) CD4 count threshold of 350 cells/mm3, with the
intent of extending treatment to the entire HIV-infected population within a short period of time. Our assumption was also that all new HIV infections would be immediately treated and retained in treatment through annual testing.
METHODS Study Design
To develop a hypothetical model of the HIV epidemic in a sub-Saharan population, the following assumptions were made: (1) all new infections arose from heterosexual coital acts, without condom use; (2) the population size was that of a medium-sized district (300 000 persons); (3) social differences or geographical distances between individuals were not con-sidered; (4) population mobility was estimated at 3%, with a
balance between immigration and emigration flux. We
assumed that mobility did not affect age distribution and that individuals entering or exiting were randomly susceptible to HIV infection. There were no assumptions that individuals established in the district were older or younger or more or less susceptible to HIV infection. Our average district was rural, with no factories, mines, or relevant economic activities
to justify an immigrantflux of young people for job reasons.
Two combined stochastic models were used. The first
de-scribed disease progression in a single patient, whereas the second described the interaction between a single patient and the evolution of the epidemic in the population. To combine both
models, we used viral load as a parameter of infectivity [2–4].
Patient Model
To generate the model, DREAM Program data from adult patients who visited DREAM medical centers in Mozambique and Malawi from January 2002 through July 2009 were used. Clinical progression was monitored (with measurement of CD4 cell counts quarterly and viral loads every 6 months, clinical visits every 3 months, and follow-up every 3 months) in individuals receiving ART (eligible per WHO guidelines) and those who did not reach clinical or laboratory thresholds for ART initiation. The DREAM Program routinely collected
pill count data, but even if there was a good correlation with
viral load [5], we preferred to include the latter in the model,
especially because of its usefulness in assessing individual and population infectivity. In this way, it was possible to calculate measures of survival time, annual mortality rate, patients lost to follow-up, and refusal rates in the population. These param-eters were introduced in a Markov chain prediction model for the analysis of disease progression in treated and untreated patients.
Parameters were categorized as follows: CD4 cell counts,
<200, 200–350, or >350 cells/mm3; HIV-1 virus load, not
available, ≤1700, 1700–12 000, 12 000–38 500, or >38 500
copies/mL; and ART use, yes or no. Viral load thresholds
were selected based on prior infectivity studies [2–6], and
CD4 cell count categories were based on clinical survival
thresholds [7,8].
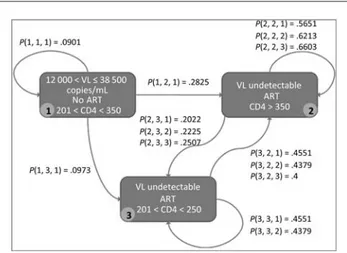
The clinical evolution of patients was assessed every 6 months, to coincide with the timing of complete blood cell counts. At each step, the health status of a patient was deter-mined by the combination of viral load and CD4 cell count values and ART parameters. Consequently, 31 health states were possible, including death. Health states were modeled in
a Markov chain as shown in Figure1, with patients modeled
as agents in a complex simulation system.
Markov Chain
A Markovian process is a stochastic process in which the probability of migrating from one state to another depends on the current state, irrespective of the previous path. Therefore,
Figure 1. A small portion of the Markov chain used in the model. Each rectangle represents a patient state, characterized by a viral load (VL) value, a CD4 cell count value and a Boolean value indicating whether or not the patient is receiving triple antiretroviral therapy (ART). Arcs represent the probability that a patient will change state; for example,P (i,j,k) represents the probability that a patient will pass from statei to state j after k semes-ters (or 6 month blocks). Abbreviation: ART, antiretroviral therapy.
at University of California, Los Angeles on May 23, 2012
http://cid.oxfordjournals.org/
the Markov chain is a discrete random process that uses the Markov property. The Markov probability matrix expresses the transition probabilities for all the possible state transitions. More precisely, given the probability matrix Q, the matrix
element qijrepresents the probability of transition from state i
to state j. In this study, each state of the Markov chain was represented by the health status of a patient. Markov chains can have graphic representations, where the nodes represent
the states and the edges the transition probabilities (Figure1).
Subsequently, the clinical histories of the patients are de-scribed as states sequences, and the transition probabilities are extracted for all possible state transitions.
Epidemic Model
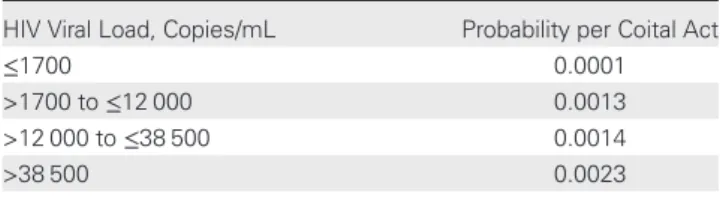
This model describes disease evolution in the whole popula-tion. Patient infectivity by viral load value was determined
according to prior studies [2]. As illustrated in Table 1, the
probability of infection was assigned according to viral load ranges, and it was possible to assess infectivity risk per coital act at any point of observation. Relationships among individuals, including multipartner relationships, were modeled according
to Kretzschmar and Morris [9]. In that model, given 2
individuals x and y, the probability that a relationship was es-tablished was calculated by a formula, where: partners(x) and partners(y) are the numbers of present partners respectively of x and y; d is the maximum value of partners(z), for all individ-uals z in population observed at that time ; π is a parameter that takes into account a preference among partners x and y, based on the geographical closeness. In our study we assumed
that π = 1, because we considered individuals from the same
district. In the epidemic model, the evolution of the epidemic was determined by new infections caused by HIV-infected in-dividuals having relationships with uninfected subjects.
We assumed that sexual mixing was disassortive, in the
sense that “high-activity individuals mix with low-activity
individuals and vice-versa,” according to Kretzschmar [9], and
also considering the Malawian environment and society. The number of partners was considered based on a probability
derived by a mixing function [9]. There is a probability that
2 individuals at each time step unit form a partnership, and
there is also a probability that at each time step, partnerships are broken, generating the time span of relationships. Hence, the number of partnerships for each agent is a function of the population and of the probabilities of formation and breakage of relationships. In the analysis of the partnership function, the mean number of partnerships was about 3 for a popula-tion of 300 000 at a given time step. Similarly, the frequency of
sexual contacts was derived from Rakai studies [6]: number of
coital acts was a function of age, sex, and health conditions. In summary, a Markov chain was used to determine disease pro-gression in a single patient model, and a partnership model was used to assess the probability that an infected individual would transmit HIV to a serodiscordant partner.
Population
Demographic parameters were used for general population models and DREAM Program data were used for the model simulation of HIV-infected patients. A general population sample size of 300 000 individuals was considered, assuming a
balance of immigration and emigrationflux of 3% each. The
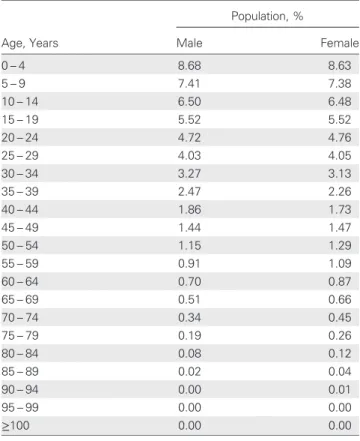
demographic pattern of a typical rural district in Malawi was assumed, and age distributions were determined according to
country data. An implementation latency time, defined as the
number of months needed for achievement of full coverage of the population, was considered with 3 scenarios at 12, 24, and 36 months, respectively. At 3 years, full coverage of the candi-date population was assumed. The demographic variables
used in the model are shown in Tables2–4and were based on
country statistics [10]. Baseline parameters used for the model
simulation of HIV-infected patients obtained from the
DREAM Program data in Malawi are shown in Table5. The
initial HIV prevalence rate was estimated at 12%. In addition, the model assumed annual universal voluntary testing of adults, immediate treatment of HIV-infected individuals with CD4
cell counts <350 cells/mm3and/or symptomatic disease (WHO
categories 3–4), treatment of patients with CD4 cell counts
>350 cells/mm3 on reaching this CD4 cell count threshold
over time, and treatment of all HIV-infected pregnant women
irrespective of immunologic or virologic status [11].
The time distribution switch between groups was a consid-eration in the model. Over time, 13% of patients who initially
entered the model with CD4 cell counts >350 cells/mm3
reached lower values after 1 year, 35% after 2 years and 18% after 3 years. The model assumed that 66% of patients with
initial CD4 counts >350 cells/mm3 would be receiving
treat-ment after 3 years, and 81% after 5 years. The model took into consideration the mortality rate of untreated patients who would likely be receiving ART in a few years even with a good
immunologic status, as illustrated in Figure2, which
demon-strates the projected transition in CD4 cell counts from >350
to <350 cells/mm3over the years.
Table 1. Probability of HIV Infection per Coital Act by Plasma Viral Load
HIV Viral Load, Copies/mL Probability per Coital Act
≤1700 0.0001
>1700 to≤12 000 0.0013 >12 000 to≤38 500 0.0014 >38 500 0.0023
Abbreviation: HIV, human immunodeficiency virus.
at University of California, Los Angeles on May 23, 2012
http://cid.oxfordjournals.org/
Cost Analysis
The cost-effectiveness of the model was determined by com-paring a universal treatment scenario (scenario A) with a
sce-nario in which a stablefigure of 45% of individuals eligible for
ART in Malawi receive it (scenario B), leading to a hypotheti-cal decline in HIV prevalence of 0.1% per year. This prevalence was obtained from the DREAM model, assuming that 45% of eligible patients were receiving treatment over the years. Other assumptions of the model included an annual cost of $1342 for
triple ART (including staff and infrastructure) [12], an annual
cost of $950 for an HIV-infected patient not receiving
ART [12], a voluntary testing and counseling cost of $3 per
individual, a district population of 300 000 residents with 50% adults, and an baseline HIV prevalence of 12%.
RESULTS
Data from 26 565 patients followed up at Mozambique and Malawi DREAM centers for >7 years were inputted into the model; 63.0% of the patients were female (n = 16 745), the
median age was 35.0 years (interquartile range, 29.0– 42.8
years), and the median observation time was 25 months
(in-terquartile range, 13– 40 months). Pregnant women were not
included. Population variables are described in Table 5. The
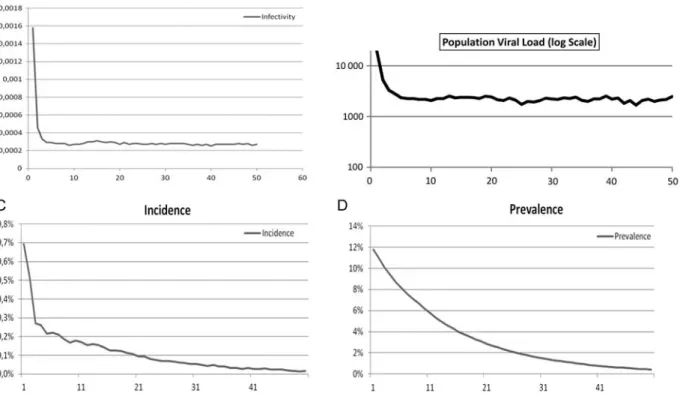
impact of the simulation on infectivity, population virus load,
incidence and prevalence over time is shown in Figure 3. A
dramatic 5-fold decrease in infectivity from 1.6% to 0.3% was
observed, reflecting the reduction of individual viral load with
a collective reduction in infectivity after the use of triple ART in the community. The logarithmic curve in the population viral load represents the median estimated viral load in treated and untreated individuals (entire population). After a steep
decline in the first 3 years, a plateau “safety” value of 2211
copies/mL of plasma was reached.
Annual incidence rates declined from 7% to 2%. This was achieved in 2 years and was further reduced to less than 1% within 20 years. The significant reduction in incident cases makes the annual death balance negative, thus contributing to Table 4. Probability of Death in Malawi by Age
Age Range, Years Probability of Death 15– 19 0.00911 20– 24 0.01934 25– 29 0.04381 30– 34 0.07873 35– 39 0.11001 40– 44 0.11593 45– 49 0.11394 50– 54 0.11440 55– 59 0.11620 60– 64 0.12693 65– 69 0.17904 70– 74 0.26834 75– 79 0.38761 80– 84 0.53768 85– 89 0.70511 90– 94 0.80573 95– 99 0.85982 ≥100 1.00000
Source: Life tables for WHO member states http://apps.who.int/whosis/ database/life_tables/life_tables.cfm[10].
Table 2. Age Distribution of Malawian Population
Population, %
Age, Years Male Female
0– 4 8.68 8.63 5– 9 7.41 7.38 10– 14 6.50 6.48 15– 19 5.52 5.52 20– 24 4.72 4.76 25– 29 4.03 4.05 30– 34 3.27 3.13 35– 39 2.47 2.26 40– 44 1.86 1.73 45– 49 1.44 1.47 50– 54 1.15 1.29 55– 59 0.91 1.09 60– 64 0.70 0.87 65– 69 0.51 0.66 70– 74 0.34 0.45 75– 79 0.19 0.26 80– 84 0.08 0.12 85– 89 0.02 0.04 90– 94 0.00 0.01 95– 99 0.00 0.00 ≥100 0.00 0.00
Source: US Census Bureau International Database 2011 [10]. These data were used in the prediction model for categorization of age.
Table 3. Demographic Parameters Used in the Model
Variable Rural District Malawi General population, No. 316 000 13 900 000 Annual growth rate in 1998–2008, % 2.3 2.8 Total growth in 1998–2008, No. 63 000 … Crude death rate, % … 15.2 Life expectancy, years … 50
Source: Malawi Census 2008, preliminary report [10].
at University of California, Los Angeles on May 23, 2012
http://cid.oxfordjournals.org/
the reduction in prevalence. In approximately 11 years, the prevalence was halved from 12% to 6%. After decades, the estimated critical threshold of 1% prevalence was attained. The contributing factors to the decline in HIV prevalence were mortality in the HIV-infected population, reduction in incident infections, and the demographic growth of the general population.
Mortality in our model, as compared with the Granich
model [1], is shown in Figure4. Whereas the 50% survival in
the populations is similar (10 and 11 years), the DREAM curve has a more pronounced early mortality rate but longer late survival rate. As a result, the reduction in prevalence is much slower in the DREAM model than in the CASCADE
analysis [1]. Table 6 illustrates incidence and prevalence of
HIV in the community during a 5-year period and was the basis of the cost analysis. Of note, there was nearly a 10-fold reduction in incident infections and almost a two-thirds reduction in deaths.
Considering an annual ART cost of 1342 USD per
person-year [12], the total cost of scenario A becomes lower in 22
years. An HIV-infected individual represents a cost to the healthcare system even if no ART is provided. This cost, esti-mated at $950 USD per person-year, was included in scenario B and demonstrates that universal treatment becomes
economically efficient after 4 years. Figure 5 illustrates ART
cost estimates of scenarios A and B and total costs of scenario B over time.
DISCUSSION
Ourfindings, based on parameters obtained from an existing
cohort of patients in Malawi and Mozambique, support the
main conclusions of the Granich study [1], that is, treatment
of all infected individuals translates into a drastic reduction in
incident HIV infections and leads to the“sterilization” of the
epidemic. Both modeling approaches demonstrate a clear re-duction of new cases well below the substitution threshold. Randomized controlled studies such as HPTN 052, which evaluated HIV sexual transmission in serodiscordant couples, effectively demonstrated a 96% reduction in HIV transmission when the index partner was treated with triple ART at a
rela-tively higher CD4 cell count threshold (350–550 cells/mm3)
[13]. Data from mother-to-child transmission studies have
extensively demonstrated that a marked reduction in HIV
transmission is achievable with viral load suppression [14–16].
The model from our study, based on real-life parameters, con-firms this assumption.
Our model demonstrated a slightly lower reduction in HIV
incidence than the Granich simulation [1]. In our model, the
2% incidence threshold is reached in 2 years, but it takes 20 Table 5. Baseline Parameters for HIV-Infected Patients Used in
Model Simulation
Variable Patients, No. (N = 26 565) Patients, % CD4 cell count, cells/mm3
<200 13 891 52.3 200–350 7600 28.6 >350 5074 19.1 HIV viral load, copies/mL
Not available 980 3.7 ≤1700 1474 5.6 >1700 to≤12 000 3506 13.2 >12 000 to≤38 500 5315 20.0 >38 500 15 288 57.6 ART initiated Yes 146 0.55 No 26 419 99.5
Lost to follow-up per yeara 133 0.5
Adherencea
Drug delivery indexa
>95% … 80.1
90%–95% … 10.7
<90% … 9.3
Clinical visit indexa
>95% … 69.3
90%–95% … 13.4
<90% … 17.3
Abbreviations: ART, antiretroviral therapy; HIV, human immunodeficiency virus.
a
For the adherence categories, there are no baseline values, and adherence parameters include patients who eventually died or were lost to follow-up. Adherence was calculated as the combination of 2 ratios: that of drug delivery appointments prescribed to those completed and that of clinical visit appointments scheduled to those completed.
Figure 2. Projected transition of patients achieving CD4 cell counts of <350 cells/mm3 over the years. This graph shows the percentage of patients arriving at Drug Resource Enhancement Against AIDS and Malnutrition centers with CD4 cell counts >350 cells/mm3 and starting antiretroviral therapy after each 6-month simulation step. More than 75% of patients initiated therapy within thefirst 2 years.
at University of California, Los Angeles on May 23, 2012
http://cid.oxfordjournals.org/
years (as opposed to 10 years in the prior model) for HIV incidence to fall below 1%. We do not consider this difference relevant, however, because it is probably due to differences in
the timing of enrollment. In the Granich model [1], one
parameter for the simulation is that there is immediate intervention for all HIV-infected patients. In our model, the access to intervention for patients with CD4 cell counts >350
cells/mm3is delayed until this threshold is reached. The most
significant finding in our model was the substantial and stable reduction in viral load infectiousness in our population, even if a more gradual approach to ART initiation was implement-ed in our scenario. This was a conservative approach, as in our opinion, acceleration of the ART initiation process would be the optimal end point, because such a measure would enhance the sustainability of HIV/AIDS programs worldwide.
Figure 3. The simulation used the following parameters: population, 300 000; initial prevalence, 12%; population growth rate per year, approximately 2.3%; number of 6-month simulation steps, 100; probability that a patient will be lost to follow-up, 3%; death rate among patients lost to follow-up after 6 months, 50%; initial treatment coverage, 50%; and coverage after 1 year, 100%.
Figure 4. Mortality distributions in the model used by Granich et al (A) and the Drug Resource Enhancement Against AIDS and Malnutrition (DREAM) model (B). In the DREAM model, we considered 4 different scenarios on the basis of CD4 cell counts. In both models, the number of infected individuals declines by half in approximately 10 years.
at University of California, Los Angeles on May 23, 2012
http://cid.oxfordjournals.org/
Our model also differed in that the reduction in prevalence was steeper in our approach, with the 1% prevalence threshold attained at 40 as opposed to 50 years. However, both simula-tions corroborate each other, because small variasimula-tions in patient loss to follow-up or adherence can produce consider-able changes in the prevalence parameter. In our model, the rate of loss to follow-up was 3%, and although it was twice as
high as the loss to follow-up reported in our program [17], we
concluded that it would be a more realisticfigure. The
simula-tion predicts that in 10 years, the prevalence would be halved, and this seems to be the most reliable forecast. Both models have a structural limitation because of the duration of the observation. Although the data seem very robust over a
5–10-year range, it becomes very difficult to model 20–30
years forward because of the well-characterized clinical
complications of HIV/AIDS and also the inherent difficulty
posed to African health services with long-term care.
Although the CD4 threshold of 350 cells/mm3 was used, a
direct head-to-head comparison of the 2 models is not possible, because our model carries 2 important exceptions. It included immediate treatment of new cases identified through annual testing and immediate treatment of pregnant women regardless of CD4 count strata. Because of the decline in CD4 counts over
time in patients who had counts of >350 cells/mm3at entry, in
3–5 years, the 2 models coincide in approach.
The DREAM model offers the advantage of gradual imple-mentation at a district level that is chosen as a priority area. The main obstacle to universal voluntary counseling, testing, and treatment is the dimension of the ordeal, which poses enormous and unsolvable challenges from the economic and human resources perspective, and therefore, a focused approach is preferable. Sustainability cannot be attained in a short period of time, because these changes would profoundly affect the entire health system and require a complex organiza-tional process. In our assessment, a mobile health organization with a strong focus on communication and information technology would need to be developed, implemented, tested
and validated in well-defined areas. The focus on districts
would facilitate policy choices, because areas of high preva-lence or incidence could be targeted initially, or districts could be chosen if they possess adequate communication facilities and infrastructure. The critical end point is that after 3 years, based on the model, the policy would be economically sustainable.
Our economic analyses did not take into consideration the economic burden of the morbidity and mortality of HIV/ AIDS in individuals not receiving ART, which, if included, would increase the economic sustainability of universal
treat-ment [18]. Another factor to be considered is the reduction in
number of orphans and pediatric HIV infections attributable to maternal treatment, which renders perinatal transmission
rates of <2% [14,16,19–21] and reduced maternal mortality
[22–23]. These variables do not affect the epidemic trend but
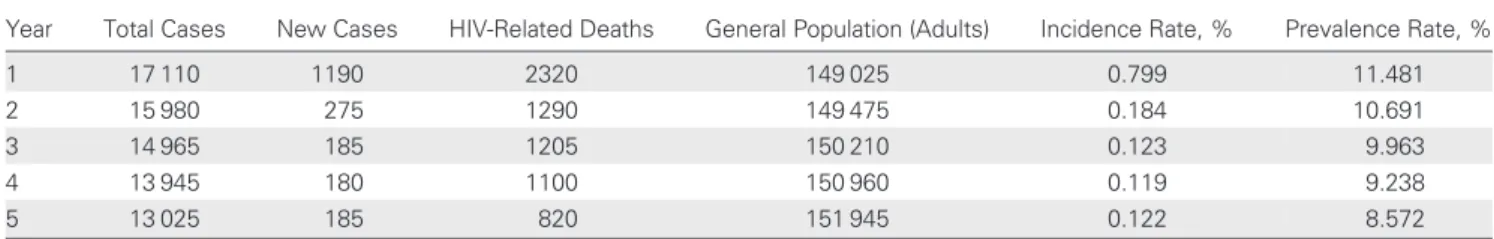
Table 6. Cases of HIV Infection During a 5-Year Period in the Drug Resource Enhancement Against AIDS and Malnutrition Patient Model
Year Total Cases New Cases HIV-Related Deaths General Population (Adults) Incidence Rate, % Prevalence Rate, % 1 17 110 1190 2320 149 025 0.799 11.481 2 15 980 275 1290 149 475 0.184 10.691 3 14 965 185 1205 150 210 0.123 9.963 4 13 945 180 1100 150 960 0.119 9.238 5 13 025 185 820 151 945 0.122 8.572
Abbreviation: HIV, human immunodeficiency virus.
Estimates for the number of HIV infections and HIV-related deaths were generated by the patient model over a 5-year period, including corresponding incidence and prevalence rates.
Figure 5. Antiretroviral (ART) cost estimates in US dollars. In thefirst scenario (scenario A), universal access to ART was considered, so the costs of treatment for all eligible patients are shown. In scenario B, we represent costs related to the treatment of the 45% of patients who were eligible patients. The total cost of scenario B include costs derived from the provision of ART to eligible patients and patient costs for indi-viduals who have not yet started ART.
at University of California, Los Angeles on May 23, 2012
http://cid.oxfordjournals.org/
are critical in survival and economic analyses. A limitation of our model was that limited data were available for patient clin-ical history extending beyond 6–8 years. Moreover, the model focuses on sexual transmission or vertical transmission modal-ities only. However, such limitations did not affect the validity of the entire scenario and projections, although it is clear that the ability to rapidly implement universal ART may vary between districts and countries.
In conclusion, our model offers a reasonable compromise as an implementation strategy that combines massive popula-tion coverage albeit within current economic and human resource constraints. Sterilization of the HIV epidemic, district by district, would offer the opportunity for furthering a
strat-egy that could be scaled up, with substantial benefits to health
care systems in sub-Saharan Africa. Notes
Author contributions. L. P., G. M. B., A. N., P. G., G. L., K. N. S., S. O., S. M., E. B., P. S., A. M. D. A., G. G., S. C., J. H., I. Z., N. A. M. and M. C. M. participated in the development of the conceptual frame-work, in the data analysis, drafting, and approval of thefinal version of this manuscript.
Financial support. The DREAM Program, of the Sant’Egidio Com-munity, a faith-based nongovernmental organization in Rome, Italy is sponsored by multiple organizations, including the World Bank Treatment Acceleration Program, several Italian private banks, and several govern-mental cooperative organizations including the German Agency for Tech-nical Cooperation, the Agence Française de Développement, the Catalan Agency for Development Cooperation, the Belgium Development Cooper-ation, and the United States President Emergency Plan for AIDS Relief. DREAM Program–Project Malawi was funded in Malawi by Intesa San-paolo and the CARIPLO Foundation, both in Italy. The present analysis was not funded by a specific award.
Potential conflicts of interest. All authors: No reported conflicts. All authors have submitted the ICMJE Form for Disclosure of Potential Conflicts of Interest. Conflicts that the editors consider relevant to the content of the manuscript have been disclosed.
References
1. Granich MR, Gilks CF, Dye C, DeCock KM, Williams BG. Universal voluntary HIV testing with immediate antiretroviral therapy as a strat-egy for elimination of HIV transmission: a mathematical model. Lancet2009; 373:48–57.
2. Quinn TC, Wawer MJ, Sewankambo N, et al. Viral load and hetero-sexual transmission of human immunodeficiency virus type 1. N Engl J Med2000; 343:921–9.
3. Das M, Chu PL, Santos GM, et al. Decreases in community viral load are accompanied by reductions in new HIV infections in San Francisco. PloS Med2010; 5:e11068.
4. Donnel D, Baeten JM, Kiarie J, et al. Heterosexual HIV-1 transmission after initiation of antiretrovirval therapy: a prospective cohort analysis. Lancet2010; 375:2092–8.
5. Palombi L, Marazzi MC, Guidotti G, et al. Incidence and predictors of death, retention, and switch to second-line regimens in antiretroviral-treated patients in sub-Saharan African Sites with comprehensive monitoring availability. Clin Infect Dis2009; 48:115–22.
6. Lutalo T, Gray RH, Wawer M, et al. Survival of HIV-infected treat-ment-naive individuals with documented dates of seroconversion in Rakai, Uganda. AIDS2007; 21:S15–9.
7. Chan KC, Yip B, Hogg RS, Montaner JS, O’Shaughnessy MV. Survival rates after the initiation of antiretroviral therapy stratified by CD4 cell counts in two cohorts in Canada and the United States. AIDS2002; 16:1693–5.
8. Wood E, Hogg RS, Yip B, Harrigan PR, O’Shaughnessy MV, Monta-ner JS. Is there a baseline CD4 cell count that precludes a survival response to modern antiretroviral therapy? AIDS2003; 17:711–20. 9. Kretzschmar M, Morris M. Measures of concurrency in networks and
the spread of infectious diseases. Math Biosci1996; 133:165–95. 10. World Health Organization. World Health Statistics 2008. Available
at: http://www.who.int/whosis/whostat/2008/en/index.html. Accessed 15 August 2011.
11. World Health Organization. Rapid advice: use of antiretroviral drugs for treating pregnant women and preventing HIV infection in infants. November, 2009.http://www.who.int/liv/pub/mtct/advice/en. Accessed 22 July 2011.
12. Badri M, Maartens G, Mandalia S, et al. Cost-effectiveness of highly active antiretroviral therapy in South Africa. PLoS Med2006; 3:e4. 13. Cohen MS, Chen YQ, McCauley M, et al. Prevention of HIV-1
infection with early antiretroviral therapy. N Engl J Med2011; 365: 493–505.
14. Marazzi MC, Nielsen-Saines K, Buonomo E, et al. Increased infant human immunodeficiency virus-type one-free survival at one year of age in Sub-Saharan Africa with maternal use of highly active antiretro-viral therapy during breastfeeding. Ped Infect Dis J2009; 28:483–7. 15. Dorenbaum A, Cunningham CK, Gelber RD, et al. Two-dose
intra-partum/newborn nevirapine and standard antiretroviral therapy to reduce perinatal HIV transmission: a randomized trial. JAMA2002; 288:189–98.
16. Marazzi MC, Liotta G, Nielsen-Saines K, et al. Extended antenatal an-tiretroviral use correlates with improved infant outcomes throughout thefirst year of life. AIDS 2010; 24:2819–26.
17. Magnano San Lio M, Mancinelli S, Palombi L, et al. The DREAM model’s effectiveness in health promotion of AIDS patients in Africa. Health Promot Int2009; 24:6–15.
18. Schwartländer B, Stover J, Hallett T, et al. Towards an improved in-vestment approach for an effective response to HIV/AIDS. Lancet 2011; 377:2031–41.
19. Palombi L, Marazzi MC, Voetberg A, Magid NA, and the DREAM Program Prevention of Mother-to-Child Transmission Team. Treat-ment acceleration program and the experience of the DREAM Program in the prevention of mother-to-child transmission of HIV. AIDS2007; 21:S65–71.
20. Anema A, Au-Yeung CG, Joffres M, et al. Estimating the impact of ex-panded access to antiretroviral therapy on maternal, paternal and double orphans in sub-Saharan Africa, 2009–2020. AIDS Res Ther 2011; 8:13. 21. Orlando S, Marazzi MC, Mancinelli S, et al. Cost-effectiveness of
using HAART in the prevention of mother to child transmission in the DREAM Project Malawi. J AIDS2010; 55:631–4.
22. Marazzi MC, Palombi L, Nielsen-Saines K, et al. Extended antenatal use of triple antiretroviral therapy in resource-limited settings for the prevention of HIV-1 mother-to-child transmission correlates with favorable pregnancy outcomes. AIDS2011; 25:1611–8.
23. Liotta G, Mancinelli S, Gennaro E, et al. Is Highly active antiretroviral therapy (HAART) in pregnancy protective against maternal mortality? Results from a large DREAM cohort in Malawi and Mozambique [abstract TUAB0201]. In: Program and abstracts of the Sixth Inter-national AIDS Society (IAS) Conference on HIV Pathogenesis, Treat-ment and Prevention (Rome). Italy,2011:160.
at University of California, Los Angeles on May 23, 2012
http://cid.oxfordjournals.org/