Alma Mater Studiorum – Università di Bologna
DOTTORATO DI RICERCA IN
Scienze Psicologiche
Ciclo XXIX
Settore Concorsuale di afferenza: 11/E1 Psicologia generale, Psicobiologia e psicometria
Settore Scientifico disciplinare: MPSI/03 Psicometria
DEVELOPMENTAL TRAJECTORIES AND
NORMATIVE PROFILES OF MOTION AND
FORM PERCEPTION
Presentata da:
Luca Mandolesi
Coordinatore Dottorato
Relatore
Prof.ssa Monica Rubini
Prof.ssa Mariagrazia Benassi
_________________________
_________________________
DEVELOPMENTAL TRAJECTORIES AND
NORMATIVE PROFILES OF MOTION AND FORM
PERCEPTION
Abstract
:The research focuses on the study of the methods useful to evaluate the developmental trajectories for global motion perception and global form perception. The studies aim to present two different instruments created in order to evaluate the dorsal and ventral streams functionalities and to analyze their psychometric characteristics.
The first study presents the Motion and Form perception tests as new tools to investigate motion and form perception accuracy. The use of these tests allows to cope with some of the criticism reported in other studies presented in literature. The tests have been evaluated in a large sample of children of different ages.
The second study evaluates the applicability of a specific psychophysical function which allows to analyze the accuracy profiles obtained by Motion and Form coherence test. The response profile of the two tasks are fitted with a half-normal distribution function, that estimates the discrimination performance (i.e. the number of correct responses) on the basis of the coherence level of a stimulus. Moreover, the use of the function allows to statistically define the perceptive thresholds of the two test and to compare them.
The third study presented analyzes the developmental trajectories of motion detection and form discrimination abilities in a sample of typically developing children (4 to 13 years) and adults. Moreover, this study allows to define the normative scores for motion coherence and form coherence tests calculated with different normative indexes in the different age groups.
The fourth study investigates if motion and form tests can recognize specific deficits in clinical populations. The differences between motion and form perception accuracy are evaluated in children with different genetic syndromes (Noonan syndrome and 22q11.2 deletion syndrome) and in controls. The different populations show specific results in motion and form perception abilities
SUMMARY
Introduction ... 6
Vision system and methods of measurement of Dorsal and Ventral pathway ... 6
1.1.1 Ventral stream tasks ... 9
1.1.2 Dorsal stream tasks ... 13
Estimating thresholds ... 18
1.2.1 The Signal Detection Theory ... 20
1.2.2 Psychometric Functions ... 22
Aims ... 26
Experiment 1 – Methods for the assessment of motion and form perception abilities in school-aged children ... 28
Aim ... 30
Methods ... 31
2.2.1 Participants ... 31
2.2.2 Measures and procedures ... 32
2.2.3 Data Analysis: ... 36
Results ... 37
2.3.1 General description of Motion Coherence test ... 37
2.3.2 General description of Form Coherence test ... 40
2.3.3 Internal consistency ... 42
2.3.4 Convergent and divergent validity and reliability ... 43
Conclusions ... 44
Experiment 2 – The analysis of the response profile of Motion and Form coherence tests ... 47
Folded normal distributions and Half normal distributions ... 48
Aim ... 50
Methods ... 51
3.3.1 Participants:... 51
3.3.2 Measures and procedures ... 51
3.3.3 Data Analysis: ... 53
Results: ... 54
Conclusions ... 58
Experiment 3 – Developmental trajectories and normative profiles of Motion and Form perception ability ... 59
Normative profiles ... 61
Methods ... 64
4.3.1 Participants:... 64
4.3.2 Measures and procedures ... 65
4.3.3 Data analysis ... 67
Conclusions ... 75
Experiment 4 – The study of motion and form perception accuracy in children with Noonan syndrome, 22q11.2 deletion syndrome and controls ... 78
Aim ... 80
Methods ... 81
5.2.1 Participants ... 81
5.2.2 Measures and procedures ... 81
5.2.3 Data analysis ... 83
Results ... 83
5.3.1 Cognitive and visual-motor abilities ... 83
5.3.2 Experimental tasks ... 84
Discussion ... 86
6
Introduction
The ability in motion perception is considered a sensitive and reliable measure of typical and atypical brain development. Because of the motion perception is considered a golden standard to measure Dorsal stream functioning, some authors referred to this issue as “Dorsal stream vulnerability hypothesis”. Indeed, deficits in motion perception are found to be related to definite neurodevelopmental disorders (Grinter, Maybery, & Badcock, 2010), such as genetic syndromes (Alfieri et al., 2001), preterm born children (Atkinson & Braddick, 2007; Birtles et al., 2007), autism spectrum disorders (Milner et al., 2002; Grinter et al., 2010), developmental dyslexia (Talcott, 2000), and schizophrenia (Martinez et al., 2008). For some of these disorders, the specificity of the motion perception deficit is used as biomarker of the disorder (Braddick, Atkinson, & Wattam-Bell, 2003). Nevertheless, some findings failed to confirm this hypothesis (Grinter, Maybery & Badcock, 2010) demonstrating that the visual deficit overlapped with other cognitive deficits.
Vision system and methods of measurement of Dorsal and Ventral pathway
Vision has been investigated in former literature both from a cognitive and a neuropsychological perspective and quite recently these approaches have been integrated. Behavioral findings have been considered together with neuroimaging evidences, providing a better explanation of the different aspects of vision perception. However, a relevant part of the literature has dealt with difficulty in the integration of the different results on the same topic (Burr & Thompson, 2011; Nishida, 2011).
7
Fig. 1 – Dorsal and Ventral pathways
It has been argued that the visual information is hierarchically processed in the cortex: V1 cortex elaborates information about orientation, curvature, spatial or temporal frequency, color perception from a small part of the visual field. The regions in the extrastriate cortex combine this information to construct global representation of the stimuli (Maunsell & Newsome, 1987). Although it was initially supposed that the elaboration of visual information proceeded in feed-forward direction, in a direct linear way, later studies discovered numerous feed-back and feed-forward interactions between the two streams (Zeki & Shipp, 1988;Laycock, Crewther, & Crewther, 2007). This interaction seems to be also implicated in the fastest global analysis of the stimuli related to initiation of attention mechanism (Saalmann, Pigarev, & Vidyasagar, 2007).
Neuro anatomical studies demonstrated that in human and primate visual system, the visual information, runs segregated in two major pathways: Dorsal stream and Ventral stream (Merigan & Maunsell, 1993; Braddick & Atkinson, 2011) (Fig. 1). This segregation starts from the retina, continues to the lateral geniculate nucleus (LGN) in the thalamus, and to the primary visual cortex
8
(V1) (Casagrande, Yazar, Jones, & Ding, 2007; Merigan & Maunsell, 1993). The LGN is constituted by six layers: the two lower layers composed by magno-cells (M), and the other four upper layers by the parvo-cells (P) (Maunsell et al., 1999). The M and P cells differ in their anatomical and functional characteristics: M cells have larger receptive fields, higher temporal resolution and lower spatial resolution than P cells (Kaplan, 2004). The M cells provide the information about the changes and movements of the stimuli. From V1 this type of information is primarily transmitted to V2 and V3 and then coded in V5 (also called MT). From V5 this information is then transmitted to the posterior parietal lobe, constituting the dorsal visual stream. P cells instead are more sensitive to colors and stationary stimuli. From V1 this type of information is primarily transmitted to V2 and V3 and then coded in V4 and eventually transmitted to the infero-temporal areas, constituting the ventral visual stream (Livingstone & Hubel, 1987; Maunsell, 1987; Zeki, 1978).
Goodale and Milner (1992) proposed the perception-action model of primate vision, that provides a functional interpretation for the two cortical visual streams: ventral stream processes visual information for perceptual purposes (called what stream), and the dorsal stream provides visual guidance for movement (where stream). Even if there is a lot of evidence that ventral stream is implicated in form processing and dorsal stream in motion processing, latter studies show that the two pathways are not completely segregated. Conversely, the two streams show reciprocal cross-talks, mainly at intermediate levels (Merigan & Maunsell, 1993; Braddick, O’Brien, Wattam-Bell, Atkinson, & Turner, 2000;Keizer, Colzato, & Hommel, 2008).
The last 25 years had seen a huge increase in the number of publication concerning the development of the higher functions of the human visual system. In this period, the characteristic aspects of the primary visual cortex (V1), as orientation and direction selectivity, had been deeply investigated (e.g. Slater, Morrison and Rose, 1988; Hood, Atkinson, Braddick, and Wattam-Bell, 1992; Nothdurft, 1993). Further attention had been dedicated to the developing interactions between cortical and subcortical systems. In the last years increasing attention had been focused on the development of
9
integrative functions linked to the extra-striate visual areas (e.g. Orban, 2008; Wattam-Bell et al., 2010; Skoczenski and Norcia, 2002; Allen et al.., 2009). Several studies had been conducted concerning hyperacuity, texture segmentation, grouping, optical illusions, global form and global motion sensitivity (for a review see Braddick and Atkinson, 2011).
Dorsal and Ventral functionality has often been assessed using psychophysical methods which simply test the functions which are supposed to be processed by them (Stein, 2003).
In former literature, different psychophysical methods and several tasks have been proposed to specifically activate dorsal or Ventral stream circuits. The application and validity of these tests and methods was assessed in healthy and clinical population.
Currently there is still a debate concerning the methods used to measure dorsal and ventral stream functionality. Motion and form perception are considered the golden standard measure for this purpose. The main criticism concerns the cross-talk between the two systems strong and their interactions with other cognitive functions such as general intelligence and visuo-spatial attention.
1.1.1 Ventral stream tasks
Several behavioral tasks have been proposed in former literature in order to specifically elicit ventral stream. The majority of the methods are based on form recognition.
One of the first task proposed was based on Glass Patterns stimuli. Glass stimulus, which was used for the first time in 1969 was composed by the overlap of two concentric circles. When a pattern of random dots is superimposed over an identical pattern and rotated a critical amount about the central axis, a compelling perception of concentric swirls arises. This kind of stimulus is still used in order to investigate the form perception (Ostwald, Lam, Li & Kourtzi, 2008); however, the perception of this stimulus involves high-level integrative processing of complex object (Grinter, Maybery, Pellicano, Badcock, & Badcock, 2010). For this reason, Glass Patterns couldn’t be considered as an efficacy measure of the ventral functionality for itself.
10
Figure 2 Atkinson and colleagues test
Figure 4 N-O-X test
The computerized test proposed by Atkinson et al. (2003, 2006) (Fig. 2), one of the most commonly used in literature, has some common elements with Glass Patterns (Wilson & Wilkinson, 1998; Braddick et al., 2000). The test is composed by a static array of randomly oriented short line segments with a target area on one side of the display where segments are oriented tangentially to concentric circles. The proportion of tangentially oriented (‘coherent’) line segments compared to the randomly
Texture-defined (with noise)
11
oriented noise segments in the target area defines the coherence value for a given trial. Participants are asked to indicate if the target stimulus is present on the right or on the left side of the display. The Stimulus remains on the screen until the subject responds. The presentation follows a staircase procedure in which, coherence decreases stepwise of 0.84 until an error is made; the coherence is increased by 1/0.84 whenever an error is made and decreased by a factor 0.84 following two successive correct responses. Staircase procedure is followed until 6 reversal is done and the threshold is taken as the mean coherence level of the last four reversal points. In order to maintain the motivation of the subject every 4 stimuli, a 100% coherence one is show. These stimuli are not considered for the thresholds computation. Subject performance estimates with Atkinson et al. (2006) test presents however some criticism. Even if the use of the Staircase procedure could be considered a valid technique to determine the perceptive thresholds, the use of a forced choice between two possibilities significantly enhances the possibility to give the correct answer. A chance level of 50% represents an important limitation, especially if used on clinical and child population, that requires a high accuracy to determine the perceptive thresholds.
A modified version of Landolt-C stimulus (Landolt, 1905) (Fig. 3) was proposed by Bertone, Hanck, Guy and Cornish (2010). Target stimulus is constituted by a “C” that could be presented in 4 different spatial orientation. Different C-optotypes are presented, and participants are asked to verbally identify the orientation of the gap opening (up, down, left or right) after each trial. Practice trials are completed to familiarize participants with fixation, stimuli presentation and responding. An adaptive staircase procedure, as descripted above, is used to determine the perceptive threshold. Form perception thresholds are determined for 3 conditions. The first one luminance-defined in which the optotypes’s form is defined by the difference in average luminance between the noise defining the optotype’s form and that of its surrounding background. The second one texture defined, in which the contrast of the noise defining the optotype’s form is varied, resulting in a form defined by the difference in
12
contrast of the noise defining its form and that of its background. The third one, or control condition, constructed without the use of noise.
Landolt-C procedure allows to determine form perception thresholds by manipulation of luminance contrast. However, contrast-response functions of the magnocellular and parvocellular neurons are not unique; so apparently magnocellular and parvocellular responses can’t be exactly identified on the basis of contrast, in particular for medium levels (2%-10%) (Skottun & Skoyles, 2011). Moreover, even if the chance level of 25% of this test is lower than in previous instruments, it could still be considered relevant when an accurate evaluation of sensitivity is need.
Another procedure, developed to assess apperceptive agnosia is called N-O-X test (Warrington & Taylor, 1973; Warrington & James, 1988) (Fig. 4). This instrument is composed by three conditions: one in which the letter “N” is presented, one in which the letter “O” is presented and a condition in which no form is presented (noise condition). Presented stimuli are made by superimposing a fragmented letter (either O or X) upon a fragmented background. The test stimuli are graded in difficulty by varying the ratio of black to white in the figure in relation to the ratio of black/white in the background. Subjects are asked to detect the presence of the letter and if is a N or O. The discrimination ability is determined by the number of correct answers (Warrington & Taylor, 1973). Even if N-O-X test efficiently determines the presence of apperceptive agnosia, it appears to be inefficient to evaluate subject’s thresholds, evidencing a prominent ceiling effect. Furthermore, this test doesn’t take into account the effect of the background noise on the degradation of the stimulus. In fact, it considers only the number of correct answers to estimate the subject ability. Also for this test the chance level results fairly high, with a 33% of correct answers by chance. Moreover, the very large dimension of stimulus dots could determine the elicitation of both visual streams. Ventral stream, in fact, is implied in perception of the details. The use of large stimulus could determine also an activation of dorsal visual processes (Bruce, Green, & Georgeson, 2003).
13 1.1.2 Dorsal stream tasks
In order to assess dorsal pathway different type of moving stimuli have been used.
Studies in literature showed that early stages of motion detection operate over small regions of space. This creates ambiguity about the true direction of motion of an object or display occupying a larger region, ambiguity that is exemplified in the well-known aperture problem. To determine the overall direction of motion, the outputs of local motion detectors must be integrated over space and time (Smith, Snowden & Milne, 1994). Several evidences indicated that cells in the primary visual cortex (V1) are responsible to detect the direction of motion in local regions of the visual field and that cells in the middle temporal area (MT), that have much larger receptive fields, integrate those signals over both space and time to give rise to the perception of global motion (O’Keefe & Movshon, 1998; Sekuler, 1992).
Motion perception has been modeled as hierarchically organized in different systems from the very early theory of motion perception (Boring, 1942). Lu ad Sperling (1995) proposed a model of motion perception as served by three systems: first, second and third order motion system (see for a review Lu and Sperling, 2001; see also Nishida, 2011; Burr & Thompson, 2011). While in first order motion the changes in boundaries are defined by luminance levels; in second order motion tests the motion is defined by other cues, like contrast or texture. Third order motion system is linked to 3-D motion perception or biological motion perception, and allows to compute the motion of marked locations in a ‘‘salience map,’’ in which the motion signal is differentiated from the background.
Several evidences suggest that the neural mechanisms that process first, second and third order motion are processed separately (see Nishida, 2011 for a review). Both first and second order motion could be either local or global. Local stimulus could be correctly analyzed by a single receptive field. Global motion instead needs the integration of multiple local motion signals to be correctly perceived (Armstrong, Mauerer, & Lewis, 2009). Sensitivity to local motion is commonly measured using contrast thresholds. This is defined as the minimum difference in luminance (for first-order stimuli)
14
or contrast (for second-order stimuli) between adjacent stripes required for the observer to accurately discriminate direction of motion (Armstrong, Mauerer, & Lewis, 2009) (Fig. 6).
A gold standard test used in visual research in order to assess first order motion system is global or coherent motion test. Global motion stimuli consist of coherently moving dots on black background displayed on a computer screen. A proportion of dots move in one specific direction while some others move in a brownian manner (De Vries, 1948). The lifetime of each single dot is manipulated in order to avoid tracking (i.e. the dots temporal frequency is very high). Accordingly, the subject usually has to detect the dots which are moving coherently and therefore to discriminate their direction.
Numerous studies found that global motion processing is better under binocular viewing (Hess, Hutchinson, Ledgeway, & Mansouri, 2007), invariant with retinal eccentricity (Hess & Aaen-Stockdale, 2008) and invariant with mean luminance (Hess & Zaharia, 2010) (for a review see Nischida, 2011).
15
Figure 6 Armstrong and Maurer test
Figure 7 Atkinson and colleagues test
Several versions of this task were created by different authors. In the most part of these tasks (Cornelissen, Hansen, Hutton, Evangelinou, & Stein, 1998; Fig. 5; Levy, Walsh, & Lavidor, 2010; Hansen, Stein, Orde, Winter, & Talcott, 2001) two stimuli are presented: one displaying dots with coherent motion and the other one displaying random motion dots. Subject is forced to choose between the two possibilities by indicating in which one the coherent motion is presented. A staircase procedure is adopted to determine the perceptive threshold. In order to avoid the possible strategy of subjects looking constantly at one of the hemifield, Levy et al. (2010) proposed a modified version of coherent motion task in which an additional condition with no coherent motion was added. Atkinson et al. (2006) (Fig. 7) proposed a version of coherent motion task in which the stimulus comprised two random dot kinematograms (white dots on a black background), one at each side of a central vertical strip. The pattern on one side is divided into three horizontal strips, such that the direction of the coherent motion of the middle ‘target’ strip is opposite to that of the two outer strips. The dot array on the opposite side of the screen display a uniform direction of motion consistent with
16
the direction of the two outer strips. Thresholds are obtained by a two-alternative forced choice procedure. Participants are required to locate the target regions, which are presented randomly either in the left or the right half of the display. As previously described M-cells mainly respond to higher temporal lower spatial frequency while P-cells primary respond to lower temporal higher spatial frequency. As Skottun and Skoyles (2008) argued, spatial and temporal frequencies should be very carefully selected. Authors suggested that the difference in temporal properties between magno- and parvocellular neurons are relatively small; it appears that in order to achieve magnocellular selectivity it’s necessary to use quite high temporal frequencies. Contrast sensitivity is indeed difficult to measure during childhood, in typically population, because it develops during early infancy but takes 7 years to reach adult levels.
Second order motion system is widely investigated by mean of texture moving stimuli. The use of contrast allows to modulate the temporal and spatial frequency of the moving stimuli. According to Lu and Sperling (2001), the signal to the second-order motion system is the modulation of texture contrast. An example of second order motion stimulus is a patch of a texture type which moves consistently from frame to frame, considering each patch as independent, uncorrelated sample. Starting from the first frame composed by side-by-side patches of right-slanting gratings disconnected from left-slanting gratings patches. The luminance and the overall contrast is maintained constant across patches. In a second frame, the patch pattern is moved sideways, and new patch samples are chosen (Fig. 8).
17
Figure 8 First order stimulus (left) and second order stimulus (right)
A specific kind of stimuli that have been widely used to test third order motion system is the biological motion (see Blake & Shiffrar, 2007 for a review). The majority of these studies employed point-light (PL) animations to isolate human kinematics, in order to study body movements in the absence of all other clues. With this technique, the activity of a human is displayed by the motion of a small number of markers positioned on the head and the joints of the body. Sensitivity to human motion increases with the number of illuminated joints and with the duration of the animation (Neri et al. 1998, Poom & Olsson 2002, Thornton et al. 1998). But even under impoverished or potentially ambiguous conditions, perception of human motion remain robust. The ability of recognizing human motion by point light animation has been evidenced early in life: infants already showed a preference for human motion sequences at 4 months of age (Bertenthal, 1993). Nevertheless, motion detection is fundamental for the analysis of biological motion, several studies showed that biological motion perception is influenced also by the form perception. Without the analysis of the structure of the human body, it would be almost impossible to segregate moving “body” dots from moving “noise” dots (Pinto & Shiffrar 1999).
18
Another task designed to evaluate the dorsal stream functionality is the speed discrimination. This instrument usually involves a two-interval forced choices. The subjects’ task is to report which of the two stimuli moved faster (Demb, Boynton, Best, & Heeger, 1998). However, some studies further suggest that speed and direction may be separately processed in the brain (Saffell & Matthews, 2003; Brouwer, Brenner, & Smeets, 2002).
Even if a number of studies (e.g. Cornelissen et al., 1998; Edwards et al., 2004; Milne et al., 2002; Pammer & Wheatley, 2001; Schulte-Korne, Bartling, Deimel, & Remschmidt, 2004; Stein, 2003; Talcott, Hansen, Assuko, & Stein, 2000) suggested that perception of coherent motion can be used to assess the sensitivity of the magnocellular system, some criticism has been reported. Skottun and Skoyles (2006), argued that coherent motion perception would be an indirect test, mediated via area MT, of magnocellular sensitivity. Furthermore, the authors underline that MT area receives its input mainly but not exclusively from the magnocellular system. Parvocellular system also contributes input to this cortical area (Maunsell, Nealey, & DePriest, 1990; Merigan & Maunsell, 1993; Sincich & Horton, 2002; Yabuta, Sawatari, & Callaway, 2001), suggesting a possible influence of Parvocellular neurons on MT. Furthermore, as found by Pilly & Seitz (2009), the different algorithms used to generate the stimulus influence the detection thresholds. So, it appears difficult to make direct comparisons across studies employing different RDK algorithms.
Estimating thresholds
Together with the development of the techniques to measure the perceptual phenomena, the problem of defining thresholds was carried on together with the development of psychophysics. This issue started from Fechner (1860) that developed the classical psychophysical methods for estimating the difference threshold. The threshold is considered to be the stimulus difference that can be discriminated in some fixed percentage of the presentations (e.g. 75%), so the goal of a threshold experiment is to find a level of the stimulus that leads to a preselected level of correct answer.
19
Anyway, an empirical threshold is a statistic, an estimate of a theoretical parameter, in any experiment is impossible to determine its real value. The threshold is a function of the data, a measure that depends on the results of a set of trials. Estimating thresholds should be evaluated in terms of costs and benefits. The costs are represented by the time spent by the experimenter and the subjects in order to achieve a good level of accuracy (Treutwein, 1995). Classical psychophysical conceptualization identifies different approaches in order to estimate thresholds:
- The method of constant stimuli: a number of suitably located points in the physical stimulus domain are chosen. These stimuli are repeatedly presented to the subject together with a comparison or standard stimulus. The cumulative responses (different or same) are used to estimate points on the psychometric function, i.e. the function describing the probability that the subject is judging the stimulus as exceeding the standard stimulus.
- The method of limits: the experimenter varies the value of the stimulus in small ascending or descending steps starting and reversing the sequence at the upper and lower limit of a predefined interval. At each step the subject reports whether the stimulus appears smaller than, equal to or larger than the standard.
- The method of adjustment is quite similar to the method of limits and is only applicable when the stimulus can be varied quasi-continuously. The subject adjusts the value of the stimulus and sets it to apparent equality with the standard. Repeated applications of this procedure yield an empirical distribution of the stimulus values with apparent equality which is used to calculate the point of subjective equivalence (PSE) (Treutwein, 1995; Purghè, 1997).
The main difference of the adaptive procedure as compared to the classical ones is that the stimulus values are not completely defined before the experiment but varies subsequently to the response (correct or not) of the subject. A typical adaptive procedure that is commonly used in vision perception studies is the staircase procedure (Ellemberg 2004; Armstrong & Maurer 2009; Hadad, Maurer & Lewis, 2011; Harvey, 1986). The goal of this procedure is to change the stimulus during
20
the course of the trials to converge on that stimulus giving the desired performance level. Running staircase procedure after each trial the stimulus value is changed by a fixed the step size. If a shift in the response category occurs (from success to failure or vice versa), the direction of steps is changed. This procedure is valid for every sequence of presentation. The final estimate is obtained by averaging the reversal point (Treutwein, 1995). Staircase methods doesn’t require any assumptions about psychometric function that better describes the phenomenon. Staircase require only to define the momentum when the stimulus level will change and what kind of step has to be used. A limitation of this method concern the unequal number of stimulus presentation and stimulus level for each subject. Moreover, there is no clear statistically determined basis for stopping or for calculating a threshold value from the results of trials. To respond to these limitations, a variation of this technique is called “the up-down transformed-response” (UDTR) method by Levitt (1970). Levitt suggested that the changes of the stimulus value depend on the outcome of two or more preceding trials. For example, the level is increased with each incorrect response and decreased only after two successive correct responses (1-up/2-down, or 2-step rule) (Treutwein, 1995).
1.2.1 The Signal Detection Theory
A different conceptualization of the decision-making process is the Signal Detection Theory (SDT). This approach had been originally developed in communications engineering to be employed in electronical receiving entity (e.g. a radar). Afterwards this framework had been used in psychology in opposition with classical psychophysical approach (Purghè, 1997). The main aspect of this framework is to shift the attention from the classical concept of sensory thresholds to the decision-making processes. The observer has to decide if the stimulus is present or not on a continuum. The SDT consider the contribution on the decision of two different contributions: the individual sensitivity, that is an implicit characteristic of the perceptive system and the response criterion, that is related to the observer, and is influenced by different aspects, as intrinsic motivation and rewards (Purghè, 1997). The TSD approach assumes the perception as a continuous variable. An observer
21
who is trying to distinguish two stimulus types, for example Signal and Noise, needs to evaluate the distributions of values for each possibility. Errors arise because the Signal and Noise distributions overlap, and the degree of overlap is an inverse measure of accuracy, or sensitivity. Improvements in sensitivity can only occur if this overlap is reduced, and such reductions are often not under the immediate control of the observer (Wixted, 2004). The sensitivity index d’ expresses the ratio of
overlap of the two distributions. In each YES-NO design experiment, the decision-making process could provide four different outcomes: a true positive, a false positive, a true negative and a false negative (Fig. 9). Different criteria and different sensitivities could origin different proportion of this responses. The Neyman Pearson Objective (Treisman & Watts, 1966) postulate that the observer bases his decision on the evaluation of the hit rate (the true positive) and the false alarm (false positive), operating an estimation of the two distributions. The payoff matrices could influence the importance that the subject give to the hit rate or the false alarm, maximizing one at the expense of the other.
Figure 9 Distributions of positive and negative responses in decision making process
The information resulting from an experiment using the SDT paradigm could be summarized using a graphical representation of the proportion of the hit and of the false alarm. This kind of representation,
22
originally developed during the II World War for the analysis of radar images is called Receiver Operating Characteristics (ROC) curves (Fig. 10). The ROC curves display on the Y axis the Sensitivity index, defined as the number of true positive decisions/the number of positive cases and on X axis 1-Specificity, that is defined as number of true negative decisions/the number of negative cases. The best possible decision would create a line yielding in the upper left corner, representing 100% sensitivity and specificity. A random classification would give a line along the diagonal line (Purghè, 1997, Bottarelli and Parodi, 2003).
Figure 10 A Receiver Operating Characteristics (ROC) curve
1.2.2 Psychometric Functions
A psychometric function relates some physical measure of stimulus to some performance measure of detection or discrimination, such as hit rate, percent correct, or d' (Torgerson, 1958) (Fig 11). When performance is expressed as probability, psychometric functions typically are S-shaped in form. Since
23
it is not a priori obvious which analytical function will fit any given set of data best, one needs to do these estimates by using different analytical functions. A general way to describe a psychometric function is
P
C(𝜉) = 𝛾 + (1 − 𝛾 − 𝜆)Φ(𝜉),
where PC = P is the proportion of correct response (usually showed ad ordinate), 𝜉 is a measure of the stimulus level, 𝛾 is the guessing rate or chance level, equal to 1/n for a n-alternative forced choice task, and 𝜆 is the lapsing rate, which describes non-perfect performance and that is usually set to 0 for simplicity. Threshold level, usually indicated by α, determines the function’s horizontal position.
This level is definite in several different ways. One of them is the x coordinate of the point “halfway up” that could be calculated as
P
C= 𝛾 + (1 − 𝛾 − 𝜆) / 2
.In literature, it is frequent to use also another criterion level for the definition of the threshold. The threshold is defined as the point of maximum inflection (i.e. the maximum slope, when the curvature changes its acceleration) or, more commonly, the stimulus level that can be discriminated at a fixed level of accuracy, e.g. 75% (Strasburger, 2001; Treutwein, 1995).
24
Figure 11 - Psychometric function
Fitting psychometric functions could be considered a three-steps process. As a first step, the model selection has theoretical and mathematical basis, and the parameters are adjusted to minimize the appropriate error metric or loss function. As a second step, the error estimates of the parameters are derived; finally, the evaluation of the goodness of fit, attesting the accuracy of the adopted model to represent the data (Wichmann & Hill, 2001).
There are a large number of probabilistic functions that can be used to characterize the subjects’ performance. The use of specific functions has to be theoretically justified. Furthermore, the function has to be selected for its simplicity. The simplicity of the function is related to the number of the parameters (that should be as small as possible). The more parameters are to be estimated, the more trials are necessary for an accurate estimation (Treutwein, 1995). Since is not always possible to determine a priori which analytical function will be the best for fitting experimental data, it is necessary to compare the solutions obtained by different functions.
25
Parameter estimation consists of finding the parameter values of a probability function that best represents the distribution of the empirical data. This process is usually conducted by an iterative approach. This approach allows to estimate the parameter values that best fit a frequency distribution with progressive approximations (i.e. iteration), proceeding step by step until the estimated value converge to the final solution. To do this, the fit of the probability function to the data is evaluated using a goodness of fit (or error) criterion. Typically, the procedure involves changes in parameter values that are made smaller at each iteration until the adjustment yields only small changes in the fit criterion. The search stops either when the improvement in fit is smaller than a pre‐determined criterion or when the change in parameter values is smaller than another pre‐determined value. The stopping criteria are called tolerances. The procedure reaches convergence criterion when the improvement in the goodness of fit is smaller than the termination tolerance or when the change in parameter values is smaller than the function tolerance (Lacouture, 2008). The parameter search may fail to converge. This occurs when, after performing many iterations, the change in the fit criterion at a given iteration does not become smaller than the value of the termination tolerance or when the change in parameter values does not become smaller than the function tolerance. In this case, a good alternative strategies could be to start the search process with appropriate parameter values (i.e. close to the real parameter values), or to increase the maximum number of iterations allowed for the search process, or, finally, to increase tolerances of the parameter estimation (Lacouture 2008). This process could be conducted by using the nonlinear least-squares formulation. This technique shares some similarities to linear least squares (used in linear regression analysis), but also significant differences. Nonlinear models are more difficult to fit than linear models because the coefficients cannot be estimated using simple matrix techniques. Instead, an iterative approach is required. In the iterative approach the fitting starts with an initial estimate for each coefficient, then it produces the fitted curve for the current set of coefficients and, using a fitting algorithm, it adjusts the coefficients and determines whether the fit improves. This process will iterate, by producing a new curve, until the fit reaches the specified convergence criteria.
26
A different technique, that is widely used, is the maximum likelihood estimation. The basic idea of the method of maximum likelihood is given by the following consideration. Different populations generate different data samples and any given data sample is more likely to come from one population than from others. The method of maximum likelihood is based on the principle that we should estimate the parameter vector, which describes the psychometric function, by its most plausible values, given the observed sample vector (Treuwein, 1995). The likelihood function represents the likelihood of the parameters given the observed data; finding the probability density function, among all the probability densities that the model prescribes, that is most likely to have produced the data. The principle of maximum likelihood estimation (MLE), originally developed by Fisher in the 1920s, seeks the probability distribution that makes the observed data most likely (Myung, 2003).
Aims
The research focuses on the study of the methods useful to evaluate the developmental trajectories for motion perception and form perception. The presented studies aim to analyze the psychometric characteristics of two tasks created for measuring the functionalities of the dorsal and the ventral streams: the coherent motion test for measuring motion perception, an ability processed mainly by the dorsal stream, and the coherent form test to measure form perception abilities, an ability processed mainly by the ventral stream.
The first study aims to present the Motion coherence test and Form coherence test as new tools to investigate motion and form perception accuracy. The use of these tests will allow to handle with some of the methodological criticisms reported in other studies (i.e. the use of contrast based task to assess dorsal functionality and the high chance level). The tests have been assessed in a large sample of children of different ages.
27
The second study aims to evaluate the applicability of a specific psychophysical function which allows to analyze the accuracy profiles obtained both by motion and form coherence test. The response profiles of each of the two tasks will be fitted with an appropriate psychophysical function, that estimates the subject’s accuracy performance (i.e. the mean number of correct responses) on the basis of the coherence level of the stimulus. Moreover, the use of the proposed function allows to statistically define the perceptive thresholds of the two tests and to compare them.
The third study aims to analyze the developmental trajectories of dorsal and ventral streams in a sample of typically developing children and adults recruited in two European countries (Italy and Sweden). Secondly, in this study the normative scores for motion coherence and form coherence tests are given on the basis of different group of ages.
The aim of the fifth study is to evaluate if motion and form test could be useful to recognize specific deficits in clinical population. The differences between motion and form perception accuracy is evaluated in children with different genetic syndromes (Noonan syndrome and 22q11.2 deletion syndrome) and compared to controls.
28
Experiment 1 – Methods for the assessment of motion and form perception
abilities in school-aged children
A large body of studies concerning the role of vision functions in human cognitive development is present in current literature (see Braddick & Atkinson, 2011). Several neuroanatomical and neuropsychological studies point out that the visual information runs segregated in two major pathways: dorsal and ventral streams (Merigan & Maunsell, 1993; Braddick & Atkinson, 2011). These visual streams present specific anatomical and functional characteristics. Goodale and Milner (1992) proposed the perception-action model of primate vision, that provides a functional interpretation for the two cortical visual streams: ventral stream processes visual information for perceptual purposes (called what stream), and the dorsal stream provides visual guidance for movement (where stream).
The analysis of the functionalities of the two visual systems, was conducted on different populations (both clinical and not), by means of paper and pencil or computer based visual stimuli. Nevertheless, some authors argued that the methods and the tasks used in order to elicit dorsal and ventral streams present several methodological criticisms (see Skottun & Skoyles, 2008 for review).
The processing of motion is a critical part of visual perception. It is necessary, in everyday life, to track moving objects with eyes, to reach and grasp them and to navigate in a dynamic world. In order to accomplish to this finality, it is often important the ability to combine the motion information of an object within the surrounding space. This ability is called global motion processing and it is commonly tested using motion coherence paradigm (Manning, 2014). The Random dot kinematograms (RDKs) represents in fact a gold standard, used by different authors, useful to elicit dorsal stream functionality (e.g. Cornelissen, Hansen, Hutton, Evangelinou, & Stein, 1998; Levy, Walsh, & Lavidor, 2010; Hansen, Stein, Orde, Winter, & Talcott, 2001). This kind of test consists of
29
signal luminance dots moving coherently in one direction and luminance noise dots that move in random directions. The subject is usually asked to identify the coherent motion or its overall direction.
Concerning the Ventral stream, the analysis of the literature shows, in particular for children and adolescents populations, a limited number of instruments suitable for the assessment of form perception. Furthermore, the comparison between the results of studies with different population and with different instruments it is not always possible. Some of the tests that are present in literature require the recognition of a form that consist of a single element, while in others the form is constituted by several components. This kind of perception is based on the ability of the visual system to integrate the information of the elements that compose the stimulus. The parts of stimuli that together constitute a pattern or shape are sometimes called "coherent". Coherency can be characterized by different characteristics, such as the direction of the movement, the orientation, the contrast in brightness or color. The characteristics of the stimulus determine the coherency, allowing the visual information integration process and the subsequent recognition of the shape. A kind of coherency that has been widely applied in the form perception studies is the spatial coherence. Several studies showed that human visual system can perceive a series of spatially aligned stimuli (spatial coherence) as bi or three-dimensional object with a recognizable form (Atkinson , Braddick, Nokes, Anker and Braddick, 1997; Atkinson, Braddick, Rose, Searcy, Wattam-Bell and Bellugi, 2006).
One of the most commonly instrument used in literature based on spatial coherency is the one developed by Atkinson and colleagues (2000, 2006). The stimulus was composed by a static array of randomly oriented short line segments, containing a ‘target’ area on one side of the display where segments were oriented tangentially to concentric circles. The proportion of tangentially oriented (i.e. coherent) line segments amongst the randomly oriented ‘noise’ segments in the target area defined the coherence value for a given trial. Thresholds were obtained by a two-alternative forced choice procedure. Participants were required to locate the target regions, which were presented randomly either in the left or the right half of the display. In each task, the initial coherence level was set to
30
100%. The percentage of coherence was decreased stepwise on each trial by a factor of 0.84 until an error was made; following this the coherence was increased by 1/0.84 whenever an error was made and decreased by a factor 0.84 following two successive correct responses. The staircase procedure was followed until six reversals had occurred, and the threshold was taken as the mean coherence level of the last four reversal points.
The stimuli developed for the evaluation of the form and motion perception ability, present some methodological limitations (Grinter et al., 2010). In particular, the calculation of the threshold for visual perception of the motion and shapes requires the administration of numerous trials. The subject is asked to identify the target stimulus through the comparison with another stimulus (2 alternative forced choice). This procedure requires for the completion a protracted commitment of the subject. The performance could be consequently affected by the oscillations of the attentional threshold and by the effects of fatigue. These two limitations could be particularly salient in children and adolescents. Furthermore, in some form tests (e.g. Atkinson et al., 2000) the request to locate the target regions in which the target stimulus was presented could be considered an explicit “where” task; while the recognition of the stimulus represented in this test an implicit “what” task.
Aim
The aim of this study is to evaluate the psychometric properties of the Motion and Form Coherence test in a population of typically developing children. These tests were specifically developed to measure the ability to discriminate the motion direction and the forms from the background noise. In order to cope with some of the criticism emerged from the tests already present in the literature; the Form coherence test use the technique of signal consistency (i.e. the percentage of correctly aligned dots).
Furthermore, in order to avoid the problems derived from the use of the brightness contrast (Skottun, 2000) and to verify in a suitable way the performance of the parvo-ventral system, the instrument
31
presented explicitly requires the subject to make a ventral task. The subject was requested to indicate what form did he/she see. This procedure would characterize the task presented as explicit evidence of visual discrimination of form, differing from other tests in the literature that require recognition in a more implicit way (to the subjects are asked to indicate between two stimuli "which is the form"). The presented tests also attempted to cope with the high chance level that characterize some of the previous test. The 8-alternative forced choice place the chance level at 12.5%. Finally, the presence of different levels of difficulty, allows a good accuracy in the evaluation of motion and form discrimination and deals with the ceiling effect that characterizes some of the instruments used in the literature.
Methods
2.2.1 Participants
The sample was composed by 250 children aged 5 to 12 years old. One-hundred-twenty-seven of them was males (mean= 7.8; SD= 2.0) and 123 females (mean= 8.1; SD= 2.2). For each subject a proper informed consent was obtained for both parents. A sample of 75 children (36 Female; age range: 5.2 – 12.4; mean age = 6.7 years) was selected in order to evaluate criterion validity. Furthermore, a subsample of sample of 51 subjects (20 female; age range 8-11 years; mean age 9.3) repeated the tests in order to evaluate the reliability. The participants had been selected from general population by recruiting them during school typical assessment. No one had sensory deficit or neurological disorder.
All of the children presented a normal level of general intelligence (QI above 85), measured using the Raven’s Colored Progressive Matrices (Raven, 1992). All of the subject presented a normal or corrected to normal visual acuity evaluated by LEA vision test (Repka, 2002) by orthoptists.
32 2.2.2 Measures and procedures
The tests are administered individually to the participants in one sessions of about 15-20 minutes. The presentation order is randomized. A psychologist is present for the whole experiment. A subsample of 51 children repeated the two tests after half an hour.
Raven’s Colored Progressive Matrices (CPM):
The Raven’s CPM (Raven, 1992) is a common measure of basic cognitive functioning, quantifying a child’s ability to form comparisons and to reason by analogy (Raven, Raven, & Court, 1962). The test comprises 36 items divided into three sets of 12 (A, Ab and B) in which items are ordered by increasing difficulty. Each item is presented as a colored pattern with a missing portion and 6 options from which to choose to fill in the missing element. Some items test the ability to complete a continuing pattern. Others require perception of the parts of the whole pattern as one gestalt on the basis of spatial relations. Finally, some of them require analogical reasoning.
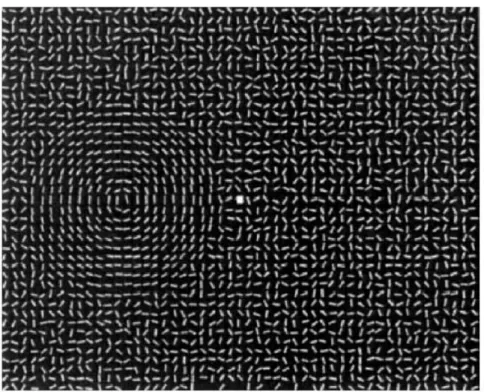
Motion coherence test:
Motion perception is evaluated with the Motion Coherence Test (Benassi, Rydberg, Belli, & Bolzani, 2003; Menghini et al., 2010) (Fig. 12), a computerized behavioral test designed to assess dorsal pathway functionality. On a black background (0.2 cd/m2), 150 high luminance dots (luminance 51.0 cd/m2) could move coherently at a constant speed (6.1°/s) in one of the eight directions of the space (4 cardinal and 4 oblique). Dots are displayed on a computer screen at a distance of 130cm from the participants and subtended a visual angle of 5°. To avoid the possibility of tracking, each dot has a limited lifetime of 4 animation frames (duration = 200 ms). The task consisted of 5 levels of difficulty (0 to 4), each one compose by 8 trials. Coherent motion percentage is defined as the number of dots in coherent motion on the total of dots. The non-coherent dots moved randomly between frames in a Brownian manner. Practice trials are completed to familiarize participants with fixation, stimuli
33
presentation and responding. Starting from a condition of 100% coherence (all the dots moved coherently in one direction), at each step the noise (Brownian motion dots) increases of 2db (each level has a decrement of 37% of coherent dots as compared to former). Therefore, the difficulty increases in each level. Participants are asked to indicate the direction of the perceived motion by choosing between the 8 possible directions. The chance level is thus 12.5%, a lower level as compared with other instruments presented in literature. The subject’s motion perception ability is calculated as the mean of the correct answer for each level. In addition, for each subject it will be possible to evaluate the percentage or the mean of the correct answer for each direction.
34
This kind of test is supposed to elicit the magnocellular system - dorsal pathway because it’s based on high temporal frequency stimuli and the subject is asked to make a where task. The motion perception is allowed by the coherent motion stimuli that move as a group, for that reason the stimuli is considered global motion task. The motion is based on luminance level, thus it could be considered as a first order motion stimuli. This aspect could cope with the criticism reported by Skottun and Skoyles (2011) regarding the use of contrast sensitivity tasks in order to elicit magnocellular functionality.
Form Coherence Test:
Form perception is evaluated with the Form Coherence Test (Fig. 13). This computerized behavioral test is a new computer based tool designed to assess ventral pathway functionality. On a black background (0.2 cd/m2), 1962 static high luminance dots (luminance 51.0 cd/m2) are displayed at a distance of 130cm from the participants and subtended a visual angle of 5°. A part of the dots produce, with a coherent spatial continuity, one of the 8 possible forms: circle, square, triangle, star, house, doll, glass. The other dots, representing the background noise, are disposed randomly. Practice trials are completed to familiarize participants with fixation, stimuli presentation and responding. The task consisted of 5 levels of difficulty (0 to 4) each one composed by 8 trials. The coherence is defined as the number of spatially aligned dots on the total of dots presented in the frame. The noise is represented by dots that are randomly disposed in the frame. Starting from a condition of 100% coherence, at each step the noise increases of 3db (each level has a decrement of 50% of coherent dots compared to former). Therefore, the difficulty increases in each level. Participants are asked to indicate the correct form, choosing between the 8 possible forms. The chance level is thus 12.5%, a lower level as compared with other instruments presented in literature. The subject’s form perception ability is calculated as the mean of the correct answer for each level. In addition, for each subject it will be possible to evaluate the percentage or the mean of the correct answer for each form. This kind of test is supposed to elicit the parvocellular system - ventral pathway because it’s based on high
35
spatial frequency stimuli and the subject is asked to make a what task. The use of luminance defined stimuli could cope with the criticism reported by Skottun and Skoyles (2011) regarding the use of contrast sensitivity tasks in order to elicit parvocellular functionality.
Figure 13 Form coherence test
Test of Visual-motor Integration (VMI)
The Beery VMI test (Beery, Buktenica & Beery, 1997) measures the extent to which individuals can integrate their visual and motor abilities in a paper and pencil task. It is a standardized measure
36
commonly used to identify children who are having deficits with visual-motor integration and for clinical purposes.
Three subtests composed the test. In the VMI test, the subject is asked to copy geometric drawings onto a form using a pencil. Different levels of difficulty are presented and the drawings are showed in order of increasing difficulty. In the Visual Perception test the subject is asked to recognize a form within a set of similar shapes. In the Motor Coordination subtests, the subject’s motor ability in drawing lines according to a specific map is evaluated. The accuracy in each subtest is computed by means of the sum of completed and corrected drawing items. Raw scores are transformed into Z scores according to normative data.
2.2.3 Data Analysis:
Two Generalized Linear Models (GzLMs) were conducted separately on the experimental data for Motion and Form coherence test. The Motion and Form accuracy scores (the number of correct answers divided by the total number of stimuli presented at each level of difficulty) were considered as the dependent variables. Binomial distribution (correct answer / wrong answer) with Logit as link function was used.
The probabilities of correct answer to each stimulus on the basis of the coherence levels were assessed using age (in years) as covariates.
As a second analysis, the accuracy scores were analyzed considering the different forms and the different directions. For this purpose, two GzLMs analysis were conducted. In the first the eight different forms were considered as within subject factor, in the second model the eight directions were considered the within subject factors. As in the previous models the age was used as covariate. Accordingly, binomial distribution (correct answer / wrong answer) with Logit as link function were used in the model.
37
The internal consistency was assessed by means of the Cronbach’s alphas and non-parametric correlation analysis between coherence levels and total the motion and form coherence tests.
The convergent validity of the motion and form coherence test were evaluated on the basis of Spearman Rho correlation Coefficient considering the relationships between the accuracy in form coherence test in the 100% coherence level, the accuracy score in motion coherence test in the 100% coherence level, and the score in VMI test. The VMI test is a standardized test which allows to measure the visual perception and motor abilities. The VMI test doesn’t uses background noise in order to evaluate the visual motor abilities, so the correlations were calculated with the 0% noise level of coherence. Finally, the reliability of Motion and Form coherence test was assessed by means of non-parametric correlation analysis (using Spearman’s Rho coefficient) between the two administration of the tests.
Data were analyzed by using the Statistical Package for the Social Science (IBM-SPSS) version 20.
Results
2.3.1 General description of Motion Coherence test
A preliminary GzLM analysis showed, a significant gender effect (Wald5 = 6,568; p =.01). In
particular, male subjects showed a higher number of correct answer in comparison to females, as showed by odds ratio: 0,137 for males and 0,122 for females.
The analysis conducted by GzLM shows that the probability of responding correctly to the test changes significantly depending on the difficulty levels (Wald5 = 86,432; p <.01).
The estimated odds ratio (OR) and the 95% confidence intervals (CI) (see table 1), showed that the coherence levels from 0 to 3 were significantly easier than the coherence level 4.
38
In particular, all of the difficulty levels had an Odds Ratio greater than 1, and this implies that the probability of correct response was higher in the levels 0, 1, 2 and 3 in comparison to the level 4. Furthermore, it could be noted that, the value of the odds ratio for the different levels, gradually decreases as the difficulty increases. So, the increment of the noise leads to a decrease in the probability of responding correctly to the stimulus (table 1).
Tab. 1. GzLM estimated parameters in the different levels of difficulty (Lev. 4 is set as reference).
Parameter B P OR Lower C.I. Upper C.I.
Intercept -3.338 <0.01 .035 .030 .042
Level 0 1.269 <0.01 3.557 3.224 3.925
Level 1 1.106 <0.01 3.022 2.737 3.337
Level 2 .891 <0.01 2.438 2.213 2.686
Level 3 .444 <0.01 1.558 1.421 1.708
The performance of the subjects expressed as mean of correct answers in different levels (and C.I.) is presented in figure 14. The graph shows the gradual decrement in the mean of correct answers as the difficulty increases. In particular, in the level 0 (100% of coherence), the mean of correct recognitions was around .84(M = .844; SE = .015), the score decrease gradually with the increase of difficulty up about .27 in the level four (M = .270, SE = .013).
39
Figure 14 Percentages of correct answers in different levels of the Motion coherence test
The age, effect also resulted significant (Wald1 = 32.894; p <.01), showing a positive effect on the
number of correct response (OR = 1.10). Furthermore, the age by level interaction effect resulted significant (Wald4 = 24.50; p < .001). The estimated OR showed that age significantly increased the
probability of correct answer only in level 0 (p <.001; OR = 1.36).
From the analysis conducted by GzLM resulted that the different directions did not significantly change the probability to respond correctly to the task (Wald7 = 12.65; p=.10).
The age effect was still significant (Wald1 = 30.27; p < .001), while directions by age interaction
40
2.3.2 General description of Form Coherence test
A preliminary analysis confirmed, that the gender effect was not significant neither for the main effect nor for interaction effect. Therefore, was not included in subsequent analyzes.
The analysis conducted by GzLM shows that the probability of responding correctly to the test changes significantly depending on the difficulty levels (Wald5 = 81,417; p <.01).
The estimated odds ratio (OR) and the 95% confidence intervals (CI) (see table 2), showed that the coherence levels from 0 to 3 were significantly easier than the coherence level 4.
In particular, all of the difficulty levels had an Odds Ratio greater than 1, and this implies that the probability of correct response was higher in the levels 0, 1, 2 and 3 in comparison to the level 4. Furthermore, it could be noted that, the value of the odds ratio for the different levels, gradually decreases as the difficulty increases. So, the increase of the noise leads to a decrease in the probability of responding correctly to the stimulus (table 2).
Tab. 2. GzLM estimated parameters in the different levels of difficulty (Lev. 4 is set as reference).
Parameter B p OR Lower C.I. Upper C.I.
Intercept -.683 <0.01 .505 .317 .804
Level 0 3.333 <0.01 28.009 7.597 103.261
Level 1 2.105 <0.01 8.211 4.864 13.861
Level 2 1.027 <0.01 2.794 1.804 4.327
Level 3 .527 0.02 1.694 1.069 2.684
The performance of the subjects expressed as percentages of correct answers in different levels (and S.E.) is presented in figure 15. The graph shows the gradual decrease in the average percentage of
41
correct answers as the difficulty increases. In particular, in level 0 (100% of coherence), the percentages of correct recognitions was around 100% (M = .982; SE = .004), the score decrease gradually with the increase of difficulty up about 40% in the level four (M = .45, SE = .015).
Figure 15 Percentages of correct answers in different levels of the Motion coherence test
The age effect was not significant (Wald1 = 2.496; p = .114). The age by level interaction effect
resulted however significant (Wald4 = 17,456; p = .002). The estimated OR showed that age
significantly increases the probability of correct answer only in level 0 and in level 4 (level 0: p <.05; OR = 1.189, Level 4: p <. 01; OR = 1.061).
From the analysis conducted by GzLM resulted that the type of shape significantly changed the probability to respond correctly to the task (Wald7 = 144.256; p <.01).
42
The B parameters showed that, with the exception of the star, the other forms had a significantly different probability of correct response as compared to the triangle (see Table 3). The "triangle" form, resulted the hardest form to recognize, so was considered as reference category. The "cup" and "square" forms presented the highest OR values; indicating that these two forms increase the probability of recognition in higher way than the other.
The age effect was still not significant (Wald1 = .016; p = .90), while form by age interaction effect
resulted significant. The age effect was different for the different forms. It could be noted that for "star", "triangle" and "house" forms, the estimated number of correct answers increased with age. Conversely, in the "cup" and "square" forms, subject with the lowest age showed the greater number of correct estimated answers.
Tab. 3. GzLM estimated parameters in the different forms (triangle is set as reference).
Parameter B p O.R. Lower C.I. Upper C.I.
Intercept -.898 <0.01 .407 .256 .649 Cup 3.690 <0.01 40.044 20.471 78.331 Square 2.787 <0.01 16.234 8.063 32.686 Doll 1.938 <0.01 6.945 3.573 13.500 Butterfly 1.762 <0.01 5.824 3.144 10.791 Circle .998 <0.01 2.713 1.531 4.806 House .644 .04 1.903 1.031 3.513 Star .229 .49 1.258 .658 2.403 2.3.3 Internal consistency
The Cronbach’s alphas of the five coherence level showed a good internal consistency both for Motion test (Alpha=0.83) and for Form test (Alpha=0.78). Furthermore, the non-parametric
43
correlations between each coherence level and the total showed a significant positive correlation for each level of the two tests (Table 4). Only the level 0 of the Form test didn’t correlate with total score. This result depends of the saturation of this coherence level in Form test.
Tab. 4. Spearman’s rho correlation coefficients between coherence levels and total of the Motion and Form coherence tests.
2.3.4 Convergent and divergent validity and reliability
The convergent validity between form and motion coherence scores with the VMI subscales was tested in a selected sample of 75 children. The 100% coherence level was considered for the analysis because in the VMI there is not the presence of the noise in the different stimuli used to calculate the accuracy score. The Spearman correlation analysis showed that the form coherence test at 100% coherence level (zero noise) showed a positive correlation with the score of VMI Visual perception subtest (Rho=.27; p=.03). None of the score at the motion coherence test was correlated with the different VMI subtests.
The divergent validity was investigated by means of Spearman correlation analysis among the motion and form coherence test scores. No significant correlation was found between the motion and form scores.
The reliability of motion and form coherence test was assessed by means of correlation analysis (using Spearman’s Rho coefficient). The motion coherence test and form coherence test were administered
Level 0 Level 1 Level 2 Level 3 Level 4
Motion test .67** .78** .84** .82** .61**
Form test .08 .74** .86** .79** .77**