Facoltà di Farmacia e Scienze della Nutrizione e della Salute
Dipartimento Farmaco-Biologico
(MED/04 PATOLOGIA GENERALE)
——————————————————————
Dottorato di Ricerca in “Biochimica Cellulare ed
Attività dei Farmaci in Oncologia” (XX ciclo)
PPAR
γ ligand rosiglitazone inhibits cell
growth proliferation and induces
apoptosis in breast cancer cells
Docente Tutor Dottoranda
D.ssa Daniela Bonofiglio D.ssa Sabrina Gabriele
Coordinatore
Ch.mo Prof. Sebastiano Ando’
__________________________________________________
Anno Accademico 2006-2007
Introduction………..
1Materials and Methods………...………..8
¾
Reagents………8
¾
Cell cultures………...8
¾
[3H]Thymidine incorporation……….8
¾
Plasmids………...9
¾
Transfection assay………..10
¾
p85-associated phosphatidylinositol 3-kinase activity………...11
¾
Immunoblotting………...12
¾
Reverse Transcription-Polymerase Chain Reaction (RT-PCR) assay………...13
¾
Electrophoretic Mobility Shift Assay (EMSA)……..………..14
¾
Chromatin Immunoprecipitation (ChIP) and Re-ChIP assays……….…16
¾
RNA interference (RNAi)…..………..18
¾
DNA Fragmentation………..….19
¾
Statistical analysis………..…19
Results………...20
¾
The growth inhibitory effects induced by BRL is directly PPARγ mediatedin MCF7 cells
………23
¾ BRL induces G0-G1 cycle arrest in MCF7 cells…
………24
¾ BRL up-regulates p53 and p21WAF1/Cip1 expression in MCF7 cells
….26
¾ BRL transactivates p53 Gene Promoter………..27
¾
PPARγ binds to NFκB sequence in EMSA………..29
¾
Functional interaction of PPARγ with p53 in ChIP Assay………...31
¾
BRL induces Caspase-9 cleavage and DNA fragmentation in MCF7 cells……….32
¾
MCF7 breast cancer cells express both Fas and FasL………33
¾ BRL up-regulates FasL expression in MCF7 cells
………34
¾
PPARγ transactivates FasL promoter in MCF7 cells……….36
¾
PPARγ interacts with FasL through Sp1 site in EMSA………..………...39
¾
Functional interaction of PPARγ with FasL by ChIP Assay………..42
Discussion……….48
References……….…55
Scientific Publication
¾ PPARγ interacts directly with Sp1 on the Sp1 response element of the p21Cip1/WAF1 promoter inhibiting follicular and anaplastic thyroid carcinoma cells growth. Daniela Bonofiglio, Hongyan Qi, Sabrina
Gabriele, Maria Belmonte, Stefania Catalano, Saveria Aquila and Sebastiano Andò.Endocrine-Related Cancer (in revision).
¾ Peroxisome Proliferator-Activated Receptor (PPAR) gamma activates p53 gene promoter binding to the NFkB sequence in human MCF7 breast cancer cells. Daniela Bonofiglio, Saveria Aquila, Stefania Catalano,
Sabrina Gabriele, Maria Belmonte, Emilia Middea, Hongyan Qi, Catia Morelli, Mariaelena Gentile, Marcello Maggiolini, and Sebastiano Ando`Molecular Endocrinology, 2006, Vol. 20, n. 12, pp. 1228-1238.
¾ Peroxisome proliferator-activated receptor (PPAR)gamma is expressed by human spermatozoa: its potential role on the sperm physiology. Saveria
Aquila, Daniela Bonofiglio, Mariaelena Gentile, Emilia Middea, Sabrina Gabriele, Maria Belmonte, Stefania Catalano, Michele Pellegrino and Sebastiano Ando` J Cell Physiol. 2006 Dec;209(3):977-86.
Sabrina Gabriele, Saveria Aquila, Stefania Catalano, Mariaelena Gentile, Emilia Middea, Francesca Giordano and Sebastiano Ando' Clin Cancer
Res 2005 September;11(17).
¾ Peroxisome Proliferator-Activated Receptor (PPAR) gamma activates FAS ligand gene promoter through Sp1 site in human MCF7 breast cancer cells.
Sabrina Gabriele, Daniela Bonofiglio, Saveria Aquila, Maria Belmonte, Hongyan Qi, Stefania Catalano, Emilia Middea, and Sebastiano Ando'
Contributo a XXVIII Congresso Nazionale SIP 2006, Pavia, 19-22 settembre 2006.
¾ The peroxisome proliferator-activated receptor gamma ligand rosiglitazone up-regulates p21 gene expression in human thyroid carcinoma cells.
Daniela Bonofiglio, Stefania Catalano, Sabrina Gabriele, Maria Belmonte, Hongyan Qi, Marcello Maggiolini, and Sebastiano Ando'.Atti del
convegno "CARCINOMI TIROIDEI dal laboratorio al letto del malato e ritorno, Assisi -ITALY, 2-4 febbraio, 2006, pp.
¾ Functional crosstalk between Peroxisome Proliferator-Activated Receptor gamma and p53 tumor suppressor gene in MCF-7 breast cancer cells.
Daniela Bonofiglio, Saveria Aquila, Stefania Catalano, Sabrina Gabriele, Mariaelena Gentile, Catia Morelli, Maria Belmonte, Marcello Maggiolini, Emilia Middea, , and Sebastiano Ando'. Contributo a EMBO Conference
breast cancer cells. Daniela Bonofiglio, Saveria Aquila, Sabrina Gabriele,
Mariaelena Gentile, Maria Belmonte, Catia Morelli, Hongyan Qi, Serafina Fusaro Contributo a 3rd International Symposium on PPARS Efficacy
INTRODUCTION
Peroxisome proliferator-activated receptors (PPARs) belong to the superfamily of nuclear hormone receptors activated by lipophilic agonists. The general mechanisms of gene transcription modulation by PPARs are quite similar and well understood. After PPAR binds to its specific ligand, it heterodimerizes with retinoid X receptor (RXR) and binds to specific bi-hexametric DNA sequences called PPRE elements. This binding, activation and heterodimerization processes recruit various co-activators and co-repressors that modulate expression of many human genes (Mangelsdorf and Evans, 1995; Mukherjee et al., 1997) (Fig. 1).
Fig. 1 General mechanisms of gene transcription modulation by PPARs
Three distinct isoforms, termed PPARα, PPARβ (also known PPARδ) and PPARγ are expressed in multiple species in a tissue specific manner (Berger and Moller 2002; Kliewer et al., 1994; Mukherjee et al., 1994; Braissant et al., 1996; Lemberger et al., 1996). PPARα was mapped on chromosome 22 slightly
telomerc to a linkage group of six genes and genetic markers that are located in the general region 22q12-q13.1 (Sher et al., 1993), is expressed in hepatocytes, cardiomyocytes, and proximal tubule cells of the kidney. PPARβ has been assigned to chromosome 6, at position 6p21.1-p21.2 (Yoshikawa et al., 1996), is ubiquitously expressed in most tissues, while PPARγ located on chromosome 3 at position 3p25, close to RARβ and TRβ, which are at position 3p24 and 3p21, respectively (Greene et al., 1995), is expressed in adipose tissues and enterocytes (Kersten et al., 2000). The distinct tissue distribution suggests that the PPAR subtypes play different biological roles. In particular, PPARγ appears to play a pivotal role in adipogenesis, as well as cell growth and differentiation of colon cancer cells (Kliewer and Willson, 1998).
There are four PPARγ isoforms derived from the alternative promoters, PPARγ1,γ2,γ3 and γ4 (Fig. 2). PPARγ2 isoform is longer than PPARγ1 by additional 30 N-terminal amino acids (Mueller et al ., 2002). PPARγ2 mostly expresses in adipocytes while PPARγ1 is ubiquitous. Both isoforms have the intrinsic ability to stimulate adipogenesis by induction of the similar changes in the pre-adipocyte expression profile.
Fig. 2 PPARγ isoforms. The genomic organization of the PPARγ gene.
Such as all the nuclear receptors, PPARγ gene is characterized from a common organization of the translated region in six coding exons with the following distribution: one exon for the N-terminal A/B domain, two exons for the DNA-binding domain (DBD) one for each of the two zinc-fingers, one exon for the hinge region, and two exons for the ligand-binding domain (LBD) (Fig. 3).
Fig. 3 A schematic illustration of the domain structure of PPARs.
It has been reported that PPARγ is involved in several metabolic pathways, in adipocyte differentiation, and even in the growth inhibition of different cancer cell lines (Tontonoz et al., 1994; Tontonoz et al., 1997; Kubota et al., 1998; Sarraf et al., 1998; Lowell 1999; Takahashi et al., 1999; Chang and Szabo 2000; Motomura
et al., 2000; Sato et al. 2000). In addition, PPARγ promoted terminal differentiation of malignant breast epithelial cells in vitro and induced morphologic changes associated with apoptosis and fibrosis in breast tumor cells injected in mice (Elstner et al., 1998; Mueller et al., 1998). A large body of evidence has shown that estrogen receptor (ER) α is involved in the development of breast cancer (Aronica et al., 1994; Migliaccio et al., 1996; Eisen and Weber 1998; Nicholson et al., 1999). On ligand binding, ERα undergoes a conformational change allowing chromatin interaction and the transcriptional regulation of target genes (Jensen 1995). It has also been reported that ERα binds to the p85 regulatory subunit of phosphatidylinositol 3-kinase (PI3K), leading to the activation of the protein kinase B/AKT pathway, which in turn regulates diverse processes like cell survival and proliferation (Datta et al., 1999; Simoncini et al., 2000). On the contrary, in recent years, treatments with PPARγ ligands have been demonstrated have antioncogenic effects to inducing cell cycle arrest and apoptosis in different cancer models (Brockman et al., 1998; Elstner et al., 1998; Mueller et al., 1998).
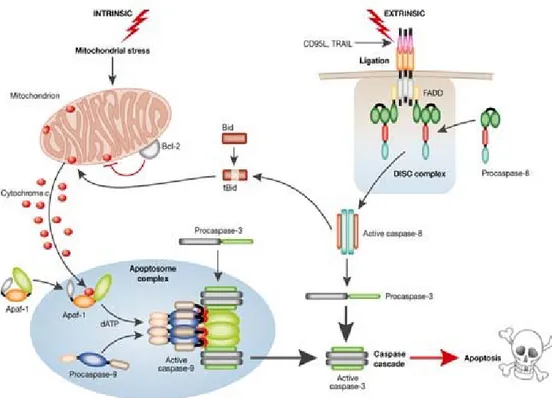
The apoptotic process can be initiated by two major routes: the intrinsic and extrinsic death pathways (Green, 1998) (Fig. 4). The instrinsic pathway is triggered in response to a variety of apoptotic stimuli that produce damage within the cell, including anticancer agents, oxidative damage, UV irradiation, and is mediated through the mitochondria. The extrinsic pathway is activated by extracellular ligands able to induce oligomerization of death receptors, such as Fas
(also called CD95 or APO1) or other members of the tumor necrosis factor receptor superfamily leading to apoptosis (Nagata, 1997).
Fig. 4 Intrinsic and extrinsic death pathways
It is well known that the p53 tumor suppressor gene regulates the transcription of effectors that are also responsible for growth arrest and intrinsic apoptosis (reviewed in Ref. Vousden and Lu 2002). Among the p53 target genes, the p21WAF1/Cip1 has been recognized to exert an essential role in mediating cell cycle arrest at both G1 and G2-M checkpoints (Harper et al., 1993; Liu and Lozano 2005). p21WAF1/Cip1 inhibits cyclin D1 or E/cyclin-dependent kinase in
G1 and cyclin B/cdc2 in G2-M arrest, eliciting regulatory effects on DNA replication and repair (Tom et al., 2001).
Moreover, it has been reported that p53 is able to promote apoptosis in certain cell types in a transcription in dependent manner (Caelles et al., 1994). The function of p53 as a tumor suppressor is finely tuned through an interaction with other transduction pathways regulating the cell network (Appella 2001; Woods and Vousden 2002; Haupt 2003; O’Brate and Giannakakou 2003; Yu and Zhang 2005). For instance, striking evidence has recently emerged for a cross talk between p53 and relevant transcription factors, such as the glucocorticoid, androgen, and estrogen receptors (Sengupta and Wasylyk 2004). It was therefore proved that these nuclear receptors are able to induce a cytosolic accumulation of p53, altering its stability and, consequently, its function (Sengupta and Wasylyk 2004).
Fas ligand (FasL), a type II transmembrane protein expressed on the surface of cells, induces extrinsic apoptotic cell death by binding to its receptor Fas (Chinnaiyan and Dixit, 1997; Debatin, 2004).
This binding results in recruitment of the Fas-associated death domain (FADD) protein and caspase 8 zymogens to the receptor and the formation of the death-inducing signalling complex, after which the caspases cascade can be activated (Pinkoski and Green, 1999). Defects in the Fas/FasL apoptotic signalling pathway provide a survival advantage to cancer cells and may be implicated in tumorigenesis (Wajant, 2006). Recent evidence has indicated the Fas pathway activation in the induction of tumor cell death and FasL expression has been
________________________________________________________
7 observed in different tumors including breast cancer (O'Connell et al., 1996; Muschen et al., 1999; Reimer et al., 2000). It has also been suggested that FasL functions as an autocrine/paracrine mediator of apoptosis induced by DNA-damaging anticancer chemotherapeutic agents (Kasibhatla et al., 1998; Mo and Beck, 1999).In the past few years, we have investigated different molecular mechanisms through which PPARγ induces antiproliferative effects, and apoptosis in human MCF7 breast cancer cells. In this study, we reported for the first time that ERα and PPARγ induce opposite effects on the regulation on the PI3K/AKT pathway eliciting consequently divergent growth responses on treatment with the respective cognate ligands 17β-estradiol and rosiglitazone (BRL) in hormone-dependent MCF7 breast cancer cells.
Additionally, we have demonstrated the potential of PPARγ in inducing apoptotic events through a direct involvement of the p53 and Fas/FasL pathway in breast cancer cells.
Altogether, our data, we provide new insight into the molecular mechanisms by which the specific PPARγ ligand rosiglitazone BRL induces the antiproliferative effects, cell cycle arrest and apoptosis in MCF7 human breast cancer cells.
MATERIALS AND METHODS
Reagents
Rosiglitazone (BRL49653, BRL) and parthenolide (P) was from Alexis (San Diego, CA USA). The irreversible PPARγ-antagonist GW9662 (GW), 17b-estradiol, and Sp1 specific inhibitor, mithramycin (M) was purchased from Sigma (Milan, Italy). Human recombinant TGFβ was obtained from ICN Biomedicals (DBA, Milan, Italy). ICI182780 (ICI) was generously provided by Zeneca Pharmaceuticals (Cheshire, United Kingdom).
All compounds were solubilized in DMSO or in ethanol (Sigma).
Cell cultures
Wild-type human breast cancer MCF7 cells (a gift from Ewa Surmacz, Sbarro Institute for Cancer Research and Molecular Medicine, Philadelphia, PA) and MDA-MB231 (MDA) breast cancer cells were grown in DMEM plus glutamax containing 10 % fetal calf serum (FCS) (Invitrogen, Milan, Italy) and 1 mg/ml penicillin-streptomycin (P/S). HeLa cells were maintained with DMEM supplemented with 10% FCS, 1% L-glutamine, and 1 mg/mL penicillin-streptomycin. BT20 breast cancer cells were grown in MEM added as DMEM.
[3H]Thymidine incorporation
MCF7 and HeLa cells were seeded in six-well plates in regular growth medium. On the second day, cells were incubated in DMEM supplemented with 1% charcoal stripped FCS (CS-FCS) for the indicated times in the presence of increasing BRL concentrations or GW, 17b-estradiol, and ICI. The medium was renewed every 2 days together with the appropriate treatments. [3H]Thymidine
(1 mCi/mL; New England Nuclear, Newton, MA) was added to the medium for the last 6 hours. After rinsing with PBS, the cells were washed once with 10% and thrice with 5% trichloroacetic acid. Cells were lysed by adding 0.1 N NaOH and then incubated 30 minutes at 37°C. Thymidine incorporation was determined by scintillation counting.
Plasmids
The PPARγ expression vector of was provided by Dr. R. Evans (The Salk Institute, San Diego, CA). The expression vector of ERα were previously described (Tora et al.,1989). The constitutively active myristilated AKT mutant (myr-AKT) was kindly provided by Dr. T. Simoncini (University of Pisa, Italy). The p53 promoter-luciferase reporters, constructed using pGL2 for cloning of p53-1 and -6, and TpGL2 for p53-13 and-14 were kindly provided by Dr. Stephen H. Safe (Texas A&M University, College Station, TX). The constructs used were generated by Safe (Qin et al., 2002) from the human p53 gene promoter as follows: p53-1 (containing the -1800 to +12 region), p53-6 (containing the -106 to +12 region), p53-13 (containing the -106 to -40 region) and p53-14 (containing the -106 to -49 region).
The p53 antisense plasmid (AS/p53) were gifts from Dr. Moshe Oren (Weizmann Institute of Science, Rehovot, Israel).
The firefly luciferase reporter plasmids containing FasL promoter wild-type (FasL Luc-0) or its deletion mutants (FasL Luc-3 and FasL Luc-4) were kind gifts from Dr. Carlos V. Paya (Mayo Clinic, Rochester, Minnesota, USA). Deletion of Sp1 sequence in FasL gene promoter was generated by PCR using as template FasL
Luc-3 (p-318 construct). The resulting plasmid encoding the human FasL gene promoter containing the desired deletion was designed FasL Luc-3 (Sp1 and the sequence was confirmed by nucleotide sequence analysis (Catalano et al., 2007). As an internal transfection control, we cotransfected the plasmid pRL-CMV (Promega Corp., Milan, Italy) that expresses Renilla luciferase enzymatically distinguishable from firefly luciferase by the strong cytomegalovirus enhancer/promoter.
Transfection assay
MCF7 cells were transferred into 24-well plates with 500 µL of regular growth medium/well the day before transfection. The medium was replaced with lacking phenol red and serum on the day of transfection, which was done using Fugene 6 reagent as recommended by the manufacturer (Roche Diagnostics, Mannheim, Germany) with a mixture containing 0.5 µg of promoter-luciferase reporter plasmid, and 5 ng of pRL-CMV. After transfection for 24 hours, treatments were added in serum-free medium (SFM) as indicated and cells were incubated for an additional 24 hours, cells were pre-treated for 2 hours with M or GW where applicable. Firefly and Renilla luciferase activities were measured using the Dual Luciferase Kit (Promega, Madison, WI). The firefly luciferase values of each sample were normalized by Renilla luciferase activity and data were reported as relative light units. To determine PI3K activity, MCF7 cells were plated in 10 cm dishes and then transfected with 5 µg PPARγ and 5 µg ERα expression plasmids using Fugene 6 reagent. To evaluate the role of PI3K/AKT pathway in MCF7 cell
growth, 0.5 µg constitutively active myr-AKT was transfected using Fugene 6 reagent in six-well plates every 2 days where applicable.
To abrogate p53 espression MCF7 cells plated into 10-cm dishes were transfected with 5 µg of AS/p53 using Fugene 6 reagent as recommended by the manufacturer (Roche Diagnostics).
p85-associated phosphatidylinositol 3-kinase activity
Cells were grown in 10 cm dishes to 70% to 80% confluence and exposed to treatments for 30 minutes and 24 hours in 1% CS-FCS and then cells were lysates with 500 μL of lysis buffer [50 mmol/L HEPES (pH 7.5), 150 mmol/L NaCl, 1.5 mmol/L MgCl2, 1 mmol/L EGTA, 10% glycerol, 1% Triton X-100, a mixture of protease inhibitors (aprotinin, phenylmethylsulfonyl fluoride, and Na-orthovanadate)]. Cell lysates were centrifuged at 12,000 x g for 5 minutes and 500 μg of total protein were incubated overnight with the anti-p85 antibody (Santa Cruz Biotechnology) and 500μL of HNTG (immunoprecipitation) buffer [50 mmol/L HEPES (pH 7.4), 50 mmol/L NaCl, 0.1% Triton X-100, 10% glycerol, 1 mmol/L phenylmethylsulfonyl fluoride, 10μg/mL leupeptin, 10 μg/mL aprotinin, 2 μg/mL pepstatin]. Immunocomplexes were recovered by incubation with protein A/G-agarose. The negative control was done using a cell lysate where the p85 regulatory subunit of PI3K was previously removed by pre-incubation with the respective antibody (1 hour at room temperature) and subsequently immunoprecipitated with protein A/G-agarose. As a positive control, MCF7 cells were treated with 100 nmol/L insulin for 30 minutes before lysis and IRS-1 was precipitated from 500 μg of cell lysates. The immunoprecipitates were washed
once with cold PBS, twice with 0.5 mol/L LiCl, 0.1 mol/L Tris (pH 7.4), and finally with 10 mmol/L Tris, 100 mmol/L NaCl, 1 mmol/L EDTA. The presence of PI3K activity in immunoprecipitates was determined by incubating the beads with reaction buffer containing 10 mmol/L HEPES (pH 7.4), 10 mmol/L MgCl2, 50 μmol/L ATP, 20 μCi [γ-32P]ATP, and 10 μg of phosphatidylinositol for 20 minutes at 37°C. The reactions were stopped by adding 100 μL of 1 mol/L HCl. Phospholipids were extracted with 200 μL of CHCl3/methanol. Phase separation was facilitated by centrifugation at 5,000 rpm for 2 minutes in a tabletop centrifuge. The upper phase was removed, and the lower chloroform phase was washed once more with clear upper phase. The washed chloroform phase was dried under a stream of nitrogen gas and redissolved in 30 μL of chloroform. The labeled products of the kinase reaction, the phosphatidylinositol phosphates, were then spotted onto trans-1,2-diaminocyclohexane-N,N,NV,NV-tetraacetic acid– treated silica gel 60 TLC plates. Radioactive spots were visualized by autoradiography.
Immunoblotting
Cells were grown in 10-cm dishes to 70–80% confluence and exposed to treatments in SFM as indicated. Cells were then harvested in cold PBS and resuspended in lysis buffer containing 20 mM HEPES (pH 8), 0.1 mM EDTA, 5 mM MgCl2, 0.5 M NaCl, 20% glycerol, 1% Nonidet P-40, and inhibitors (0.1 mM Na3VO4, 1% PMSF, 20 mg/ml aprotinin). Protein concentration was determined by Bio-Rad Protein Assay (Bio-Rad Laboratories, Hercules, CA). A 50μg portion of protein lysates was used for Western blotting, resolved on a 10%
SDS-polyacrylamide gel, transferred to a nitrocellulose membrane, and probed with an antibody directed against the phospho- AKT (Ser 473), Total AKT, p53, p21WAF1/Cip1, caspases-9, NFκB, FasL, Fas and PPARγ (Santa Cruz Biotechnology, CA USA), caspase 8 (Biomol International, Butler PikePlymouth, PA USA). As internal control, all membranes were subsequently stripped (0.2 M glycine, pH 2.6, for 30 min at room temperature) of the first antibody and reprobed with anti-β actin antibody. The antigen-antibody complex was detected by incubation of the membranes for 1 h at room temperature with peroxidase- coupled goat antimouse or antirabbit IgG and revealed using the enhanced chemiluminescence system (Amersham Pharmacia Buckinghamshire, UK). Blots were then exposed to film (Kodak film, Sigma). The intensity of bands representing relevant proteins was measured by Scion Image laser densitometry scanning program.
Reverse Transcription-Polymerase Chain Reaction (RT-PCR) assay
MCF7 cells were grown in 10-cm dishes to 70–80% confluence, and exposed to treatments in SFM as indicated. Total cellular RNA was extracted using TRIZOL reagent (Invitrogen) as suggested by the manufacturer. The purity and integrity were checked spectroscopically and by gel electrophoresis before carrying out the analytical procedures. The evaluation of gene expression was performed by a semiquantitative RT-PCR method as previously described (Maggiolini et al., 1999). For p53, p21WAF1/Cip1, FasL and the internal control gene 36B4, the primers were: 5’-GTGGAAGGAAATTTGCGTGT-3’ (p53 forward) and 5-CCAGTGTGATGATGGTGAGG-3 (p53 reverse),
GCTTCATGCCAGCTACTTCC-3’ (p21 forward) and 5’-CTGTGCTCACTTCAGGGTCA-3’ (p21 reverse), 5’-GGA ATG GGA AGA CAC CTA TGG A-3’ (FasL forward) and AGAGAGAGCTCAGATACGTTGAC-3’ (FasL reverse), CTCAACATCTCCCCCTTCTC-3’ (36B4 forward) and 5’-CAAATCCCATATCCTCGTCC-3’ (36B4 reverse) to yield, respectively, products of 190 bp with 18 cycles, 270 bp with 18 cycles, 299 bp with 25 cycles and 408 bp with 12 cycles. The results obtained as optical density arbitrary values were transformed to percentage of the control (percent control) taking the samples from untreated cells as 100%.
Electrophoretic Mobility Shift Assay (EMSA)
Nuclear extracts from MCF7 cells were prepared as previously described (Andrews and Faller 1991). Briefly, MCF7 cells plated into 10 cm dishes were grown to 70-80 % confluence shifted to SFM for 24 hours and then treated with 1µM BRL for 6 hours. Thereafter, cells were scraped into 1.5 ml of cold PBS. Cells were pelleted for 10 seconds and resuspended in 400 μl cold buffer A (10 mM HEPES-KOH pH 7.9 at 4 °C, 1.5mM MgCl2, 10 mM KCl, 0.5 mM dithiothreitol, 0.2 mM PMSF, 1 mM leupeptin) by flicking the tube. The cells were allowed to swell on ice for 10 minutes and then vortexed for 10 seconds. Samples were centrifuged for 10 seconds and the supernatant fraction discarded. The pellet was resuspended in 50 μl of cold Buffer B (20 mM HEPES-KOH pH 7.9, 25 % glycerol, 1.5 mM MgCl2, 420 mM NaCl, 0.2 mM EDTA, 0.5 mM dithiothreitol, 0.2 mM PMSF, 1 mM leupeptin) and incubated in ice for 20
minutes for high-salt extraction. Cellular debris were removed by centrifugation for 2 minutes at 4 °C and the supernatant fraction (containing DNA binding proteins) was stored at –70 °C. The probe was generated by annealing single stranded oligonucleotides and labeled with [γ32P] ATP (Amersham Pharmacia) and T4 polynucleotide kinase (Promega) and then purified using Sephadex G50 spin columns (Amersham Pharmacia).
The DNA sequence of the NFκB used as probe or as cold competitor is the following: NFκB, 5’-AGTTGAGGGGACTTTCCCAGGC-3’ and the sequence, obtained from the native FasL promoter gene containing the Sp1, NFAT and NFκB sites, used as probe or as cold competitor is the following: 5’-AAATTGTGGGCGGAAACTTCCAGGG-3’ (Sigma Genosys, Cambridge, UK). As cold competitor we also used PPRE oligonucleotide: 5’-GGGACCAGGACAAAGGTCACGTT-3’.
In another set of experiments we used a DNA sequence of the FASL as probe or as cold competitor: FASL 5’-AAATTGTGGGCGGAAACTTCCAGGG-3’and as cold competitor we also used ΔSp1 oligonucleotide: AAATTGTGTTCGGAAACTTCCAGGG-3’, ΔNFAT oligonucleotide: AAATTGTGGGCGGTCACTTCCAGGG-3’ and ΔNFκB oligonucleotide: 5’-AAATTGTGGGCGGAAACATATAGGG-3’ (Sigma Genosys).The protein binding reactions were carried out in 20 μl of buffer [20 mM Hepes pH 8, 1 mM EDTA, 50 mM KCl, 10 mM DTT, 10% glicerol, 1mg/ml BSA, 50 μg/ml poly dI/dC] with 50,000 cpm of labeled probe, 5 μg of MCF7 nuclear protein and 5 μg
of poly (dI-dC). The mixtures were incubated at room temperature for 20 minutes in the presence or absence of unlabeled competitors oligonucleotides.
For the experiments involving anti-PPARγ, anti-NFκB and anti-Sp1 antibodies (Santa Cruz Biotechnology, Inc., Santa Cruz, CA), and the treatment of 100 nM M in vitro, the reaction mixture was incubated with these antibodies and this treatment at 4 °C for 30 min before addition of labelled probe. The entire reaction mixture was electrophoresed through a 6% polyacrylamide gel in 0.25X Tris borate-EDTA for 3 h at 150 V. Gel was dried and subjected to autoradiography at –70 °C.at 150 V.
Chromatin Immunoprecipitation (ChIP) and Re-ChIP assays
For ChIP assay, MCF7 cells were grown in 10 cm dishes to 50-60 % confluence, shifted to SFM for 24 hours and then treated with 10μM BRL, 10 ng/ml TGFβ alone or in combination for 1 hour or pre-incubated with 15μM P. In another sets of experiments, cells were treated with 1μM BRL and 100nM M for 1 hours or pre-incubated with M where required. Thereafter, cells were washed twice with PBS and cross-linked with 1 % formaldehyde at 37 °C for 10 minutes. Next, cells were washed twice with PBS at 4 °C, collected and resuspended in 200 μl of lysis buffer (1% SDS, 10 mM EDTA, 50 mM Tris-HCl pH 8.1) and left on ice for 10 minutes. Then, cells were sonicated four times for 10 seconds at 30 % of maximal power (Sonics, Vibra Cell 500 W Sonics and Materials, Inc., Newtown, CT)) and collected by centrifugation at 4 °C for 10 minutes at 14,000 rpm. The supernatants were diluted in 1.3 ml of IP buffer (0.01 % SDS, 1.1 % Triton X-100, 1.2 mM EDTA, 16.7 mM Tris-HCl pH 8.1, 16.7 mM NaCl) followed by immunoclearing
with 80μl of sonicated salmon sperm DNA/protein A agarose (UBI, DBA Srl, Milan - Italy) for 1 hour at 4 °C.
The precleared chromatin was immunoprecipitated with anti- PPARγ, anti NFκB, anti-RNA Pol II antibodies (Santa Cruz Biotechnology), the immunoprecipitated with PPARγ Ab was re-immunoprecipitated with RNA Pol II and anti-Sp1 antibodis. At this point, 60 µl salmon sperm DNA/protein A agarose were added and precipitation was further continued for 2 hours at 4 °C. After pelleting, precipitates were washed sequentially for 5 minutes with the following buffers: Wash A (0.1 % SDS, 1 % Triton X-100, 2 mM EDTA, 20 mM Tris-HCl pH 8.1, 150 mM NaCl), Wash B (0.1 % SDS, 1 % Triton X-100, 2 mM EDTA, 20 mM Tris-HCl pH 8.1, 500 mM NaCl), and Wash C (0.25 M LiCl, 1 % NP-40, 1 % sodium deoxycholate, 1 mM EDTA, 10 mM Tris-HCl pH 8.1), and then twice with TE buffer (10 mM Tris, 1 mM EDTA). The immunocomplexes were eluted with elution buffer (1 % SDS, 0.1 M NaHCO3). The eluates were reverse cross-linked by heating at 65 °C and digested with proteinase K (0.5 mg/ml) at 45 °C for 1 hour. DNA was obtained by phenol/chloroform/isoamyl alcohol extraction. 2 µl of 10 mg/ml yeast tRNA (Sigma) were added to each sample and DNA was precipitated with 70 % ethanol for 24 hours at –20 °C, and then washed with 95 % ethanol and resuspended in 20 µl of TE buffer.
A 5µl volume of each sample was used for PCR with primers flanking a sequence present in the p53 promoter: 5’-CTGAGAGCAAACGCAAAAG-3’ (forward) and 5’-CAGCCCGAACGCAAAGTGTC-3’ (reverse) containing the κB site from -254 to -242 region. In another set of experiments we used for PCR the following
sequence of FasL promoter: 5’-TACCCCCATGCTGACCTGCTC-3’ (forward) and 5’-ACGGGACCCTGTTGCTGACTG-3’ (reverse) corresponding to the -396 to -76 region (Gene Bank, accession number: AF027385). The PCR conditions for the two p53 promoter 45 sec at 94 °C,were while for the FasL promoter fragments were, respectively, 40 sec at 57 C, 90 sec at 72 C; 45 sec at 94 C, 40 sec at 55 C, 90 sec at 72 C; The amplification products obtained with 30 cycles were analyzed in a 2% agarose gel and visualized by ethidium bromide staining. The negative control was provided by PCR amplification without a DNA sample. The specificity of reactions was ensured using normal mouse and rabbit IgG (Santa Cruz Biotechnology).
RNA interference (RNAi)
Cells were plated in 6 well dishes with regular growth medium the day before transfection to 60-70 % confluence. On the second day the medium was changed with SFM without P/S and cells were transfected with 25 bp RNA duplex of stealth RNAi targeted human FasL mRNA sequence 5’-GCCCAUUUAACAGGCAAGUCCAACU-3’ (Invitrogen), with 25 bp RNA duplex of validate RNAi targeted human PPARγ mRNA sequence 5’-GCCUGCAUCUCCACCUUAUUAUUCU -3’ or with a stealth RNAi control (Invitrogen) to a final concentration of 100 nM using Lipofectamine 2000 (Invitrogen) as recommended by the manufacturer. After 5 hours the transfection medium was changed with SFM in order to avoid Lipofectamine 2000 toxicity and cells were exposed to 1 μΜ BRL for the next 48 hours and then lysed as
________________________________________________________
19 described for WB analysis or treated for 72 hours and then collected as described for the DNA fragmentation.DNA Fragmentation
DNA fragmentation was determined by gel electrophoresis. Cells were grown in 10cm dishes to 70 % confluence, PPARγ or control RNAi and then treated with 1 μM BRL and/or 10 μM GW. After 72 h cells were collected and washed with PBS and pelletted at 1800 rpm for 5 min. The samples were resuspended in 0.5 ml of extraction buffer (50 mM, Tris-HCl, pH 8; 10 mM EDTA, 0.5% SDS) fo The DNA pellet was resuspended in 15 µl of H2O treated with RNAse A for 30 min at
37°C. The absorbance of the DNA solution at 260 and 280 nm was determined by spectrophotometry. The extracted DNA (40 μg/lane) was subjected to electrophoresis on 1.5% agly significant.
Statistical analysis
Statistical analysis was performed using ANOVA followed by Newman-Keuls testing to determine differences in means. p<0.05 was considered as statistically significant.
RESULTS
Growth inhibitory effects of BRL in MCF7 breast cancer cells
We first aimed to evaluate the effects of BRL different concentrations on proliferation of MCF7 and HeLa cells. As reported in Fig.1 BRL treatments elicited a time and dose dependent growth inhibition in MCF7 cells and, to a higher extent, HeLa cells.
Fig. 1. Antiproliferative effects exerted by BRL49653 (BRL) in MCF7 and HeLa cells.
MCF7 and HeLa cells were cultured in the presence of increasing concentration of BRL. Six hours before lysis [3H] thymidine incorporation was added and cells were counted. Points, mean of three
independent experiments; bars, SD.
BRL down-regulates the phosphatidylinositol 3-kinase/AKT pathway in MCF7 cells
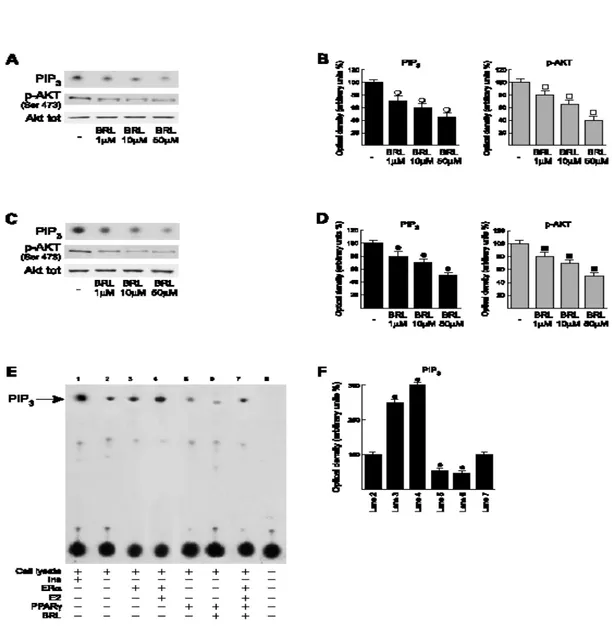
To assess the molecular mechanisms involved in the inhibitory effects mediated by PPARγ, we evaluated the short (30 minutes) and late (24 hours) effects of BRL on PI3K activity and AKT phosphorylation. Interestingly, BRL showed a dose dependent negative interference with this pathway at both times (Fig. 2A-D). In agreement with a previous report (Simoncini et al., 2000), an opposite regulation was induced by 17β-estradiol (data not shown). Besides, the overexpression of ERα in MCF7 cells enhanced the PI3K activity, which was further potentiated in the presence of 17β-estradiol (Fig. 2E, lanes 3 and 4). On the contrary, the overexpression of PPARγ in MCF7 cells reduced the PI3K activity, which resulted to further repression with BRL (Fig. 2E, lanes 5 and 6). Of note, the latter inhibitory effects were no longer noticeable with a combination of ERα overexpression and 17β-estradiol treatment (Fig. 2E, lane 7).
Fig. 2. BRL negatively interferes with PI3K/AKT pathway in MCF7 cells
MCF7 cells were treated for 30 minutes A and 24 hours C with increasing concentrations of BRL p85-associated PI3K activity was measured inMCF7 lysates immunoprecipitated with the anti-p85 antibody and incubated in the presence of 200μmol/L phosphatidylinositol and10μCi of [γ32P]ATP for 20 minutes as described inMaterials andMethods. Protein lysates were immunoblotted for phospho-AKT (Ser473) and total AKT. Autoradiographs are representative of six independent experiments, which are cumulatively represented in B and D, respectively (columns, mean; bars, SD). E,MCF7 cells were transfected with an empty vector (lane 2), with 5μg of an Era expression vector (lane 3) andinthe presence of100 nmol/L17β-estradiol (lane 4), with 5μg of PPARγ expression vector (lane 5) and in the presence of 10μmol/L BRL (lane 6), with 5μg of both ERα and PPARγ plasmids in the presence of 100nmol/L17β-estradiol and 10μmol/L BRL (lane 7). Cell lysates were immunoprecipitated using the anti-p85 antibody, incubated in the presence of 200μmol/L phosphatidylinositol and10μCi of [γ32P]ATP for 20 minutes. As a positive control, we used MCF-7 cells treated with 100nmol/L insulin for 30 minutes before lysis and immunoprecipitated with anti IRS-1from 500μg of cell lysates (lane1). As a negative control, we used MCF7 cell lysates inwhich p85 was previously removed by preincubation with specific antibody (1hour at room temperature) and subsequent immunoprecipitationwith protein A/G-agarose (lane 8). F, quantitative representations of data of three independent experiments including that of E. ○, ●, □, ■: P < 0.05, treated versus untreated cells. PIP3, phosphatidylinositol 3,4,5-triphosphate.
The growth inhibitory effects induced by BRL is directly PPARγ mediated in MCF7 cells
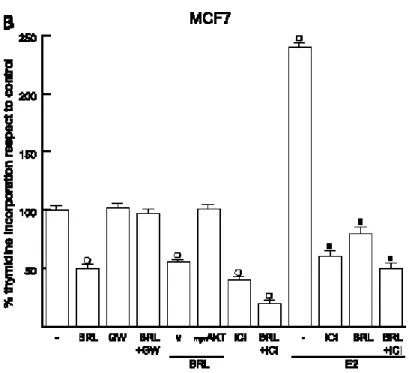
The PPARγ antagonist GW reversed the growth inhibitory effects induced by BRL, indicating that the repressive action was directly PPARγ mediated (Fig. 3). Considering the ability of PPARγ to down-regulate the PI3K/AKT pathway, we did a growth assay using as a model system MCF7 cells transfected with a constitutively active myr-AKT. Notably, under these conditions, the growth inhibition observed on BRL was no longer noticeable Fig. 3, suggesting the involvement of the PI3K/ AKT pathway in the biological effects triggered by PPARγ activation. Next, the antiproliferative activity exerted by ICI in MCF7 cells was potentiated in the presence of BRL irrespective of 17β-estradiol treatment (Fig. 3).
Fig. 3 The growth inhibitory effects induced by BRL, was directly PPARγ mediated MCF7 cells MCF7 cells were treated with10 μmol/L BRL,10 μmol/LGW9662,1μmol/L ICI182780, and100 nmol/L17h-estradiol as indicated, or transfectedwith an empty vector (v) or with 0.5 μg of myr-AKT where applicable (see Materials and Methods for other details). On day 6, 6 hours before lysis, [3H]thymidine was added and cells were counted. Columns, mean of three independent
experiments done in triplicate; bars, SD. o, P < 0.05, treated versus untreated cells; o, P < 0.05, BRL-treated cells transfected with an empty vector versus cells transfected with a constitutive activemyr-AKT; n, P < 0.05, cells treated with17h-estradiol + ICI182780, 17h-estradiol + BRL, or17h-estradiol + BRL+ ICI182780 versus cells treated with17h-estradiol alone.
BRL induces G0-G1 cycle arrest in MCF7 cells
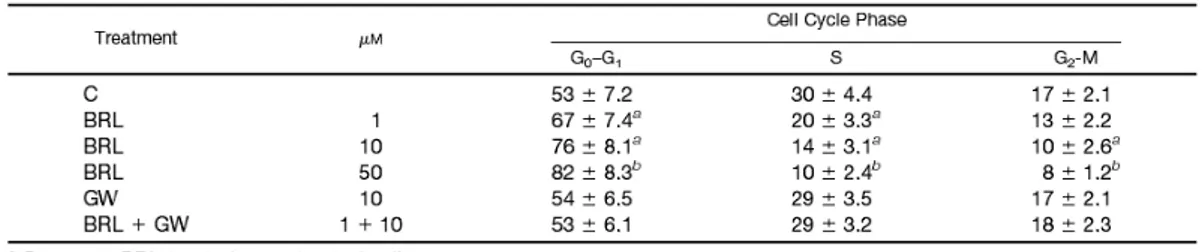
On the basis of our and other (Patel et al., 2001; Clay et al., 1999) studies demonstrating the inhibitory effects of the PPARγ agonists on proliferation of breast cancer cells, we also investigated the activity of BRL on MCF7 cell cycle progression. A 48-h exposure to BRL caused the inhibition of G0-G1/S phase progression in a dosedependent manner with concomitant decrease in the proportion of cells entering in S phase (Table 1). Of note, this effect was mediated
by PPARγ because it was no longer notable in the presence of the specific antagonist GW.
Table 1 BRL induces G0/G1 arrest of cell cycle progression in MCF7 cells.
MCF7 cells were treated as indicated. DNA was stained with 100μg/ml propidium iodide for 30 minutes at 4 °C protected from light and then the cells were analyzed with the FACS can (Becton, Dickinson, NJ). Each data point represents the percentage of three independent experiments performed in triplicate. The data are presented as mean ± S.D. *p<0.05 and **p<0.01 BRL-treated vs untreated cells.
BRL up-regulates p53 and p21WAF1/Cip1 expression in MCF7 cells
Considering that the tumor suppressor gene p53 is mainly involved in the growth arrest promoted by different factors, we aimed to examine the potential ability of PPARγ to modulate the expression of p53 along with its natural target gene p21WAF1/CIP1. The mRNA (Fig. 4) and protein levels (Fig. 5) of both p53 and p21WAF1/CIP1 were up-regulated in a time- and dose-dependent manner in MCF7 cells treated with BRL. These stimulations were abrogated by GW (Figs. 4 and 5) suggesting a direct involvement of PPARγ.
Fig. 4 BRL up-regulates p53 and p21WAF1/Cip1 mRNA expression in MCF7 cells.
Semiquantitative RT-PCR evaluation of p53 and p21WAF1/Cip1 mRNAs expression. MCF7 cells were treated for 24 (A) and 48 (B) hours with increasing concentrations of BRL as indicated, 10μM GW alone or in combination with 1μM BRL. 36B4 mRNA levels were determined as control. The side panels show the quantitative representation of data (mean ± S.D.) of three independent experiments after densitometry and correction for 36B4 expression. *p<0.05 and **p<0.01 BRL-treated vs untreated cells
Fig. 5 BRL up-regulates p53 and p21WAF1/Cip1 protein expression in MCF7 cells.
Immunoblots of p53 and p21WAF1/Cip1 from MCF7 cells extracts treated for 24 h (A) and 48 (B) with increasing BRL concentrations, 10μM GW alone or in combination with 1μM BRL. β-actin was used as loading control. The side panels show the quantitative representations of data (mean ± S.D.) of three independent experiments performed for each condition. * p<0.05 and **p<0.01 BRL-treated vs untreated cells
BRL transactivates p53 Gene Promoter
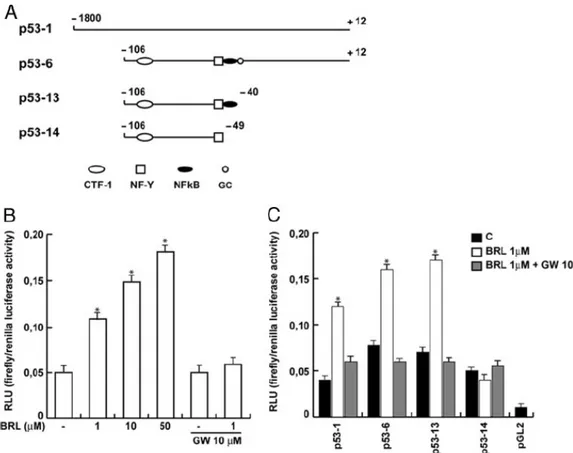
The aforementioned observations prompted us to investigate whether PPARγ is able to transactivate an expression vector encoding p53 promoter gene. Thus, MCF7 cells were transiently transfected with a luciferase reporter construct (named p531) containing the upstream region of the p53 gene spanning from -1800 to -12 (Fig. 6A) and treated with increasing concentrations of BRL for 24 h. Interestingly, the dose-dependent activation of p53-1 by BRL was reversed in the presence of GW, indicating that a PPARγ-mediated mechanism was involved in the transcriptional response to BRL (Fig. 6B). To identify the region within the p53 promoter responsible for transactivation, we used deletion constructs expressing different binding sites such as CTF-1/YY1, nuclear factor-Y (NF-Y), and NFκB (Fig. 6A). In transfection experiments performed using the mutants p53-6 and p-53-13 encoding the regions from -106 to -12 and from -106 to -40, respectively, the responsiveness to BRL was still observed, whereas using the mutant p53-14 encoding the sequence from -106 to -49 we did not detect an increase in luciferase activity (Fig. 6C). Consequently, the region from -49 to -40, which corresponds to the NFκB site (Fig. 6A), was required for the transactivation of p53 by BRL.
Fig. 6 Effects of BRL on p53 gene promoter-luciferase reporter constructs in MCF7 cells.
A: Schematic map of the p53 promoter fragments used in this study. B: MCF7 cells were transiently transfected with p53 gene promoter-luciferase reporter construct (p53-1) and treated for 24 hours with increasing BRL concentrations, 10μM GW alone or in combination with 1μM BRL. C: MCF7 cells were transiently transfected with p53 gene promoter-luc reporter constructs (p53-1, p53-6, p53-13, p53-14) and treated for 24 hours with 1μM BRL and/or 10μM GW. The luciferase activities were normalized to the Renilla luciferase as internal transfection control and data were reported as RLU values. Columns are mean ± S.D. of three independent experiments performed in triplicate. *p<0.05 BRL-treated vs untreated cells. pGL2: basal activity measured in cells transfected with pGL2 basal vector; RLU, Relative Light Units. CTF-1, CCAAT-binding transcription factor-1; NF-Y, nuclear factor-Y; NFkB, nuclear factor κ B.
PPARγ binds to NFκB sequence in EMSA
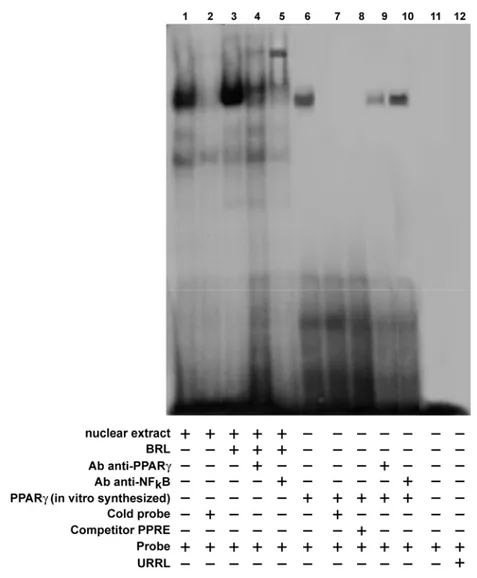
To further evaluate whether the NFκB site is responsible for the action triggered by BRL, we performed EMSA experiments. Using synthetic oligodeoxyribonucleotides corresponding to the NFκB sequence, we observed the formation of a single band in nuclear extracts from MCF7 cells (Fig. 7, lane 1), which was abrogated by 100-fold molar excess of unlabeled probe (Fig. 7, lane 2), demonstrating the specificity of the DNA binding complex. Of note, BRL treatment induced a strong increase in the specific band (Fig. 7, lane 3), which was immunodepleted and supershifted using PPARγ (Fig. 7, lane 4) and anti-NFκB (Fig. 7, lane 5) antibodies. Interestingly, the PPARγ transcribed and translated protein was able to bind to [γ32P] NFκB oligonucleotide (Fig. 7, lane 6).
The specificity of the band was proved by a 100-fold excess of cold probe (Fig. 7, lane 7) and confirmed by a consensus PPARγ response element (PPRE) used as a cold competitor (Fig. 7, lane 8). In addition, the immunodepleted band obtained using the PPARγ antibody (Fig. 7, lane 9), but not observed with the anti-NFκB antibody (Fig. 7, lane 10), confirmed that PPARγ binds in a specific manner to the NFκB site present in the promoter of p53.
Fig. 7 PPARγ binds to NFkB site in the p53 promoter region in EMSA.
Nuclear extracts from MCF7 cells (lane 1) or 2 μl of PPARγ translated protein (lane 6) were incubated with a double-stranded NFκB sequence probe labeled with [γ32P] and subjected to electrophoresis in a 6% polyacrylamide gel. Competition experiments were performed adding as competitor a 100-fold molar excess of unlabeled NFκB probe (lanes 2 and 7) or as cold competitor PPRE (lane 8). In lane 3, nuclear extracts from MCF7 were treated with 10µM BRL. Anti-PPARγ and anti-NFκB Abs were incubated with nuclear extracts from MCF7 cells treated with 10µM BRL (lanes 4 and 5, respectively) or added to PPARγ protein (lanes 9 and 10, respectively). Lane 11 contains probe alone, lane 12 contains 2 μl of unprogrammed rabbit reticulocyte lysate incubated with NFκB (URRL).
Functional interaction of PPARγ with p53 in ChIP Assay
The interaction of PPARγ with p53 was further elucidated by ChIP experiments. MCF7 cells were treated with formaldehyde to form DNA-protein cross-links and then sonicated. Thereafter, using anti-PPARγ, anti-NFκB, and anti-RNA polymerase II (Pol II) antibodies, we immunoprecipitated the complexes, and the binding of PPARγ NFκB, and RNA Pol II, respectively, to the NFκB site within the p53 promoter was revealed by PCR. As shown in Fig. 8, BRL increased the recruitment of PPARγ to the promoter of p53. The BRL-induced effect was slightly reduced by TGFβ, but not altered in presence of the specific inhibitor of NFκB P (Hehner et al., 1998) (Fig. 8). As it concerns the recruitment of NFκB to p53, evaluated using the anti- NFκB antibody, TGFβ enhanced such interaction that was abolished by P (Fig. 8). Moreover, P was able to prevent the binding of RNA Pol II to p53 induced by TGFβ, but not that determined by BRL (Fig. 8). These findings confirmed the ability of PPARγ to stimulate the transcription of p53 in a NFκB-independent manner (Fig. 8).
Fig. 8 Functional interaction of PPARγ and p53 in ChIP assay.
MCF7 cells were treated for 1 hour with 10μM BRL, then cross-linked with formaldehyde and lysed. The soluble chromatin was immunoprecipitated with either anti-PPARγ or anti-RNA Pol II antibodies. The immunocomplexes were reverse cross-linked, and DNA was recovered by phenol/chloroform extraction and ethanol precipitation. The p53 promoter sequence containing NFκB was detected by PCR with specific primers, as described in Materials and Methods. To control input DNA, p53 promoter was amplified from 30μl of initial preparations of soluble chromatin (before immunoprecipitations). N, negative control performed by using normal rabbit serum instead anti-PPARγ antibody.
BRL induces Caspase-9 cleavage and DNA fragmentation in MCF7 cells
Having demonstrated that PPARγ mediates p53 expression induced by BRL, we investigated the cleavage of caspase 9, which is an important component of the intrinsic apoptotic process (Cohen 1997). Notably, the treatment of MCF7 cells with BRL for 48 h promoted the caspase-9 activation, which was prevented by GW and in presence of an expression vector encoding p53 antisense (AS/p53) (Fig. 9A), which abolished p53 expression (Fig. 9B). On the contrary, the effect of BRL on the cleavage of caspase 9 was still notable using the NFκB inhibitor P (Fig. 9A), which abrogating the NFκB protein levels (Fig. 9C) excluded the contribution of such factor in the action elicited by BRL.
Fig.9 BRL induces cleavage of caspase-9.
A: MCF7 cells were treated with BRL alone or in combination with GW or parthenolide (P) for 48-h as indicated, or transfected with an expression plasmid encoding for p53 antisense (AS/p53). Positions of procaspase-9 and its cleavage products are indicated by arrowheads to the right. One of three similar experiments is presented. β-actin was used as loading control on the same stripped blot. B: p53 protein expression (evaluated by WB) in MCF7 cells transfected with an empty vector (v) or a AS/p53 and treated as indicated. β-actin was used as loading control. C: NFκB expression in MCF7 cells untreated or treated with 15µM P as indicated. β-actin was used as loading control.
MCF7 breast cancer cells express both Fas and FasL
Previous studies have shown that MCF7 cells coexpress both Fas and FasL, indeed controversial data are reported in this context (Keane et al., 1996; Toillon et al., 2002; Beidler et al., 1995). To evaluate if Fas and FasL are expressed in our MCF7 cells, we did Western blot analysis of cellular lysates and found that they do indeed express both proteins (Fig.10A).
BRL up-regulates FasL expression in MCF7 cells
In order to understand whether PPARγ triggers apoptotic events through Fas/FasL signalling, we first evaluated the ability of PPARγ agonist BRL to modulate FasL expression in MCF7 cells.
A BRL dose-dependent increase in FasL content was observed by Western blot analysis after 24 hours of treatment (Fig. 10B). Furthermore, by a semiquantitative Reverse Transcription-Polymerase Chain Reaction (RT-PCR) method, after 24 hours upon increasing BRL concentration, we showed that BRL was able to upregulate FasL gene expression in a dose-dependent manner (Fig. 10C). The BRL action on FasL espression was reversed when we used GW, (Fig. 10 and 10C) implying a PPARγ-dependent action in MCF7 cells.
Fig. 10 BRL up-regulates FasL protein and mRNA expression in MCF7 cells.
A: Immunoblots of FasL and Fas from MCF7 breast cancer cells. B: Immunoblots of FasL from MCF7 cells treated for 24 hours with vehicle (-), increasing BRL concentrations, 10 µM GW alone or in combination with 1µM BRL. β-actin was used as loading control. The side panel shows the quantitative representation of data (mean ± S.D.) of three independent experiments including that of B. C: Semiquantitative RT-PCR evaluation of FasL mRNA expression. MCF7 cells were treated as in B. 36B4 mRNA levels were determined as control. The side panel shows the quantitative representation of data (mean ± S.D.) of three independent experiments including that of C after densitometry and correction for 36B4 expression. *p<0.05 BRL-treated vs untreated cells **p<0.01 BRL-treated vs untreated cells
PPARγ transactivates FasL promoter in MCF7 cells
Next, we evaluated whether one of the mechanisms involved in PPARγ-mediated increase of FasL expression could be a direct modulation of the transcriptional activity of its promoter. Transient transfection assays were performed in MCF7 cells using the luciferase reporter constructs containing the region of the human FasL promoter gene spanning from -2365 to -2 bp relative to the translation initiation site (FasL Luc-0) or progressive 5’ deletions of the FasL promoter, FasL Luc-3 (from –318 to -2 bp) and FasL Luc-4 (from -237 to -2 bp) (Fig. 11A). Of interest, differences in the basal transcriptional activity were observed among constructs. The results shown in Fig. 11B indicate that transcription from the FasL Luc-0 construct was detectable, but strong and increasing luciferase activity was evidenced with FasL Luc-3 and FasL Luc-4 constructs, suggesting the presence of potential negative regulatory regions located within -2365 and -318 bp, consistent with a previous study (McClure et al., 1999). Using the FasL Luc-3 construct, the promoter activity increased upon BRL treatment in a dose-dependent manner, while this effect was abrogated by GW, indicating that FasL promoter activation depends on the presence of a functional PPARγ (Fig. 11C). BRL failed to enhance the transcriptional activity when cells were transfected with FasL Luc-4 construct (Fig. 11C), suggesting that the segment located between -318 and -237 relative to the translation initiation site is crucial for BRL- responsiveness. In particular, this
region contains three DNA motifs known to bind the transcription factors Sp1 (named according to the original purification scheme that included Sephacryl and phosphocellulose columns) (Philipsen and Suske, 1999), nuclear factor of activated T cells (NFAT) and NFκB (McClure et al., 1999) (Fig. 11A). It was reported that Sp1 consensus sequence is necessary for basal transcription from the FasL promoter, and that Sp1 alone is sufficient to drive transcription from the promoter in vivo (McClure et al., 1999). M is a drug able to bind to GC boxes and then to inhibit Sp1 binding selectively blocking mRNA synthesis from genes that contain functional recognition sites both in vitro and in vivo (Blume et al., 1991). We sought to investigate whether Sp1 alone was sufficient to drive FasL transcription or if it required the presence of additional ones. By using a FasL Luc-3 construct deleted in the Sp1 site (Fas Luc-3 ΔSp1), as shown in Fig. 11A, BRL was unable to transactivate FasL promoter (Fig. 11C). Besides, as shown in Fig. 11D, in MCF7 cells transfected with FasL Luc-3 construct and treated with mithramycin, the FasL transactivation upon 1 μM BRL treatment was prevented. Altogether these data strongly suggest that Sp1 plays an important role in regulating FasL transcription also in MCF7 cells.
Fig. 11 BRL transactivates FasL promoter gene in MCF7 cells.
A: Schematic map of the FasL promoter fragments used in this study. B: Basal transcriptional activity of the different FasL-luciferase report constructs (Luc-0, Luc-3 and Luc-4). C: MCF7 cells were treated for 24 hours with vehicle (-), increasing BRL concentrations, 10 µM GW alone or in combination with 1 µM BRL. D: MCF7 cells were treated for 24 hours with vehicle (-), 1µ M BRL, 100 nM mithramycin (M) alone or in combination with 1 µM BRL. The luciferase activities were normalized to the Renilla luciferase as internal transfection control and data were reported as RLU values. Columns are mean ± S.D. of three independent experiments performed in triplicate. *p<0.05 BRL-treated vs untreated cells, **p<0.01 BRL-treated vs untreated cells. RLU, Relative Light Units.
PPAR γ interacts with FasL through Sp1 site in EMSA
To gain further insight into the mechanism involved in the FasL transactivation induced by BRL, we performed EMSA using a synthetic oligodeoxyribonucleotide which contains the Sp1, NFAT and NFkB DNA binding motifs and encompasses the DNA fragment of FasL promoter from -288 to - 263 relative to the translation initiation site. We tested for possible interactions of PPARγ with each of the indicated transcription factors located within the above mentioned FasL promoter region. In nuclear extracts from MCF7 cells we observed the formation of three specific complexes (Fig. 12, lane 1), which were increased upon BRL treatment (lane 2). The binding was abrogated by 100 fold molar excess of unlabelled probe (lane 3), demonstrating the specifity of the DNA-binding complex. To confirm that FasL transcription induced by BRL in MCF7 cells is regulated by Sp1, nuclear extracts were incubated with three different unlabelled oligonucleotides bearing internal mutations as reported in Materials and Methods. An excess of unlabeled oligonucleotide containing mutations in the Sp1 site did not compete with the DNA binding of the protein complex (lane 4). In addition, incubation with an excess of unlabeled oligonucleotides containing mutations of either NFAT or NFkB competed both away all DNA-binding activity of the protein complexes bound to the 32P-labeled wild type -288 to -263 FasL oligonucleotide (lane 5 and 6, respectively).
Moreover, the addition of mithramycin in the reaction mixture strongly reduced the intensity of the bands (Fig. 12, lane 7). The involvement of PPARγ and Sp1 in the DNA-binding complexes was confirmed by using the specific anti- PPARγ (lane 8) and anti- Sp1 (lane 9) Abs, since both induced supershift and immunodepletion of the bands.
Fig. 12 PPARγ binds to Sp1 site within FasL promoter region in EMSA.
Nuclear extracts from MCF7 cells (lane 1) were incubated with a labeled sequence containing bases -288 to -263 of the wild- type FasL promoter and subjected to electrophoresis in a 6% polyacrylamide gel. In lane 2, nuclear extracts from MCF7 were treated with 1 µM BRL. Competition experiments were performed adding as competitor a 100-fold molar excess of unlabeled FasL probe (lane 3) or 100 nM mithramycin (M) (lane 7). An excess of three unlabeled oligonucleotides ΔSp1 (lane 4), ΔNFAT (lane 5) and ΔNFκB (lane 6), was used. Anti-PPARγ and anti-Sp1 Abs were incubated with nuclear extracts from MCF7 cells treated with 1 µM BRL (lanes 8 and 9, respectively). Lane 10 contains probe alone.
Functional interaction of PPARγ with FasL by ChIP Assay
The interaction of PPARγ with the FasL gene promoter was further investigated by ChIP assay. MCF7 chromatin was immunoprecipitated with the anti-PPARγ Ab and then reprecipitated with the anti-RNA-Pol II or anti-Sp1 Abs. PCR was used to determine the recruitment of PPARγ to the FasL region containing the Sp1 site. The results indicated that PPARγ was weakly constitutively bound to the FasL promoter in untreated cells and this recruitment was increased upon BRL treatment, while mithramycin combined with BRL reversed this effect (Fig. 13). In addition, by Re-ChIP assay we demonstrated that a positive regulation of FasL transcription activity was induced by BRL as well as a coexistence between PPARγ and Sp1 on FasL promoter(Fig. 13).
Fig. 13. Functional interaction between PPARγ and FasL promoter.
MCF7 cells were treated as indicated, then cross-linked with formaldehyde and lysed. The soluble chromatin was immunoprecipitated with the anti-PPARγ Ab, (Re-ChIP with the anti-RNA Pol II and the anti-Sp1Ab). The FasL promoter sequence containing Sp1 was detected by PCR with specific primers, as described in Materials and Methods. To control input DNA, FasL promoter was amplified from 30 µl of initial preparations of soluble chromatin (before immunoprecipitations). N, negative control provided by PCR amplification without DNA sample. In the bottom of the panel quantitative representation of data of three independent experiments (mean ± S.D.) after densitometry. *p<0.05 BRL-treated vs untreated cells. M: mithramycin.
PPARγ activates the Fas/FasL apoptotic pathway
Fas/FasL signalling when activated recruits adapter proteins and cysteine proteases such as caspase 8 leading to apoptosis (Green, 1998 and references therein). To better define the action of PPARγ on Fas/FasL pathway, we used GW as well as both PPARγ and FasL RNA interferences (i) to evaluate the activation of caspase 8, key component of the extrinsic apoptotic process. By WB analysis
our data showed that untreated MCF7 cells expressed the pro-form of caspase 8, while only after BRL exposure caspase 8 was activated as evidenced by the presence of its 11 kDa cleavage product (Fig. 14C). The active caspase 8 cleavage was absent in cells treated with GW alone or combined with BRL, or inhibiting both the expression of PPARγ and FasL by the respective RNAis (Fig. 14C). As shown in Figs 14A and 14B, PPARγ and FasL RNAi were able to inhibit the two proteins expression, respectively. These data demonstrated for the first time that PPARγ triggers the apoptotic events via Fas/FasL signalling, showing that the extrinsic death pathway is a significant contributor in BRL-induced apoptosis in MCF7 cells. The apoptotic process is associated with morphological changes and biochemical events such as nuclear condensation and fragmentation, the fragments correspond to strands of DNA that were cleaved at internucleosomal regions and create a 'ladder pattern' when electrophoresed on an agarose gel (Montague and Cidlowski, 1996). Because of its near universality, internucleosomal DNA degradation is considered a diagnostic hallmark of cells undergoing apoptosis. Therefore, we studied DNA fragmentation assay under BRL treatment in MCF7 cells evidencing that the induced apoptosis is PPARγ-dependent as it was reversed by the PPARγ RNAi (Fig. 14D). These results indicate a positive crosstalk between PPARγ and FasL that is responsible, at least in part, for BRL-induced apoptosis in MCF7 cells.
Fig. 14. BRL induces the extrinsic apoptotic pathway in MCF7 cells.
PPARγ (A) and FasL (B) protein expression (evaluated by WB) in MCF7 cells transfected with a 25-nucleotide of RNA interference (RNAi) targeted human PPARγ or FasL mRNA sequence respectively, or with control RNAi as reported in Materials and Methods and treated for 48 hours as indicated. β-actin was used as loading control. C) MCF7 cells were treated for 48 hours as indicated, or transfected with PPARγ, FasL or control RNAis. Positions of procaspase 8 (P) and its active cleavage product (S) are indicated by arrowheads on the right. One of three similar experiments is presented. β-actin was used as loading control on the same stripped blot. D) DNA laddering was performed in MCF7 cells treated for 72-h as indicated, or transfected with PPARγ or control RNAi.
FasL is a common mechanism by which PPARγ mediates apoptosis in breast cancer cells
Finally, we examined other human breast cancer cell lines to determine whether the involvement of FasL is unique to MCF-7 cells or it is a common mechanism by which PPARγ mediates apoptosis in breast cancer. MDA-MB231 (ERα-negative breast cancer cells, MDA) and BT20 (insulin receptor substrate-1, IRS-1 negative breast cancer cells), both expressing Fas and FasL (Fig. 15A), showed a FasL upregulation upon BRL treatment, which was reduced by PPARγ RNAi (Fig. 15B). DNA fragmentation assay under BRL treatment in MDA and BT20 cells confirmed that the PPARγ- induced apoptosis involves Fas/FasL signalling (Fig. 15C), addressing a general mechanism in breast cancer cells.
Fig. 15. BRL induces FasL up-regulation through PPARγ in breast cancer cells.
A: FasL and Fas protein expression (evaluated by WB) in MDA and BT20 breast cancer cells. B: MDA and BT-20 cells were treated for 48 hours as indicated, or transfected with a 25-nucleotide of RNA interference (RNAi) targeted human PPARγ mRNA sequence or with control RNAi as reported in Materials and Methods. β-actin was used as loading control. One of three similar experiments is presented. C: DNA laddering was performed in MDA and BT20 cells treated for 72-h as indicated, or transfected with PPARγ or control RNAi.
DISCUSSION
In recent years, a great deal of attention focused on the antiproliferative effects of PPARγ in a variety of cancer cell types. Treatments with PPARγ ligands have been demonstrated to induce cell cycle arrest and apoptosis in different cancer models (Mueller et al., 1998; Elstner et al., 1998; Brockman et al.,1998).
Additionally, PPARγ is proved to be a regulator of the expression of many genes relevant to inhibit carcinogenesis (Theocharisa et al., 2003 and references therein). In the first part of the present study we showed a crosstalk between ERα and PPARγ signaling pathways that is able to modulate the growth response to cognate ligands in hormone-dependent breast cancer cells.
Besides, the crosstalk of ERα and PPARγ involves their physical association at the protein level, which is even extended to p85 submit of PI3K. (our published data on CCR, 2005). Such phenomenon may provide an explanation for the opposite functional interplay on PI3K/AKT signaling exerted by ERα and PPARγ transduction pathways.
Previous studies have reported the ability of PPARγ to up-regulate the expression of the PTEN tumor suppressor gene, which in turn antagonizes the PI3K/AKT cascade (Di Cristofano and Pandolfi 2000; Yamada and Araki 2001). Of note, the binding of PPARγ to a pair of PPRE sequences located upstream to the transcription starting site of PTEN is responsible for the modulation of its expression (Sun et al. 2001). Our data confirmed that PPARγ mediates the up-regulation of PTEN because it was enhanced by a 24-hour exposure to BRL. Interestingly, this effect was no longer noticeable in the presence of 17β-estradiol,
demonstrating the opposite action of ERα in respect to PPARγ on the PI3K pathway. Our findings provide further evidence on the intriguing interplay between the rapid effects triggered at the membrane level and genomic events requiring different mechanisms which control cell survival and proliferation. Indeed, the opposite functional role elicited by ERα and PPARγ was recapitulated in the biological responses provided by the growth assay. BRL repressed the PI3K/AKT pathway and induced antiproliferative effects in MCF7 cells. The constitutively active myr-AKT reversed the inhibitory action of BRL, indicating that the PI3K/AKT pathway is involved in the negative growth regulation mediated by PPARγ.
To provide new insight into the inhibitory action exerted by the cognate PPARγ-ligand BRL, in the second part of our investigation we demonstrated that PPARγ mediates the growth arrest in G0-G1 phase induced by BRL in MCF7 cells. In addition, considering the key role elicited by p53 tumor suppressor gene in the growth inhibition and apoptosis (Yu and Zhang 2005; Haupt et al.,2003), we have evaluated whether PPARγ signaling converges on p53 transduction pathway in MCF7 cells. Of interest, we found that BRL exposure up-regulates both p53 mRNA and protein levels with a concomitant increase of p21WAF1/Cip1 expression. These effects were abrogated in the presence of the specific antagonist GW, addressing a PPARγ-mediated mechanism. Therefore, investigating the potential ability of BRL to modulate p53 promoter gene, we performed transient transfections in MCF7 cells using diverse deletion mutants of p53 promoter gene (Qin et al.,2002). The dose-dependent transactivation of p53 by BRL involved
PPARγ directly because the transcriptional activity was prevented by GW treatment. Moreover, we documented that the region spanning from -49 to -40, which corresponds to the NFκB site, is required for the responsiveness to BRL. It deserves to be mentioned that the transcription factor NFκB can regulate both pro- and antiapoptotic signaling pathways depending on cell type, the extent of NFκB activation, and the nature of the apoptotic stimuli (Fujioka et al.,2004). NFκB was reported to physically interact with PPARγ (Chung et al.,2000), which in some circumstances binds to DNA cooperatively with NFκB (Coutureir et al.,1999; Sun et al., 2002), further enhancing the NFκB-DNA binding (Ikawa et al.,2001). Furthermore, PPARγ agonists were able to enhance the binding of NFκB to the upstream κB regulatory element site of c-myc (Schlezinger et al.,2002). Our EMSA experiments extended the aforementioned observations because nuclear extracts of MCF7 cells treated with BRL showed an increased binding to the NFκB sequence located in the p53 promoter region. Given that the anti-PPARγ and anti-NFκB antibodies were both able to induce shifted bands, we performed an EMSA study using a cell-free system to ascertain the potential direct interaction of PPARγ with the NFκB site. Interestingly, we observed the formation of a single DNA-binding complex, which was again shifted by the anti-PPARγ antibody. These findings were supported by ChIP assay in MCF7 cells demonstrating the ability of BRL to enhance the recruitment of PPARγ and RNA Pol II to the promoter of p53 even in presence of the NFκB inhibitor P. Overall, these data indicate that the PPARγ-mediated growth arrest upon addition of BRL in MCF7 cells involves, at least in part, the direct stimulation of p53 transcription.
A large body of evidence has suggested the straightforward role of p53 signaling in the apoptotic cascades that include the activation of caspases, a family of cytoplasmic cysteine proteases (Schuler and Green 2001). The intrinsic apoptotic pathway involves a mitochondria-dependent process, which results in cytochrome c release and, thereafter, activation of caspase-9 (Cohen 1997). Furthermore, apoptosis is characterized by distinct morphological changes including the internucleosomal cleavage of DNA, which is recognized as a DNA ladder (Cohen 1997 and references therein). Notably, we evidenced that in a consecutive series of events BRL 1) up-regulates the expression of p53 and 2) its effector p21WAF1/Cip1, 3) triggers the cleavage of caspases-9, and 4) induces DNA fragmentation in a PPARγ-mediated manner. Since the PPARγ-mediated apoptosis is not completely blocked by using the p53 antisense, we suggest that final PPARγ action in this concern is complex and it may require a multifactorial coordination of different signalling cascades. From there, we investigated the potential of PPARγ in inducing apoptotic events through a direct involvement of the Fas/FasL extrinsic apoptotic pathway in breast cancer cells. The Fas/FasL signalling system plays an important role in chemotherapy-induced apoptosis in several different cell types (Kasibhatla et al., 1998; Mo and Beck, 1999). FasL is a member of the TNF superfamily that induces apoptosis in susceptible cells upon cross-linking of its own receptor, Fas (Nagata, 1997; Chinnaiyan and Dixit, 1997; Suda et al., 1993; Nagata and Golstein, 1995). FasL is expressed on the cell membrane surface of activated T lymphocytes and cancer cells (Oshimi et al., 1996; Hahne et al., 1996; Mullauer et al., 2000). Significantly, constitutive
regulation of Fas is involved in drug resistance (Landowski et al., 1997) and associated with a poor prognosis in breast cancer (Toillon et al., 2002). It has been described that breast cancer cells may be Fas sensitive or Fas insensitive and divergent data are presented on FasL expression in these cells (Keane et al., 1996; Toillon et al., 2002). In our MCF7 cells, positive to Fas and FasL, we found that BRL through PPARγ activation upregulated FasL at both protein and mRNA levels. Despite the FasL relevance, its cell and tissue distribution, and the apparent differences of its expression in a cell-specific manner, little knowledge is available how FasL expression is regulated. Recently, a downregulation of FasL by BRL has been reported in focal cerebral ischemia (Chu et al., 2006). It was also showed that prostaglandin 15-deoxy- delta 12,14-prostaglandin J2, a natural PPARγ ligand inhibits FasL gene expression in T lymphocytes via a PPARγ-independent mechanisms (Cippitelli et al., 2003). Indeed it is quite common for biological signalling pathways to vary depending on tissue type or cell condition. We demonstrated that BRL increased the transactivation of FasL promoter in a dose-related and in a PPARγ-dependent manner. Promoter deletion analysis of FasL has delineated a minimal promoter fragment spanning nucleotides from -318 to -237 bp, which was responsible for BRL activity. Indeed, the abovementioned region included three DNA motifs known to bind the transcription factors Sp1, NFAT and NFkB (McClure et al., 1999). NFkB was reported to physically interact with PPARγ (Chung et al., 2000), which in some circumstances binds to DNA cooperatively with NFkB (Bonofiglio et al., 2006; Chung et al., 2000; Coutureir et al., 1999). NFAT and Sp1 are critical factors responsible for FasL