1
UNIVERSITA’ DEGLI STUDI DI VERONA
DIPARTIMENTO DI
SCIENZE CHIRURGICHE, ODONTOSTOMATOLOGICHE E MATERNO-INFANTILI
SCUOLA DI DOTTORATO DI SCIENZE DELLA VITA E DELLA SALUTE
DOTTORATO DI RICERCA IN SCIENZE CARDIOVASCOLARI
Con il contributo di
UNIVERSITA’ DEGLI STUDI DI VERONA
CICLO/ANNO XXXII/2016
TITOLO
VIDEO KINEMATIC EVALUATION OF THE HEART (VI.KI.E.): AN IDEA, A PROJECT, A REALITY
S.S.D. MED/23
Coordinatore: Prof. GIOVANNI BATTISTA LUCIANI Firma __________________________
Tutor: Prof. GIOVANNI BATTISTA LUCIANI Firma __________________________ Tutor: Prof. MICHELE MIRAGOLI
Firma __________________________
Dottorando: Dott. GIACOMO ROZZI
Firma ________________________
2
Quest’opera è stata rilasciata con licenza Creative Commons Attribuzione – non commerciale Non opere derivate 3.0 Italia . Per leggere una copia della licenza visita il sito web:
http://creativecommons.org/licenses/by-nc-nd/3.0/it/
Attribuzione Devi riconoscere una menzione di paternità adeguata, fornire un link alla licenza e indicare se sono state effettuate delle modifiche. Puoi fare ciò in qualsiasi maniera ragionevole possibile, ma non con modalità tali da suggerire che il licenziante avalli te o il tuo utilizzo del materiale.
Non Commerciale Non puoi usare il materiale per scopi commerciali.
Non opere derivate —Se remixi, trasformi il materiale o ti basi su di esso, non puoi distribuire il materiale così modificato.
VIDEO KINEMATIC EVALUATION OF THE HEART (VI.KI.E.): AN IDEA, A PROJECT, A REALITY
Giacomo Rozzi Tesi di Dottorato Verona, 6/08/2020 ISBN: 9788869251627
3
SOMMARIO
Introduzione:
Lo sviluppo tecnologico degli ultimi 20 anni ha impegnato tutti gli sforzi al fine di implementare modalità innovative di imaging non invasive per accelerare la translazionalità dalla ricerca di base alla clinica, specialmente in ambito cardiologico.
In questo lavoro è presentato e spiegato nel dettaglio, un innovativo approccio all’imaging cardiaco. Questo approccio è chiamato valutazione video cinematica (Vi.Ki.E. da Video Kinematic Evaluation) ed è in grado di monitorare, con modalità non invasiva, la cinetica e la deformazione cardiaca in-situ durante la chirurgia. La cinetica cardiaca è stata approfonditamente valutata spaziando dall’animale sperimentale alle patologie cardiache negli umani che colpiscono entrambi i ventricoli, destro e sinistro.
Metodi:
La tecnologia Vi.Ki.E. può essere definita “tanto semplice quanto innovativa”. Infatti, consiste semplicemente in una telecamera ad alta risoluzione temporale posizionata sopra un cuore battente in-situ, dopo esposizione tramite toracotomia e sospensione pericardica, che ne registra i cicli cardiaci. Successivamente un software di tracking è applicato al video precedentemente registrato per seguire i movimenti del tessuto epicardico. Questo tracker fornisce informazioni sulle traiettorie dell’epicardio e, grazie ad un algoritmo customizzato, la tecnologia recupera informazioni sulla meccanica cardiaca come forza di contrazione o fatica cardiaca, consumo energetico, velocità di contrazione, spostamento del marker e torsione epicardica.
Questa tecnica è stata testata su 21 ratti (9 sottoposti a protocollo di ischemia/riperfusione e/o per le validazioni, 12 per lo studio sulla differenza di genere) e 37 pazienti sottoposti a differenti operazioni tra il 2015 e il 2019. Nel dettaglio 10 pazienti sono stati sottoposti a Bypass aortocoronarico, 12 hanno effettuato una sostituzione della valvola polmonare dopo riparazione chirurgica di
4
Tetralogia di Fallot, 6 sono stati sottoposti ad un impianto di assistenza ventricolare sinistra (LVAD) (1 di questi è stato spostato nel capitolo case study), 6 pazienti con cuore ipoplasico sono stati sottoposti ad interventi di GLENN o FONTAN, 2 pazienti sono stati sottoposti a trapianto cardiaco ed infine 1 paziente ha ricevuto una doppia sostituzione valvolare (paziente spostato nel capitolo case study).
Risultati:
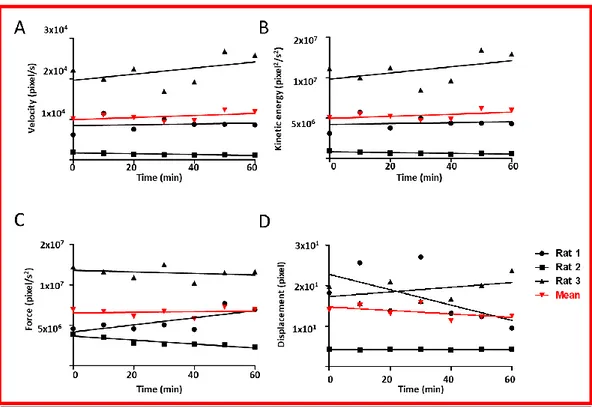
I risultati mostrano che in tutti i pazienti la tecnologia Vi.Ki.E. è stata in grado di discriminare in tempo reale, con potenza statistica, le differenze di cinetica cardiaca prima e dopo la chirurgia, suggerendo possibili implicazioni cliniche nel trattamento dei pazienti prima della chiusura del torace e/o in terapia intensiva. Per quanto riguarda gli animali sperimentali i risultati ottenuti sono alla base delle validazioni della tecnologia. Alcuni di essi sono stati usati come modello in comparazione coi risultati Vi.Ki.E. ottenuti da pazienti.
Conclusioni:
In conclusione, questo studio ha dimostrato che la tecnologia di valutazione video cinematica è sicura e non invasiva con una possibile e promettente applicazione clinica. La facilità della valutazione e l’approccio basato sull’algoritmo rendono il Vi.Ki.E. una tecnologia ad ampio spettro, in grado di acquisire dati dalle cellule battenti in vitro fino alla clinica, passando per la valutazione preclinica e possibilmente anche in quella ex-vivo come l’approccio nel cuore isolato di Langerdorff.
5
ABSTRACT
Introduction:
The technological development of the last 20 years pledges the intensity of efforts for implementing novel imaging contactless modalities that accelerate the translation from the research bench to the patient bedside, especially in the cardiac field. In this work, a novel intraoperative cardiac imaging approach, named Video Kinematic Evaluation (Vi.Ki.E.), is presented and explained in detail. This technology is able to monitor, contactless, the cardiac mechanics and deformation
in-situ during heart surgery. Cardiac kinematics have been deeply evaluated ranging
from the experimental animal approach to the human myocardial pathologies in both left and right ventricles.
Methods:
Vi.Ki.E. can be defined “as simple as innovative”. It only consists of a high-speed camera placed upon an exposed beating heart in-situ to record cardiac cycles. Afterwards a tracker software is used on the recorded video to follow the epicardial tissue movements. This tracker provides information about trajectories of the epicardium and, thanks to a custom-made algorithm, the technology supplies heart mechanical information such as: Force of contraction or cardiac fatigue, Energy expenditure, Contraction velocity, displacement of the marker and epicardial torsion.
This approach has been tested on 21 rats (9 ischemia/reperfusion and/or for validation, 12 for the gender difference study) and on 37 patients who underwent different surgery between 2015 and 2019. In detail 10 patients underwent Coronary Artery Bypass Grafting, 12 underwent Valve Replacement after Tetralogy of Fallot correction surgery, 6 implanted a Left Ventricular Assist Device (1 is moved in the case study section), 6 patients with Hypoplastic Heart Syndrome underwent GLENN or FONTAN surgery, 2 patients underwent Heart Transplantation and finally 1 patient underwent double valve replacement (this patient is moved into case study section).
6
Results:
The patients’ results demonstrated that the Vi.Ki.E. technology was able to discriminate, with statistic potency, the kinematic differences before and after the surgery in real-time, suggesting possible clinical implications in the treatment of the patients before the chest closure and/or in the intensive care unit. As it concerns the experimental animals, the results are the basics of the validation technology. Some of them were used as accepted model in comparison with the Vi.Ki.E. results on patients.
Conclusions:
In conclusion, this study has shown that Vi.Ki.E. is a safe and contactless technology with promising possible clinical application. The ease in the evaluation and the algorithm-based approach makes Video Kinematic Evaluation a widespread technique from cellular level to human cases covering the entire experimental field with in-vivo evaluation and possibly Langendorff/Working Heart approaches.
7
INDEX
1. INTRODUCTION………...page 14 1.1. Cardiac Imaging………...………...page 14 1.1.1 Echocardiography (ECHO)………...page 15 - 2D imaging………...………....page 16 - M-mode………page 16 - Doppler Imaging………...page 17 - CW Doppler………...page 17 - PW Doppler………...page 17 - Color-flow mapping or Color Doppler…………...page 18 - 3D echocardiography………....page 19 - Multi-beat………...page 20 - Real-time………..page 20 1.1.2 Nuclear Cardiology……….…...page 21 - Myocardial perfusion scintigraphy (MPS or SPECT)…..….page 21- Evaluation of Cardiac Function with Radionuclide
Ventriculography (RNV)………...page 22 - Assessment of Myocardial Injury,
Infarction and Infection………page 22 - Imaging of the Nervous System of the Heart………page 22 - Positron Emission Tomography (PET)……….page 23 1.1.3 Cardiac Computer Tomography……….page 24
- Calcium Scoring………...page 24
- Coronary CT angiography………page 25
- Retrospectively ECG-gated cCTA protocols………page 26
- Prospectively ECG-gated cCTA protocols……...page 26
- Ventricles Function………...page 27
1.1.4 Magnetic Resonance………...page 29
- Spin-Echo sequence………..page 30
- Gradient-Echo (GRE) sequence………...page 30
8
- Perfusion MRI………..page 31
- Myocardial T1 mapping………...page 32
- Myocardial T2 mapping………...page 32
1.2. Video Kinematic Evaluation (Vi.Ki.E.)………..………page 33 1.2.1. Introduction………..page 33 1.2.2. Vi.Ki.E. functioning……….page 34 1.2.3. Camera speed selection……….page 35 1.2.4. Trajectories and Video cardiograms:
a qualitative point of view………page 37 1.2.5. Mechanical parameters explanation and
physiological meaning……….page 39 - Energy………..page 40 - Force……….page 40 1.3. Particle Image Velocimetry (PIV)………...……page 41 1.4. The Vi.Ki.E. competitive advantage………page 42 Echography...page 42 - Transthoracic Echocardiography………..page 42 - Pros………...…………page 42 - Cons……...………...…………page 42 - Transesophageal Echocardiography……….page 42 - Pros………...…………page 42 - Cons…...………...…………page 42 Nuclear Cardiology………...…….page 43 - Pros………...………...…….page 43 - Cons………..…...…….page 43 Cardiac Computer Tomography……….page 43 - Pros………...………...….page 43 - Cons………...………..….page 43 Magnetic Resonance………...page 43 - Pros………...…….page 43 - Cons……….…….page 44
9
Video Kinematic Evaluation………..page 44 - Pros………...………...…….page 44 - Cons………...…….page 44 2. METHODS………...page 46 2.1. Instrumentation………...page 46 - Vi.Ki.E. clinical instrumentation………..page 46 - Vi.Ki.E. Experimental instrumentation………page 46 2.2. Settings and placement of the marker………..page 47 2.3. Vi.Ki.E. Validation………..……...page 51 2.3.1. Kinetic Energy validation……….page 51 2.3.2. Force validation………page 52 2.3.3. Validation of data during time………..page 53 2.3.4. Validation in computer model……….…..page 54 2.4. Conversion curve from pixels to millimeters………..……page 57 2.5. Protocols………..page 58 - Human Surgical Protocols………page 58 - Vi.Ki.E. clinical protocols………page 58 - Animal surgical protocols……….page 60 - Vi.Ki.E. experimental protocols………...page 60 - Measurement of contraction Force………page 60 - Reproducibility of the data acquired……….page 60 - Ischemia/Reperfusion………...page 61 - Induced AV block……….page 61 - Atrial Stimulation……….page 61 3. RESULTS……….page 63 3.1. Cardiac Kinematic parameters computed from video of
in situ beating heart……….page 63 3.1.1. Abstract………page 63 3.1.2. Introduction………..page 64 3.1.3. Results………..page 66 - Validation of the measured parameters in rat hearts……….page 67 - Temporal and spatial resolution………page 68
10
- Reproducibility of the acquired data……….page 68 - Kinetic energy acquisition in a controlled and
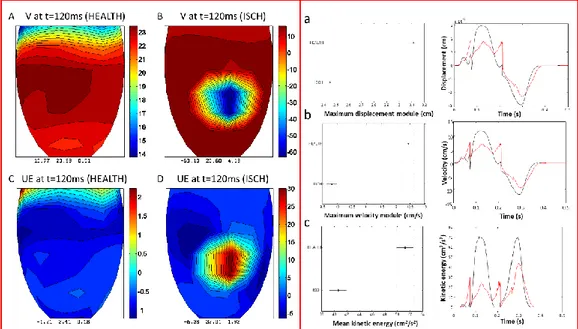
simple system………...page 69 - Measurement of the contraction force………...page 69 - Simulation of kinematic parameter measurement in ischemic contractile hearts………..page 71 - Video kinematic parameters in ischemic and
reperfused rat hearts……….page 73 - Video kinematic parameters in patients
underwent CABG……….page 76 - Improved kinetic energy following atrioventricular block in rat and human hearts: the Frank-Starling effect………page 78 3.1.4. Discussion………page 79 3.1.5. Limitations………...page 81 3.1.6. Methods………page 82 - Experimental animals………...page 82 - Human patients……….page 82 - Functional imaging………...page 83 - Low-speed video camera………..page 83 - High-speed video camera………..page 83 - Video acquisition………..page 84 - Video kinematic evaluation in rats………page 84 - Video kinematic evaluation during CABG in human Patients………page 85 - Quantitative analysis………page 85 - Kinematics………...page 85 - Particle Imagine Velocimetry………...page 85 - Mathematical models………...page 86 - Numerical simulations………..page 86 - Numerical methods………..page 87 - General statistics………..page 88 3.1.7. Supplementary information………..page 88
11
- Supplementary Methods………...page 88 - Experimental animals………...page 88 - Parameters calibration for the mathematical model of ischemia simulation………..page 89
- Supplementary Figure legends……….page 90 3.2. Real-time video kinematic evaluation of the in situ beating right ventricle after pulmonary valve replacement in patients with tetralogy of Fallot:
a pilot study……….page 94 3.2.1. Abstract ………page 95 - Objectives……….page 95 - Methods………page 95 - Results………..page 95 - Conclusion………page 96 3.2.2. Introduction………..page 96 3.2.3. Materials and Methods………..page 97 - Surgical methods………..page 99 - Experimental Protocol………..………..page 100 - Video kinematic Evaluation of right ventricle function.…page 100 - Statistical analysis………..……page 101 3.2.4. Results………..………..page 101 - Clinical outcome………..………...page 101 - Intraoperative video kinematic evaluation of right ventricle
function in patients with tetralogy of Fallot………...page 102 3.2.5. Discussion………..…page 105 3.2.6. Limitations……….page 108 3.2.7. Conclusions………page 108 3.2.8 Supplementary data……….page 109 3.3. In-situ optical assessment of rat epicardial kinematic parameters reveals frequency-dependent mechanic heterogeneity related to gender……...page 111
3.3.1. Abstract………..page 111 - Background………page 111 - Methods………..page 111
12
- Results………page 112 - Conclusion………..page 112 3.3.2. Introduction………page 112 3.3.3. Materials and methods………page 115 - Experimental animals……….page 115 - In-vivo atrial stimulation………page 115 - In-situ optical assessment of kinematic parameters………page 117 - Systolic and diastolic area and time………page 118 - Statistical analysis………..page 118 3.3.4. Results………page 119
- Frequency of epicardial torsion obtained via Particle Image
Velocimetry………page 120 - Geometrical spatiotemporal variation at different BCL…..page 121 - Rising stimulation frequency unmasks gender difference at the single cardiac cycle………page 122 3.3.5. Discussion.………..page 123 3.3.6. Conclusions and limitations……….page 125 3.4. Unpublished Results………..page 126 3.4.1. Tetralogy of Fallot………..page 126 - Results………....page 126 - Discussions…..…………...………....page 129 3.4.2. Hypoplastic Heart Syndrome………..page 130 - Results………..………..page 130 - HLHS patients……...……….………page 131 - HRHS patients………page 133 - Discussions………...………..page 135 3.4.3. Treatments for the Heart Failure………page 136
3.4.3.1. Left Ventricular Assist Device (LVAD)
implantation………..page 136 - Results………page 136 - Discussions………...………..page 138 3.4.3.2. Heart Transplantation evaluation………page 139
13
- Results………....page 139 - Patient#1 (58 years), VAD_Bridge to
Transplant………...page 141 - Patient#2 (56 years)………page 142 - Discussions………...………..page 142 3.4.4. Case studies……… page 144 - Results Case Study Patient #1………..……..page 144 - Discussions Case Study Patient #1………...……..page 145 - Results Case Study Patient #2………..……..page 146 - Discussions Case Study Patient #2………...……..page 147 4. DISCUSSIONS………...page 148 4.1. CABGs………..page 148 4.2. ToF………page 149 4.3. Gender differences………page 151 4.4. Hypoplastic Heart Syndromes………..……….page 151 4.5. LVAD………page 152 4.6. Heart Transplantation………page 153 5. LIMITATIONS………..page 155 6. CONCLUSIONS………page 155 7. REFERENCES………..page 157 ACKNOLEDGEMENTS……….page 170
14
1. INTRODUCTION
1.1. Cardiac Imaging
Thanks to the technological development of the last 20 years, a lot of efforts have been spent to implement novel imaging technologies accelerating the translation from the research bench to patient bedside especially in the cardiac field.
The main idea behind every technique must be the safety for the patients, ease in the analysis and the cost reduction. The concept of a single technology able to evaluate every cardiac pathological situation is still a utopia. However, the multitude of techniques around the cardiac field is the best way to provide the clinicians different points of view to extend the knowledge of the pathology and its course and minimizing the invasive surgical procedures when possible.
The most important imaging branches in cardiology are: 1. Echocardiography
2. Nuclear Cardiology
3. Cardiac Computer Tomography 4. Magnetic Resonance [1]
Brief but detailed information on those techniques will be presented in the following chapters.
15
1.1.1. Echocardiography (ECHO)
The Echocardiography is based on the use of ultrasounds to create an image of the heart. Ultrasound results from a phenomena called the “piezoelectric effect”, a peculiar feature of some crystals to transform electrical oscillations into mechanical oscillations (sound) and vice versa [2]. The Echo machinery functioning is based on the piezoelectric crystal transducer. When a current is applied to it, the crystal vibrates emitting ultrasounds. Afterwards, the ultrasounds bounce on the object and return to the transducer, hitting and distorting the crystal. The distortion generates an electrical signal that is analyzed by the Echo machinery. In summary, the crystal emits ultrasounds and then “listens” for the reflections [3].
The Echocardiogram can be performed in many ways, but the most common are: - Transthoracic (TTE)
- Transesophageal (TEE)
The transthoracic is the most used for heart check-ups and for pathology diagnosis, while the transesophageal is commonly used during cardiac surgery to check the intervention phases and the correct heart functionality before the patient’s chest closure. In the TEE, the Echo probe is inserted in the anesthetized patient’s esophagus until it reaches the heart position. This is particularly useful to visualize the posterior side of the heart (Left Ventricle; LV).
There are several different functions in every Echo machinery, and each gives a different heart point of view.
- Two-dimensional (2D) imaging - M-Mode imaging
- Doppler imaging - 3D echocardiography
16
2D imaging is the most used echo mode; it allows the detection of abnormal anatomy or abnormal movement of structures [4]. The most common cross-sectional views are the parasternal long axis, the parasternal short axis, and the apical view (Figure 1). These axes are only referred to the TTE. For the TEE, there are different views, the
midesophageal four-chamber, the midesophageal short- and long-axis, and the transgastric views.
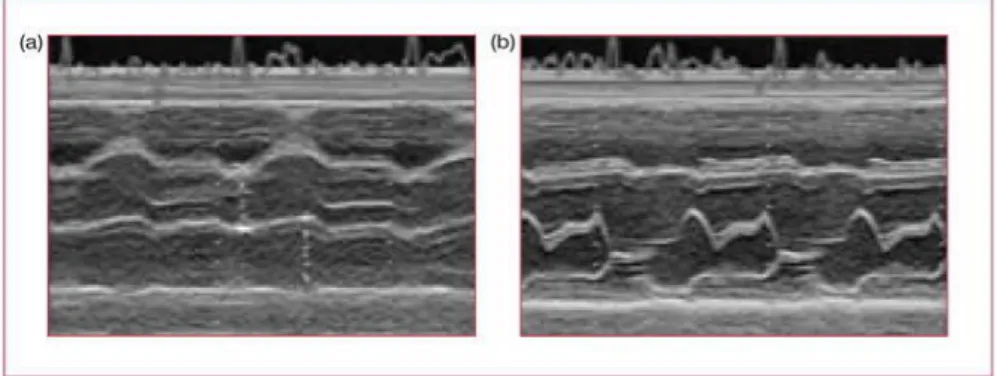
M-mode (Figure 2) is a 1-dimension echocardiography derived from an M line superimposed on a cross-sectional image. It shows the time as the second dimension. Controlling the sweep speed gives access to accurate measurements of cardiac cycle intervals and thanks to the high-repetition frequency of the technique, precise measurements of mural thickness and cavitary size are obtained. In this way, the derived information is superior to the one obtained from cross-sections. M-mode echocardiography is commonly used for the evaluation of left ventricular
Figure 1. The most common two-dimensional imaging echo views. Upper panel illustrates the three planes (think of them as three plates of glass intersecting at 90°), the second line shows these three planes separated, and the third line shows the accompanying echo views. (a) Parasternal long axis; (b) parasternal short axis; (c) apical chamber view (note, in the UK, the 4-chamber view is shown upside down). AV: aortic valve; LA: left atrium; LV: left ventricle; RA: right atrium; RV: right ventricle. From [3]
Figure 2. M-mode image of (a) the aorta/left atrium and (b) the mitral valve, both in a healthy heart. From [3]
17
function, using short- or long-axis cuts through the left ventricle, and the timing of cardiac events such as left ventricular ejection time, using a long-axis cut through the aortic valve [5].
Doppler Imaging merges the Doppler Effect with the imaging. The Doppler Effect is the change in the frequency of a wave emitted by a moving source in relation to the observer, caused by the different sound wavelengths (frequencies) travelling in the air. The same approach is used to measure the blood flow velocity by comparing the frequency change between the transmitted and reflected sound waves [4]. In cardiac ultrasound, Doppler is used in three ways:
- Continuous-wave (CW) Doppler - Pulsed wave (PW) Doppler
- Color-flow mapping (CFM) or Color Doppler
CW Doppler (Figure 3) does not provide spatial information since one crystal transmitting continuously and another recording continuously to read reflected signals. It estimates the severity of valve stenosis or regurgitation.
PW Doppler was created to overcome the spatial information limit on CW Doppler. It simply consists in a transducer emitting intermittently and reading returning signals in the time interval between two waves. This provides spatial information like conventional 2D mode while recording the blood flow velocities. The limitation of this modality lies in the pulse velocities that is limited by the returning signals time. If the transducer emits faster than the signal returns, the Aliasing effect will occur [5]. PW Doppler is used to assess ventricular in-flow patterns, intra-cardiac shunts and to make precise measurements of blood flow at valve orifices [4].
Figure 3. Example of Continuous wave doppler signal. From [3]
18
Color-flow mapping (CFM) or Color Doppler displays the blood direction and flow velocities superimposed on the image. A color is assigned to the flow direction; blue if the flow is going away from the transducer and red if the flow is going towards the transducer (Figure 4). The velocity of flow is displayed in blue and red shades; the faster the flow, the brighter the color. CFM is a modality of PW Doppler, so it doesn’t avoid the limitation of the Aliasing effect [5].
Echocardiography has been used since 1953 thanks to the collaborations between Edler and Hertz [6]. Echocardiography is the gold standard for cardiac imaging and diagnostic evaluation. It is very hard to find limitations in such an old and upgraded technology. However, technological imaging evolution is running faster, especially concerning spatial and temporal resolution. From this point of view echocardiography suffers from significant limitations due to the very low framerate and limited image resolution [5]. Some Echo machineries have been developed to overcome those limitations, but the costs make them affordable only to prestigious health care centers. Therefore, the standard cheap echo machinery, with all its limitations, remains the most used. Another echo limitation is the skill-based parameters evaluation, considering the sensibility and difficulty to properly set the probe. This results in different values from the same heart based on the technician’s skill. Finally, during the surgical procedures the only available echo is the TEE that provides useful Left Ventricle information while only providing qualitative information of the Right Ventricle [7]. Moreover, TEE leads to misinterpretations on patient’s prognosis, especially in those with Right Ventricle based pathologies, i.e. most of the congenital heart diseases. In some limited case the TEE can cause ventricular fibrillation after the probe insertion in the esophagus, due to the mechanical stimulation of cardiac structures [8].
Figure 4. Example of Color Flow Mapping. From [3]
19
3D echocardiography is used to overcome the above-mentioned limitations. It offers the possibility of having 3D heart images from any spatial point of view. This is possible thanks to the particular “array” 3D probe (Figure 5) that uses thousands of fully sampled elements for
360-degree focusing and steering. 3D
echocardiography provides information about volumes and functionality of heart chambers [9].
The 3D echo is usable in both TTE and TEE, with two main advantages compared to the conventional 2D echo and M-mode evaluation (Figure 6):
- Quantification of absolute cardiac chambers volumes (LV and RV), and left atrial (LA) volumes and their function [9].
- Visualization of 3D structures and dynamic motion images of the heart, especially of heart valve conformations [9].
M-mode
2D echo
3D echo
Figure 6. Functionality comparison between the linear M-mode evaluation (Left panel), conventional 2D Echo (middle panel) and 3D echo (right panel). Modified from “Basics of Real Time 3D Echocardiography” Erasmus MC University Medical Center of Rotterdam.
Figure 5. Example of 3D echo transducer array functioning. Modified from “Basics of Real Time 3D Echocardiography” Erasmus MC University Medical Center of Rotterdam.
20
These two fundamental advantages could open new prospective on heart structures and functionality. However, 3D echo entails some strong limitations derived from the ultrasound procedures. As for 2D echo, the 3D echo image quality is limited by the acoustic windows. The spatial and temporal resolution of current 3D echo technology are still inferior to the 2D echo.
There are two different 3D data acquisition modes. - The multi-beat acquisitions
- Real-time 3D mode
Multi-beat acquisition allows faster acquisition of a thin section of a 3D pyramidal volume. However, it requires four cardiac cycles and gated capture to reconstruct the 3D image. Therefore, it is prone to stitch artifacts in patients with rhythm disturbance and respiratory motion [10].
Real-time imaging captures the entire heart movement in a single beat overcoming the limitations of multi-beat mode, but suffering deteriorations in spatio-temporal resolution [10].
Because of these limitations, the use of 3D echo remains an uncommon and little widespread practice. This leads to a limited number of 3D echo specialists further reducing its use.
21
1.1.2.
Nuclear Cardiology
Nuclear cardiology is based on the injection of a radioactive dye in the patient’s body. An imaging machine (gamma camera, Figure 7), sensible to radioactive elements, creates pictures of the blood flow. The test is performed in resting and/or exercise state to evaluate possible areas with reduced blood flow or damage [11, 12].
According to the American Society of Nuclear Cardiology, there are several uses for this imaging branch. The most important are:
- Myocardial perfusion scintigraphy (MPS)
- Evaluation of Cardiac Function with Radionuclide Ventriculography (RNV)
- Assessment of Myocardial Injury, Infarction and Infection - Imaging of the Nervous System of the Heart
- Positron Emission Tomography (PET)
Myocardial perfusion scintigraphy is the mainstay of the nuclear cardiology for the coronary artery health evaluation. It is performed by the use of single-photon emission computer tomography (SPECT; Figure 7, right panel, MIBI) evaluated by a gamma camera [12]. This test is usually performed in resting conditions and then
Figure 7. Example of a gamma camera and the results it provides. After the injection of a radioactive dye, a patient is evaluated by a gamma camera (left panel). The data provided from the machinery (right panel) give estimation of cardiac blood flow. Moreover, the right panel shows the differences between two radioactive dyes used in two different techniques the SPECT (top panel) and the PET (bottom panel): F-18 flurpiridaz PET (FLUR) versus Tc-99m MIBI SPECT (MIBI). “Reversible perfusion defect in the anterior and antero-septal wall is readily seen in a patient with left anterior descending coronary artery occlusion using F-18 flurpiridaz PET but the perfusion abnormality is not clearly appreciated using Tc-99m MIBI SPECT.” Modified from [10].
22
during exercise (stress test) to assess differences in cardiac function. In patients with respiratory disorders, the stress test is performed with pharmacological administration such as dipyridamole, adenosine, regadenoson or dobutamine [12, 13]. If there is a blockage in the coronary artery, the blood flow supply will be inefficient to support the exercise. The gamma machinery detects (nowadays automatically) the decrease in the blood flow.
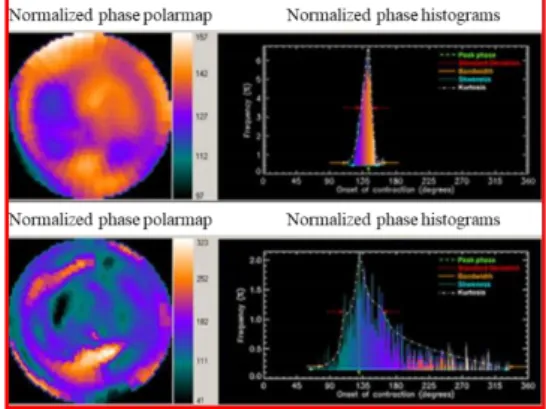
The Evaluation of Cardiac Function with Radionuclide Ventriculography (RNV) is a non-invasive test to assess the pumping function of the heart (Figure 8).
This technique can also provide
information about the function of the valves, the integrity of the cardiac chambers and can be used to monitor the effect of different drugs on the heart muscle. RNV is still one of the gold
standard methods for the measurement of LV ejection fraction (LVEF).
Assessment of Myocardial Injury, Infarction and Infection. Limited blood supply or inflammation can heavily or irreversibly impair cardiac cellular function. Nuclear cardiology techniques can be used to determine which areas of the heart muscle have been damaged by infection or by a stroke (Figure 7, STRESS FLUR, SHORT AXIS, MID).
Imaging of the Nervous System of the Heart. The cardiac nervous system is crucial for its proper functioning. When there is a damage in the heart muscle, the nervous system can be impaired with an abnormal function of the electrical system, possibly leading to Ventricular Tachycardia (VT). An abnormal heart rate and disarray of the normal cardiac rhythm can reveal this abnormality.
Figure 8. Polar maps and histograms from a RNV evaluation. Top panel shows a normal subject; bottom panel shows mechanical cardiac disease (myocardial infarction). Modified from [11]
23
Positron Emission Tomography (PET) was developed to be more precise than SPECT and, nowadays, is used to provide information about either the blood supply to the heart muscle and the metabolic activity of the heart [14]. To date, there are different opinions concerning which technology gives the most reliable and precise data. Accordingly to Dr. Daniel J Bell, lead for radiology 2014-18 at the North Middlesex University Hospital (London), the main differences between SPECT and PET are the following:
PET:
- Very expensive. A PET CT-scanner is around $2 million
- Uses positron-emitting radioisotope as tracer, in detail the fluorine-18 (FDG) (Figure 7, FLUR)
- Better contrast and spatial resolution (Figure 7) SPECT:
- Lower cost. A SPECT scanner gamma camera costs from $400,000 to $600,000
- Uses gamma-emitting radioisotope as tracers; in detail technetium-99m (Figure 7, MIBI), iodine-123, iodine-131
- Less contrast and spatial resolution (Figure 7)
For most of the clinicians, “PET is just a bit better than SPECT” but it costs too much which is the reason why PET still has not replaced SPECT as the Gold standard for the Nuclear Cardiology.
Nuclear Cardiology has been the main nuclear base technique in medicine for several decades. The development of new imaging technologies like CT, as well as MR, has raised the question about the usefulness of Nuclear Cardiology. In the recent guidelines for Nuclear Cardiology [13], the effect of radioactive dyes on patients has been highlighted as well as the pharmacological impact, to mimic the stress test, in subjects with respiratory impairment. Another strong limitation for
24
both SPECT and PET is the poor contrast and spatial resolution. However, the Nuclear Cardiology has accomplished remarkable achievements and, also thanks to the development of novel radiopharmaceuticals, still holds promise as one of the major imaging techniques in medicine.
1.1.3. Cardiac Computed Tomography
Cardiac computed tomography (CT) scan uses x-rays to make detailed pictures of the heart [15]. The picture is created merging different 2D radiographic images (slices) rotating on the same axis to create a full 3D cross-sectional image [15]. There are several types of CT scanners and the basic difference is the number of slices the machinery can reproduce per second (64, 256 or 320). More slices, it means the highest image quality. The 320 slices cost around two and half times the 64 slices ($2.5 million vs $1 million) and whether it is worth it or not, is still a matter of debate in the clinical community.
The routinely use of cardiac CT concerns the evaluation of cardiac or coronary anatomy, to diagnose the coronary artery disease (CAD), to monitor coronary artery bypass surgery and/or implanted coronary stents and finally to calculate chambers volumes and cardiac function (including ejection fraction) [16].
The main analyses performed by the cardiac CT are: - Calcium scoring
- Coronary CT angiography
o Retrospectively ECG-gated cCTA protocols o Prospectively ECG-gated cCTA protocols - Ventricles Function
Calcium scoring. Coronary artery calcium results from the sedimentation of substances over time which have hardened and become calcified. This is well documented in coronary atherosclerosis, where atherosclerotic plaques become calcified in the latest stages of the pathology leading to CAD [17].
25
A calcium score is obtained using a validated algorithm. The algorithm is based on the Agatston score who introduced a useful application to CT scan back in 1990 [16].
The score is calculated using the area and a weighted value related to the density of calcification.
A structure with an area of at least 1 mm2 and a density greater than 130 Hounsfield unit (HU) is considered a
calcified locus. If the locus
corresponds to an anatomical position of a coronary, it represents a calcified
CAD plaque (Figure 9). A score of 1 is assigned for a value of 130–199 HU, a score of 2 for 200–299 HU, 3 for 300–399 HU, and a score of 4 for values of 400 HU and higher. The weighted score is multiplied by the area of the coronary to obtain the Agatston score [16]. Although this technique does not give any hemodynamic information about stenosis, the Agatston score is very useful to calculate the early risk stratification for patients. Patients with a score above 160 have an increased risk for a major adverse cardiac event. Moreover, results from a large Multi-Ethnic Study of Atherosclerosis (MESA) showed that a calcium score twofold higher than normal increased the probability of major coronary events by approximately 25% [18].
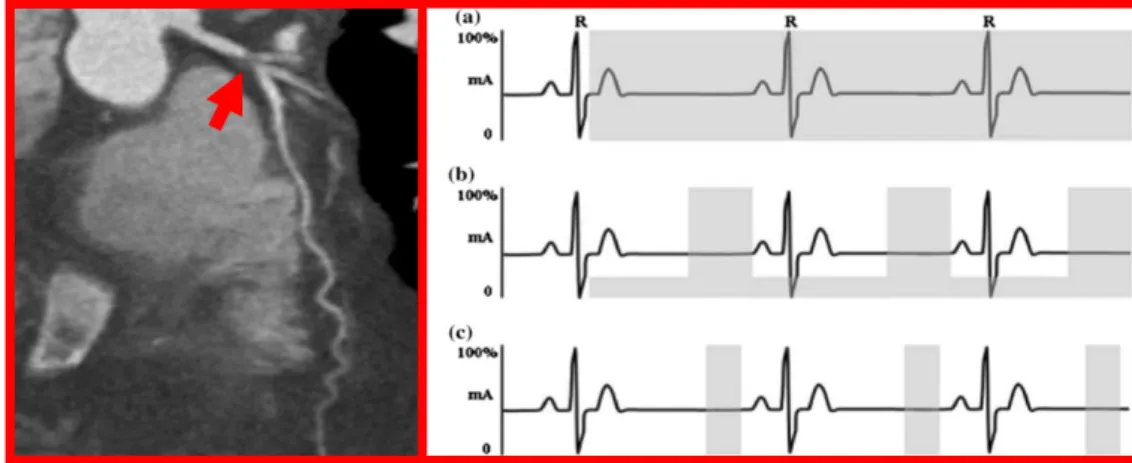
Coronary CT angiography can show coronaries without the risks associated with invasive treatments. It provides information on their anatomy highlighting the possible non- or obstructive CAD and plaque characteristics (Figure 10, left panel). CT angiography is possible due to the injection of a contrast fluid into the bloodstream. When the fluid reaches the anatomical site under examination, a picture is taken. Images are usually acquired based on patient’s electrocardiogram (ECG) phases (Figure 10, right panel).
Figure 9. Coronary calcium within the left anterior descending artery. The calcium is seen as bright white and is highlighted by the red arrow. Modified from [15].
26
Indeed, for most patients, the best moment to acquire images is when the heart is fully relaxed; in the ECG this phase is approximatively at 75% of the R-R interval (the distance between two R peaks) in mid-diastole (Figure 10, right panel, b, c) [16]. Methods of image acquisition can be Retrospective or Prospective.
Retrospective studies use X-Ray beams during the R-R interval with a full dose of radiation (Figure 10, right panel, a). Due to the high level of radiation on the patients, nowadays it is common to use ECG-modulated dosage consisting in basal low dosage increased when the 75% along the R–R cycle is reached (Figure 10, right panel, b). This upgrade provides high-quality images while decreases the amount of radiation emitted [16].
Retrospective studies use a standard spiral CT acquisition. The heart rhythm is detected, and the machinery scans the whole heart during multiple cardiac cycles. Finally, information from different phases of the cardiac cycle is obtained and used as trigger for the radiation emission.
Prospective studies use prediction of R wave timing to the image acquisition and the radiation emission. It allows to have a fixed table without spiral CT and most of all to limit the radiation on the patient only at the 75% of the R-R cycle (Figure 10, right panel, c). The main issue of the prospective study is that it requires a stable heart rate, otherwise image acquisition may not occur at every heartbeat. Consequently, there may be a longer acquisition time and radiation exposure than
Figure 10.Left Panel: Coronary CTA showing a severe proximal left anterior descending artery lesion highlighted by the red arrow. Note the lack of calcium in this lesion. Right panel: Diagram showing ECG (black line) and radiation windows from different methods (gray zones). (a) Full dose radiation retrospective study (b) ECG-modulated dose radiation retrospective study at 75% R-R cycle (c) Prospective imaging during which the radiation exposure occurs only during mid-diastole. Modified from [15].
27
in retrospective studies, making it more sensible to heart rate and breathing artefacts and so less useful [16].
Ventricles Function
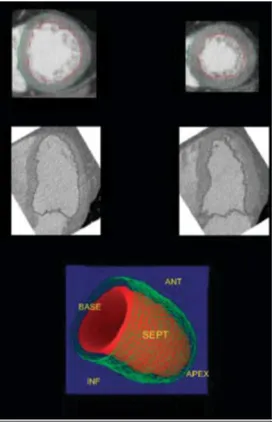
With the advent of the new technological expansion in the last 20 years, a lot of improvements to CT have been made. Dual-source CT scanners allow to acquire in a modality called High-pitch. It permits to have an image just with a single high source of radiation triggered with ECG, in the same way of the prospective study, in less than a second. In combination with reconstruction technique (such MRI or SPECT) it is possible to measure chambers functional parameters such as left and right ventricular end-diastolic and end-systolic volumes, stroke volume, ejection fraction, and myocardial mass during the entire heartbeat [15] (Figure 11).
Even if the CT scan is widely used in clinic, it shows several limitations. The first one is the radiation emission that, even in the prospective studies, where the emission is limited to a short period of time, is correlated with lifetime attributable risk (LAR) of cancer development in both simulation study and patients [19, 20]. As it concerns the machinery accuracy the 64-slices imply 5 to 10 seconds to acquire images leading to possible artefacts and diagnostic positive- negative-false due to the patients’ motion, arrhythmias and breath-hold failure. The introduction of new but extremely expensive 256- 320-slices with faster rotation and short scanning time has improved but not eliminated the tendency for artefacts.
Figure 11. Evaluation of left ventricular function and volume via dual-source CT scanner. By tracing endocardial contours (red line in both top left and right images) of end-systolic and end-diastolic short- and long-axis views, left ventricular volumes and left ventricular ejection fraction can be derived from multidetector row computed tomography reconstruction. Modified from [14].
28
Other limitations with cardiac CT are the use of pharmaceutical drugs for every scanning method like beta-blockers and sublingual nitrate, potential allergic reactions to the injected contrast fluid as well as its renal toxicity and finally poor contrast filling of distal vessels that could lead to diagnostic uncertainty [15].
29
1.1.4.
Magnetic Resonance
Magnetic resonance imaging (MRI) is a scanning technique able to provide detailed images of the inner body structures. The technology is based on a strong magnetic field and radio waves to generate images. The human body is roughly composed for 70% of water which contains hydrogen nuclei (protons) that become aligned in a magnetic field. An MRI scanner applies a strong magnetic field (usually 1.5 Tesla), which aligns the proton "spins".This alignment (or magnetization) is next perturbed by the application of an external Radio Frequency (RF) energy. The protons absorb the energy from the magnetic field and flip their spins. When the field is turned off, the protons gradually return to their normal spin (relaxation process) producing a radio signal that can be measured by receivers in the scanner and converted into an image [21].
The MRI in the cardiac field (named CMR) is used for assessing infarcted regions and their relative late wall thinning, LV volumes, distortion of LV shape and compensatory hypertrophy of non-infarcted myocardium [22]. MRI is also used for ischemic/non-ischemic heart diseases, as well as heart failure and congenital heart disease [23, 24].
Tissues can be characterized by two different relaxation times, T1 and T2.
- T1 (longitudinal relaxation time) is the time constant which determines the rate at which excited protons return to equilibrium. It is a measure of the time taken for spinning protons to realign with the external magnetic field. - T2 (transverse relaxation time) is the time constant which determines the
rate at which excited protons reach equilibrium or go out of phase with each other [25].
The most used modality for CMR is the pulse mode or pulse sequence.
A pulse sequence is a series of RF pulses to produce MRI signals. Different types of pulses generate different image contrasts due to different T1 or T2 values. The two major pulses sequences are:
- Spin-Echo (SE) sequence
30
Spin-Echo sequence. In this modality, a 90° RF is firstly applied to rotate the magnetization. When the proton relaxation starts, another 180° RF or a series of 180° RF impulses are applied to refocus the decaying transverse magnetization and produce a signal, called spin echo.
The most important parameters in the SE are echo time (TE) and repetition time (TR); TE is the time from the application of the 90° RF pulse to the formation of the spin echo, and TR is the time from the 90° RF pulse to the next 90° RF pulse. Those parameters are useful because:
- short TR and short TE produce T1-weighted contrast - long TR and long TE produce T2-weighted contrast
- long TR and short TE produce proton-density-weighted contrast.
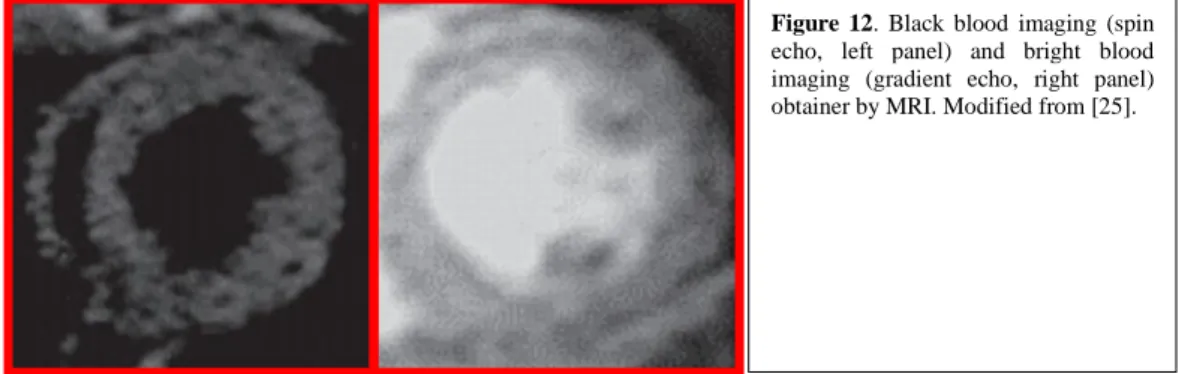
Spin echo-sequence requires time to acquire an image, resulting in a blur effect when fitting one beat in one image, thus requiring to merge different images to obtain an entire beat. It is used primarily for the Dark Blood imaging (Figure 12, left panel) to evaluate LV chamber [21, 26].
Gradient-Echo (GRE) sequence uses a weaker RF pulse, compared to that of SE, to move the magnetization by a small angle and refocus the decaying transverse magnetization through a bipolar magnetic gradient. The echo signal produced by the GRE sequence is called the gradient echo or field echo. These modifications allow TR in the GRE sequence to be as short as tens of milliseconds or less in the upgraded machinery.
It is used primarily for Bright Blood imaging (Figure 12, right panel) to evaluate global and segmental LV function. It has been used for measurements of LV mass, myocardial perfusion, blood flow and coronary anatomy [21, 26].
Figure 12. Black blood imaging (spin echo, left panel) and bright blood imaging (gradient echo, right panel) obtainer by MRI. Modified from [25].
31
Cine MRI modality is made to capture a sequence of images in motion of the cardiac cycle, displaying the cardiac motion in a cine loop way. Differences between the myocardium and blood allow visualizing changes in the cardiac chambers and ventricular walls. Thus, it allows an easy quantification of the ventricular function and local wall motion and provides important information about the cardiac function. Accurate quantification of the RV is important for congenital heart disease, such as Tetralogy of Fallot, transposition of great arteries and arrhythmogenic RV dysplasia. [21]
Perfusion MRI (Late gadolinium enhancement MRI; LGE-MRI). As stated before, the human body is roughly composed for 70% of water and this is the focal basis of the MRI functioning. For this reason, the best choice for a contrast agent is a water-soluble one. Gadolinium (Gd) is a water-soluble chelated agent that lies in the intravascular space and permeates the interstitial space of tissues except for the brain (due to the blood brain barrier). Therefore, with Gd injection it is possible to assess the myocardium state. A healthy tissue will display different Gd concentration curves compared to a pathological one due to the different kinetics. Moreover, pathological myocardium has larger interstitial space, compared to the healthy one, due to the loss of intact myocardium in infracted/scarred hearts. Since the Gd is a contrast agent that predominantly shortens the longitudinal relaxation time (T1) of the proton spins, abnormal myocardium with increased Gd concentration will show signal enhancement on MRI images (hyperenhancement) (Figure 13) [21, 26].
Ischemic scar Acute Myocarditis
Figure 13. Different hyperenhancement patterns in different pathologies. Left panel: ischemic cardiomyopathy. Right panel Acute Myocarditis. Red arrows: hyper enhanced regions. Modified from [20].
32
Myocardial T1 mapping. LGE-MRI alone is not efficient to evaluate fibrosis because the signal intensity of the affected myocardium is not enhanced. Therefore, the quantification of T1 relaxation time is used to provide information about fibrosis. The modified Look-Locker inversion recovery (MOLLI) sequence is a novel pulse sequence that allows T1 quantification of the myocardium [26]. Using the Gd injection as contrast agent, T1 of healthy and pathological myocardium shows different behaviors, with normal myocardium displaying high T1 compared to the pathological one or LV cavity [27]. T1 values similar or lower than the LV cavity blood are used as index of abnormal Gd accumulation in the myocardium due to a higher level of fibrosis.
The main limitation of T1 mapping lies in the results highly dose dependent. Therefore, clinicians need to standardize the optimal dose, especially in patients with impaired kidney or chronic renal diseases [26]. Another important limitation consist in the lack of standard physiological values approved by the scientific community.
Myocardial T2 mapping. T2 relaxation time evaluation is used to reconstruct a parametric image. As stated before, the accumulation of water in the myocardium is associated with pathology. Studying the T2 relaxation time could be useful to identify myocardial regions with water accumulation or edema, specific characteristics of Acute Myocardial Infractions (AMI). This is important to identify salvageable myocardial tissue that is highly associated with short- and long-term survival after AMI [21, 26].
MRI has introduced a very important upgrade in the cardiac imaging field especially for its safety avoiding radiations and contrast agents with adverse reactions. However, MRI machineries are very expensive and it takes long time to perform a proper investigation. Furthermore, the lack of standard examination protocols limits the possible comparisons in different studies to set proper clinical guidelines [21].
33
1.2. Video Kinematic Evaluation (Vi.Ki.E.)
1.2.1. Introduction
The cardiac imaging field has grown faster in the last three decades reaching a very accurate diagnostic and prognostic capability. However, even if there is a fully comprehension in both diagnosis and prognosis, there is still a big gap in the intraoperative evaluation of cardiac parameters. As well as the patients lie down unconscious on the surgical table, the cardiac evaluation during surgery is suspended. None can evaluate intraoperative cardiac parameter in surgery that requires aortic clamping with the consequent cessation of the heart beats. However, all the normothermic surgeries performed at beating heart, as well as heart transplantation or LVAD implantations, impacts immediately and strongly on heart.
Will these heavy and invasive procedures have an impact directly on the heart functionality? Will the cardiac modifications (patches, VAD, transplanted heart) lead to the future development of pathological situations?
Is it really necessary to preventively operate young patients or it would be better to postpone the surgery by waiting the pathology progression?
To date there are no answers and many clinical trials are trying to figure out which parameters should be used as diagnostic/prognostic markers, like a sort of “Holy grail” rush.
Video Kinematic Evaluation has been developed to provide a novel point of view trying to answer some of the above questions.
34
1.2.2. Vi.Ki.E. functioning
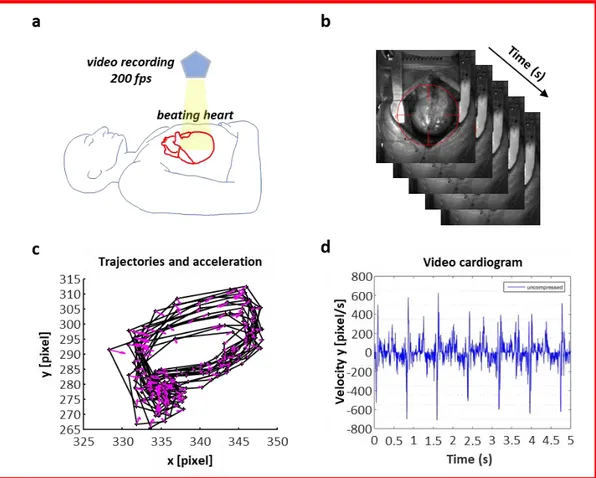
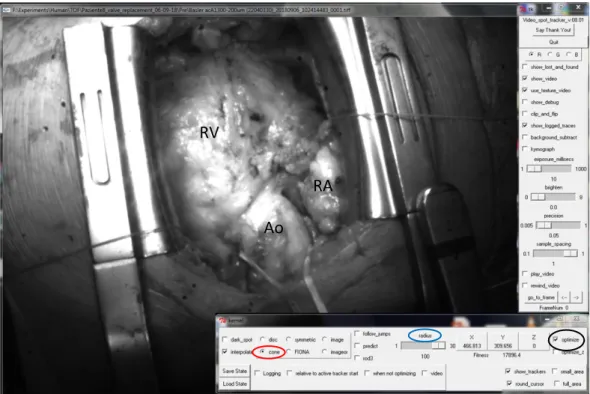
Vi.Ki.E. technology is as simple as innovative. It only consists of a high-speed camera (from 200 fps in humans, up to 1700 fps in animals) positioned above the open chest (Figure 14, a) recording cardiac cycles after the pericardial suspension. A virtual tracking allows to follow the epicardial movement of the heart in the recorded video (Figure 14, b), providing its trajectories (Figure 14, c) and Video Cardiograms (ViCGs) (Figure 14, d). Furthermore, a custom-made algorithm evaluates trajectories and ViCGs, converting them into kinematic parameters, based on Hamiltonian mechanics (Table 1). All the parameters are shown in real-time to surgeons in the operating room, providing data about mechanical performance progression of the heart [28, 29].
Figure 14. Workflow with video camera positioning, video recording, evaluation of the systolic and diastolic phases and Vi.Ki.E. parameters. (a) Schematic representation of the camera positioned using an extensible tripod on top of the open chest. (b) Sequence of video frames captured at 200 fps from a human beating heart with the video marker (red circle) ‘anchored’ to the cardiac tissue while moving in x-y directions. (c) Counterclockwise trajectories of contraction (left to right) and relaxation (right to left) for every cardiac cycle with related acceleration vectors (pink arrows). (d) Video cardiogram (ViCG) showing the velocity of a selected video marker with contraction/relaxation peaks and peak-to-peak intervals.
35
1.2.3. Camera speed selection
The camera speed selection is crucial. In this work, two different cameras have been used. A 200 fps camera for the operating room, and a fast 500 to 1000 fps camera for the experimental animals [30]. The selection of a slower camera for patients’ evaluation and a faster one for the experimental animals is due to two main aspects: - In the operating room, the spaces are limited, thus the necessity to use a small camera, working with a USB 3.0 linked to a laptop. Furthermore, the human heart counts approximately 75 beats/minute, usually lowered by anesthesia (around 1 beat per second). Therefore, 200 frames in one second lead to a very high accuracy sampling (1 image every 5ms) that is extremely accurate to study human phenomena like mechanical ventricular systole (300-400ms) and diastole (400-500ms).
- In the laboratory, there is almost no space limitation, thus, the possibility to use a 500 to 1000 fps camera which requires a very complex and bulky series of equipment connections to properly work. Furthermore, the rat heart, under anesthesia, has in average 240 beats/minute, approximately 1 beat every 250ms. Therefore, the sampling is 1 image each ms (1000 fps) or 1 every 2ms (500 fps), that are both accurate to record mechanical ventricular systole (80-90ms) and diastole (140-150ms).
Parameter name Formula Physiological meaning
Displacement [pixel] U=dx
Marker displacement between 2 consecutive video frames: it estimates the instantaneous movement of the cardiac tissue and builds the marker trajectory.
Velocity [pixel/s] v=dx/dt
Marker velocity between 2 consecutive video frames: it estimates the instantaneous motility or contractility of the cardiac tissue and builds the marker trajectory.
Kinetic energy [pixel2/s2] E=½v2
Marker kinetic energy between 2 consecutive video frames: it estimates the consumption of ATP to generate the cardiac movement.
Frequency [Hz] f=beat number/video duration Contraction frequency calculated from the cardiac beats identified.
Acceleration [pixel/s2] a=dv/dt
Marker acceleration between 2 consecutive video frames: it estimates the instantaneous variation of the motility of the cardiac tissue and builds the marker trajectory.
Force [N] F=ma Cardiac force moving the mass m.
Table 1. Table displaying kinematic and dynamic parameters calculated with their physiological meaning. According to classical and Hamiltonian mechanics, x(t) is the position vector (pixel) in the coordinate system (x, y) of an orthonormal Euclidean space, where t is the time (s).
36
In the first Vi.Ki.E. publication [28], it was highlighted, in a rat model, the effect of different frame rates on trajectories, and consequently on data, as shown in Figure 15.
Figure 15. Marker’s trajectories and the related velocity vectors obtained at different acquisition rates. The rate of 500 fps (a) gave the best trajectory details, the rates of 250 (b), 125 (c), 100 (d), and 50 (e) could be considered acceptable, whereas the other lower rates (≤25 fps in f) were significantly affected by the aliasing phenomenon with loss of trajectory details.
37
1.2.4. Trajectories and Video cardiograms: a qualitative point of
view
The cardiac tracking software provides a .csv file that, after its conversion in .txt format, is ready to be open by the custom-made algorithm in MATLAB (The MathWorks, Inc., Natick, MA, USA).
Trajectories and ViCGs are, respectively, the main information on cardiac cycle and marker movement and all the Vi.Ki.E. parameters are calculated from them. The visualization of both Trajectories and ViCGs, however, is mainly qualitative. Indeed, Trajectories provides information about cardiac cycles as shown in Figure 16. The cardiac cycles overlapping denotes a conserved mechanic of the beats (Figure 16, B, top panel). On the contrary, a spread trajectory denotes an impaired cardiac mechanics (Figure 16, A, top panel). Furthermore, trajectories provide information on systolic and diastolic phase, but they differ according to the position of the camera upon the heart (Human: left to right systole, Figure 14, c; Animals: left to right diastole, [30])
Video cardiograms provide information about Marker velocities and/or acceleration, and their visualization can be used for qualitative speculation. As shown in Figure 16, A, middle and bottom panel, it is challenging for a beginner, and some time even for experts, to distinguish beats from spikes or noise signals, denoting an impaired cardiac mechanics. The opposite occurs in B, middle and bottom panels of the same figure, where the peaks are clear, with a constant distance between them, denoting a good mechanical behavior.
Even if these parameters can help the operators to have a global idea on mechanical heart behavior, they cannot assess the cardiac function. In several cases, as LVAD implantation, trajectories are strongly impaired by the implantation, limiting the cardiac movement, and resulting in useless data.
38
Figure 16. Visualization of epicardial marker trajectories in a patient before surgery (column A) and after surgery (column B) and their related video cardiograms. Top panels: trajectories. Middle panels: video cardiograms on X axis. Bottom panels: video cardiograms on Y axis. To note trajectories in B are more conserved, even if shifted, compared to A where they are randomized. The same observation can be made for the repetitive patterns of video cardiograms in B column compared to A column.
39
1.2.5. Mechanical parameters explanation and physiological
meaning
The quantitative measures of the video kinematic evaluation are based on the Hamiltonian mechanics, thus based on the Kinetic Energy.Briefly, the Newtonian equation of motion (F=m*a) can be easily obtained not from the acceleration (which is easy to understand, but challenging to apply), but from the gradient of the total energy of the mechanical system. The total energy, also called “Hamiltonian function” is the sum of the kinetic and potential energies. In the Vi.Ki.E. specific case the potential energy of the heart system is supposed to be uniform in space since the concentration of ATP inside the tissue is uniform [31]. Therefore the mechanical force F is just the gradient (first derivate) of the kinetic energy.
The Vi.Ki.E. algorithm, uses those formulas to obtain precise values starting from trajectories and Video Cardiograms, in other words, from the marker position and its velocity and acceleration in each frame.
As stated in Table 1 the main parameters are:
- Displacement (pixel); the instantaneous movement of the cardiac tissue in x and y directions; it builds the temporal-spatial trajectory.
- Velocity (pixel/s); the instantaneous motility or contractility of the cardiac tissue; it builds the temporal-spatial trajectory.
- Kinetic Energy (pixel2/s2); an estimation of the consumption of ATP for the generation of cardiac movement.
- Frequency (Hz); contraction frequency calculated from the identified cardiac beats.
- Acceleration (pixel/s2); the instantaneous variation of the cardiac tissue motility; it builds the temporal-spatial trajectory.
- Force (N); cardiac force moving a mass [28].
The most relevant parameters for both clinical and experimental fields are the Energy and the Force.
40
The Energy, as stated in before, is an estimation of the ATP consumption [31]. This is very important because it can be used as a prognostic marker.
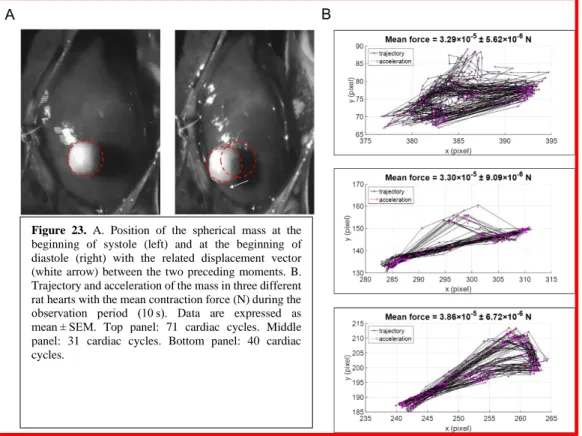
Force is expressed in Newton, and it implicates a “mass” and an “acceleration” (F=m*a). In the next chapter, it will be explained in detail how the force was validated, but briefly, a note mass was attached on the epicardium and followed with the video Marker.
In human surgery, it is not impossible to attach some mass onto the epicardium, especially for a whole ventricle evaluation. For this reason, the light is used as the “mass” to follow with video Marker, assuming that the weight of the light is unitary. Therefore, the Force is equal to the acceleration.
In the clinical bench, the Force is not the real heart force of contraction because, as stated, we do not consider the real mass of the heart. However, Force parameter provides an evaluation of Cardiac Fatigue that can be very useful as a clinical marker.
41
1.3. Particle Image Velocimetry (PIV)
In this work, a modified version of the well-known Particle Image Velocimetry (PIV) tool was adopted, in some cases, to further investigate the epicardial deformation of the heart. This software is used in literature to evaluate the motion of liquids “particle by particle” [32]. Adapting the software to the cardiac surface, as it would be a fluid, is useful to obtain interesting data about the epicardial velocity and the rotation frequency of its vectors that estimates the epicardial torsion as shown in Figure 17.
Figure 17. PIV visualization of epicardial torsion. Six different frames from a video evaluation made by PIV (From A to F). Red arrows: velocity vectors. Blu Graph: visualization of the mean velocity for each frame visualized by the red dashed line.
To note the rotational behavior of the Velocity vectors through the frames. This provide an estimation of epicardial torsion.
42
1.4. The Vi.Ki.E. competitive advantage
In this chapter a summary of all the pros and cons of the technologies explained above will be presented, and it will be displayed which competitive advantage the Vi.Ki.E. approach can contribute to the cardiac imaging theater.
Echography
- Transthoracic Echocardiography: o Pros: Non-invasive
Gold standard for the diagnostic evaluation
Detects four-chambers anatomy and function in addition to wall thickness and cavitary sizes
Provides information about blood flow o Cons: Not possible to use during cardiac surgery
Highly skill dependent
Requires time to obtain diagnostic data Low image spatial and temporal resolution
- Transesophageal Echocardiography:
o Pros: Gold standard for the cardiac evaluation during surgery Optimal LV evaluation (anatomy, function, wall thickness,
cavitary sizes)
Provides information about blood flow o Cons: Invasive
Risk of adverse events (ventricular fibrillation)
Does not evaluate the RV (provides only qualitative information)
Highly skill dependent
Requires time to obtain diagnostic data Low image spatial and temporal resolution
43
Nuclear Cardiology
- Pros: Gold standard for the artery health evaluation (SPECT-MPS) and provides information about both the blood supply to the heart muscle and the metabolic activity of the heart (PET)
Detects chambers anatomy, valve function, and ventricles pumping function with RNV
Assessment of Myocardial Injury, Infarction and Infection Imaging of the Nervous System of the Heart
- Cons: Side effects due to the radioactive dye injected Limited use since the advent of CT and MRI Low image spatial and temporal resolution
Cardiac Computer Tomography
- Pros: Calcium sedimentation in the coronaries (Calcium scoring) Coronaries blood flow evaluation (Coronary CT angiography) Provides chambers functional parameters (High-pitch CT scan) - Cons: Radiation emission correlated with LAR of cancer development
Side effects correlated to the drugs introduced to perform a proper CT evaluation (i.e. sublingual nitrate, beta blockers)
Takes time to grab images resulting in artifacts especially in patients with arrhythmias and/or respiratory impairments (even in the new 360-slices models)
Very expensive machineries
Magnetic Resonance
- Pros: Optimal chambers evaluation (anatomy, function, wall thickness, cavitary sizes)
Provides information about blood flow and coronary anatomy Assesses the pathological state of the heart with a contrast agent (hyperenhancement)
Evaluates the fibrosis (T1 mapping MOLLI) and the AMI (T2 mapping)
44
- Cons: Takes long time to perform a proper evaluation
No T1 mapping standard examination protocols (T1 mapping results are dose dependent) and Lack of standard physiological values Very expensive machineries
Video Kinematic Evaluation - Pros: Non-invasive
Innovative approach based on epicardial motion, and consequent novel set of useful clinical data, highlighting unexplored aspects of the cardiac function
Fast evaluation
Algorithm-based evaluation (no technical skill required, high data reproducibility)
Quantitative RV evaluation
Translational technology, with low costs in each field (cellular, basic research, clinic)
High spatial and temporal resolution (up to 1000fps) - Cons: Only applicable during open chest surgeries
Lack of standard physiological values Limited number of cases evaluated Only RV evaluation in human
The medical technological evolution always carries innovative, less invasive, and cheaper approaches, leading to a constant amelioration of patients’ outcome and recovery. However, most of the times, the innovative approaches are barely comparable with the old technologies, and, when possible, only some aspects of the novel techniques can be comparable. Video Kinematic Evaluation suffers this complication. In fact, as stated before, the main limitation in all the current technologies in the heart imaging field is the spatial and temporal resolution. Vi.Ki.E has been developed to overcome this gap. The high speed cameras adopted allow to precisely evaluate every physiological aspect of the cardiac beat (i.e. the systolic/diastolic phase only, the atrial kick, the ventricular distension) without
45
artifacts and/or technician’s interpretations. Moreover the epicardial kinematic approach is unique in the cardiac field and cannot be compared with any of the other current techniques, except in some cases where a simple data linear regression can be performed.
In the Vi.Ki.E. contest the most comparable technique is the TEE, since they are both intra-surgical approaches. The coupling of Vi.Ki.E. with TEE can provide a “360 degrees” heart evaluation, optimal in the surgeries implying both ventricles as LVAD implantation.
46
2. METHODS
2.1. Instrumentation
The setup adopted in this work is approximately the same for both clinical and basic research approaches, with some small differences, as cited above, due to the different heart size and rate between patients and experimental animals.
Vi.Ki.E. Clinical instrumentation.
- Extensible tripod holding the camera on top of the patient’s chest.
- Low-speed camera: full HD (1920×1080 total pixel area) camera Samsung S10 (with an internal SD memory of 256 MB and internal rechargeable battery)
- High-speed camera Basler acA1300-200um USB 3.0 with the ON Semiconductor PYTHON 1300 CMOS sensor, (1280x1024, Ahrensburg, Germany)
- Edmund Optics 6mm compact fixed focal length lens (Barrington, NJ, USA)
- High-performance PC Intel core i7-6700HQ 2.6GHz, 16GB DDR4 2133MHz SDRAM, 1TB HDD 7200 RPM With 128GB SSD PCIE ×4 - Acquisition software: Pylon 5 Camera Software Suite 5.0.5 for Microsoft
Windows (Ahrensburg, Germany).
Vi.Ki.E. Experimental instrumentation.
- Low-speed camera: full HD (1920×1080 total pixel area) camera Samsung S10 (with an internal SD memory of 256 MB and internal rechargeable battery)
- High-speed camera Baumer HXC13 (Baumer Italia, S.r.l. , Milano, IT) camera with full CameraLink® interface (1280×1024 total pixel area for 500 fps or 1020×600 for 1000 fps)
- Macro objective Kowa Industrial Lenses LM35XC, F = 1:2.0, f = 35 mm, picture size 13.8-18.4 mm (RMA Electronics, Hingham, MA, USA).