New frontiers of Forest Fire Protection : A portable Laser System
(FfED).
P.GAUDIO
A, M. GELFUSA
A, A.MALIZIA
A, M. RICHETTA
A, C.SERAFINI
A, P. VENTURA
A,
C.BELLECCI
A,B,L.DE LEO
B, T.LO FEUDO
B, A. MURARI
CA
Department of Industrial Engineering, University of Rome “Tor Vergata”, 00133, Rome, ITALY
B
CRATI s.c.r.l., c/o University of Calabria, 87036, Rende (CS), ITALY
C
Consorzio RFX-Associazione EURATOM ENEA per la Fusione, I-35127 Padova, ITALY
Corresponding author :
[email protected]
ABSTRACT
Forest fires are one of the worst events that can cause environmental and economic damage. It is impossible to predict the moment in which these events can happen because they can be the consequence of particular environmental conditions or of a voluntary criminal act. As a consequence it is necessary to work on a solution that allows surveying automatically the territory. The portable LIDAR system that the Quantum Electronics and Plasma Physics group has developed in collaboration with CRATI s.c.r.l. deals with these needs. The system, called FfED (Forest fire Early Detection system,) is presented in this paper together with the numerical and experimental results (in cell and in field), a discussion about their comparison and the possible future improvements.
Key-Words : LIDAR, Environment, Forest Fires, Early Detection, Portable system, Numerical simulation,
COMSOL Multhiphysics
1. INTRODUCTION
The LIDAR technique is a quite powerful experimental method for the exploration of the atmosphere [1]. It is often used to acquire the information necessary to investigate various phenomena and to validate models relevant to different topics of atmospheric physics. Furthermore it can also be used in environmental surveys for monitoring particulate and gases.[1,2] Theoretical investigations by Andreucci and Arbolino [3, 4], experiments by Lavrov and Vilar [5], Pershin et al. [6] and Utkin at al. [7-9] have shown that LIDAR is a powerful technique to detect the tenuous smoke plumes produced by forest fires at an early stage.
In our previous works [10-12], the potential of the LIDAR/DIAL technique to detect forest fires, evaluating the increment of the particulate matter and/or the water vapor concentration in atmosphere, has been investigated numerically and with laboratory tests . In this paper the first results of extensive experimental campaigns ( in field and in cell) and numerical simulations results are reported. They demonstrate the capability of the
developed portable and automatic system to detect the smoke plumes of even small amounts of combusted material equal to 1kg. Using a laser energy of 360 mJ, consistently with present safety regulations, the maximum range of operation is 1.16*10-7 J cm-2.
Numerical simulations have been developed, by the mean of COMSOL Multhiphysics software, to analyse the behaviour of several vegetable substances during combustion process. At the same time measurements in cell with an uniform and controlled environment have been performed. The numerical output compared with the experimental ones has demonstrated the capability of FfED to detect a small forest fire. Since the presented LIDAR system has been designed to operate in complex orography, particular attention has been devoted to the reduction of false alarms, one of the main issues for the extensive applications of this early detection technique. The main upgrade of the technique has been implemented to increase the immunity to false alarms. It consists in the discrimination of other types of smokes, which are
not due to forest fires and therefore should not trigger any alarm (including the orographic peaks) With regard to the structure of the paper, in section 2 a description of the mobile LIDAR system, its principal characteristics and the main design choices are given. The results of numerical simulation are shown in section 3 and the results of the first experimental campaigns are described in section 4 and the conclusions and future developments are drawn in the section 5.
2
THE
AUTOMATIC
PORTABLE LIDAR SYSTEM
2.1
Overview of the system
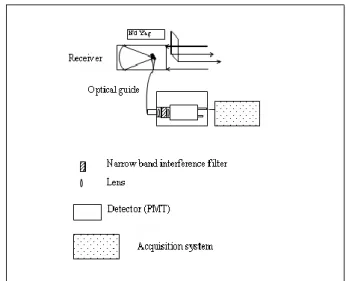
The LIDAR system, whose results are presented in this paper, consists of an optical apparatus of transmission/reception assembled in biaxial configuration. The unit is constituted of a transmitter system based on a compact Q-switched Nd:YAG laser source operating at three wavelengths: 1064 nm, 532 nm and 355 nm. The backscattered signal is collected by a Newtonian Telescope and then transferred by an optical guide to a photomultiplier tube (PMT). The signal acquisition is performed by a LeCroy digital oscilloscope communicating with the computer where the data are stored. A schematic of the set-up is reported in Figure 1 and the basic specifications of the main system’s components are summarized in Table 1.
Transmitter:
Laser Q-switch Nd:Yag
Energy pulse at 1064 nm 360 mJ Pulse time width 5 ns Divergence angle 0,5 mrad Pulse Frequency 10 Hz
Receiver:
Telescope type Newtonian Nominal focal length 1030 mm Primary mirror diameter 210 mm
Detector Photomultiplier
(PMT) Photocathode sensibility 72 mA/W
Response time 30 ns
Table 1. Specifications of our LIDAR system
In order to guarantee eye-safety conditions, the laser beam output has been reduced so as to respect the standard maximum permissible exposure(ANSI Z136.1-1986),which is equal to 1.16*10-7 J cm-2. The system can be operate remotely by means of a
labview routine .The whole system is assembled in a small van that occupies a volume of 3,5 m3 to permit an easy transportation to the required monitoring locations.
Fig. 1 Schematic of the Mobile LIDAR system The hardware and software components of system are placed inside a van hauled to a car to reach impervious location sited, for example, on the mountains.
The LIDAR system is placed on a support and it is possible to move it with two step-motors whose permit a movement on a horizontal plane (from 0° to 360°) and on a vertical plane (from -10° to 90°C) with a resolution of 1,25°.
The system can be managed in remote by a software in labview that allows to :
open and close the windows of the van in 20 second to avoid, in case of impervious meteorological conditions, the damage of hardware and software components;
test the laser functions to control if the laser works in the single shot mode and continuum shot mode and to line up the system;
test the motors functions.
In the experiments it is necessary to adapt the system to the several situation and places. At the beginning of experiments, in the point in which the van with the system is placed, is necessary to measure the geographical coordination with a GPS (Global Positioning System) system. To consider the point of measurement at the beginning of experiment is possible plan, by the software, the follow parameters :
the north;
the position of laser in comparison to the horizontal plane.
Another important input parameter that we can set by the software is the acquisition number (in our experiments fixed at 100) .
The system is placed (by an automatic control on the motor movements obtained by the encoders) on several positions, in correspondence to the coordinates elaborated by the software, and it starts to shot in continuum mode since to reach the number of acquisition set at the beginning of experiment. In case of alarm the system is automatically placed on the suspected position and it starts to shot again to validate or deny the alarm. In case of fire alarm confirmation the coordinates of fire are automatically send, by the software, to a environmental protection organization.
In conclusion the system output are:
a complete control of the selected area;
an advertise of dangerous (in case of fire) and the geographical coordinate of fire;
a data storage of the all experiments for each position mapped by the system.
2.2
The optical design
Since one of the main difficulty of LIDAR system for atmospheric surveying is the low signal to noise ratio, the collection optics has to be treated with particular attention. In order to optimise the focalisation of the backscattered signals on the photomultiplier tube, an optical system (composed of two lenses and a narrow band interferential filter) has been designed with the ZEMAX software package with the aim to simulate the optical characteristics of the entire optical system. The expected backscattered radiation at 1064 nm, transferred by the telescope and optical system on the photomultiplier tube area, has been calculated as described in the following .
The energy focalized on the photomultiplier tube is given by the product of four terms:
accepted accepted nm gated dispersion guide filter accepted so cathode E E E E 1064 1064 1064 1064 , 1064 37 . 0 ) 1 ( ) 1 ( where: E1064,cathode is the energy which arrives at the PMT cathode at 1064nm;
E1064,accepted is the energy collected by the telescope;
ξso(λ) represents the spectral transmission factor of the receiver system;
ξfilter =0.73% is the narrow band filter energy transmission at 1064 nm;
ξguide =60% is the optical guide energy transmission at 1064nm;
ξdispersion =11% is the energy fraction subjected to dispersion of the liquid light-guide;
ξgated =96% is the backscattered energy quantity focused into the PMT effective surface of 78.5 mm2
The overlapping factor for a biaxial LIDAR system has been considered to analyse possible radiation losses due to an inadequate overlap between the area of the laser illumination and the receiver-optics field of view at the target area. A poor overlap leads to a weak backscattered signal irrespective of the size of the telescope or the power of the laser.
The radius of the receiver-optics field of view rT(R) and the radius of the laser pulse in the target plane
W(R) are given by [2]: (2) ) 3 ( where:
r0 represents the effective radius of the primary mirror telescope;
W0 is the laser output at beam waist;
θ is the laser half divergence angle;
ϕ is the receiver-optics half opening angle dependent on the focal distance (f ) and on the light-guide radius (rD) by the relation:
ϕ= rD /f .
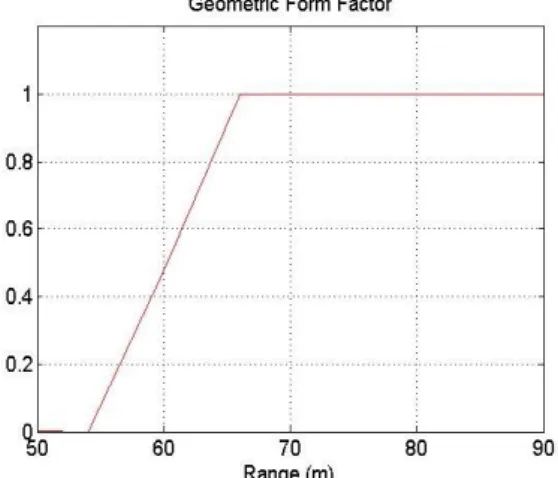
The overlap probability along the measurement’s range is called: Geometrical Form Factor ξ(R) and can be expressed in the form [1]:
R W R d R W R r R T 2 ; ; (4) where: d R indicates the separation of the
telescope and laser axes in the target plane;
represents the area overlap function.
R r R rT 0
2 2 2
12 0 R W R W The variation of the overlap factor ξ(R) over the range of interest for our LIDAR system has been estimated
Fig.2 Behavior of FfED system Geometric
Form Factor in function of the range in meters.
Fig.3 Behavior of FfED system Geometric
Form Factor in function of the range in meters.
As shown in Figures 2 and 3, when the laser and the telescope axes are approximately parallel, the geometrical probability factor increases in a very short range and saturates to unity up to large distances (superior to 2500 metres); this is due to the fact that the effective radius of the primary mirror telescope (r0=105 mm) is about a factor of 2 larger than the laser output aperture (Wo=2.5mm). Therefore the signal intensity is zero only at short distances when there is not overlap between the receiver-optics field of view and the laser illumination area. At distances superior to 67 metres the backscattered signal value is independent from the Geometric Form factor and is equal to one.
3
SIMULATIONS
3.1 Simulation of smoke within a cell
A mathematical model to know the behaviour of several substances (that presents characteristics similar to those expected to be in the forest) during the combustion process in a measurement cell has been developed. The use of the measurement cell has been necessary to create an uniform and controlled environment where the smoke diffusion process is not influenced by weather conditions. The cell has a length of 8.6 meters and a diameter of 0,6 meter. A hole with a pipe in the bottom of the cell has been added in order to allow the smoke inlet (Figure 4).
Fig.4 Cell
Numerical simulations have been developed by the mean of the software Comsol Multiphysics that uses the finite elements method to solve differential equation systems.
The starting equation is : q u R q c t q da ) ( (5) Where:
q : represents the smoke concentration;
c : represents the diffusion coefficient ;
R : velocity of reaction ;
u : velocity vector
Given the geometrical data, an initial finite element mesh is automatically generated by triangulation of the domain. This mesh is used for the discretization of the partial differential equations and can be modified to improve accuracy. To grant the computation independence from the grid spacing, integration over the defined domain has been performed using several grids with different numbers of elements (Figure 5).
Fig. 5. Cell triangular mesh.
The set up boundary conditions are of two types (see table 2 ad figure 6):
insulation/symmetry,
concentration.
The evaluation of the feasibility and the performance of our lidar has been performed using a smoke diffusive model [14-15], that considers a large number of variables and parameters concerning the combustion process, vegetation typology, orography and climate. A simplified model has been implemented to obtain realistic results keeping the computational effort as low as possible. This model includes those aspects that are explicitly correlated to the optical properties of smoke plume.
Table 2 Parameters of the simulation.
Fig. 6 Boundary conditions.
Fig. 7. Smoke distribution in the cell.
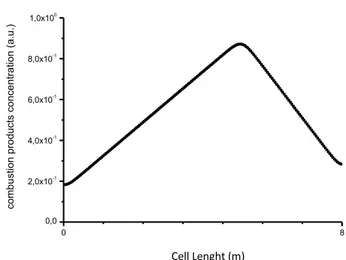
It is evident in Fig. 7 that the smoke propagates from the funnel entrance towards the two extremities of cell and that the quantity of smoke is greater over the funnel. This result allows us to conclude that smoke backscattering coefficient has nearly a bell shape with its peak over the entrance of the smoke. Figure 8 shows the combustion product distribution along the cell symmetry axis (center-line).
Fig.8 Simulation of combustion products behavior
along the cell’s central axis
3.2 Simulation of smoke in the atmosphere
For obtaining information about the smoke behavior in the atmosphere, we have performed a simulation for this case, considering the equation 1 as basis, and the same previous considerations about the mesh. It is assumed that the smoke volume, produced by the source, its chemical composition and its temperature are not time-dependent. Moreover, the smoke is considered
Boundary condition Segments
Concentration q0 = 1 ... 10 Concentration q0 = 0 ... 6 and 16 Insulation/symmetry ... the others
Parameter Symbol Values
Diffusion coefficient... c ... 0.1 Reaction rate ... R ... 0 Velocity ... u ... 0 and 1 0 8 0,0 2,0x10⁻¹ 4,0x10⁻¹ 6,0x10⁻¹ 8,0x10⁻¹ 1,0x100 co mb ust io n pro du ct s co nce nt ra tio n (a .u .) Range (m) Cell Lenght (m)
divided in infinitely thin disks. Each one of these is produced at a given time, moves upwards with a buoyancy rate vb of 1 m/s and does not interact with the smoke disk produced at different times. A typical result is given in the following picture (Figure 9)
Fig. 9 Evolution of smoke into the atmosphere. It is evident that the smoke exhibits a columnar trend in which the zones nearer to source are more dense than those farther away and along the perimeter of the column. This means that also in such situation the smoke backscattering coefficient has a bell shape with its peak over the burned material and that its strength diminishes with altitude.
4. MEASUREMENTS OF THE SMOKE
BACKSCATTERING COEFFICIENT
4.1 Methodology
Test measurements of our lidar have been performed with the aim to obtain the backscattering coefficient of smoke [14].
The cell has been located at about 70 m from and in front of laser along the light path (Figure 10). In order not to leave smoke to exit from cell, the two extreme apertures of the cell are been closed with a transparent film.
Fig. 10 The measurement drawing: on the left, the
cell and under it the fire; on the right, the laser, the telescope, the detector and the acquisition system.
The laser transmits light pulses into the cell; here light and smokey matter interact with each other and backscattered radiation is focused by the telescope towards the detector, which is connected to an acquisition and data storage system.
The acquisition system is a VXI instrument and the data storage system is a computer. This same computer is used to manage the acquisition process, that is executed by a program written in LabVIEW, employing GPIB protocol.
The fire was lighted under the funnel of the cell. Tests were done burning separately citrus and eucalyptus fallen dry leaves and branchlets, plants diffused in Calabria, where the measurements were performed. The quantity of this vegetable material was 10 grams.
We observed, after having lighted the fire and that smoke spread into the cell, that for a duration of about 3 minutes the smoke seemed distributed uniformly. Afterwards it began go out slowly. During the spreading phase we started laser shooting and we finished when the smoke was exiting.
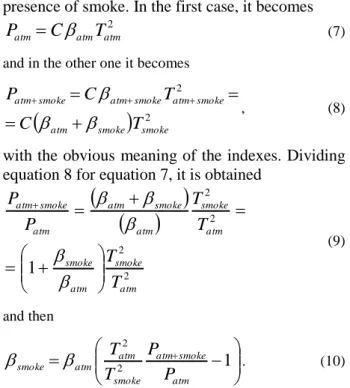
The smoke backscattering coefficient has been calculated applying the well known LIDAR equation [10 ÷ 18]
2
T
C
P
, (6)written in simplified form, where P is the lidar signal, C is a constant, is the backscattering coefficient and T is the transmittance. Equation 6 has to be applied for both cases of absence and presence of smoke. In the first case, it becomes
2 atm atm
atm
C
T
P
(7)and in the other one it becomes
2 2 smoke smoke atm smoke atm smoke atm smoke atm T C T C P
, (8)with the obvious meaning of the indexes. Dividing equation 8 for equation 7, it is obtained
2 2 2 21
atm smoke atm smoke atm smoke atm smoke atm atm smoke atmT
T
T
T
P
P
(9) and then 1 2 2 atm smoke atm smoke atm atm smoke P P T T
. (10)Atmospheric backscattering coefficients atm were calculated to be 8.41 × 10⁻⁸ m-1sr-1 for 1064 nm, 1.33 × 10⁻⁶ m-1sr-1 for 532 nm and 6.71 × 10⁻⁶ m-1sr-1 for 355 nm, at pressure and temperature in the day of measurements of 1022 mbar and 30 °C. The Tsmoke were obtained, instead, by specific extinction measurements of radiation for each wavelength. That because we do not have information to perform numerical simulations or analytical calculations for obtain them.
5
RESULTS
OF
THE
EXPERIMENTAL
MEASUREMENTS
5.1 Introduction
Starting form the theoretical smoke model described in the previous paragraph, we have performed a simulation of lidar backscattering signals.
Using the laser characteristics listed in section 1, a theoretical analysis has been performed based just on the single frequency used, in theUV range. The signal simulation included all physical parameters of our mobile Lidar-Dial system developed at the University of Rome “Tor Vergata” and at Crati s.c.r.l. c/o UNICAL and listed in tables 1.
The power Pr collected by the receiver was calculated using the well known LIDAR equation (11):
(11)
where E1 is the laser pulse energy, c the speed of light, Ar the area of primary mirror telescope, and R are the transmitter and receiver efficiencies,
the mean value of the smoke backscattering coefficient at distance R from the lidar and K the air extinction coefficient. The transmitter efficiency was set at 100%. The output laser energy was reduced to take into account the eye-safe limits, imposed by MPE standards.
From the smoke model simulations, we calculated the volume backscattering coefficient including smoke particles information in presence of fire and then we evaluated the laser beam interaction with the smoke plume. The simulated backscattered LIDAR signals have been calculated moving the fire varying its locations from 0 to 15 km by steps of 750m.
Through these results, since the LIDAR signal is always affected by instrumentation background noise, the Signal-to-Noise Ratio (SNR), as a function of the distance that LIDAR can reach to detect a small smoke plume, has been calculated. The equation for SNR in the case of a photomultiplier detector is given by (12):
(12)
where e is the electron charge, Be is the effective bandwidth, n is the accumulated signal, G is the photomultiplier gain, Rp is the photocathode responsivity, Pbgnd is the power of the background solar radiation [7], Pr is the backscattered radiation, and F is the noise factor associated with gain. According to Measure [13], F is of the order of unit and may be neglected.
5.2 Experimental campaign in cell
Experiments with the Nd:YAG laser source have been implemented for each typology of material burned and using each of the three characteristic wavelength of this source : 1064 nm, 532 nm, 355nm. Due to the fact that the special resolution of the laser pulse (75 cm) was lower than the length cell it has been possible calculate the backscatter coefficient profile of the smoke inside the cell. In the figure 4 the concentration profile of the combustion products obtained during the experiments is showed. By a comparison with the simulation results (Figure 11) it is evident that the experimental results match the numerical one.
Fig.11 Normalized distribution of combustion
products in cell
After that experiments have been developed using a wavelength of 1064nm (the one used in the field campaign to detect smoke particles) , 532 nm and 355 nm and burning 10 g of eucalyptus and again
1 2 0 exp 2 ' ' 2 R r r R T c R A P E K R dR R
R R
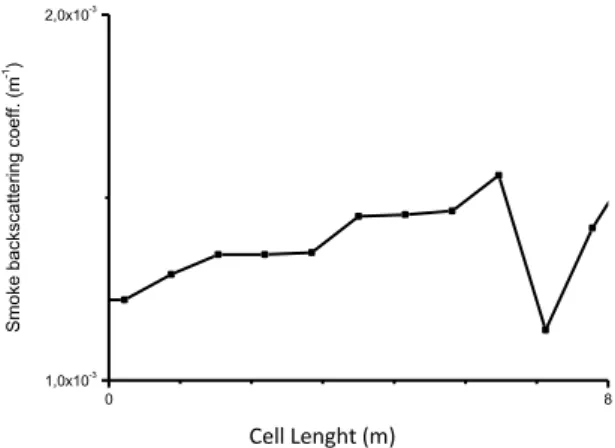
2 2 r p e r p bgnd p d P R G n SNR eG FB P R P R I G 0 8 0 1 Smo ke co nce nt ra tio n w ith in ce ll (a .u .) Range (m)the good agreement with numerical results is evident. An evaluation of backscattering values vs cell length has been done and the results are reported in Figure 12, Figure 13 and Figure 14.
Fig.12 Backscatter coefficient profile of smoke
from eucalyptus at 1064 nm
Fig. 13 Profile of smoke backscattering coefficient
of eucalyptus at 532 nm.
Fig. 14 Profile of smoke backscattering coefficient
of eucalyptus at 355 nm.
So by the mean of these results the experimental campaigns in field have been organized and the results are showed in section that follow.
5.3 Experimental campaign in field
The purpose of the measurements performed is firstly to verify the capability of the FfED system to detect the tenuous smoke plumes produced by forest fires at an early stage, and secondly to test the methodology developed in the case of complex orography to distinguish the smoke plume backscattered signal from orographic peaks that otherwise would give rise to false alarms [15-20]. This is a very important issue for safety of operators and population [21-25]. A new signal processing method, able to discriminate peaks due to the fires from peaks due to the other factors, has been developed.
For this reason the experimental site selected is a place with a complex orography; it is located near Settefrati in the province of Frosinone (Italy) precisely in the Canneto valley surrounding the Meta massif’s buttresses. This location remains at a height of 1030 m above mean sea level; its more high portion is wildlife reserve in the Abruzzo, Molise and Lazio National Park.
A quite small fire was lighted into a box at a distance of about 700 metres from the Lidar system; Figure 15 and Figure 16 depict FfED in action. In figure 17 the direction of the
measurements is shown.,
Fig.15 Canneto Valley ( the red point visualizes the
zone of fire lighting)
0 8 1,0x10⁻³ 2,0x10⁻³ Smo ke b acksca tte rin g co ef f. (m -1) Range (m) 0 8 0,0 5,0x10⁻⁵ 1,0x10⁻⁴ 1,5x10⁻⁴ 2,0x10⁻⁴ 2,5x10⁻⁴ 3,0x10⁻⁴ 3,5x10⁻⁴ 4,0x10⁻⁴ Smo ke b acksca tte rin g co ef f. (m -1) Range (m) 0 8 0,0 1,0x10⁻⁴ 2,0x10⁻⁴ 3,0x10⁻⁴ 4,0x10⁻⁴ 5,0x10⁻⁴ 6,0x10⁻⁴ Smo ke b acksca tte rin g co ef f. (m -1) Range (m) Fire Cell Lenght (m)
Fig.16 FfED system positioning in course of
action.
Fig.17 Measures direction in the first set of
measurements
If the site’s orography remains unknown each peak will be owing to a fire; in order to reduce false alarms it is necessary have an information about the backscattered signal by the Orographic obstacles. So the backscattered signal obtained in presence of a fire typically presents one peak due to the interaction of the laser beam with the smoke plume at a specific distance, and other peaks due to fixed orographic targets. LIDAR backscattered signals obtained have been analysed. Each acquisition data file is obtained by the average of 100 laser pulses every 10 seconds. Figure 18 shows the backscattered signal at 1064 nm.
Fig.18 Backscattered LIDAR signal at 1064 nm
obtained during a set of measurements.
6 CONCLUSION AND FUTURE
DEVELOPMENTS
In this work a LIDAR system, capable of detecting forest fires at a very early stage but with low percentage of false alarms, has been presented. The main design choices and their implementations have been described. The results obtained during the experimental campaigns in cell (at 1064 nm, 532 nm and 355 nm) have confirmed the good agreement between the numerical results obtained by the mean of numerical simulation and the experimental ones obtained with the FfED LIDAR system implemented and they have demonstrate the capability of FfED system to detect small fire events. The first experimental results in field have confirmed the capabilities of the system and have shown that it is able to localize a smoke plume recognizing if the peaks on the backscattering LIDAR signal, at different ranges, are due to the combustion of a small amount of vegetable fuel or to a fixed target. In order to improve the ability of the method to locate the exact position of a fire, we intend to develop a dispersion model to simulate the smoke back trajectory; this will allow to send the exact alarm coordinates to the PC connected to an environmental protection organization and to minimize the time of intervention. It is necessary also to work on the miniaturization of the system and reduction of the costs.
References:
[1] Fiocco G, Smullin LD. Nature 1963;199:1275. [2] Measures RM. Laser remote sensing. New York: Wiley; 1984.
[3] Andreucci F, Arbolino M. A study on forest fire automatic detection system. Il Nuovo Cimento 1993;16(1):35. Wavelenght 1064 nm Distance (metres) Orographic limits Orographic limits Smoke Lidar position Fire position
[4] Andreucci F, Arbolino M.A study on forest fire automatic detection, system 2—smoke plume detection performance. Il Nuovo Cimento 1993; 16(1):51.
[5] Vilar R, Lavrov A. Estimation of required parameters for detection of small smoke plumes by LIDAR at 1.54 mm. ApplPhys B Lasers Opt 2000; 71 (8) :225–9.
[6] Pershin S, Hao WM, Susott RA, Babbitt RE, Riebau A. Estimation of emission from Idaho biomass fire using compact eye-safe diode LIDAR. Appl LIDAR Curr Atmos Top III 1999;3757:60–6 [Bellingham: SPIE].
[7] Utkin A, Fernandes A, Costa L, Vilar R, Simoes F. Detection of small forest fire by LIDAR. Appl Phys B Lasers Opt 2002;74(1):77–83.
[8] Utkin A, Fernandes A, Vilar R, Lavrov A. Forest fire detection by means of LIDAR, forest fire research and wildland safety. In: Proceedings of the Fourth International Conference on Forest Fire Research, vol. 58. Rotterdam: Millpress; 2002. [9] Fernandes A, Utkin A, Lavrov A, Vilar R. Development of neural network committee machines for automatic forest fire detection using LIDAR. Pattern Recognit 2004;37:2039–47. [10] Bellecci C, Francucci M, Gaudio P, Gelfusa M, Martellucci S, Richetta M. Early detection of small forest fire by dial technique. SPIE Eur Int Symp Remote Sensing 2005:5914–76 [Bruges, Belgium].
[11] C. Bellecci, L.DeLeo, P.Gaudio, M.Gelfusa, T.LoFeudo, S.Martellucci, M.Richetta:” Reduction of false alarms in forest fire surveillance using water vapour concentration measurements” Optics & Laser Technology 41 (2009) 374–379
[12] Bellecci C, Francucci M, Gaudio P, Gelfusa M, Martellucci S, Richetta M, Lo Feudo T Application of a CO2 dial system for infrared detection of forest fire and reduction of false alarm. APPLIED PHYSICS. B, LASERS AND OPTICS, vol. 87, (2007). p. 373-378
[13] Measures RM. Laser remote sensing. New York: Wiley;1984.
[14] 6. C. Bellecci, P. Gaudio, M. Gelfusa, T. Lo Feudo, A. Murari, M. Richetta, L. De Leo, In-cell measurements of smoke backscattering coefficients using a CO2 laser system for application to lidar-dial forest fire detection, Optical Engineering 49 (12), 124302 (2010).
[15] C. Bellecci, P. Gaudio, M.Gelfusa,T. Lo Feudo , A.Malizia, M. Richetta, P.Ventura. “Raman water vapour concentration measurements for reduction of false alarms in forest fire detection”, SPIE Remote sensing, Proc. SPIE ,Vol. 7479, 2009
[16] 10. C. Bellecci, L. De Leo, P. Gaudio, M. Gelfusa, S. Martellucci, , T. Lo Feudo, M. Richetta, Evolution study of smoke backscattering coefficients in a cell by means of a compact mobile Nd:Yag lidar system, Proceedings of SPIE, vol. 6745, 2007);
[17] P. Gaudio, M. Gelfusa, I. Lupelli, Malizia A., A. Moretti, M. Richetta, C. Serafini (2012). Early forest fires detection using a portable CO2 Dial system: preliminary results. In: Proceedings 14° Convegno Nazionale delle Tecnologie Fotoniche, Firenze, 15-17 maggio 2012 – ISBN . Firenze, Italia, Maggio 2012, ISBN/ISSN: 9788887237146. [18] P.Gaudio, M. Gelfusa, Malizia A., M. Richetta, C.Serafini, P. Ventura, C. Bellecci, L.De Leo, T.Lo Feudo, A. Murari (2012). A portable LIDAR system for the early detection: FfED system - a case study. In: Advances in Fluid Mechanics and Heat & Mass Transfer Conference Proceedings. Istanbul - Turkey, July 21-23, 2012, p. 208-214, ISBN/ISSN: 978-1-61804-114-2 [19] Gaudio, P., Gelfusa, M., Lupelli, I., Malizia, A., Moretti, A., Richetta, M., Serafini, C., Bellecci, C. ”First open field measurements with a portable CO2 lidar/ dial system for early forest fires detection” (2011) Proceedings of SPIE - The International Society for Optical Engineering, 8182, art. no. 818213
[20] Bellecci, C., Gaudio, P., Gelfusa, M., Malizia, A., Richetta, M., Serafini, C., Ventura, P. ”Planetary Boundary Layer (PBL) monitoring by means of two laser radar systems: Experimental results and comparison” (2010) Proceedings of SPIE - The International Society for Optical Engineering, 7832, art. no. 78320X.
[21] Gallo, R., De Angelis, P., Malizia, A., Conetta, F., Di Giovanni, D., Antonelli, L., Gallo, N., Fiduccia, A., D'Amico, F., Fiorito, R., Richetta, M., Bellecci, C., Gaudio, P. “Development of a georeferencing software for radiological diffusion in order to improve the safety and security of first responders” (2013) Defence S and T Technical Bulletin, 6 (1), pp. 21-32.
[22] Malizia A., Quaranta, R., Mugavero, R., Carcano, R., Franceschi, G. ”Proposal of the prototype RoSyD-CBRN, a robotic system for remote detection of CBRN agents” (2011) Defence S and T Technical Bulletin, 4 (1), pp. 64-76
[23] Malizia, A., Lupelli, I., D'Amico, F., Sassolini, A., Fiduccia, A., Quarta, A.M., Fiorito, R., Gucciardino, A., Richetta, M., Bellecci, C., Gaudio, P.”Comparison of software for rescue operation planning during an accident in a nuclear power plant” (2012) Defence S and T Technical Bulletin, 5 (1), pp. 36-45.
[24] Malizia A., R.Quaranta, R.Mugavero, R.Carcano, G.Franceschi (2011). Proposal of the prototype RoSyD-CBRN, a robotic system for remote detection of CBRN agents. Defence S&T technical bulletin, vol. 4; p. 64-76, ISSN: 1985-6571
[25] Cenciarelli, O., Malizia, A., Marinelli, M., Pietropaoli, S., Gallo, R., D'Amico, F., Bellecci, C., Fiorito, R., Gucciardino, A., Richetta, M., Gaudio, P. “Evaluation of biohazard management of the Italian national fire brigade “(2013) Defence S and T Technical Bulletin, 6 (1), pp. 33-41.