DIPARTIMENTO DI MECCANICA ◼ POLITECNICO DI MILANO
via G. La Masa, 1 ◼ 20156 Milano ◼ EMAIL (PEC): [email protected] http://www.mecc.polimi.it
Rev. 0
3D finite element prediction of chip flow, burr
formation, and cutting forces in micro end-milling of
aluminum 6061-T6
Davoudinejad, Ali; Parenti, Paolo; Annoni, MASSIMILIANO PIETRO
GIOVANNI
This is a post-peer-review, pre-copyedit version of an article published in FRONTIERS OF MECHANICAL ENGINEERING. The final authenticated version is available online at:
http://dx.doi.org/10.1007/s11465-017-0421-6
3D Finite Element Prediction Performance of Chip Flow, Burr Formation and Cutting Forces in Micro End-Milling of Aluminum 6061-T6
A. Davoudinejad*, P. Parenti, M. Annoni
Mechanical Engineering Department, Politecnico di Milano, Via La Masa 1, 20156. Milan, Italy
---
Abstract
Predictive models for machining operations have been significantly improved with numerous methods in the last few decades. This study presents a 3D Finite Element Modeling (3D FEM) ap-proach for the micro end-milling process on Al6061-T6. A number of FE simulations were per-formed at different cutting conditions to obtain realistic numerical predictions of chip flow, burr formation and cutting forces. FE modelling showed some important advantages, i.e. it can easily deal with any kind of tool geometry and any side effects affecting the chip formation such as ther-mal aspects and material properties changes. A 3D FE model, as the one used in this study, is able to consider the effects of mill helix angle and cutting edge radius on the chip. The FE model pre-diction capability was validated by comparing the numerical model results with experimental tests. Some correlations were observed in terms of burr dimension trends and force profile shapes. How-ever, the FE predictions overestimated the real force magnitude pointing out some further devel-opment areas.
Keywords: 3D Finite Element Modeling, Micro End-Milling, Cutting force, Chip and Burr formation, 1. Introduction
Ultra precision machining is needed for various types of industrial products [1]. Micro milling is an efficient method for producing miniaturized components with 3D shapes in a flexible and cost efficient way in comparison to other micro machining processes [2]. However, some difficulties due to the small scale might be faced, such as tool wear and breakage, chatter, burr formation and high stress variation in small diameter of micro tools, which may shorten their life [3, 4]. Micro machining simulations have become a powerful method to predict cutting information prior to
machining. Models have been broadly developed to improve productivity and enhance product quality. Modeling methods can be classified as analytical, numerical (FEM), experimental, artifi-cial intelligence and hybrid [5-7]. Finite element method has become a significant tool for simu-lating the micro milling process. It rapidly expanded within last decades due to its benefits and the development of powerful computers. The finite element technique demonstrates to produce detailed information on the cutting process phenomena and quantities such as chip formation, cutting forces, strain, strain rate, tool stresses, cutting temperatures, etc. [8-9]. Finite element analyses can provide information on the metal cutting process that is impossible or difficult to obtain with experimental or analytical methods.
A number of researches have reported on the development of the FEM application to the micro milling process. A strain gradient plasticity based finite element model of orthogonal micro cut-ting of Al5083-H116 was used to investigate the influence of the tool edge radius on the size ef-fect [10]. The significant efef-fect of four cutting edge radii on residual stress was simulated in or-thogonal dry cutting of AISI 316L with continuous chip formation [11]. Another study was per-formed on micro milling by using a new approach for predicting cutting forces with an orthogo-nal cutting finite element model by considering the trajectory of the tool and the uncut chip thickness [12]. Chip formation and cutting area temperature predictions were carried out with a 2D FEM on AL 2024-T6 and AISI 4340 considering the influence of the edge radius on mini-mum chip thickness [13]. Predictions of orthogonal cutting forces were carried out for micro end-milling of brass 260 by considering the chip load and the tool edge radius effect. The cutting force coefficients were identified from a set of simulations in a range of cutting edge radii and chip loads [14]. In another study, CBN coated tool were simulated with the finite element method to predict chip formation, cutting forces, temperatures and wear rates generated in micro milling of Ti-6Al-4V alloy [15]. The effect of the tool edge radius on the frictional contact and on the flow stagnation phenomena in micro machining of medium carbon steel (AISI 1045) were
inves-tigated through 2D FEM approaches. A constant stagnation point angle of 58.5 ± 0.5° was deter-mined for a wide range of undeformed chip thicknesses [16].
Some aforementioned 2D FEM studies reveal advantages of 2D modeling, such as less compli-cated setup and lower simulation time [13-15], however, 3D FEM simulations present supple-mentary analysis capabilities to investigate the effect of the mill helix angle and the tool edge ra-dius on chip flow and burr formation, which cannot be investigated by 2D FEM [17]. A 3D micro milling finite element model was proposed in [18] to investigate the effect of the cutting edge ra-dius on temperature distribution, effective stress and simulated cutting forces in Al2024-T6 micro milling. No validation against experiments was carried out. Different tool edge radii produced different cutting force responses in the simulations [18]. In a recent study, 3D FEM simulations were used to predict chip flow and shape during Ti-6Al-4V alloy micro end-milling. The FEM considered the wear along the micro tool by investigating the influence of the cutting edge roundness increment on the machining process performance [19]. Another study focused on the burr formation prediction capability of 3D FEM in micro ball milling of Ti-6Al-4V alloy and in-vestigated different types of burr formation [20].
Many researchers have studied finite element models in the micro field restricting their analyses to the limited case of orthogonal cutting [13-15]. Experimental validations have been often lim-ited to a single cutting condition [6] or have been avoided [18] due to the difficulties of perform-ing tests in the small scale. Very few studies investigated the burr formation [20]. In the present study, 3D FEM simulations were carried out in different cutting conditions in order to test a pos-sible prediction capability increase due to a better tool geometry representation. The numerical model was used to study the chip flow, burr formation and temperature distribution, which are difficult to evidence in physical experiments. Additionally, the force prediction capability of the model was validated by comparing the numerical model results with experiments.
2. Modeling approach
2.1 Finite element modeling of micro end-milling
Three dimensional micro end-milling of Aluminum 6061-T6 was simulated using an explicit time integration method and employing a Lagrangian finite element formulation that can perform cou-pled thermo-mechanical transient analyses. The special purpose AdvantEdge® FEM software was used [21]. The target material Al6061-T6 has been selected among the materials available in AdvantEdge® library as the most suitable for modeling Al6082-T6, which is currently replacing Al6061-T6 in the industrial practice. 0.5 mm diameter two flute carbide micro end-mills were adopted for validation experiments (Section 3). The actual geometry of the mill, such as cutting edge radius and helix angle (Table 1), was measured by an Alicona Infinite Focus 3D optical mi-croscope and the obtained values used to model the tool into the AdvantEdge® software. Fig. 1(a) shows the set-up and the general geometry of the 3D finite element micro end-milling model and Fig. 1(b) details the magnification of the cutting edge. An up-milling contouring operation was simulated since it is more critical for the chip formation due to the ploughing occurring at low engagement angles. The workpiece was fixed in X Y and Z directions and the tool con-strained in Z direction. The feed was applied by moving the tool axis along the X direction. The cutting tool was considered as a rigid body and the workpiece was considered as a viscoplastic material. Neither tool nor workpiece deflections were considered.
Fig. 1 (a) FEM simulation set-up; (b) cutting edge magnification; (c) definition of tool engage-ment angle θ (top view)
The rigid cutting tool was meshed using 46793 brick elements. The workpiece was meshed with 4 nodes tetrahedral elements for a total number of 42391 elements. After preliminary evaluation tests, the maximum and minimum element sizes for the workpiece were set to 2 mm and 0.001 mm re-spectively. The maximum element size of the tool was set at 1 mm and the minimum at 0.001 mm. A higher mesh density was considered in the area where chip was expected to form in order to in-crease the accuracy of computed outputs (Fig.1 (b)). The mesh quality was constantly monitored during the simulations and, when the element distortion reached a certain threshold, adaptive remeshing was triggered. In addition to remeshing, a refinement factor that determines the softness behavior of the mesh during deformation and a coarsening factor that determines the behavior of element coarsening were applied in various parts of the mesh [22, 23]. The mesh refinement factor was set to the value of 2 and the coarsening factor was set to 5. These values were selected as a trade-off between the prediction time reduction and the capability to generate acceptable simulation results based on some preliminary simulation analyses. The initial temperature of tool and work-piece was set to 20 °C as the room temperature of the validation experiments.
The constitutive model used for calculating the Aluminum 6061-T6 flow stress is known as Power Law (Eq. 1) [22]. This model is based on the stress update method that extends small-strain stress update algorithms to the finite deformation range at a kinematic level to provide a constitutive model for different materials. The default formulation for this constitutive model in the software uses Pow-er Law as follow:
𝜎 𝜀#, 𝜀., Τ = g 𝜀# . 𝛤 𝜀 . Θ(Τ) (1)
The Power Law contains three terms. g(εp) is the isotropic strain hardening function (Eq. 2), 𝛤 𝜀 is the strain rate sensitivity (Eq. 3) and Θ(Τ) is a fifth order polynomial function for thermal soften-ing (Eq.4): g 𝜀# = 𝜎 - (1 +1 2 132)4 5 (2) 𝛤 𝜀 = 𝜎- (1 +11. 3 .)4 6 (3) Θ Τ = 𝑐-+ 𝑐-𝑇4+ ⋯ + 𝑐 :𝑇: (4)
where 𝜎- is the initial yield stress, 𝜀# is the plastic strain, 𝜀
-# is the reference plastic strain, 𝜀.is
the strain rate, 𝜀-. is the reference plastic strain rate, c0 through c5 are the coefficients for the
poly-nomial fit, T is temperature, N is the strain hardening exponent and M is the strain rate sensitivity coefficient [21, 22].
The friction phenomenon at the chip-tool interface was modeled using the Coulomb law, as shown in Eq. 5. The frictional stresses τ on the tool rake face are assumed to be proportional to the normal stresses 𝜎5 with a friction coefficient µ [24, 25]. It is very difficult to determine the friction coeffi-cient from conventional tests due to the different frictional conditions in the sliding region. The ma-chined chip surface is a newly formed surface affected by high strain hardening: the chip hardness is usually higher than the workpiece hardness because of the experienced plastic deformation. This hardness variation may cause changes in the friction coefficient [26]. The friction coefficient in this
study was assumed as µ = 0.5. A study on Al2024-T6 conducted a 3D FEM with a value for the fric-tion coefficient equal to 0.7 [18]. Another study investigated the wear and fricfric-tion behavior of Al6061 and Al6061 reinforced with 1 wt% of Carbon Nano Tubes (CNT). The study authors con-sidered the friction coefficient as a function of load for Al6061 and observed that its mean value is about 0.5 [27].
𝜏 = 𝜇𝜎5 (5)
3. Experimental setup and conditions
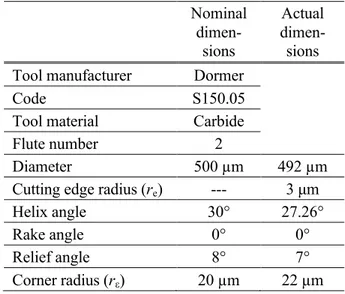
Micro milling tests were performed on a Kern EVO ultra precision 5-axis machining center with nominal positioning tolerance equal to ±1 µm and precision on the workpiece equal to ± 2 µm as declared by the manufacturer. The machine tool and experimental set-up are illustrated in Fig. 2. The workpiece was especially designed in order to have three available machining areas near the geo-metrical center of the dynamometer flange. The characteristics of the employed carbide mill (Dor-mer S150.05) are listed in Table 1.
Table 1 Nominal and actual tool characteristics
Nominal dimen-sions Actual dimen-sions
Tool manufacturer Dormer
Code S150.05
Tool material Carbide
Flute number 2
Diameter 500 µm 492 µm
Cutting edge radius (re) --- 3 µm
Helix angle 30° 27.26°
Rake angle 0° 0°
Relief angle 8° 7°
Fig. 2 (a) Machine tool; (b) workpiece fixture on the dynamometer to measure the cutting forces (c) workpiece machining area (top view)
Fig. 3 Characterization of the tool geometry for modeling the micro end-mill: (a) measuring posi-tions along the mill axis; (b) mill and core diameters and cutting edge radius measured on the
Fig. 4 Frequency response functions (FRF) resulting from impact tests on the fixturing and force measurement system
Concerning the micro tool measurement, a 3D optical microscope (Alicona Infinite Focus) was used prior to machining to determine the actual fresh tool geometry (Fig. 3). Four different meas-urements of the mill have been taken with an axial step of 0.1 mm (measurement parameters: 10x magnification, exposure time = 1.206 ms, contrast = 1, coaxial light, estimated vertical and lateral resolutions = 0.083 µm and 4 µm respectively). While a good agreement between nominal and measured value was found for the characteristics angles (Table 1), some variations have been no-ticed for the mill outer diameter and the cutting edge radius whose measured values were, respec-tively, within the range 490.4 ÷ 493.6 µm and 2.4 ÷ 3.6 µm. No big variations of the mill geome-try were observed at the mill tip.
Table 2 Experimental conditions
Cutting
parameters Test 1 Test 2 Test 3 Test 4
Depth of cut ap µm 50 50 50 50
Width of cut ae µm 125 125 125 125
Feed per tooth fz µm/(tooth·rev) 4 2 4 2
Cutting speed vc m/min 28.27 28.27 14.13 14.13
Spindle speed n rpm 18000 18000 9000 9000
The series of micro-milling experiments on Al6082-T6 were carried out in different cutting condi-tions as shown in Table 2. The cutting parameters were selected to stay around the cutting edge radi-us with the feed per tooth and, this way, to appreciate the minimum chip thickness effect. The up-milling approach has been selected to maximize the same effect. Each cutting condition was repli-cated twice to check the results variability, hence the whole experimental design consisted of 8 tests. Two mills have been used to carry out all the experimental runs; one for each replicate.
The micro slots were acquired by Alicona Infinite Focus with 20x magnification to measure the burr height and width at different cutting conditions. Cutting force signals were measured by a miniature piezoelectric three-axial dynamometer Kistler 9317B (Fig. 2(b)) (measuring range: Fx, Fy = ± 1000
N, Fz = ± 2000 N; linearity error ≤ 0.5 % FSO (Full Scale Output)) amplified by three Kistler 5015A
charge amplifiers. Vibration occurs during the cutting force measurements mainly because of the relatively low resonance frequency of the fixturing and force measurement system, which is approx-imately 4000 Hz in both X and Y directions, as illustrated in Fig. 4. For this reason, the force signals required a compensation [29] to remove the dynamic contribution of the sensor resonance. The fre-quency response functions (FRF) of the dynamometer were identified from impact tests applied on the force directions as detailed in [29].
4. Results and discussion
4.1 Chip formation and temperature distribution
Contouring micro milling simulations were performed for a single tooth engagement. The simula-tions were performed on a computer equipped with a processor characterized by 2.6 GHz and 16 cores, 64 GB RAM. 8 threads parallel simulation mode was used to speed up the calculation time about six times. The calculation time was about 100 ± 30 hours depending on the cutting condition. During a micro end-milling operation, the undeformed chip section changes as the tool engagement angle θ changes. Fig. 5(a) shows a schematic of a typical undeformed chip section on the periphery of a micro end-mill and Fig. 5(b) shows the 3D undeformed chip geometry, which was calculated
basing on the mill engagement during the contouring operation. The undeformed chip thickness on the end-mill periphery varies at different positions due to the mill helix angle and corner radius. The FEM is able to consider the correct uncut chip cross section as it is in physical experiments (Fig. 5(c)).
Fig. 5 (a) schematic of the undeformed chip section along the periphery of tool; (b) schematic of the 3D undeformed chip geometry; (c) FEM chip formation for Test 2 (fz = 2 µm/(tooth·rev);
vc = 28.27 m/min); (d) experimental chip
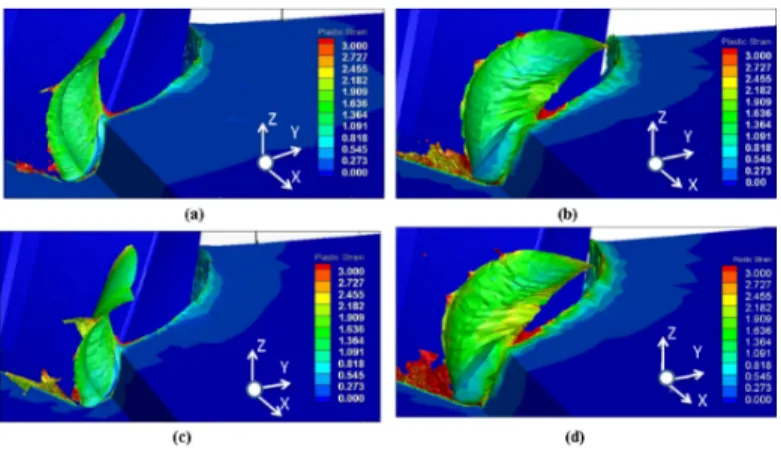
Different chip shapes were obtained at the end of the simulation for each cutting condition. Fig. 6 shows the plastic strain distribution in the workpiece, chip and burr at different cutting conditions. The plastic strain has a slight reduction from the most severe cutting condition (Test 1 (fz = 4 µm/(tooth·rev); vc = 28.27 m/min), Fig. 6(d)) to the less severe condition (Test 4
(fz = 4 µm/(tooth·rev); vc = 14.13 m/min), Fig. 6(a)).
Fig. 7(a) and Fig. 7(b) show different steps of chip formation and the resulting temperature distribu-tion for the Test 3 and Test 2, respectively. These two cutting condidistribu-tions are significant due to the noticeable temperature variation along the tool engagement arc. The predicted temperature reaches its maximum of 33°C in the chip area at θ = 54° in case of Test 3. It can be noticed that the chip
shows the highest temperature mainly due to its intensive plastic deformation. The up-milling ap-proach was simulated, where the chip thickness starts at zero and increases towards the end of the cut. In different cutting conditions, chip starts to form at different engagement angle. For instance earlier chip formation occurred with higher feeds per tooth, as expected (Fig. 7(a)). Whereas, for lower feed conditions the ploughing phenomenon occurs and chip formation starts taking place at higher engagement angles. For example, in case of Test 2 (Fig. 7(b)) chip starts to form around θ = 12° and then it is pushed outside the workpiece without being detached. Basing on the cutting pa-rameters of Test 2, the exit angle is equal to θ = 60° but Fig. 7(b) depicts the situation for θ = 54° to stay just before the exit, where the chip is still attached to the workpiece.
Fig. 6 Plastic strain distribution in the workpiece, chip and burr at (a) Test 4 (fz = 2
µm/(tooth·rev); vc = 14.13 m/min) (b) Test 3 (fz = 4 µm/(tooth·rev); vc = 14.13 m/min) (c) Test 2
Fig. 7 Chip formation and temperature distribution at different engagement angles: (a) Test 3 (fz =
4 µm/(tooth·rev); vc = 14.13 m/min ); (b) Test 2 (fz =2 µm/(tooth·rev); vc = 28.27 m/min ).
In Fig. 8 the temperature distributions along the tool cutting edge (on the right) and in the tool-workpiece contact area (on the left) are shown at the same angular position (θ ≈ 50°). The heat is concentrated in the contact area and the temperature increases in more severe cutting conditions, as expected. It should be noticed that in each cutting condition the tool temperature is lower than the chip and workpiece temperature.
Fig. 8 Temperature distribution along the cutting edge and chip at (a) Test 4 (fz = 2
µm/(tooth·rev); vc = 14.13 m/min) (b) Test 3 (fz = 4 µm/(tooth·rev); vc = 14.13 m/min) (c) Test 2
(fz =2 µm/(tooth·rev); vc = 28.27 m/min) (d) Test 1 (fz = 4 µm/(tooth·rev); vc = 28.27 m/min).
4.2 Burr formation
Fig. 9 depicts the burrs obtained at different cutting conditions both in FEM and in real experi-ments from the top. In the experimental part Fig. 9(b) the measurements area of the maximum and average burr formation is shown. According to the classification proposed by [30], in these pictures it is possible to observe top burrs, which form on the top side of the slot walls during the
chip generation, and entrance burrs, which arise at the beginning of the tool engagement. As pre-viously stated, the simulations were performed for a single tooth engagement and the pictures of FEM results show the cutting edge at the end of its engagement arc. On the other hand, the opti-cal acquisitions of real specimens show the result of several tooth engagements. For this reason, there is no direct correlation between burrs in the pictures related to the same cutting conditions, but some trends can be observed within each picture series, i.e. along the left and the right col-umn of Fig. 9.
The experimental and FEM results indicate that cutting parameters influence the top burr for-mation and the top burr maximum height follows the same trend in both cases. Based on the se-lected cutting conditions, the feed seems to affect the top burr height more than the cutting speed. Both the top burr size and the plastic strain are higher for higher feed values (Test 4, Fig. 9(a) and Test 2, Fig. 9(c)). The smallest top burr is obtained for high cutting speed and low feed (Test 2, Fig. 9(c)). The entrance burr is likely to occur due to the ploughing taking place for low engage-ment angles, when the effective uncut chip thickness is lower than the minimum uncut chip thickness (Section 4.1). The entrance burr width has the same trend than top burr height, having its lower value for Test 2 (Fig. 9(c)).
Fig. 9 Top view of burr formation at (a) Test 4 (fz = 2 µm/(tooth·rev); v= 14.13 m/min) (b) Test 3
(fz = 4 µm/(tooth·rev); vc = 14.13 m/min) (c) Test 2 (fz =2 µm/(tooth·rev); vc = 28.27 m/min) (d)
4.3 Cutting forces
It was noted that all the simulated forces were affected by a relevant amount of noise distributed at an extremely high frequency range, much beyond the range of real cutting force contributions. A fifth-order Butterworth low-pass filter was then applied to the simulated signals with a cut-off fre-quency equal to the bandwidth achievable by the dynamometer installed on the machine, which is around 7000 Hz after the application of the acquired force compensation [29], in order to obtain simulated force signals comparable with the experiments. The comparisons were performed between results obtained from the finite element model and the physical experiments.
The profiles of the cutting forces obtained for two different cutting conditions, Test 1 and Test 3, are presented in Fig. 10 and Fig. 11, respectively. The feed force Fx is the largest component and shows similar trends for FEM in comparison to experiments. Fx starts decreasing earlier and with a lower inclination in case of FEM.
Fig. 10 Cutting force comparison for Test 1 (fz = 4 µm/(tooth·rev); vc = 28.27 m/min; ap = 0.05
Fig. 11 Cutting forces comparison for Test 3 (fz = 4 µm/(tooth·rev); vc = 14.13 m/min ; ap = 0.05
mm)
The transversal force Fy shows a negative minimum and a positive maximum at the end of the cut for both FEM and experiments. The thrust force Fz is usually the most difficult to evaluate and it is often neglected in the models also for its lower values compared to Fx and Fy. The ex-perimental Fz is negligible, apart from a limited region at the end of the cut, while FEM Fz com-ponent is always positive.
To summarize, in terms of cutting force profile, the graphical comparison reveals a reasonable matching in terms of curve shapes, especially for the two main force contributions in X and Y di-rections, while the FEM does not completely fit the experimental results, especially considering the vertical component (Z direction), where this component assumes almost negligible values. A relevant over-estimation of all the forces is provided by the FEM in both cutting conditions. Also the position variation of maximum cutting force was occurred, which might be due to the spindle speed rotational error variation with actual value used for the simulations.
Numerous reasons can explain the mismatching between FEM and experiments in terms of force amplitude. Tool static deflection certainly happened due to cutting forces during cutting
opera-tion, but the FEM does not include tool static deflection. Micro end-milling was modeled in ideal conditions so the tool and spindle runout were neglected. The overestimation of the FEM predic-tion might be caused by the lack of informapredic-tion on the machined material constitutive model in-side the FEM, where only nominal material properties can be selected from the software database. Additionally, the effect of the friction coefficient is significant in cutting force prediction [25], but some lacks still exist on this aspect in micro milling FEM literature. In another study the in-fluence of coefficient of friction was evaluated for the cutting and thrust forces, the result reveals that the coefficient of friction plays an important role in determining cutting force magnitude. In facts, a friction coefficient increase causes an increase of cutting forces [23, 31]. Subsequently in this
paper 3D FE model could be evaluated with lower coefficient of friction in order to alter the cutting
forces value however, due to the very long calculation time the simulations were not repeated with different coefficient in this part of study.
The further improvements of the model are required in terms of material model. Another substi-tute material model such as Johnson-Cook (JC) [32] could be adopted with proper material con-stants for Al6061-T6. However, this is not an easy task since no specific methods exist for char-acterizing the material at the extremely high strain rates of a micro milling operation (∼105 s-1 and
more). The Split-Hopkinson pressure bar test is usually adopted in macro cutting for this task [33], but it cannot easily reach those high strain rate values.
5. Conclusions
This paper investigated the prediction capability of a 3D Finite Element Modeling approach for chip flow, burr formation and cutting forces in case of micro milling of Aluminum 6061-T6 with a 0.5 mm end mill. The effective tool geometry has been taken into account into FEM and a number of simulations have been performed at representative cutting conditions. Micro milling experiments were carried out to validate burr dimensions and cutting forces predicted by FEM. Some correlations were observed in terms of top and entrance burr size, which were affected mainly by the feed. The
proposed 3D FE model demonstrated a good matching with experiments in terms of shapes of the cutting force profiles, mainly in the feed (Fx) and transversal (Fy) directions. In terms of force
ampli-tude, an overestimation was produced. At the moment, the 3D FEM does not seem to produce a sen-sible improvement in the force prediction, however a good performance was obtained by the finite element model in terms of minimum chip thickness effect and chip shape prediction. Future studies will be devoted to better represent the constitutive behavior of the selected material and to the exten-sion of the simulation and validation for different tool geometries, by also considering the tool de-flection caused by milling forces.
Nomenclature ae : width of cut ap : depth of cut
c0-5 : coefficients for the polynomial
fit
fz : feed per tooth Fx,
Fy, Fz
: cutting force components along the machine tool axes
g(εp) : isotropic strain hardening M : strain rate sensitivity
coeffi-cient
N : strain hardening exponent
n : spindle speed
P : total amount of acquired force points
re : cutting edge radius rε : corner radius
tn : undeformed chip thickness T : temperature
vc : cutting speed
εp : plastic strain
p 0
ε : reference plastic strain
𝜀. : strain rate
𝜀-. : reference plastic strain rate θ : tool engagement angle
Θ(Τ) : fifth order polynomial function
for thermal softening
µ : friction coefficient
σ0 : initial yield stress σn : normal stress τ : frictional stress
Subscripts
i : machine tool axis index
j : prediction model index
k : acquired force point index
meas : measured
References
[1] H. Li, X. Lai, C. Li, Z. Lin, J. Miao, and J. Ni, “Development of meso-scale milling ma-chine tool and its performance analysis,” Frontiers of Mechanical Engineering in China, vol. 3, no. 1, pp. 59-65, 2008.
[2] Masuzawa, T., “State of the Art of Micromachining,” CIRP Annals Manufacturing
Tech-nology, Vol. 49, No. 2, pp. 473-488, 2000.
[3] Liu, X., DeVor, R. E., Kapoor, S. G., “An Analytical Model for the Prediction of Minimum Chip Thickness in Micromachining,” J. of Manufacturing Science and Engineering., Vol. 128, No. 2, pp. 474-481, 2005.
[4] Bao, W. Y. and Tansel, I. N., “Modeling micro-end-milling operations. Part I: analytical cutting force model,” Int. J. of Machine Tools and Manuf., Vol. 40, No. 15, pp. 2155-2173, 2000.
[5] Arrazola, P. J., Özel, T., Umbrello, D., Davies, M., Jawahir, I. S.,“Recent advances in mod-elling of metal machining processes,” CIRP Annals Manufacturing Technology., Vol. 62, No. 2, pp. 695-718, 2013.
[6] Maurel-Pantel, A., Fontaine, M., Thibaud, S., Gelin, J. C., “3D FEM simulations of shoulder milling operations on a 304L stainless steel,” Simulation Modelling Practice and Theory., Vol. 22, No. 0, pp. 13-27, 2012.
[7] Luis Rubio., Manuel De la Sen., Andrew Peter Longstaff., Alan Myers., “Analysis of Dis-crete Time Schemes for Milling Forces Control under Fractional Order Holds,” Int. J. of Precis
Eng. Manuf., Vol. 14, No. 5, pp. 735-744, 2013.
[8] Altan, T., “Modeling of high speed machining processes for predicting tool forces, stresses and temperatures using FEM simulations,” Proceedings of the CIRP International Workshop on
Modeling of Machining Operations, 1998.
[9] Özel, T. and Altan, T., “Process simulation using finite element method prediction of cutting forces, tool stresses and temperatures in high-speed flat end milling,” Int. J. of Machine Tools
Manuf., Vol. 40, No. 5, pp. 713-738, 2000.
[10] Liu, K. and Melkote, S. N., “Finite element analysis of the influence of tool edge radius on size effect in orthogonal micro-cutting process,” Int. J. of Mechanical Sciences., Vol. 49, No. 5, pp. 650-660, 2007.
[11] Nasr, M. N. A., Ng, E. G.., Elbestawi, M. A., “Modelling the effects of tool-edge radius on residual stresses when orthogonal cutting AISI 316L,” Int. J. of Machine Tools and Manuf., Vol. 47, No. 2, pp. 401-411, 2007.
[12] Afazov, S. M., Ratchev, S. M., Segal, J., “Modelling and simulation of micro-milling cut-ting forces,” J. of Materials Processing Technology., Vol. 210, no. 15, pp. 2154-2162, 2010. [13] Özel, T., Liu, X., Dhanorker, A., “Modelling and simulation of micro-milling process,”
Proceedings of the 4th International Conference and Exhibition on Design and Production of Machines and Dies/Molds, 2007.
[14] Jin, X. and Altintas, Y., “Prediction of micro-milling forces with finite element method,” J.
of Materials Processing Technology, Vol. 212, No. 3, pp. 542-552, 2012.
[15] Thepsonthi, T. and Özel T., “Experimental and finite element simulation based investiga-tions on micro-milling Ti-6Al-4V titanium alloy: Effects of cBN coating on tool wear,” J. of
Materials Processing Technology, Vol. 213, No. 4, pp. 532-542, 2013.
[16] Woon, K. S., Rahman, M., Neo, K. S., Liu, K., “The effect of tool edge radius on the con-tact phenomenon of tool-based micromachining,” Int. J. of Machine Tools and Manuf., Vol. 48, No. 12–13, pp. 1395-1407. 2008.
[17] Wu, H. B. and Zhang, S. J., “3D FEM simulation of milling process for titanium alloy Ti6Al4V,” Int. J. of Advanced Manufacturing Technology, Vol. 71, No. 5-8, pp. 1319-1326, 2014.
[18] Yang, K., Liang, Y. C., Zheng, K. N., Bai, Q. S., Chen, W. Q., “Tool edge radius effect on cutting temperature in micro-end-milling process,” Int. J. of Advanced Manufacturing
Technol-ogy, Vol. 52, No. 9-12, pp. 905-912, 2011.
[19] Thepsonthi, T. and Özel, T., “3-D finite element process simulation of micro-end milling Ti-6Al-4V titanium alloy: Experimental validations on chip flow and tool wear,” J. of Materials
Processing Technology, Vol. 221, No. 0, pp. 128-145, 2015.
[20] M. J. Chen, H. B. Ni, Z. J. Wang, and Y. Jiang, “Research on the modeling of burr for-mation process in micro-ball end milling operation on Ti–6Al–4V,” The International Journal of
Advanced Manufacturing Technology, vol. 62, no. 9-12, pp. 901-912, 2012/10/01, 2012.
[21] Advantedge, T. W. “Third Wave Advantedge,” user's manual, Version 6.2.011, Minneap-olis, USA.
[22] Man, X., Ren, D., Usui, S., Johnson, C., Marusich, T. D., “Validation of Finite Element Cutting Force Prediction for End Milling,” Procedia CIRP, Vol. 1, No. 0, pp. 663-668, 2012. [23] Davoudinejad, A., Chiappini, E., Tirelli, S., Annoni, M. and Strano, M., “Finite Element simulation and validation of chip formation and cutting force in dry and cryogenic cutting of Ti-6Al-4V,” Procedia Manufacturing, Vol. 1, pp. 728-739.
[24] Arrazola, P. J. and Özel, T., “Investigations on the effects of friction modeling in finite el-ement simulation of machining,” Int. J. of Mechanical Sciences, Vol. 52, No. 1, pp. 31-42, 2010. [25] Özel, T., “The influence of friction models on finite element simulations of machining,” Int.
J. of Machine Tools and Manuf., Vol. 46, No. 5, pp. 518-530, 2006.
[26] Kim, K. W., Lee, W. Y., Sin, H. C., “A finite element analysis for the characteristics of temperature and stress in micro-machining considering the size effect,” Int. J. of Machine Tools
and Manuf., Vol. 39, No. 9, pp. 1507-1524, 1999.
[27] Al-Qutub, A. M., Khalil, A., Saheb, N., Hakeem, A. S., “Wear and friction behavior of Al6061 alloy reinforced with carbon nanotubes,” Wear, Vol. 297, No. 1–2, pp. 752-761, 2013. [28] Lee, H. U., Cho, D. W., Ehmann, K. F., “A mechanistic model of cutting forces in micro-end-milling with cutting-condition-independent cutting force coefficients,” J. of Manuf. Science
and Eng., Vol. 130, No. 3, pp. 031102-031109, 2008.
[29] Annoni, M., Pusterla, N., Rebaioli, L., Semeraro, Q., “Calibration and validation of a mechanistic micromilling force prediction model,” J. of Manuf. Science and Eng., Vol. 138, No. 1, pp. 011001—0110012, 2016.
[30] M. Hashimura, J. Hassamontr, and D. A. Dornfeld, “Effect of In-Plane Exit Angle and Rake Angles on Burr Height and Thickness in Face Milling Operation,” Journal of Manufacturing
[31] A. Davoudinejad, 3D Finite Element Modeling of Micro End-Milling by Considering Tool Run-Out, Temperature Distribution, Chip and Burr Formation. Ph.D. Thesis, University of Politecnico di Milano, Milan, Italy, 2016.
[32] W. H. C. G.R. Johnson, "A constitutive model and data for metals subjected to large strains, high strain rates and high temperatures." Proc. 7th Int. Symp. on Ballistics, The Hague, The Netherlands, pp. 541–547. 1983.
[33] Calamaz, M., Coupard, D., Girot, F., “A new material model for 2D numerical simulation of serrated chip formation when machining titanium alloy Ti–6Al–4V,” Int. J. of Machine Tools