O R G A N I S M A L B I O L O G Y
A heritable subset of the core rumen microbiome
dictates dairy cow productivity and emissions
R. John Wallace1*†, Goor Sasson2†, Philip C. Garnsworthy3, Ilma Tapio4, Emma Gregson3,
Paolo Bani5, Pekka Huhtanen6, Ali R. Bayat4, Francesco Strozzi7‡, Filippo Biscarini7§,
Timothy J. Snelling1, Neil Saunders3, Sarah L. Potterton3, James Craigon3, Andrea Minuti5,
Erminio Trevisi5, Maria L. Callegari8||, Fiorenzo Piccioli Cappelli5, Edward H. Cabezas-Garcia6¶,
Johanna Vilkki4, Cesar Pinares-Patino4, Kateřina O. Fliegerová9, Jakub Mrázek9,
Hana Sechovcová9, Jan Kopečný9, Aurélie Bonin10, Frédéric Boyer10, Pierre Taberlet10,
Fotini Kokou2, Eran Halperin11, John L. Williams7#**, Kevin J. Shingfield4**††, Itzhak Mizrahi2***
A 1000-cow study across four European countries was undertaken to understand to what extent ruminant microbi-omes can be controlled by the host animal and to identify characteristics of the host rumen microbiome axis that determine productivity and methane emissions. A core rumen microbiome, phylogenetically linked and with a preserved hierarchical structure, was identified. A 39-member subset of the core formed hubs in co-occurrence networks linking microbiome structure to host genetics and phenotype (methane emissions, rumen and blood metabolites, and milk production efficiency). These phenotypes can be predicted from the core microbiome using machine learning algorithms. The heritable core microbes, therefore, present primary targets for rumen manipu-lation toward sustainable and environmentally friendly agriculture.
INTRODUCTION
Hosting one of the most complex microbial communities known to man, the rumen has long attracted the keen interest of microbiolo-gists. Physiologists and nutritionists also understand the pivotal role of the rumen in digesting fibrous feed and providing nutrients to the host animal. These activities enable ruminants to provide humans with foods, mainly milk and meat from nonhuman-edible plant material, including industrial by-products, and enable many rural communities worldwide to survive where arable agriculture is impossible. There is an environmental cost, however, in which rumi-nants, via their ruminal microbiome, produce substantial amounts of the greenhouse gas, methane (1). Furthermore, production
effi-ciency is linked to the composition of the ruminal microbiome, as was previously shown by an association between microbiome com-ponents and residual feed intake (2, 3). Characterizing, quantifying, and understanding the role of rumen microbiome are therefore of significant scientific, economic, and environmental interest.
The main members of the rumen microbiome are now well un-derstood. Bacteria, which usually comprise most of the species rich-ness, are widely persistent geographically across multiple ruminant species and individual animals (4), and many species can be considered symbiotic with ruminants, as they provide metabolic activities and products essential for the host (5). Ciliate protozoa, at up to about half the biomass, consist of species that occur uniquely in the rumen (6). Their community abundance and composition across ruminants are much more variable than bacteria, indeed, protozoa may be ab-sent in some animals without detrimental effect to the host (4, 7). Anaerobic fungi are fewer in number but seem to play an important role in breaking down the toughest of plant cell walls (8). Archaea are key players in methane emissions (9).
Generally speaking, the relationship between members of the microbiome and rumen function is reasonably well understood (10). A host genetics microbiome axis of control has also been im-plied in several studies (11–13), analogous to, but much less detailed than the remarkable advances in our understanding of the role of the heritability of the human gut microbiome and its role in health (14). In the present study, by applying network analysis to a com-prehensive array of microbiome, phenotype, and genotype analysis, we have made a significant contribution in transforming the descrip-tive understanding of the rumen microbiome to a predicdescrip-tive one, using an unprecedentedly large number of animals and measure-ments. It emerges, as suggested by an earlier, much more restricted study (15) that rumen function and ruminant productivity can be predicted from the abundance of a small number of microorganisms that form part of the core community across geographical breed and dietary differences. As these microbes show significant herita-bility estimates, e.g., their abundance is explained to a significant 1The Rowett Institute, University of Aberdeen, Ashgrove Road West, Aberdeen
AB25 2ZD, UK. 2Department of Life Sciences and the National Institute for Biotechnology in the Negev, Ben-Gurion University of the Negev, Be’er Sheva, Israel. 3University of Nottingham, School of Biosciences, Sutton Bonington Campus, Loughborough LE12 5RD, UK. 4Production Systems, Natural Resources Institute Finland (Luke), 31600 Jokioinen, Finland. 5Department of Animal Science, Food and Nutrition-DIANA, Università Cattolica del Sacro Cuore, 29122 Piacenza, Italy. 6Swedish University of Agricultural Sciences, Department of Agriculture for Northern Sweden, S-90 183 Umeå, Sweden. 7Parco Tecnologico Padano, Via Einstein, 26900 Lodi, Italy. 8 Insti-tute of Microbiology, Università Cattolica del Sacro Cuore, 29122 Piacenza, Italy. 9Institute of Animal Physiology and Genetics, CAS, v.v.i., Vídeňská 1083, Prague 14220, Czech Republic. 10Laboratoire d'Ecologie Alpine, Domaine Universitaire de St Martin d'Hères CNRS, 38041 Grenoble, France. 11Departments of Computer Science, Computational Medicine, Human Genetics, and Anesthesiology, University of California, Los Angeles, Los Angeles, CA 90095, USA.
*Corresponding author. Email: [email protected] (R.J.W.); [email protected] (I.M.) †Joint first authors.
‡Present address: Enterome Bioscience 94/96 Avenue Ledru-Rollin, 75011 Paris, France. §Present address: National Research Council, Institute of Biology and Biotechnology in Agriculture (CNR-IBBA), Via Bassini 15, 20133 Milan, Italy.
||Present address: Department for Sustainable Food Process –DiSTAS, Università Cattolica del Sacro Cuore, Via E.Parmense 84, 29122 Piacenza, Italy.
¶Present address: Agri-Food and Biosciences Institute, AFBI Large Park, Hillsborough BT26 6DR Co. Down, UK.
#Present address: Davies Research Centre, School of Animal and Veterinary Sciences, Faculty of Sciences, University of Adelaide, Roseworthy, SA 5371, Australia. **Joint last authors.
††Deceased.
Copyright © 2019 The Authors, some rights reserved; exclusive licensee American Association for the Advancement of Science. No claim to original U.S. Government Works. Distributed under a Creative Commons Attribution NonCommercial License 4.0 (CC BY-NC). on June 23, 2020 http://advances.sciencemag.org/ Downloaded from
extent by host genetics, opportunities for breeding programs based on the microbiome now become possible.
RESULTS
Our study cohort consisted of 1016 animals, with 816 Holstein dairy cows from two U.K. and three Italian farms. In addition, 200 Nordic Red dairy cows were sampled from Sweden and Finland. The Holsteins received a maize silage–based diet, while the Nordic Reds received a nutritionally equivalent diet based on grass silage as forage. Animals were genotyped using common single-nucleotide polymorphisms (SNPs) and measured for milk output and compo-sition, feed intake and digestibility, plasma components, methane
and CO2 emissions, and rumen microbiome based on ss rRNA gene
analysis (data S1).
The abundance and richness of the bacterial, protozoal, fungal, and archaeal communities were mutually dependent on and cor-related to multiple host phenotypes in ways that have become widely understood, including rumen metabolites, milk production indices, and plasma metabolites (see Supplementary Text and fig. S4). To focus down on host microbiome–phenotype relationships, we proceeded
to investigate (i) how many and which species were common in our large animal cohorts; (ii) if a common, or core, group could be identified; (iii) if the core was influenced by the host genome; and (iv) how the core and noncore species determined phenotypic and production characteristics.
Taxonomic analysis revealed a core group of rumen microbes [512 species-level microbial operation taxonomic units (OTUs), 454 prokaryotes, 12 protozoa, and 46 fungi] present in at least 50% of animals within each of the seven farms studied (Fig. 1A). The group comprised 11 prokaryotic orders, 1 fungal order, and 2 protozoal orders that share some similarity with published core microbial communities (data S2 to S4) (6, 15). The core group was shared between Holstein and Nordic Red dairy breeds, and the results are particularly useful because they apply to the most popular and pro-ductive milking cow breed used in developed countries, the Holstein, and the smaller breed used in northern European latitudes, the Nordic Red. The results demonstrate once again, however, that this microbial community is representative of ruminants in general, especially with respect to bacterial and protozoal species. This core community is significantly enriched in Bacteroidales, Spirochetales, and the WCHB1-41 order (Fig. 1B and data S5 to S7). The core
Bacteroidetes
Firmicutes
Proteobacteria Euryarchaeota Fibrobacteres Spirochaetes
Verrucomicrobia SR1 Tenericutes Lentisphaerae Other 0 5 10 15 20 40 45 50 55 60 % Relative abundance Microbial order Spirochaetales Bacteroidales WCHB1-41 Fibrobacterales Clostridiales Rickettsiale Methanobacteriales RF32 Aeromonadales Victivallales Unknown Anaeroplasmatales Heritable
IT1 IT2 IT3 UK1 UK2 FI1 SE1
0.0 0.2 0.4 0.6 0.8 1.0 Correlation (Spearman)
IT1 IT2 IT3 FI1 UK1 UK2SE1
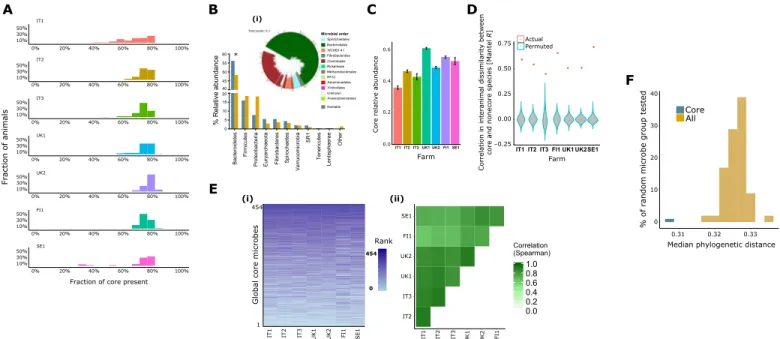
Fig. 1. A phylogenetically cohesive core rumen microbiome was found across farms with highly conserved hierarchical structure and tight association to over-all microbiome composition. (A) Core microbes are highly represented within individual animals, as a high fraction of them (>50% of the core microbes) are present in
>70% of the individuals. (B) The prokaryotic core (blue) was represented by 10 phyla of the 30 found in the overall microbiome (x axis; ochre), including 11 prokaryotic, 2 fungal, and 1 protozoal orders, detected in >50% of the individuals in each farm. *The core microbiome was significantly enriched in Bacteroidetes (enrichment analysis, Fisher exact test, after Benjamini-Hochberg correction, P < 0.0005). SR1, candidate division sulphur river 1. Core prokaryotes (i) consisted of 454 microbes, mainly from the orders Bacteroidales (tree; green) and Clostridiales (tree; maroon). Core heritable taxa are presented as gray bar plots on the tree. (C) The core microbiome composed of a large fraction of the overall microbiome, ranging between three- and two-thirds of the relative abundance, depending on the farm (x axis). Bar plots represent the mean, and error bars represent the SE of the core relative abundance. (D) Core microbiome composition is highly correlated to noncore microbes, as shown by comparing the in-teranimal dissimilarity (Bray-Curtis) matrix based on core microbes to that based on noncore microbes. Violin plots for each farm (x axis) show the correlation between the two dissimilarity matrices (core and noncore; Mantel R), where the violin (gray) describes the null model (permuted) Mantel R values, and red points depict the actual
R. (E) The core microbiome exhibits a clear hierarchical structure, in terms of microbial abundance, which agrees between farms. (i) A highly consistent core microbiome
abundance pattern (ranking) across farms (x axis) was revealed by an abundance-ranked color-coded heatmap, where species-level microbial OTUs are ordered by their mean relative abundance across all animals in the cohort (no further clustering or normalization was performed). Color coding reflects the rank abundance of a given OTU in a given individual. (ii) Heatmap showing the degree of correlation in relative abundance profiles between the farms. Color coding reflects the degree of correlation in relative abundance profiles (Spearman r; all P < 0.001). (F) Phylogenetic distances between the core microbes were smaller, showing that they are closer phylogenetically, but also distinct, compared to the overall microbiome, as it was shown by mean pairwise phylogenetic distance (x axis) calculation between core (blue) and 1000 random-ly selected noncore microbes (ochre) from the rumen (y axis; P < 0.001).
on June 23, 2020
http://advances.sciencemag.org/
microbiome consists of less than 0.25% of the overall microbial species pool (512 of 250,000 OTUs), yet it is highly abundant, representing 30 to 60% of the overall microbiome (Fig. 1C). The core group is also tightly associated with the overall microbiome, as reflected by high correlation between the beta diversity metrics of the identified core microbiome and the overall microbiome across farms (R value between 0.45 and 0.7; Fig. 1D), this strengthens the notion of strong connectivity between microbes in such a metabolically complex eco-system where multiple microbial interactions are potentially facili-tated. These core microbes show highly conserved abundance rank structure across geography, breed, and diet (Fig. 1E), where the species abundance order is kept almost identical across different individuals. Furthermore, core members are more closely related to each other than to noncore microbiome members, as indicated by differences in phylogenetic distances determined by the ss rRNA gene tree (Fig. 1F), thereby strengthening the findings from our previous study (15). Thus, this relatedness between the members of the rumen core microbiome could indicate that they are sharing a set of functional traits, integral to this environment and potentially compatible with host requirements as suggested for species relatedness in other eco-systems (16). Although the rumen microbiome contains many hundreds of species, these core species generally belong to a rather narrow section of the whole bacterial phylome (17).
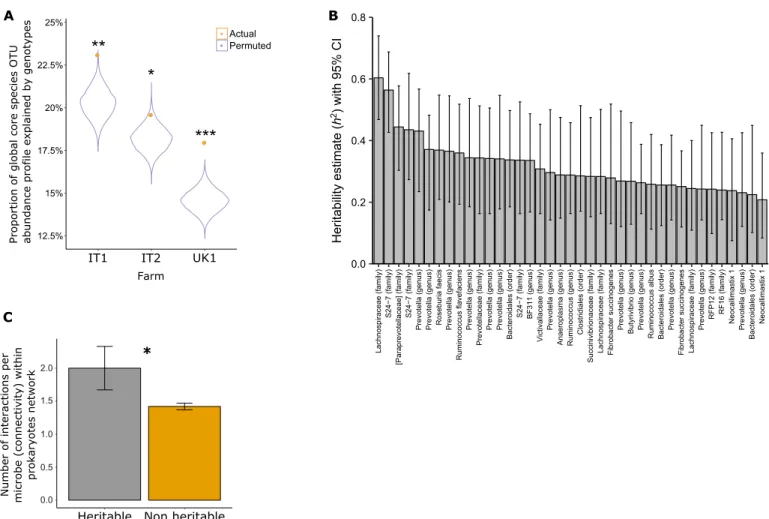
We found the core microbiome to be significantly correlated with host genetics as revealed by canonical correlation analysis (CCA), which was calculated for each farm separately (Fig. 2A). Subse-quently, a stringent heritability analysis was applied to all members of the core microbiome for each breed separately, taking into account farms and dietary components as a confounding effect (farm encom-passes other confounding effects such as location and husbandry regime; see further explanation in Supplementary Materials and Methods). Moreover, we removed one Holstein farm (UK2) from the analysis as it showed a different genetic background (UK2; fig. S2). Our heritability analysis specifically quantifies narrow sense, unlike twin-based studies where the type of heritability is not strictly de-fined (14). This is especially true for bovines where the twin rate is low, and these individuals are often born unwell, rendering them unfit for these studies. Within the Holstein-Friesian breed (n = 650, excluding 166), 39 heritable core microbial OTUs were identified, which were evenly distributed on the rank abundance curve, therefore pointing out that low-abundance species could also be connected to host genome and suggesting relevance to its requirements (fig. S1). These not only mainly belong to Bacteroidales and Clostridiales orders but also include representatives from five other bacterial phyla and two fungi of the genus Neocallimastix (Fig. 2B and data S8 and S10).
Ruminococcus and Fibrobacter are among the core heritable bacteria,
consistent with their key role in cellulolysis, as is Succinovibrionaceae, which seems to be a key determinant in between animal differences in methane emissions (18). These heritable microbial OTUs showed significant heritability estimates ranging from 0.2 to 0.6 [false dis-covery rate (FDR), P < 0.05] and revealed a twofold increase in numbers of microbial heritable species in a previous study (15) that included a smaller animal cohort. Furthermore, these highly robust findings also reinforce our previous results in relation to heritable bovine rumen microbes, which are composed of similar taxa. More-over, on the basis of the genetic relatedness matrix (GRM), the herita-bility confidence interval lower limit of all but one microbe was greater than 0.1. Only three bacteria, all with affiliations to Prevotel-laceae, were identified as highly heritable within the smaller Nordic
Red cohort. In summary, we identified almost 10 times more heritable species-level microbial OTUs than in a comparable human study (14), further substantiating the deep interaction between the bovine host and its resident rumen microbiome, presumably reflecting the greater dependence of the bovine on its gut microbiome than humans.
Overall, when microbial co-occurrence networks were inferred within individual farms (fig. S3, A to D), it became evident that heritable microbes are significantly more connected than nonheritable mi-crobes, consistent with the central positions of heritable microbes in the rumen co-occurrence networks (Fig. 2C).
The demonstration here of heritable, interacting microbes raises possibilities of breeding animals for particular microbiomes and thus phenotypic and production properties on the condition that the core can be shown to control these properties. We further inves-tigated co-occurrence networks for the core abundances relation to phenotypic outcomes.
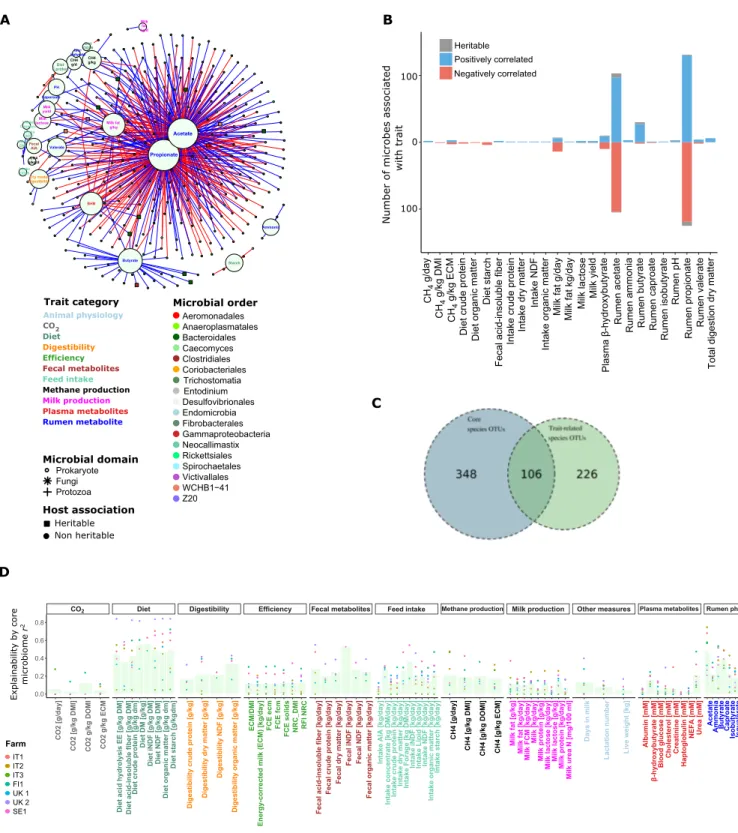
The associations found here are hugely complex (Fig. 3A), with not only 339 microbes, mostly prokaryotes, but also a handful of protozoa and fungi, associated with rumen metabolism and various host phenotypes (see also data S7). The resulting network (Fig. 3A) only included reoccurring significant correlations with the same di-rectionality (FDR < 0.05) within at least four farms when analyzed independently. As would be expected from the nutritional depen-dence of ruminants on volatile fatty acids (VFA) generated by rumen fermentation, large numbers of core microbiome members were found to be associated with traits such as ruminal acetate and pro-pionate concentration, with fewer correlated to production traits such as milk production and methane emission (204, 254, 23, and 7, re-spectively; Fig. 3B). Among those linked to methane emissions are Succinovibrionaceae, confirming what has been found previously in beef cattle (18). Compared to the overall rumen microbiome, prokaryotic members of the core microbiome are highly enriched
with trait-associated microbes [odds ratio (OR), 388; P < 2.2 × 10⁻¹⁶,
Fisher exact test between 332 trait-related and 454 prokaryotic core members; Fig. 3C], stressing the importance and central role that the core microbiome plays in host function and microbiome metabo-lism. Two distinctive machine learning algorithms were applied to predict rumen metabolism diet and host traits, based on core micro-biome composition, Ridge regression (19, 20) and random forest (RF) (21, 22), using linear regression and decision tree–based ap-proaches, respectively. This allowed us to investigate the degree of
agreement (r2) between predicted and actual values (Fig. 3D and fig. S5).
These tools highlighted the core microbiome as highly explanatory for dietary components and rumen metabolites, with propionate
approaching an agreement of r2 = 0.9 in some farms. Methane emissions
could also be explained, based on rumen microbiome composition,
with values reaching r2 = 0.4 in some farms. Moreover, although
having lower explainability, many of the host traits, including host plasma metabolites and milk composition, could be explained to an extent by the core microbiome composition (Fig. 3D). Our findings also show that core microbiome has higher prediction power than host animals’ genotype (based on the GRM), as has dietary compo-sition (fig. S5). Overall, in both machine learning algorithms, the heritable microbes exhibited, on average, a significantly higher explanatory power for host phenotypes and other experimental variables compared to other core microbes (P < 0.005, Wilcoxon paired rank-sum test; figs. S6 and S7), further underlining the central role of heritable microbes within rumen microbial ecology and to the host. The great majority of these microbes show stability in
on June 23, 2020
http://advances.sciencemag.org/
time, and only a small portion of them (39, 3 heritable and 1 trait associated) showed seasonality, and of those, most do so solely in one of the farms (fig. S8 and data S9).
DISCUSSION AND CONCLUSIONS
Here, we have shown that a small number of host-determined, herita-ble microbes make higher contribution to explaining experimental variables and host phenotypes (fig. S6) and propose microbiome-led breeding/genetic programs to provide a sustainable solution to in-crease efficiency and lower emissions from ruminant livestock. On the basis of the genetic determinants of the heritable microbes, it should be possible to optimize their abundance through selective breeding programs. A different, and perhaps more immediate, application of our data could be to modify early-life colonization, a factor that has been shown to drive microbiome composition and activity in later life (23–25). Inoculating key core species associated
with feed efficiency or methane emissions as precision probiotics approach could be considered as likely to complement the heritable microbiome toward optimized rumen function.
Our study focused on two bovine dairy breeds, but the results are likely to be applicable to beef animals and other ruminant species. Given the high importance of diet in performance and the compo-sition of the rumen microbiome, these programs should take special cognizance of likely feeding regimes. Within that context, following the overall predictive impact of identified trait-associated heritable microbes on production indices should result in a more efficient and more environmentally friendly ruminant livestock industry. MATERIALS AND METHODS
Experimental design and subject details
The primary objective of this research was to relate the animal genome to the rumen microbiome, feed efficiency, and methane
0.0 0.5 1.0 1.5 2.0 12.5% 15% 17.5% 20% 22.5% 25% Actual Permuted 0.0 0.2 0.4 0.6 0.8 Lachnospiraceae (family) S24−7 (family) [Paraprevotellaceae] (family) S24−7 (family)
Prevotella (genus) Prevotella (genus) Roseburia faecis Prevotella (genus)
Ruminococcus flavefaciens
Prevotella (genus)
Prevotellaceae (family)
Prevotella (genus) Prevotella (genus)
Bacteroidales (order)
S24−7 (family) BF311 (genus)
Victivallaceae (family)
Prevotella (genus)
Anaeroplasma (genus) Ruminococcus (genus)
Clostridiales (order)
Succinivibrionaceae (family) Lachnospiraceae (family) Fibrobacter succinogenes Prevotella (genus) Butyrivibrio (genus) Prevotella (genus)
Ruminococcus albus Bacteroidales (order) Prevotella (genus) Fibrobacter succinogenes Lachnospiraceae (family)
Prevotella (genus)
RFP12 (family) RF16 (family) Neocallimastix 1
Prevotella (genus) Bacteroidales (order) Neocallimastix 1 Heritability estimate ( h 2) with 95% CI
Fig. 2. Host genetics explains core microbiome composition with heritable microbes serving as hubs within the microbial interaction networks. The core
micro-biome is associated with animal genetics as (A) the variance in the core micromicro-biome (y axis) was significantly explained by host genetics. CCA was performed between the matrix of the first 30 microbial (OTU table) principal component scores and host genotype principal component scores based on a common SNP. The analysis was accom-plished for the largest Holstein farms in this study (x axis). (B) Heritability analysis based on the genetic relatedness matrix (GRM) showed 39 microbes (x axis) significantly correlating with the animal genotype. Heritability estimate—h2 (y axis; bar plots show mean estimate per microbe), and P values were calculated using genetics complex trait analysis (GCTA) software, followed by a multiple testing correction with Benjamini-Hochberg method. Confidence intervals (CIs; 95%) were estimated on the basis of heritability estimates and the GRM with Fast Confidence IntErvals using Stochastic Approximation (FIESTA) software. (C) Heritable microbes are central to the microbial interaction network, as revealed by the higher mean connectivity (y axis) of these microbes compared to the nonheritable ones. The interaction network was built using Sparse InversE Covariance estimation for Ecological Association and Statistical Inference (SpiecEasi). Results are presented as mean number of microbial interactions with SE. Indicated P values, *P < 0.05, **P < 0.005, ***P < 0.0005.
on June 23, 2020
http://advances.sciencemag.org/
Propionate Valerate Acetate Dry matter digestibility Milk fat g/kg BHB Butyrate CH4 g/d Starch Caporoate Intake C.protein Intake DMI Intake iNDF Intake ODMI Diet C.protein Milk fat kg/d CH4 g/kg Ammonia Diet ODMI Iso− butyrate PH Milk lactose Milk yield CH4 g/kg/d Fecal AIA * * * * + + + Aeromonadales Anaeroplasmatales Bacteroidales Caecomyces Clostridiales Coriobacteriales Trichostomatia Entodinium Desulfovibrionales Endomicrobia Fibrobacterales Gammaproteobacteria Neocallimastix Rickettsiales Spirochaetales Victivallales WCHB1−41 Z20 Prokaryote Fungi Protozoa CH 4 g/kg DMI CH 4 g/kg ECM
Diet crude protein Diet organic matter Diet starch
Fecal acid-insoluble fiber
Intake crude protein Intake dry matter
Intake NDF
Intake organic matter
Milk fat g/day Milk fat kg/day Milk lactose
Milk yield
Plasma
-hydroxybutyrate Rumen acetate Rumen ammonia Rumen butyrate Rumen caproate Rumen isobutyrate
Rumen pH
Rumen propionate Rumen valerate
Total digestion dry matter
Heritable Positively correlated Negatively correlated CH 4 g/day Farm IT1 IT2 IT3 FI1 UK 1 UK 2 SE1
CO2 Diet Digestibility Efficiency Fecal metabolites Feed intake Methane production Milk production Other measures Plasma metabolites Rumen physiology
CO2 [g/kg DMI] CO2 g/kg DOMI CO2 g/kg ECM
Diet acid hydrolysis EE [g/kg DM]
Diet crude protein [g/kg dm]
Diet DM [g/kg]
Diet iNDF [g/kg DM] Diet NDF [g/kg DM]
Diet organic matter [g/kg dm]
Diet starch [g/kgdm]
Digestibility crude protein [g/kg]
Digestibility dry matter [g/kg]
Digestibility NDF [g/kg]
Digestibility organic matter [g/kg]
ECM/DMI FCE ecm FCE fcm FCE solids NRC_DMI RFI NRC
Fecal crude protein [kg/day]
Fecal dry matter [kg/day]
Fecal iNDF [kg/day] Fecal NDF [kg/day]
Fecal organic matter [kg/day]
Intake concentrate [kg DM/day] Intake crude protein [kg/day] Intake dry matter [kg/day] Intake Forage [kg DM/day]
Intake iNDF [kg/day] Intake Lipid [kg/day] Intake NDF [kg/day]
Intake organic matter [kg/day]
Intake starch [kg/day]
CH4 [g/kg DMI]
CH4 [g/kg DOMI] CH4 [g/kg ECM] Milk fat [kg/day]
Milk FCM [kg/day]
Milk [kg/day]
Milk lactose [kg/day] Milk pr otein [kg/day] Days in milk
Lactation number Live weight [kg]
Albumin [mM] Blood glucose [mM] Cholesterol [mM] Creatinine [mM] Haptoglobulin [mM] NEFA [mM] Urea [mM] Acetate
Ammonia Butyrate Caproate Isobutyrate Isovalerate Propionate Rumen pH Total VFA
Valerate Wolin 0.0 0.2 0.4 0.6 0.8 CO2 [g/day]
Energy-corrected milk (ECM) [kg/day
]
Fecal acid-insoluble fiber [kg/day]
CH4 [g/day]
Milk fat [g/kg]
Milk urea N [mg/100 ml]
Milk protein [g/kg] Milk lactose [g/kg]
Diet acid-insoluble fiber [g/kg DM]
Intake AIA [kg/day]
-hydroxybutyrate [mM]
Fig. 3. Core rumen microbiome composition is linked to host traits and could significantly predict those traits. (A) Association analysis between microbes and host traits
revealed 339 microbes associated with at least one trait. For a microbe to be associated with a given trait, it had to significantly and unidirectionally correlate with a trait within each of at least four farms (after Benjamini-Hochberg multiple testing correction) with no farm showing a significant correlation in the opposing direction. (B) Most of the trait-associated microbes are associated with rumen propionate and acetate. (C) Enrichment analysis, using Fisher exact test, showed that the core microbes are much more present (enriched) within trait-associated microbes compared to the noncore microbiome (P < 2.2 × 10⁻¹⁶). (D) Explained variation (r2) of different host traits as function of core microbiome composition. r2 estimates were derived from a machine learning approach where a trait value was predicted for a given animal using the Ridge regression that was constructed from other animals in the farm (leave-one-out k-fold regression). Thereafter, prediction r2 value was calculated between the vectors of observed and predicted trait values. Indicated host traits were significantly explained (via prediction) by core microbe (OTU) abundance profiles. Dots stand for individual farms’ prediction r2, while bar heights represent mean of individual farms’ r2. DMI, dry matter intake; ECM, energy-corrected milk; NDF, neutral-detergent fiber; DM, dry matter; BHB, -hydroxybutyrate.
on June 23, 2020
http://advances.sciencemag.org/
emissions in lactating dairy cows. The following research questions were specified at the outset: Does host genetics have a significant effect on the overall microbiome composition and to what extent? How consistent is the rumen microbiome across geographic loca-tions, breeds, and diets? On discovery of a heritable core rumen microbiome, the following additional research questions arose: Do heritable rumen microbes interact with the rest of the core rumen microbes? How do heritable microbes integrate in the overall microbe host phenotype interaction network?
The objectives were addressed in an observational study involving collection of phenotypic data describing animal metabolism, diges-tion efficiency, and emissions of methane and nitrogen. Samples of rumen digesta and blood were collected for molecular analysis and subsequent statistical analysis to identify correlations and genetic associations. Precise power calculations to determine the size of study population necessary were difficult, as for this new area of research, the size and architecture of the genetic effect were unknown. In addi-tion, variations during life cycle, e.g., age and stage of lactaaddi-tion, together with nutrition environmental factors would play a role in overall variations. After considering levels of variation encountered in similar studies, we considered that, with 1000 individuals, using standardized measurements and keeping them under standardized conditions, it would certainly be possible to identify major genetic loci affecting the target traits from a genome-wide association study. The final population sampled was 1016 cows to allow a small margin in case any individuals or samples had to be excluded.
Prospective inclusion criteria for animal selection were that cows must be between 10 and 40 weeks postpartum, had received the standard diet for at least 14 days, and had no health issue in the current lactation. Prospective data exclusion criteria were missing samples (e.g., milk, blood, rumen, and feces), sample processing issues (e.g., inadequate DNA yield, assay problems, and laboratory mishaps), and implausible outliers. Statistical outliers were defined as values greater than three SDs from the mean. All statistical outliers were investigated, calculations were corrected, or assays were repeated where appropriate. Otherwise, outliers were retained for data analy-sis unless they were implausible. Data for any excluded sample were omitted, but the remaining data for the individual were retained.
Six milk samples were missing due to a faulty sampling device, and one blood sample was missing from a cow that could not be sampled. Two rumen fluid samples were lost during laboratory analysis. Two estimates of feed intake were considered implausible (200% of expected) due to abnormal fecal alkane values.
Animal work was conducted by four research teams in the United Kingdom (UK), Italy (IT), Sweden (SE), and Finland (FI). Ethical approval was granted by the relevant local and national authorities and committees before sampling commenced at each center (permit numbers: FI, ESAVI/8182/04.10.03/2012; IT, 25906/13; SE, A143-12; UK, 40/3324 and 30/3201). In total, 1016 cows on seven farms were sampled, and associated data were collected. The UK sampled 409 cows on two farms (UK1, N = 243; UK2, N = 164); IT sampled 409 cows on three farms (IT1, N = 185; IT2, N = 176; IT3, N = 48); SE sampled 100 cows on one farm (SE1); and FI sampled 100 cows on one farm (FI1).
Experimental protocols for measuring animal phenotypes were agreed before sampling commenced. Recordings and collection of biological samples were performed over a 5-day period for each cow that had received the standard diet for at least 14 days. To reach 1016 cows, sampling was conducted over a period of 26 months in 78 sessions between 1 and 40 cows per session. At time of recording
and sampling, all cows were in established lactation (between 10 and 40 weeks postpartum) when energy balance is close to zero and methane output is relatively stable (26). Implementation of methodology varied between centers due to facilities available on different farms. In each case, we chose the most accurate method appropriate for the circumstances while ensuring that methods produced comparable results across all farms.
Method details
Housing and feeding systems
Cows on all farms were group-housed in loose housing barns, except in FI where cows were housed in individual standings during the sampling period. To minimize environmental variation, all cows were offered diets that were standardized within farms, i.e., all cows on a farm were fed on the same diet at any sampling period, and any changes to diet formulation when batches of forage changed were made at least 14 days before sampling commenced. Diets were based on maize silage, grass silage or grass hay, and concentrates in the UK and IT and were based on grass silage and concentrates in SE and FI (table S1). Diets were fed as ad libitum total-mixed rations (TMRs) in IT, SE, and FI and as ad libitum partial-mixed rations (PMRs) plus concentrates during robotic milking in the UK. The PMRs and TMRs were delivered along feed fences in the UK and IT, and TMRs were delivered into individual feed bins in SE and FI.
Milk and body weight recording
Milk yield was recorded at every milking, and daily mean was calcu-lated for each cow. Cows were milked twice daily in herringbone parlors in IT and SE, twice daily at their individual standings in FI, and in automatic milking stations (Lely Astronaut A3, Lely UK Ltd., St. Neots, UK), on average, 2.85 times per day, in the UK.
Milk samples were collected from each cow at four milkings during the sampling period, preserved with Broad Spectrum MicroTabs II containing bronopol and natamycin (D & F Control Systems Inc., San Ramon, CA) or bronopol (Valio Ltd., Finland) and stored at 4°C until analyzed. Milk samples were analyzed for fat, protein, lactose, and urea concentrations using mid-infrared instruments [FOSS MilkoScan (FOSS, Denmark) or similar]. Mean concentrations of milk components were calculated by weighting concentrations propor-tionally to respective milk yields from evening and morning milkings. Body weight was recorded three (SE) or two (IT and FI) times during each sampling period and automatically at each milking in the UK. Mean body weight was calculated for each cow.
Feed intake measurement and estimation
Feed intake was recorded individually on a daily basis throughout each sampling period using roughage intake control (RIC) feeders (Insentec B.V., Marknesse, the Netherlands) in SE and manually in FI. Feed intake was estimated using indigestible markers (alkanes) in feed and feces (27) in the UK and IT. Alkanes (C30 and C32) were administered via concentrates fed during milking in the UK and via a bolus gun, while cows were restrained in locking head yokes during feeding in IT. Validation of the alkane method for estimating feed intake was provided by concurrent direct measure-ment of individual feed intake in 50 cows in the UK via RIC feeders (Fullwood Ltd., Ellesmere, UK) and by applying the method to individually fed cows in a research herd in IT (28).
Collection of rumen samples
The method of sampling rumen fluid was standardized at all centers and involved using a ruminal probe specially designed for cattle (ruminator; profs-products.com). The probe comprises a perforated
on June 23, 2020
http://advances.sciencemag.org/
brass cylinder attached to a reinforced flexible pipe, a suction pump, and a collection vessel. The brass cylinder was pushed gently to the back of a cow’s mouth, and gentle pressure was applied until the device was swallowed as far as a ring on the pipe that indicates correct positioning in the rumen. The first liter of rumen fluid was discarded to avoid saliva contamination, and the next 0.5 liters was retained for sampling. The device was flushed thoroughly with tap water be-tween cows.
Rumen fluid samples were collected on day 1 during the sam-pling period between 2 and 5 hours after feed was delivered to cows in the morning. For all samples, pH of rumen fluid was recorded immediately. After swirling, four aliquots of 1 ml each were pipetted into freeze-resistant tubes (2-ml capacity), immediately frozen in liquid nitrogen or dry ice, stored at −80°C, and freeze-dried within 1 month from the sampling date. Four additional aliquots of 2.5 ml were pipetted into centrifuge tubes with 0.5 ml of 25% metaphos-phoric acid for VFA and ammonia-N analysis, centrifuged at 1000g for 3 min, and the supernatant was transferred to fresh tubes. Tubes were sealed and frozen at −20°C until laboratory analysis.
Rumen VFA measurement
VFA concentrations were determined by gas chromatography using the method of Playne (29). Ammonia-N concentration was deter-mined by a photometric test with a Clinical Chemistry Autoanalyzer using an enzymatic ultraviolet method (e.g., Randox Laboratories Ltd., Crumlin, UK).
DNA extraction
Total genomic DNA was isolated from 1 ml of freeze-dried rumen samples according to Yu and Morrison (30). This method combines bead beating with the column filtration steps of the QIAamp DNA Stool Mini Kit (Qiagen, Hilden, Germany).
Amplicon sequencing
Primers for polymerase chain reaction (PCR) amplification of bacte-rial and archaeal 16S rRNA genes, ciliate protozoal 18S rRNA genes, and fungal ITS1 genes were designed in silico using ecoPrimers (31), the OBITools software suite (32), and a database created from sequences stored in GenBank (table S2). For each sample, PCR amplifications were performed in duplicate. An 8-nucleotide tag unique to each PCR duplicate was attached to the primer sequence to enable the pooling of all PCR products for sequencing and the subsequent assignation of sequence reads to their respective samples. PCR amplicons were combined in equal volumes and purified using a QIAquick PCR purification kit (Qiagen, Germany). After library preparation using a standard protocol with only five PCR cycles, amplicons were sequenced using the MiSeq technology from Illumina (Fasteris, SA, Geneva, Switzerland), which produced 250–base-paired end reads for all markers, except for the archaeal marker, which was sequenced with the HiSeq technology from Illumina, generating 100–base-paired end reads.
Methane and CO2 emission measurement
Methane was measured using breath sampling either during milk-ing in the UK (33) or when cows visited a bait station in IT and SE (GreenFeed) (34). Methane was measured in FI by housing cows in respiration chambers for 5 days (35). Carbon dioxide was measured simultaneously with methane in IT, SE, and FI.
Blood sampling and analysis
Blood samples were collected at the same time as rumen sampling using jugular venipuncture and collection into evacuated tubes (Vacutainer). One tube containing lithium heparin or Na-EDTA as anticoagulant was collected for metabolic parameters, and two tubes
containing sodium citrate were collected for genotyping. Tubes were gently inverted 8 to 10 times following collection to ensure optimal additive activity and prevent clotting. Tubes were chilled at 2° to 8°C immediately after collection by placing in chilled water in a fridge or in a mixture of ice and water. Tubes collected for metabolic pa-rameters were centrifuged for 10 to 15 min (3500g at 4°C), and the plasma obtained was divided into four aliquots. Blood samples col-lected for genotyping were not centrifuged. All samples were stored at −20°C until analyzed.
Plasma non-esterified fatty acids, -hydroxybutyrate, glucose, albumin, cholesterol, urea, and creatinine were analyzed at each center using commercial kits (Instrumentation Laboratory, Bedford, MA, USA; Wako Chemicals GmbH, Neuss, Germany; and Randox Labo-ratories Ltd., Crumlin, UK). Blood samples from each center were sent to IT for haptoglobulin determination, according to the method of Skinner et al. (36).
Quantitative PCR of 16S and 18S rRNA genes
DNA was diluted to 0.1 ng/l in herring sperm DNA (5 g/ml) for amplification with universal bacterial primers UniF (GTGSTG-CAYGGYYGTCGTCA) and UniR (ACGTCRTCCMCNCCTTCCTC) (37) and 1 ng/l in herring sperm DNA (5 g/ml) for amplification of other groups (38). Quantitative PCR was carried out using a BioRad CFX96 as described by Ramirez-Farias et al. (39). Amplifi-cation of archaeal 16S RNA genes was carried out using the primers Met630f (GGATTAGATACCCSGGTAGT) and Met803r (GTT-GARTCCAATTAAACCGCA) as described by Hook et al. (40) and calibrated using DNA extracted from Methanobrevibacter smithii PS, a gift from M. P. Bryant (University of Illinois). For total bacteria amplification, efficiency was evaluated using template DNA from
Roseburia hominis A2-183 (DSM 16839T). Amplification of protozoal
18S rRNA gene was carried out using primers 316f (GCTTTCGWT-GGTAGTGTATT) and 539r (CTTGCCCTCYAATCGTWCT) (41) and calibrated using DNA amplified from bovine rumen digesta with primers 54f and 1747r (41). Bacterial abundance was calculated from
quadruplicate Ct values using the universal bacterial calibration equation.
Bovine genotyping
From blood samples, genomic DNA was extracted and quantified for SNP genotyping. All animals were genotyped on the Bovine GGP HD (GeneSeek Genomic Profilers). The 200 cows coming from FI and SE were genotyped using the Bovine GGP HD chip v1 (80K) that included 76.883 SNPs, while the 800 samples from the UK and IT were genotyped using the Bovine GGP HD chip v2 (150K) that included 138.892 SNPs, as the v1 of the chip was no longer available from the manufacturer. The v2 of the chip includes all the SNPs that were present in the previous v1 of the chip, while, at the same time, providing more markers for the same final pro-cessing cost. The Neogen Corporation performed the DNA hybrid-ization, image scanning, and data acquisition of the genotyping chips according to the manufacturer’s protocols (Illumina Inc.) All individuals had a call rate higher than 0.90 (93.5% of individuals with call rate higher than 0.99). More than 99% of SNPs had a call rate higher than 0.99 (93.2% of SNPs with call rate higher than 0.99). Minor allele frequency (MAF) distribution evidences more than 90% of markers with a MAF > 5% and nearly 4% of monomorphic SNPs. Quantification and statistical analysis
Statistical methods and software used are detailed in subsequent sections, figure legends, and Results. Statistical significance was de-clared at P < 0.05, P < 0.01, and P < 0.001, as appropriate.
on June 23, 2020
http://advances.sciencemag.org/
Utilization of primer sets derived microbiome data in the statistical analysis
Associations of microbial domain richness were based on amplicon sequencing data from the following primer sets: Bact (bacteria), Arch (archaea), Neoc (fungi), and Cili (protozoa). Associations of individual microbes (as species-level OTUs) were based on amplicon sequencing data from the following primer sets: ProkA (bacteria and archaea), Neoc (fungi), Cili (protozoa).
Converting OBITools intermediate fasta files to QIIME ready format
Amplicon sequences were initially processed with OBITools (32), which removed barcodes and split each sample from each of the two sequencing rounds into an individual FASTQ file. Within each domain’s amplicon sequences, individual sample sequences from both rounds were then pooled together into a single FASTQ file in the format required for further processing in QIIME (quantitative in-sights into microbial ecology) (42) for picking an OTU. In detail, the header of each FASTQ entry was appended with a prefix fol-lowing the format [round_id] [sample_id][running_number] [space]. Clustering of microbial marker gene amplicon sequences and picking representative de novo species OTU
The marker gene sequences coming from each domain’s primer set (Archaea, Bacteria, Prokaryote, Ciliate, protozoa, and Fungi) were clustered using the 97% nucleotide sequence similarity threshold, using the UCLUST algorithm (43), following the QIIME command:
pick_otus.py -m uclust -s 0.97). Representative OTUs for each OTU
cluster were chosen with QIIME command pick_rep_set.py -m most_
abundant.
Assigning taxonomy to OTU
The OTU within each domain was assigned taxonomy using the Ribosomal Database Project classifier (44), following the QIIME command assign_taxonomy.py -m rdp. The OTUs from the ampli-con domains of Prokaryotic, Archaea, and Bacteria were assigned taxonomy according to Greengenes database (45). The OTUs from Ciliate protozoa were assigned taxonomy according to the SILVA data-base; release 123 (46). Fungal OTUs were assigned taxonomy according to a Neocallimastigomycota ITS1 database from Koetschan et al. (47). Creation of OTU tables and sample subsetting
and subsampling
Amplicon domain OTU tables were created from the representative OTU set counts in each sample along with their assigned taxonomy, using QIIME command make_otu_table.py. Each OTU table was then subsetted to include only the sample from each animal (of the two samples sequenced in two different sequencing rounds) that gained the highest sequence depth. Furthermore, amplicon domain OTU tables were subsampled to a 7000-read depth for all analyses, with the following exceptions: domain richness (8000 reads) and microbe abundance to trait association (8000 reads) and interdomain micro-bial interaction analysis, where no subsampling was taking place. Correlating microbial domain cell count
The quantitative PCR–derived microbial counts in each domain were correlated to each other using Spearman r correlation using R (48) cor function. The P values for all interdomain correlations within each farm were corrected using Bonferroni-Hochberg (BH) (49) procedure.
Correlating microbial domain cell counts to experimental variables
Within each farm, each experimental variable was correlated to each microbial domain’s cell count (Spearman r). Next, the analysis proceeded only with experimental variable—domain count pairs whose correlation direction was identical in all farms. Subsequently,
P values for the correlation of the selected experimental variable—
domain cell count pairs from within each farm were combined by meta-analysis using the weighted sum of z procedure (50, 51), weighted by the farm size. Meta-analysis was carried by using R package metap (52). Last, combined P values were corrected using the BH procedure.
Correlating microbial domain richness to experimental variables
Separately within farms, each experimental variable was correlated to each microbial domain’s richness, as observed species count (Spearman r), using domain-specific primers. Next, the analysis proceeded only with experimental variable—domain richness pairs whose correlation direction was identical in all farms. Subsequently,
P values for the correlation of the selected experimental variable—
domain richness pairs from within each farm were combined by meta-analysis using the weighted sum of z procedure, weighted by the number of cows on each farm.
Meta-analysis was carried by R package metap (52). Last, combined
P values were corrected using the BH procedure.
Prediction of phenotypes and other experimental variables by core microbiome
The abundances of the core microbes within each farm were used as features fed into a Ridge regression (19) to predict each of the traits (separately). Our approach followed a k-fold cross-validation method-ology (k = 10), where each fold was omitted once from the entire set and the model built from all the other folds (training set) was used to predict the trait value of the excluded samples (animal). This was implemented using the function cv.glmnet ( = 0, k = 10) from the
GLMNET R package (20). Then, the overall prediction r2 was
calcu-lated using R code 1- model_fit$cvm[which(model_fit$glmnet.
fit$lambda == model_fit$lambda.min)] / var(exp_covar). Cross-
validation procedure was repeated 100 times, and R2 measurements
were averaged.
Prediction of phenotypes by core microbiome while correcting for diet
To estimate the phenotypic variability explained by core microbes with omission of diet components effect, we repeated the analysis above with one difference. That is, before running the regression, both phenotypic values and microbial OTU counts were corrected for diet. In detail, a Ridge regression (19) was used on the basis of diet components as independent variables and the phenotype or OTU as the dependent variable. Thereafter, the phenotype residuals (diet predicted phenotype − actual phenotype) and OTU residuals (diet predicted OTU count − actual OTU count) were used to feed the GLMNET function (20).
Prediction of phenotypes by diet components
Diet components within each farm were used as features fed into a Ridge regression (19) to predict each of the phenotypes (separately). Our approach followed a k-fold cross-validation methodology (k = 10),
on June 23, 2020
http://advances.sciencemag.org/
where each fold was omitted once from the entire set and the model built from all the other folds (training set) was used to predict the trait value of the excluded samples (animal). This was implemented using the function cv.glmnet ( = 0, k = 10) from the GLMNET R
package (20). Then, the overall prediction r2 was calculated using R
code 1- model_fit$cvm[which(model_fit$glmnet.fit$lambda == model_
fit$lambda.min)] / var(exp_covar). Cross-validation procedure was
repeated 100 times, and R2 measurements were averaged.
Prediction of phenotypes and other experimental variables by core microbiome using RF
As an additional analysis to further verify our findings of core microbiome explainability (by prediction) of host phenotypes and experimental variables, we repeated that analysis using RF regression.
The abundances of the core microbes within each farm were used as features fed into a RF regression model (21, 22) to predict each of the traits (separately). Our approach followed a leave-one-out cross-validation methodology where, in each iteration, one sample (animal) was omitted from the entire set, and the model built from all the other animals (training set) was used to predict the trait value
of the excluded sample (animal). Thereafter, the prediction R2 value
between vector of actual and predicted values was calculated using
R CARET package function R2.
Bovine genotype quality control
Genotypes of the two breed types were processed independently. Genotypes were first subjected to quality control (QC) filtering including 5% minor frequency allele, 5% genotype missingness, and 5% individual missingness, following PLINK (53) command
plink --noweb --cow --maf 0.05 --geno 0.05 --mind 0.05. The QC for the
genotypes used for association/heritability analysis (Holstein excluding farm UK2) resulted with 5377 SNPs failed missingness, 14,119 SNPs failed frequency, and 48 of 635 individuals were removed for low genotyping, resulting with 587 individuals and 121,066 remaining. Testing association of the global rumen prokaryotic core with host genetics
Within each farm, the first 30 principal components (PCs) for core OTU were extracted (R prcomp). In addition, first genotype PCs were extracted using R snpgdsPCA (54). Then, CCA (55) was per-formed between the matrices of OTU PCs and genotype PCs, and total fraction of OTU variance accounted for genotype variables through all canonical variates were calculated. This actual value was than compared to that of 1000 random permutations, where the order of phenotype PCs was shuffled.
Creation of genetic relationship matrix
A genetic relatedness matrix (GRM) was created including all Holstein animals except farm UK2, (56), using the command
gcta64 --make-grm-bin --make-bed --autosome- num 29 --autosome.
Heritability estimation
For estimating OTU heritability, the core microbe counts were quantile-normalized and were then provided to genetics complex trait analysis (GCTA) to estimate phenotypic variance explained by all SNPs with genome-based restricted maximum likelihood (GREML) method (56, 57), with farms as qualitative covariates and the first five GRM PCs and diet components as quantitative covariates, follow-ing the GCTA command gcta64 --reml –pheno [phenotype_file] –
mpheno [phneotype_index] --grm --autosome-num 29 –covar [farms_ covars_file] --qcovar [quant_covariates_file].
Heritability confidence interval estimation
Heritability confidence intervals at 95% were estimated on the basis of the heritability estimates and the GRM using the GRM eigenvalues and farms as covariates with the program FIESTA (Fast Confidence IntErvals using Stochastic Approximation) (58). The command used was fiesta.py --kinship_eigenvalues [GRM_eigenvalues_file] --kinship_
eigenvectors [GRM_eigenvectors_file] --estimates_filename [heritability_ estimates_file] --covariates [farms_covariate_file] --confidence 0.95 --iterations 100 --output_filename [otu_file].
Bovine genome SNPs—Microbe association effort
Microbial species-level OTU phenotypes within the Holstein subset (excluding the UK2 cohort that showed a different genetic makeup by genotype principal components analysis and ADMIXTURE ancestral background analysis) relative abundance data were trans-formed using quantile normalization. Moreover, the top five genotype PCs and the farm identity were used as a continuous and categorical covariate, respectively. The analysis was performed with the mixed linear model option (mlma) where the SNP under inspection was accounted as fixed effect along with the covariates and GRM effect as random. No association P value surpassed the Bonferroni
corrected significance threshold (9.076876 × 10⁻¹⁰) for the number
of phenotypes (455) and the number of SNPs included in the asso-ciation analysis (121,066).
Estimating kinship matrix
Farm wise animal genetic kinship matrices as estimated on the basis of genomic relatedness were inferred from common SNPs that were filtered in after the above quality control procedure. The tool used for the estimation was EMMA expedited (EMMAX)(59), with the following command line: emmax-kin-intel64 -v -M 10 farm_genotypes_
tped_file -o farm.hBN.kinf.
Genomic prediction
Genomic prediction was performed on the basis of each farm’s kinship matrix. The genome association and prediction integrated tool (GAPIT) (60) tool was used to predict phenotypic values, with the function
GAPIT (parameters PCA.total=3, SNP.test=FALSE). creareFolds
com-mand from R caret package (61) was used to create three folds, where, in each one, fold observations are omitted and are predicted by the
model built from the remaining two folds. R2 is estimated between the
observed, and predicted trait values were then correlated using caret
R2 function. The process was repeated 10 times for a given trait in
a given farm, and mean of all measurements was then calculated. Associating microbes’ abundance with
experimental variables
Separately for each farm and domain, OTUs occupying more than 10% of the animals in that farm were pairwise-correlated (Spearman) to each of the experimental variables. Following that, all P values re-sulted from correlation tests within a given domain and farm were subjected to multiple testing correction using the BH procedure. Last, an OTU that showed a significant correlation (corrected P < 0.05) to a certain experimental variable in most (>3) of the farms with same r coefficient sign and no significant correlation with opposite r sign in the remaining farms was identified as associated with that variable.
on June 23, 2020
http://advances.sciencemag.org/
Inference of microbial interaction network within domains Within each domain and farm, an OTU table with a subset of samples (animals) that contain a depth of at least 5000 reads was created, followed by removal of OTUs present in <50% of animals. The raw counts in the OTU table were fed into the R SpiecEasi (Sparse InversE Covariance estimation for Ecological Association and Statistical Inference) (62) framework, and edges were identified using spiec.easi function (“mb” method). Edges were given weights using symBeta function as suggested by the package authors. Thereafter, the resulting network was filtered to include only edges whose absolute weight was greater than 0.2. Last, all individual farms within a certain domain were merged, and edges connecting nodes (microbes) with the same taxonomic annotation were re-moved.
Inference of interdomain microbial network
Within each farm, OTUs from different domains were correlated to each other using Spearman correlation, followed by BH correction for all the correlations examined at the farm and filtering in correla-tions with corrected P < 0.05. Then, significant correlacorrela-tions were aggregated from all farms. Last, correlations with correlation coeffi-cient r < 0.5 were removed.
Comparing phylogenetic relatedness of core prokaryotic microbes to random sampling
Multiple sequence alignment between all core prokaryotic microbes was calculated using multiple alignment using fast fourier transform (MAFFT) (63, 64) with default parameters. A phylogenetic tree–based distance matrix was obtained from aligned sequences using FastTree (65, 66), following the command fasttree -nt -makematrix. Thereafter, the median phylogenetic between core microbes was calculated.
Next, random sets (n = 100) of OTU sequences were subjected to the same procedure. The P value was calculated as P = [I(mcsd > mrsd) +1]/101, where mcsd represents median core phylogenetic distance and mrsd represents a vector of median phylogenetic distances cal-culated for the randomly sampled set.
Examining core and trait-related microbiome for taxonomic enrichment
The OR of each prokaryotic order appearing in the examined group (either core microbiome or trait-related microbiome), between the examined group and the whole prokaryotic microbiome catalog, was calculated. Next, orders showing an OR > 1 (higher in the examined group) were filtered in. Last, the OR P value was calculated (Fisher exact test, two-tailed) and corrected using the BH procedure. Comparing heritable microbes to other core miocrobes’ ability to explain experimental variables
To compare the ability of heritable microbes versus other core microbes to explain the experimental variables, we used Ridge regression to fit the heritable microbes as independent variables and the experimental variable as the predictable variable. We
then contrasted this R2 value with other 100 R2 values achieved
from random samples of nonheritable core microbes of same size (39 random microbes). Ridge regression was performed by
the R glmnet package. We then compared the R2 of heritable
microbes to the mean R2 of nonheritable core microbes for all
the experimental variables altogether, using a paired Wilcoxon rank-sum test.
Seasonality test
In each farm, core microbes were corrected for diet. Thereafter, the samples in the farm were partitioned into two groups, winter (fall equinox to spring equinox) and summer (spring equinox to fall equinox). Then, each microbial OTU abundance was compared using Wilcoxon rank-sum test that was used to test for the difference between the abundance of the given OTU between the two seasons, followed by a multiple comparison correction using the Bonferroni method. Core microbial OTUs with corrected P < 0.05 in at least one farm were considered as showing a seasonal association.
SUPPLEMENTARY MATERIALS
Supplementary material for this article is available at http://advances.sciencemag.org/cgi/ content/full/5/7/eaav8391/DC1
Supplementary Materials and Methods
Supplementary Text. Interactions between main categories of ruminal microbes in abundance, diversity, and animal phenotype.
Fig. S1. Rank abundance plot for core microbes along farms.
Fig. S2. Overview of genetic components along the Holstein cohort and host SNP-microbe association effort.
Fig. S3. Microbial species interaction within and between domains.
Fig. S4. Species richness and abundance of rumen microbial domains reveal ecological interactions and connection to host traits.
Fig. S5. Host genetics, core microbiome composition, and diet shape the host phenotypic landscape.
Fig. S6. Heritable microbes tend to explain experimental variables better in comparison to nonheritable core microbes.
Fig. S7. Explained variation (r2) of different host traits as function of core microbiome
composition, according to RF prediction model.
Fig. S8. The vast majority of core microbes do not show a seasonal association, and evidence for seasonality usually does not repeat in more than one farm.
Table S1. Average diet formulations and composition on each farm. Table S2. Conditions for quantitative PCR.
Data S1. Animals used in the experiment together with diet, measured phenotypes, and other experimental variables.
Data S2. Presence of bacterial taxonomic groups that were found to be most abundant in Henderson et al. (6) and appear also in the current study.
Data S3. Presence of archaeal taxonomic groups that were found to be most abundant in Henderson et al. (6) and appear also in the present study.
Data S4. Presence of protozoal taxonomic groups that were found to be most abundant in Henderson et al. (6) and appear also in the present study.
Data S5. Summary of abundance and occupancy of the core microbial species (prokaryotes, fungi, and protozoa).
Data S6. Heritable microbes.
Data S7. Microbes associated with phenotypic traits.
Data S8. Closest representative sequenced genomes for heritable microbes. Data S9. Season-affected microbes.
Data S10. Animal genotypes (SNP values). References (67–70)
REFERENCES AND NOTES
1. H. Steinfeld, P. Gerber, T. Wassenaar, V. Caste, M. Rosales, C. de Haan, Livestock’s Long
Shadow (FAO, 2006).
2. P. R. Myer, T. P. Smith, J. E. Wells, L. A. Kuehn, H. C. I. Freetly, Rumen microbiome from steers differing in feed efficiency. PLOS ONE 10, e0129174 (2015).
3. S. K. Shabat, G. Sasson, A. Doron-Faigenboim, T. Durman, S. Yaacoby, M. E. Berg Miller, B. A. White, N. Shterzer, I. Mizrahi, Specific microbiome-dependent mechanisms underlie the energy harvest efficiency of ruminants. ISME J. 10, 2958–2972 (2016).
4. A. G. Williams, G. S. Coleman, The Rumen Microbial Ecosystem (Chapman & Hall, 1997). 5. I. Mizrahi, The Prokaryotes (Springer Berlin Heidelberg, 2013).
6. G. Henderson, F. Cox, S. Ganesh, A. Jonker, W. Young; Global Census Collaborators, P. H. Janssen, Rumen microbial community composition varies with diet and host, but a core microbiome is found across a wide geographical range. Sci. Rep. 5, 14567 (2015).
7. C. J. Newbold, G. de la Fuente, A. Belanche, E. Ramos-Morales, N. R. McEwan, The role of ciliate protozoa in the rumen. Front. Microbiol. 6, 1313 (2015).
8. R. J. Gruninger, A. K. Puniya, T. M. Callaghan, J. E. Edwards, N. Youssef, S. S. Dagar, K. Fliegerová, G. W. Griffith, R. Forster, A. Tsang, T. McAllister, M. S. Elshahed, Anaerobic fungi (phylum Neocallimastigomycota): Advances in understanding their taxonomy, life
on June 23, 2020
http://advances.sciencemag.org/