2017
Publication Year
2020-10-06T10:59:59Z
Acceptance in OA@INAF
The 2008 outburst in the young stellar system Z CMa. III. Multi-epoch high-angular
resolution images and spectra of the components in near-infrared
Title
Bonnefoy, M.; Chauvin, G.; Dougados, C.; Kóspál, Á.; Benisty, M.; et al.
Authors
10.1051/0004-6361/201628693
DOI
http://hdl.handle.net/20.500.12386/27627
Handle
ASTRONOMY & ASTROPHYSICS
Journal
597
Number
DOI:10.1051/0004-6361/201628693 c ESO 2017
Astronomy
&
Astrophysics
The 2008 outburst in the young stellar system Z CMa
III. Multi-epoch high-angular resolution images and spectra of the components
in near-infrared
M. Bonnefoy
1, 2, G. Chauvin
1, 2, C. Dougados
1, 2, Á. Kóspál
3, M. Benisty
1, 2, G. Duchêne
1, 2, 4, J. Bouvier
1, 2,
P. J. V. Garcia
5, E. Whelan
6, S. Antoniucci
7, and L. Podio
81 Univ. Grenoble Alpes, IPAG, 38000 Grenoble, France
e-mail: [email protected]
2 CNRS, IPAG, 38000 Grenoble, France
3 Konkoly Observatory, Research Centre for Astronomy and Earth Sciences, Hungarian Academy of Sciences, PO Box 67,
1525 Budapest, Hungary
4 Astronomy Department, UC Berkeley, 501 Campbell Hall, Berkeley CA 94720-3411, USA
5 Universidade do Porto, Faculdade de Engenharia, Rua Dr. Roberto Frias, s/n, 4200-465 Porto, Portugal 6 Department of Experimental Physics, National University of Ireland Maynooth, Maynooth, Co. Kildare, Ireland 7 INAF–Osservatorio Astronomico di Roma, via Frascati 33, 00078 Monte Porzio Catone, Italy
8 INAF–Osservatorio Astrofisico di Arcetri, L.go E. Fermi 5, 50125 Firenze, Italy
Received 11 April 2016/ Accepted 12 June 2016
ABSTRACT
Context.Z CMa is a complex pre-main sequence binary with a current separation of 110 mas, known to consist of an FU Orionis
star (SE component) and an embedded Herbig Be star (NW component). Although it represents a well-studied and characterized system, the origin of photometric variabilities, the component properties, and the physical configuration of the system remain mostly unknown.
Aims.Immediately when the late-2008 outburst of Z CMa was announced to the community, we initiated a high angular resolution
imaging campaign aimed at characterizing the outburst state of both components of the system in the near-infrared.
Methods.We used the VLT/NACO and the Keck/NIRC2 near-infrared adaptive optics instrument to monitor the astrometric position
and the near-infrared photometry of the Z CMa components during the outburst phase and one year after. The VLT/SINFONI and Keck/OSIRIS integral field spectroscrographs were in addition used to characterize for the first time the resolved spectral properties of the FU Orionis and the Herbig Be component during and after the outburst.
Results.We confirm that the NW star dominates the system flux in the 1.1−3.8 µm range and is responsible for the photometric
outburst. We extract the first medium-resolution (R ∼ 2000−4000) near-infrared (1.1−2.4 µm) spectra of the individual components. The SE component has a spectrum typical of FU Orionis objects. The NW component spectrum is characteristic of embedded out-bursting protostars and EX Or objects. It displays numerous emission lines whose intensity correlates with the system activity. In particular, we find a correlation between the Brγ equivalent width and the system brightness. The bluing of the continuum of the NW component along with the absolute flux and color-variation of the system during the outburst suggests that the outburst was caused by a complex interplay between a variation of the extinction in the line of sight of the NW component on one hand, and the emission of shocked regions close to the NW component on the other. We confirm the recently reported wiggling of the SE component jet from [Fe II] line emission. We find a point-like structure associated with a peak emission at 2.098 µm coincidental with the clump or arm seen in broadband polarization differential imaging as well as additional diffuse emission along a PA = 214◦
. The origin of these two structures is unclear and deserves further investigation.
Key words. techniques: high angular resolution – binaries: general – stars: individual: Z CMa – stars: pre-main sequence
1. Introduction
Z Canis Majoris (Z CMa) is a complex pre-main sequence bi-nary member of the CMa OB1 association (age < 1 Myr; Herbst et al. 1978), with an estimated distance ranging from 950 pc to 1150 pc (Clariá 1974; Humphreys 1978;Kaltcheva & Hilditch 2000). The system is known for its recurring EX Orionis (EX Or)-like outbursts with recent events recorded in 1987, 2000, 2004, 2008, 2011, 2015, and 2016.
Z CMa was classified byHartmann et al.(1989) as a FU Ori-onis variable based on its broad, doubled optical line absorp-tions, optical spectral type of F-G, and CO first overtone. The au-thors were able to reproduce the UV-optical spectrum by a model
of an optically thick accretion disk surrounding an 1−3 M star with an accretion rate of 10−3 M yr−1. The model failed to ex-plain the near-infrared (NIR) part of the Z CMa spectrum, how-ever, as well as a strong increase in brightness in 1987. Dur-ing the 1987 outburst, the optical spectrum was characterized by a featureless and bluer continuum, a rise of Balmer lines, and emission lines of Fe II, Cr II, and Ti II (Hessman et al. 1991), which is unconsistent with typical FU Orionis activity.
The problem was partly solved by Koresko et al. (1991) who discovered that Z CMa consists of a 110 mas binary. The SW component of the pair is the FU Orionis star that dominates the optical flux. The NW component dominates the NIR (>2 µm) to sub-mm spectrum, and the total luminosity.
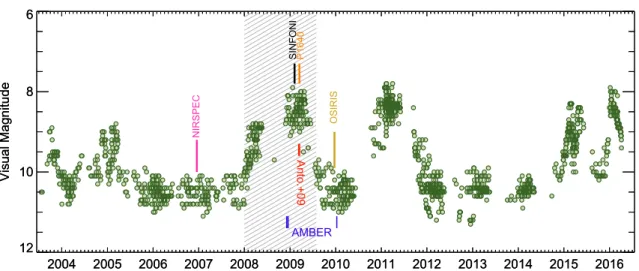
A&A 597, A91 (2017) 2004 2005 2006 2007 2008 2009 2010 2011 2012 2013 2014 2015 2016 Date (years) 12 10 8 6 Visual Magnitude NIRSPEC SINFONI OSIRIS P1640 Anto.+09 AMBER 2004 2005 2006 2007 2008 2009 2010 2011 2012 2013 2014 2015 2016 Date (years) 12 10 8 6 Visual Magnitude
Fig. 1.Light curve of Z CMa inferred from AAVSO observations. The spectroscopic observations of the HBe and FUOR are reported in the figure. The dashed zone corresponds to the 2008 outburst of the system.
Follow-up observations (Whitney et al. 1993;Garcia et al. 1999;
van den Ancker et al. 2004, hereafter VDA04) permitted the conclusion that this component is an Herbig Be star (hereafter HBe). VDA04 obtained a NIR (1.9−4.1 µm) spectrum while the system was returning to its quiescent state. This spectrum shows Brα, Brγ, and Pfγ in emission and the CO band-head in absorp-tion around 2.3 µm. The authors suggested that the emission lines are formed into an accreting circumstellar disk surround-ing the HBe, and also in an extended envelope above and below the disk plane. The emission line analysis led VDA04 to infer a B0IIIe spectral type. Luminosity and effective temperature esti-mates enable the authors to derive a mass of 16−38 M for the HBe using various evolutionary model predictions for ages of 3 × 10⁵yr and 4 × 10⁴yr respectively.
At large scales, this system reveals a rich outflow activity. A collimated optical outflow (3.9 pc; PA = 240◦) and a bow-shock-shaped feature at 6000have been reported byPoetzel et al.
(1989). Multiple outflow component profiles traced by optical forbidden lines are present close to the source. Whelan et al.
(2010) confirmed the existence of a jet driven by the HBe star (paper II), which is unambiguously the driving source of the Z CMa parsec-scale outflow. The HBe star jet is seen os-cillating around a given position angle (jet wiggling), proba-bly due to a closer companion to the HBe star. A twin jet driven by the FUOR component was also clearly identified.
Millan-Gabet et al. (2001) also reported a cavity-like structure in adaptive optics J-band imaging, extending to the SW of the system, which they interpreted as light scattered off the wall of a jet-blown cavity aligned with the Z CMa large-scale outflows.
Alonso-Albi et al.(2009) modeled the spectral energy dis-tribution of the system by condis-tributions from free-free emis-sion, a disk of size 180+250−140 au tilted by 30+40−20 degrees, and an infalling envelope (spherical or toroidal) surrounding each star that possibly extends from 2000 to 5000 au and might be carved by the outflows. The HBe itself is embedded in a dust cocoon (Whitney et al. 1993). A sketch of the system can be found inCanovas et al.(2012). The dust distribution at the 500 au scale around Z CMa was investigated using NIR imaging polarimetry (Canovas et al. 2015; Liu et al. 2016). It reveals an extended filamentary structure (up to 200) observed byMillan-Gabet & Monnier(2002), whose origin is unclear, as well as a polarized clump closer to the stars (0.3−0.500).
At the Astronomical Unit scale, the FUOR is strongly re-solved by the Keck-I interferometer to a level that is difficult to explain with thermal emission of the accretion disk alone (Millan-Gabet et al. 2006). Hence its close environment appears to be more complex than expected. The HBe component has also been observed with Keck-I (Monnier et al. 2005) and with AMBER on the VLTI (Li Causi et al. 2008;Benisty et al. 2010). Based on the Keck observations, the authors have modelled the NIR emission as coming from a uniform ring. Nonetheless, they have finally concluded that the ring model was doubtful for this star, considering the large uncertainty of its spectral type. Mo-rover, the amount of infrared emission coming from this source alone at a given epoch is also poorly known, which adds to the difficulty of interpreting the interferometric measurements.
From January 2008 to October 2009, the system began to experience an optical outburst, the largest reported in the past 90 years of available observations (Grankin & Artemenko 2009). This outburst triggered additional observations of the sys-tem.Hinkley et al.(2013) presented adaptive optics JHKL band photometry of the individual components. They concluded that the embedded HBe component is solely responsible for the outburst. Benisty et al. (2010) obtained spectrally resolved interferometric observations of the HBe to study the hot gas emitting across the Brγ emission line (paper I). They found that the line profile, the astrometric signal, and the visibilities are consistent with the emission of a bipolar wind that may be partly seen through a disk hole inside the dust sublimation radius at the au scale. Their multi-epoch observations led them to suggest that the outburst is related to a period of strong mass-loss and not to a change in the extinction along the line of sight. The spectropho-tometric, spectropolarimetric, and polarimetric imaging obser-vations of the system (Szeifert et al. 2010;Canovas et al. 2012) suggest in contrast that the outburst was caused by changes in extinction of the dust cocoon surrounding the HBe star.
We present the results of a complementary high angular reso-lution imaging campaign to resolve and characterize the proper-ties of each component of Z CMa in the NIR during and after its 2008 outburst phase and to study its close environnement, in an attempt to better understand the origins of the bursts (extinction, or accretion and ejection scenarios). Our new observations were made from January to March 2009, that is, about one year after the start of the two-year outburst. We obtained an additional ob-servation when the system returned to quiescence (see Fig.1).
Table 1. Observing log. Sr-2.2 µm corresponds to the Strehl ratio measured at 2.2 µm.
UT Date Name Instr. Filter (Grism) Camera Exp. time Sr-2.2 µm Airmass Comment
2009-01-31 Z CMa NACO J, H, Ks, L0 S13, L27 90 s (32%) 1.19
HD54335 NACO J, H, Ks, L0 S13, L27 90 s 22% 1.25 psf-ref
2009-02-06 Z CMa SINFONI J 0.025 240 s n.a. 1.05
Z CMa SINFONI H 0.025 240 s n.a. 1.09
Z CMa SINFONI K 0.025 240 s n.a. 1.22
2009-01-28 HIP072241 SINFONI J 0.25 10 s n.a. 1.06 telluric
2009-02-22 HIP054970 SINFONI H 0.25 12 s n.a. 1.09 telluric
2009-02-07 HIP071218 SINFONI K 0.25 10 s n.a. 1.22 telluric
2009-02-26 Z CMa NACO J, H, Ks, L0 S13, L27 90 s (42%) 1.06
HD54335 NACO J, H, Ks, L0 S13, L27 90 s 41% 1.11 psf-ref
2009-03-11 Z CMa NACO J, H, Ks, L0 S13, L27 90 s (41%) 1.02
HD54335 NACO J, H, Ks, L0 S13, L27 90 s 34% 1.04 psf-ref
2009-12-07 Z CMa NIRC2 Jcont, Hcont, Kcont 9.96 mas/pix 8.6 s – 1.29
HIP33998 NIRC2 Jcont, Hcont, Kcont 9.96 mas/pix 8.6 s 45% 1.51 psf-ref
Notes. Seeing evaluated at 0.55 µm.
We extracted the first medium-resolution (R ∼ 2000−4000) spectra from 1.1 to 2.5 µm of each components of the system. We present additional JHKL band photometric and astrometric data of the binary. We report in Sect. 2 our observations and detail the associated data reduction and analysis in Sect.3. We analyze the evolution of the NIR photometric and spectroscopic properties of the components in Sects.4and5, respectively. We discuss these results in the context of other variable objects, and of past outbursts of the system in Sect. 6. We summarize our results in Sect.7.
2. Observations
2.1. VLT/NACO
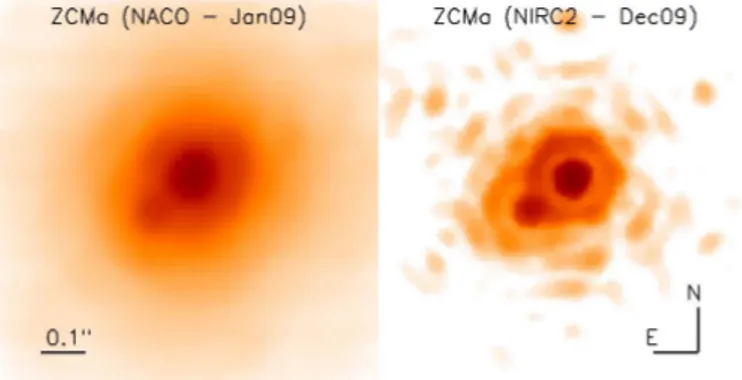
The Z CMa 2008 outburst was monitored with the NACO high-contrast adaptive optics (AO) imager of the VLT-UT4. The NAOS AO system (Rousset et al. 2003) is equipped with a tip-tilt mirror, a 185 piezo actuator deformable mirror and two wave-front sensors (visible and IR). Attached to NAOS, CONICA (Lenzen et al. 2003) is the NIR (1−5 µm domain) imaging cam-era equipped with a 1024 × 1024 pixel Aladdin InSb array. Observations were obtained at three different epochs between January 2009 and March 2009 (outburst phase). During the dif-ferent observing campaigns, the atmospheric conditions were sufficiently stable to close the AO loop and resolve both compo-nents (see Fig.2, left panel). The fainter FU Orionis component in K-band is clearly visible on both Keck and VLT images. Both images were normalized in flux to show the flux variation that is discernable between January and December 2009 in K band. The relative position of the FUOR with respect to that of the HBe component could be monitored well. The typical observing sequence included a set of five jittered images obtained using the J, H, and Ksbands with the S13 camera CONICA (mean plate scale of 13.25 mas/pixel) and using the L0filter with L27 (mean plate scale of 27.10 mas/pixel), leading to a total exposure time of ∼5 min on source. The corresponding setups are reported in Table1.
Fig. 2.Left: VLT/NACO Ks-band image of Z CMa on Januray 31, 2009.
Right: Keck/NIRC2 Kcontimage on December 7, 2009.
2.2. Keck/NIRC2
On December 17, 2009 (transient phase), imaging observa-tions were also obtained using the AO system on the 10 m KeckII telescope (van Dam et al. 2004). We obtained direct im-ages from 1.0 to 2.5 µm that clearly resolved the two compo-nents of the system with the facility AO-dedicated NIR cam-era NIRC2, a 1024 × 1024 detector for which we used the 9.963 ± 0.005 mas pixel−1scale and whose absolute orientation on the sky is 0.13 ± 0.02◦(Ghez et al. 2008). We used the nar-rowband filters Jcont, Hcont, and Kcontcentered on 1.2132, 1.5804, and 2.2706 µm to avoid the saturation of the star. The corre-sponding setups are also reported in Table1. Both components were easily resolved to determine the relative flux and position (Fig.2, right panel).
2.3. VLT/SINFONI
We used the SINFONI instrument (Spectrograph for INfrared Field Observations, see Eisenhauer et al. 2003a; Bonnet et al. 2004), located at the Cassegrain focus of the VLT UT4 Yepun to observe Z CMa during the outburst phase on February 6, 2009. The instrument provides AO-assisted integral field spectroscopy. It uses a modified version of the Multi-Applications Curva-ture Adaptive Optics system (MACAO,Bonnet et al. 2003) de-signed to feed the SPectrograph for Infrared Faint Field Imaging
A&A 597, A91 (2017)
Table 2. NaCo and Keck relative astrometry and photometry of FUOR relative to the HBe star in JHKs.
UT Date ∆ PA Platescale True north ∆J ∆H ∆Ks ∆L0
(mas) (deg) (mas) (deg) (mag) (mag) (mag) (mag)
09-01-31 111 ± 3 132.7 ± 1.0 1.19 ± 0.13 1.94 ± 0.10 2.42 ± 0.11 2.9 ± 0.3
09-02-26 111 ± 3 132.4 ± 1.0 13.25 ± 0.04 0.10 ± 0.15 1.16 ± 0.04 1.46 ± 0.04 1.97 ± 0.05
09-03-11 112 ± 3 132.1 ± 1.0 0.82 ± 05 1.41 ± 0.05 2.01 ± 0.04
09-12-07 111 ± 3 133.3 ± 1.0 9.963±0.005 0.13±0.02 −0.47 ± 0.20 0.64 ± 0.05 1.51 ± 0.05
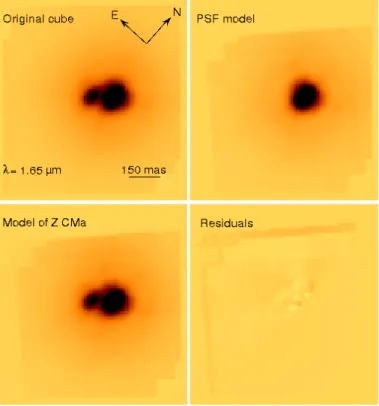
Fig. 3.Illustration of the spectral deblending process at 1.65 µm. Upper left: the initial Z CMa datacube where the two components are resolved. Upper right: during the observation, the adaptive-optics corrected PSF showed a strong astigmatism. To achieve a proper extraction of the spec-tra of the Z CMa components, we duplicated the HBe star profile to create a PSF model. Lower left: the position and the flux of the in-dividual sources were then retrieved using a modified version of the CLEAN algorithm. Lower right: the extraction error is estimated from the residuals.
(SPIFFI, Eisenhauer et al. 2003b). SPIFFI pre-slit optics where chosen to provide a spatial pixel scale of 12.5 × 25 mas per pixel. Three different gratings were used to cover the J (1.1−1.4 µm), H(1.45−1.85 µm), and K band (1.95−2.45 µm) at medium re-solving powers (2000, 3000, and 4000 respectively).
The instrument was rotated to orient the binary horizontally in the field of view (FoV) (see Fig. 2). Sky exposures were recorded following a ABBA pattern. Additional offsets on the object were chosen to increase the FOV to 850 × 860 mas in the Jband, 850 × 900 mas in the H band, and 950 × 900 mas in the K band. This also permitted us to artificially double the ver-tical spatial sampling. The source was bright enough at opver-tical wavelengths to be used as guide probe for the wavefront sensing. H
ipparcos
standard stars were also acquired soon after Z CMa to correct the spectra for telluric features (see Table1).3. Data analysis
3.1. High-contrast imaging
After cosmetic reductions (bad pixels, dark subtraction, flat fielding) using eclipse (Devillard 1997), we applied the decon-volution algorithm ofVeran & Rigaut(1998) to obtain the posi-tion of the HBe component relative to the FUOR at each epoch for both NaCo and Keck data. The star HD54335 (V = 7.4, K= 3.6) and HIP33998 (V = 7.99, K = 7.895) of similar bright-ness were observed consecutively to serve as point spread func-tion (PSF) estimate for the NaCo and Keck data, respectively. The results are reported in Table2. The total system brightness was calibrated using the zero points provided by ESO for each observing night, or using the PSF standard HIP33998 observed with NIRC2.
3.2. Integral field spectroscopy
SINFONI data were reduced with the ESO data reduction pipeline version 1.9.8 (Abuter et al. 2006). We used in addi-tion custom routines to correct raw images from several elec-tronic effects that affect the detector, as previously reported in
Bonnefoy et al.(2014). The pipeline carried out cube reconstruc-tion from corrected detector images. Hot and nonlinear pixels were tagged using dark and flat-field exposures. Arc lamp frames acquired during the days following the observations enabled us to calibrate the distortion, the wavelength scale, and the slitlet positions. Slitlet distances were measured with north-south scan-ning of the detector illuminated with an optical fiber. Object-sky frame pairs were subtracted, flat-fielded and corrected for bad pixels and distortions. In each band, four datacubes were fi-nally reconstructed from clean science images and merged into a master cube. The quality of the reduction was checked using the ESO trending parameters. We obtained standard star datacubes in a similar way. However, their low signal to noise ratio (S/N) would have degraded the final Z CMa spectra, therefore we de-cided not to use it. We instead reduced datacubes of the telluric standards HIP072241 (B3V) in the J band, HIP054970 (B5III) in the H band, and of HIP HIP071218 (G2V) in the K band ob-served at the airmass of Z CMa on different nights and with the instrument pre-optics offering a 0.25 arcsecond/spaxel sampling. The standard star spectra and the Z CMA spectra were smoothed to the same resolution. This change of resolution was estimated from the arc lamp calibration files taken the same days as the observations. Those telluric standards were found to provide the best possible removal of the telluric lines.
Although Z CMa components are resolved in our final dat-acubes, the two sources contaminate each other. We therefore developed an improved version of the spectral extraction algo-rithm described inBonnefoy et al.(2009) to retrieve deblended spectra of the HBe and FUOR stars in each band (see Fig. 2).
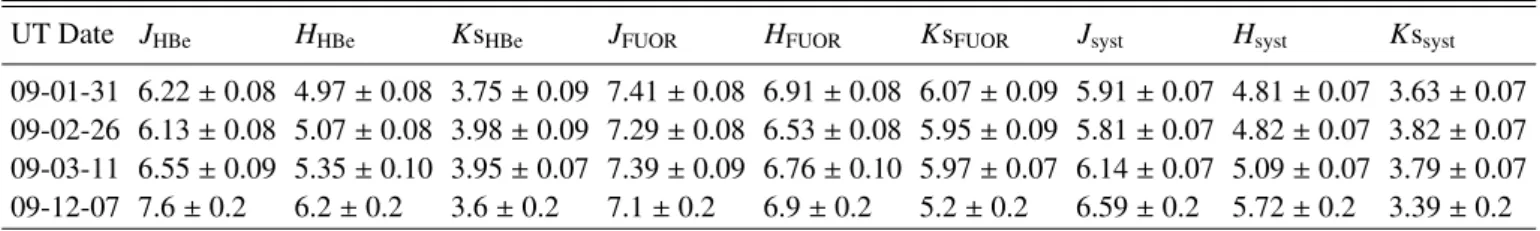
Table 3. NaCo and Keck photometry of HBe, FUOR, and of the system in JHKs.
UT Date JHBe HHBe KsHBe JFUOR HFUOR KsFUOR Jsyst Hsyst Kssyst
09-01-31 6.22 ± 0.08 4.97 ± 0.08 3.75 ± 0.09 7.41 ± 0.08 6.91 ± 0.08 6.07 ± 0.09 5.91 ± 0.07 4.81 ± 0.07 3.63 ± 0.07 09-02-26 6.13 ± 0.08 5.07 ± 0.08 3.98 ± 0.09 7.29 ± 0.08 6.53 ± 0.08 5.95 ± 0.09 5.81 ± 0.07 4.82 ± 0.07 3.82 ± 0.07 09-03-11 6.55 ± 0.09 5.35 ± 0.10 3.95 ± 0.07 7.39 ± 0.09 6.76 ± 0.10 5.97 ± 0.07 6.14 ± 0.07 5.09 ± 0.07 3.79 ± 0.07
09-12-07 7.6 ± 0.2 6.2 ± 0.2 3.6 ± 0.2 7.1 ± 0.2 6.9 ± 0.2 5.2 ± 0.2 6.59 ± 0.2 5.72 ± 0.2 3.39 ± 0.2
Our algorithm, CLEAN 3D has now been applied successfully on different datasets (Bonnefoy et al. 2014; Bergfors et al. 2016). We provide a reference concise description in this paper. The po-sitions of the two sources were initially fit with a Moffat function in each monochromatic cube slice. Their variation with wave-length caused by the atmospheric refraction was fit with a low-order polynomial. A modified version of the CLEAN algorithm (Dumas et al. 2001) was then applied on each slice to create a model of Z CMa while keeping the position of the binary fixed. The standard star datacubes were not reprentative of the PSF of Z CMa, which was affected by a strong astigmatism and could therefore not be used as input of the algorithm. We therefore chose to create a PSF template duplicating the Herbig profile following the observed direction of the PSF lengthening. The po-sition of the sources were then refined, an improved PSF model was created and a second CLEAN step was performed on the original cube. The algorithm produced two final datacubes con-taining the model of the HBe and the FUOR components. The typical error introduced by the spectral extraction and computed from residual maps ranges from 0.5 to 5%. Z CMa spectra were finally integrated inside circular appertures of 390 mas in the J band and 1250 mas in the H and K band. Spectra were di-vided by the standard star spectra corrected for intrinsic features and from their black body. The standard star spectra are found to provide a good correction of telluric features in the J band and a moderate correction in the H and K band. Spectra were finally scaled in flux by interpolating the NACO photometry of January 31, 2009 and February 26, 2009 on the date of the SIN-FONI observations. We estimate that the S/N measured on line-free regions on the Herbig spectra is 205 in the J band, 122 in the H band, and 120 in the K band.
We repeated this procedure on the Jbb (1.18−1.416 µm) and Hbb(1.473−1.803 µm) Keck/OSIRIS datacubes obtained on De-cember 22, 2009 (Whelan et al. 2010) when the system had re-turned to its quiescent state. We also reduced and analyzed an additional datacube obtained on the same night with the Kbb (1.965−2.381 µm) setting. The cubes have 20 × 20 mas spaxels that sample the system separation well. The limited FoV of the cubes along the binary PA and residual artifacts limited the accu-racy of the extraction to ∼10 %. We obtained the spectra of each component by integrating the flux of the sources over circular apertures (R= 5 pixels) in the extracted datacubes. The spectra were corrected for the atmospheric transmission using the spec-tra of A0V stars observed on the same night (HD 67213 for the Jbb and Kbb datacubes, HD 109615 for the Kbb datacubes). The standard star spectra were previously multiplied by a high-resolution (R= 500 000) spectrum of Vega smoothed at the reso-lution of OSIRIS (R ∼ 3800) and shifted to the radial velocity of the stars1. The standard star was located at the edge of the FoV of
the H-band cube, which introduced strong differential flux losses
1 http://kurucz.harvard.edu/stars/VEGA/
that translate into an additional slope in the final spectra. We es-timated and corrected the spectra for this slope considering that the FUOR spectral slope should be identical to the one of the SINFONI spectrum. The OSIRIS spectra have a lower S/N than those of the SINFONI spectra (S /N= 31 in the J band, 82 in the Hband, and 70 in the K band). Finally, we note that the K-band spectra are also slightly affected by an oscillating pattern (with a 0.08 µm period) that might be related to numerical artifacts found on the spaxels close to the edges of the FoV.
4. AO imaging of Z CMa
4.1. Resolved photometry
The photometry of the FUOR component relative the HBe at each epoch for both NaCo and Keck data is reported in Table3
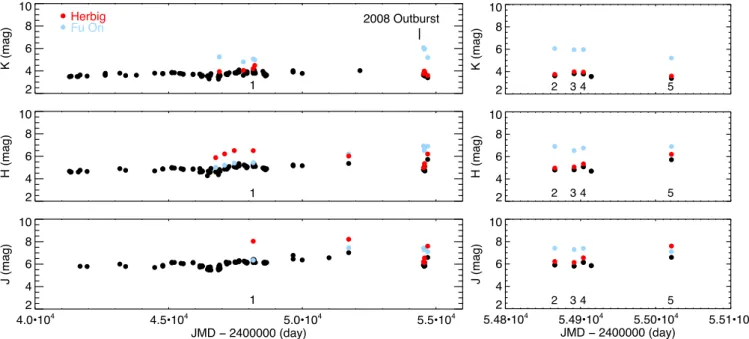
and compared in Fig.4with previous total and individual pho-tometry. From the literature, the FUOR is brighter in the qui-escent phase in J and H bands, whereas the HBe dominates in Kband. The system brightness also seems to decay significantly since 1986, and presumably since the last FUOR burst. During the 2008 outburst, our NaCo data show that the HBe component became much brighter in all NIR wavelengths than the FUOR, as shown by a flux ratio inversion in J and H bands (see Table2). This confirms that the HBe component is at the origin of the 2008 outburst, in agreement withHinkley et al.(2013). Our Keck observations, taken one year later, indicate that the system did not completely return to its quiescent phase in December 2009 as the HBe component remains brighter in H-band.
4.2. Extended structures
In our 2009 NaCo observation in J or H bands, we did not re-detect any extended structures because the Keck data have com-paratively a higher S/N, as we did not intend to saturate our ob-servations to derive the photometry of the two components. An extended structure at a projection angle (PA) compatible with that reported byMillan-Gabet & Monnier(2002),Canovas et al.
(2015), andLiu et al.(2016) is clearly seen in the L0band (an-noted “A” in Fig.5) after applying a radial profile subtraction. Its PA ranges from 160 to 250◦ and extends up to 2160 au. Two other structures (“B” and “C” in Fig.5) are marginally de-tected in this band at PA ∼ 0 and 180◦. They are not detected at shorter NIR wavelengths or in polarimetry (Canovas et al. 2015;Liu et al. 2016). Their orientation does not coincide with the shocked emission regions seen in the wide-field images of Z CMa (Poetzel et al. 1989; Bouy et al. 2011). They could be part of the cavity whose NW extension displays a complex struc-ture (Poetzel et al. 1989) or be residuals from the stellar halo subtraction.
A&A 597, A91 (2017) 2 4 6 8 10 K (mag) 2008 Outburst Herbig Fu Ori 2 4 6 8 10 H (mag) 2 4 6 8 10 J (mag) 4.0•104 4.5•104 5.0•104 5.5•104 JMD − 2400000 (day) 1 1 1 2 4 6 8 10 K (mag) 2 4 6 8 10 H (mag) 2 4 6 8 10 J (mag) 5.48•104 5.49•104 5.50•104 5.51•104 JMD − 2400000 (day) 2 3 4 5 2 3 4 5 2 3 4 5
Fig. 4.Resolved Naco and Keck JHK photometry of FUOR component relative to the HBe compared to previous measurements (unresolved components) from the literature (VDA4,Koresko et al. 1991;Haas et al. 1993, and references therein). The epochs with simultaneous JHK-band photometry are: (1) October 1990 (quiescence); (2-3-4), January 31, February 26, and March 11, 2009 respectively (outburst); (5) December 2009 (returning to quiescence). A C B Diffraction spikes N E 1" Detector pattern
PA jet HBePA jet FUOR
Fig. 5.VLT/NACO PSF-subtracted L0
-band image of Z CMa obtained on January 31, 2009. See Sect.4.2for details.
4.3. Astrometry and orbital motion
The astrometry of the FUOR relative to the HBe was mea-sured at each epoch for our NaCo and Keck data. The results are reported in Table2and shown in Fig.6. They complement older epochs obtained using AO and speckle (Millan-Gabet et al. 2001; Koresko et al. 1991; Haas et al. 1993; Barth et al. 1994;
Thiebaut et al. 1995) and more recent measurements obtained with the polarimetric imaging mode of NaCo and SPHERE (Canovas et al. 2015;Antoniucci et al. 2016). While the separa-tion does not seem to vary significantly, our astrometric mea-surements confirm a significant variation of position angle since 1986. This might be consistent with a coplanar configuration be-tween the binary and the HBe and FUOR disks (Malbet et al. 1993;Benisty et al. 2010) as often expected in binary systems,
115 120 125 130 135 140 145 PA (degree) This paper 0 2000 4000 6000 8000 10000 12000 14000 JMD - 2445000 (day) 90 100 110 120 Separation (mas)
Fig. 6.Position in separation and position angle of the FUOR compo-nent relative to the HBe, based on the literature and our NaCo and Keck observations.
although the jet orientations differ by at least 10 degrees between the two components (Whelan et al. 2010).
5. Spectro-imagery of the components of Z CMa
The flux-calibrated SINFONI spectra are shown in the 1.1−2.4 µm range in Fig.7. The OSIRIS and SINFONI spec-tra of the FUOR and of the HBe are compared in each individual band in Figs.8−10.
5.1. Near-infrared spectrum of the HBe component
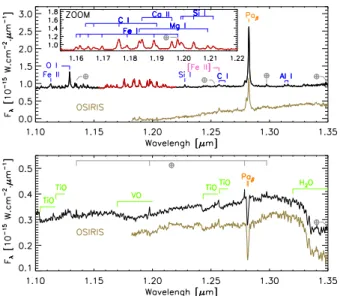
The 1.1−2.5 µm spectrum of the HBe component is domi-nated by a complex set of emission lines overlaid on a contin-uum with a red slope. These lines are decreased or absent in the OSIRIS spectrum obtained during the quiescent phase. The
Fig. 7.Flux-calibrated SINFONI spectra (from February 6, 2009) of the system (top), the HBe component (middle), and of the FUOR (bottom) in the 1.1−2.4 µm range while the binary was in outburst. The lower resolution (R ∼ 45) P1640 spectrum of the system components also acquired during the outburst phase (March 17, 2009,Hinkley et al. 2013) is shown in orange.
NIR color-variation taken close in time with the OSIRIS spec-tra indicates that the continuum became redder when the system returned to quiescence. This is consistent with the slope varia-tion of the continuum in the J-, H-, and K-band spectra, although there are some uncertainties on the calibration of this slope in the OSIRIS data (see Sect.5.2). The position of the emission lines emerging at more than 5% of the continuum flux are reported in TableC.1. They were retrieved using an interactive least-squares multiple Gaussian fitting tool from the FUSE IDL library2with an accuracy of ∼1 Å (12−28 km s−1). The velocity of each iden-tified line, their corresponding transition, the associated non-dereddened fluxes, full-width at half maximum (FWHM), and equivalent widths (EW) for unblended lines complete TableC.1. The velocities were corrected for the radial velocity of the sys-tem (+30 km s−1,Hartmann et al. 1989) and for the barycentric-to-helocientric velocity shift at the time of the observations (−11.2 km s−1). The fluxes were estimated following the esti-mation and the removal of the continuum beneath the line using a low-order Legendre polynomial. The associated error bar was estimated from the rms of the noise inside the continuum esti-mation zones surrounding the lines. FWHM are taken from the Gaussian fit. Finally, equivalent widths (EW) and their associ-ated error bars are computed following the Sembach & Savage
(1992) method.
5.1.1. Line identification
We propose an identification of most of the lines, for which we rely on analogies between our spectrum and those of several
2 The tool can be downloaded at http//fuse.pha.jhu.edu/
analysis/fuse_idl_tools.html
Fig. 8.J-band spectra of the Z CMa HBe (top) and FUOR (bottom) components during the outburst phase (black and red line for the zoom; SINFONI spectrum from February 6, 2009) and in the quiescent stage (golden line; OSIRIS spectrum from December 22, 2009). The fluxes of the OSIRIS spectra are normalized to the median flux of the SINFONI spectra between 1.206 and 1.246 µm and shifted to lower values for clarity.
young embedded targets found in the literature (Kelly et al. 1994; Greene & Lada 1996; Nisini et al. 2005; Gibb et al. 2006; Antoniucci et al. 2008; Connelley & Greene 2010;
Covey et al. 2011; Kóspál et al. 2011b; Caratti o Garatti et al. 2013; Cooper et al. 2013). We completed and double-checked the identification using three databases for atomic and ionic
A&A 597, A91 (2017)
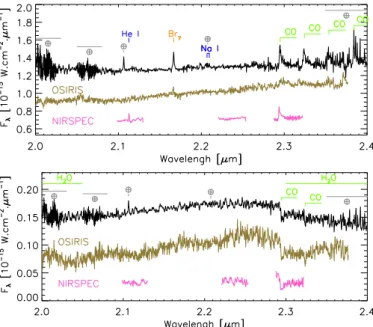
Fig. 9.H-band spectra of the Z CMa HBe (top) and FUOR (bottom) components during the outburst phase (black line; SINFONI spectrum from February 6, 2009) and in the quiescent stage (golden line; OSIRIS spectrum from December 22, 2009). The fluxes of the OSIRIS spectra are normalized to the median flux of the SINFONI spectra between 1.66 and 1.70 µm and shifted to lower values for clarity.
Fig. 10.Same as Fig.9but for the K band. The normalized NIRSPEC spectra (with respect to the continuum of the SINFONI spectra) of the system components obtained while the binary was in a quiescent state (December 17, 2006) are overlaid in pink. The fluxes of the OSIRIS spectra are normalized to the median flux of the SINFONI spectra be-tween 2.18 and 2.22 µm and shifted to lower values for clarity.
transitions3,4,5. We also carefully flagged spurious lines that were introduced while dividing the spectrum by the telluric standards. 3 http://physics.nist.gov/PhysRefData/ASD/lines_form. html 4 http://www.pa.uky.edu/$\sim$peter/atomic/ 5 http://www.cfa.harvard.edu/amp/ampdata/kurucz23/ sekur.html 1.10 1.15 1.20 1.25 1.30 1.35 Wavelength [µm] 1 2 3 4
Normalised flux + constant
Z CMa (HBe; Feb. 6, 2009)
PV Cephei (June 2012) V1647 ORI (March 2, 2005) PTF 10nvg (July 14, 2010) EX Lupi (July 24, 2008) 1.55 1.60 1.65 1.70 Wavelength [µm] 1.0 1.5 2.0 2.5 3.0
Normalised flux + constant
Z CMa (HBe; Feb. 6, 2009)
PV Cephei (June 2012) V1647 ORI (March 2, 2005) PTF 10nvg (Sept. 23, 2010) EX Lupi (July 28, 2008) 2.05 2.10 2.15 2.20 2.25 2.30 Wavelength [µm] 1.0 1.5 2.0 2.5
Normalised flux + constant
Z CMa (HBe; Feb. 6, 2009)
PV Cephei (June 2012) V1647 ORI (March 2, 2005)
PTF 10nvg (July 14, 2010) EX Lupi (July 30, 2008)
Fig. 11. Comparison of the NIR spectrum of the HBe component of Z CMa to spectra of variable young stellar objects PV Cephei (Caratti o Garatti et al. 2013), V1647 ORI (Gibb et al. 2006), PTF 10nvg (Covey et al. 2011; Hillenbrand et al. 2013), and EX Lupi (Kóspál et al. 2011b). All spectra were smoothed to the lowest com-mon resolution. Spectra of PV Cephei, V1647 ORI, and PTF 10nvg were dereddened by AV = 8, 9, and 6 mag, respectively to reproduce
the Z CMa’s HBe pseudo-continuum slope. The H-band spectrum of EX Lupi is dereddened by AV = 1, while the K-band spectrum is
re-denned by AV= 1.
We retrieved the same emission lines in the EX Or pro-totype EX Lup captured during an outburst (Kóspál et al. 2011b). The spectrum also resembles those of the out-bursting protostars V1647 Ori, PTF 10nvg, and PV Cephei (Gibb et al. 2006; Covey et al. 2011; Hillenbrand et al. 2013; Caratti o Garatti et al. 2013, see Fig. 11). We also find a good match with those of class I stars IRAS
03220+3035N, IRAS 16289-4449, and IRAS 20453+6746
(Connelley & Greene 2010), and of the embedded R CrA objects IRS2 and HH100 IR (see Figs. 2−4 of Nisini et al. 2005).
The spectrum is dominated by hydrogen emission lines. The Paschen β represents the strongest line of the spectrum. In the Hband, the more remarkable emission features are the series of Brackett lines (order 10 to 22). The Brackett 23 line is expected to be blended with a Mg I emission feature at 1.504 µm. The Kband also has a moderate Br γ emission line (also present in the AMBER spectra of the HBe,Benisty et al. 2010).
The J-band spectrum is also dominated by an O I line at 1.1292 Å. The O I line is commonly attributed to fluorescence excitation by a UV continuum and/or to resonant absorption of Ly β photons (Kelly et al. 1994; Nisini et al. 2005). The non-detection of the O I line at 1.316 µm favors the second hypothesis (Kóspál et al. 2011b).
A forest of lines is also present from 1.15 to 1.22 µm. This forest most likely corresponds to the broad feature seen in the spectra of HH100 IR and R Cra IRS2. It is composed of permit-ted lines of the neutral species of Fe, C, Si, Mg, and of inonized Ca. We also identify other lines of Fe I, Si I , C I, Al I, Na I, and Mg I at longer wavelengths in the J, H, and K bands.
Only one ionized species can be firmly identified in the spec-trum (Ca II). The first ionization potential of Ca (6.11 eV) is lower than those of Si (8.15 eV) but remains comparable or higher than those of Mg (7.64 eV), Al (5.98 eV) and Na I (5.14 eV). The absence of Al II, Na II, and Mg II emission can be explained by the energies of the upper transition levels (12.1−37.2 eV) in the 1.1−2.5 µm range. These energies are sig-nificantly higher than those involved for the Ca II (7.5 eV). As noted by Kóspál et al.(2011b), the ionization potentials of the metallic species are lower (5.14−8.15 eV) than the one of car-bon (11.26 eV), oxygen (13.62 eV), and hydrogen (13.6 eV). This suggests that metals lies in a medium where hydrogen is mostly neutral.
We report a weak [Fe II] emissions around 1.257 µm, 1.534, and 1.644 µm with several velocity components, associated with a micro jet studied inWhelan et al.(2010). The 1.644 µm line is partially blended with the Br12 line. We analyze structures asso-ciated with the 1.534 µm line in Sect.5.3.
The spectrum has strong 12CO overtones of the X1Σ+ − X1Σ+ system seen in emission in the K band. These over-tones have previously been reported by Hinkley et al. (2013), while the system was in the quiescence phase before the 2008 outburst. This is retrieved in many young stellar ob-jects (e.g., Connelley & Greene 2010; Cooper et al. 2013).
Connelley & Greene(2010) showed that Brγ coincides with the emergence of the CO band-head seen in emission. Since Brγ is a well-known accretion tracer (Muzerolle et al. 1998), the au-thors proposed that the CO emission might arise from disk sur-faces when the systems are quite veiled and accretion rates are high. We follow this hypothesis and model them in Sect.5.1.4. Alternatively, CO overtones might be produced inside magne-tospheric accretion funnels (Martin 1997). This line is not de-tected in the spectrum that Liljeström & Olofsson (1997) ob-tained while the system was in quiescence.
To conclude, the comparison of the HBe spectrum to the one of PTF 10nvg during its brighter stages suggests that we may also be seeing water-band emission in the spectrum of the HBe at 1.33−1.35 µm, 1.49−1.55 µm, and 1.70−1.75 µm.
5.1.2. Line profiles
Most of the lines have a FWHM greater than the instrumental line-width (5.11 Å in the J band, 5.00 Å in the H band, 3.68 Å in the K band; measured on thorium-argon calibration lines). The
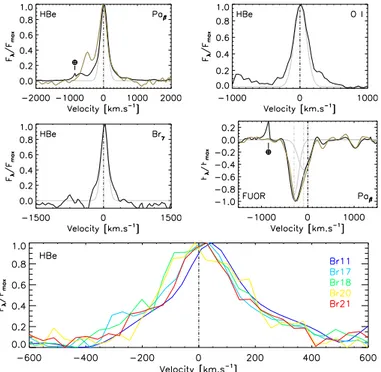
Fig. 12.Profile of strong and weakly blended lines for the HBe and FUOR components. The black solid lines correspond to the SINFONI (outburst) data, while the golden lines correspond to the OSIRIS spectra (post-outburst).
profiles of the λ1.1292 O I, Pa β, and of several other Brackett lines that are unaffected by a strong blend (Br γ, Br 11, 17, 18, 20, and 21) are reported in Fig.12. They were subtracted from their continuum and normalized to their highest value. The pro-files of the Pa β lines extracted from the SINFONI (black line) and OSIRIS (golden line) spectra are compared in the upper left panel. A Gaussian is fitted on the line core and is overlaid (gray line).
The oxygen line core has a non-significant velocity. The line has two broad asymmetrical wings that extend up to −400 and +600 km s−1. An additional unrelated feature (possibly an Al I line) is present at −900 km s−1.
The resolved profiles of isolated H I emission lines (Paβ, Br 11, Br 17, Br 18, Br 20, and Br 21) are shown in Fig.12. The Pa β profile is divided into a main component characterized by asymmetrical wings and into a blueshifted lobe at −650 km s−1. The lobe appears at lower velocities (−480 km s−1) in the OSIRIS spectrum and contributes more to the total line flux. We retrieved these two components in the spectrum of EX Lup (Kóspál et al. 2011b), PV Cephei (Caratti o Garatti et al. 2013), and PTF 10nvg (Covey et al. 2011; Hillenbrand et al. 2013). The velocity is consistent with an emission coming from the basis of the HBe jet (Whelan et al. 2010). The line peak is slightly redshifted (42 km s−1), as is the one of PV Cephei (Caratti o Garatti et al. 2013). The profile also has a red tail that extends up to ∼1000 km s−1with a bump at+700 km s−1. We re-trieved this long tail in the Hα and Hβ lines seen in the 1996 and 2000 spectra of Z CMa (van den Ancker et al. 2004). VDA04 proposed that the tail originates from the extended atmosphere of the HBe. The bump is very consistent with the one seen in the spectrum of EX Lup during outburst (Kóspál et al. 2011b). In summary, the complex profile of Paschen β (and related time variations) indicates that the line forms in (at least) two distinct regions: one at the basis of the ouflow, and another closer to the star.
A&A 597, A91 (2017)
Fig. 13.Hband HI Brackett excitation diagram for the HBe of ZCMa (circles). All line fluxes are normalized to the HI Brackett 11 line. Open circles show the lines that are probably contaminated. Blue tri-angles show the line ratios detected in EX Lupi (Kóspál et al. 2011b). The green curves are predictions from case B recombination from
Hummer & Storey(1987) for T = 104 K and n = 108 cm−3 (lower
curve) and for T = 500 K and n = 107 cm−3 (upper curve). The
red dotted lines show expected line ratios from blackbody emission at T = 1000 K (lower curve) and T = 104K (upper curve).
Brackett lines in the H band are slightly redshifted at the peak (+25 km s−1) and have a symmetrical profile extending to ±400 km s−1. The Br γ profile is slightly asymmetric and red-shifted. This profile is coherent with the double-peaked asym-metric profile (peaks at ∼−40 and 120 km s−1) studied at R ∼ 12 000 while the system was in outburst byBenisty et al.(2010). We showed that the Brγ line originates from a bipolar wind at the au scale. The same is expected for the other lines of the series.
5.1.3. H I line ratio
We show in Fig.13the HI line ratios observed during the pho-tometric outburst phase for the HBe component. We only in-clude the HI Brackett lines detected in the H band to over-come the effect of poorly constrained reddening correction. The HI excitation diagram is significantly flatter than observed in EX Lupi (Kóspál et al. 2011b) and in other UX Ori outbursting stars (Lorenzetti et al. 2009). Both optically thin case-B recom-bination and optically thick blackbody emission can reproduce the observed line ratios but would require very low gas temper-atures (500−1000 K) and moderate densities of 107−108cm−3, suggesting that the lines do not originate in the immediate vicin-ity of the star. Such temperatures and densities could be found in the surface layers of the accretion disk, which are strongly ir-radiated by the central star and accretion luminosity, or at the base of the outflow. We derive a lower limit to the Paβ/Brγ ratio of 7.7 without reddening correction. For the Paβ line, we integrated the emission in the same velocity range as ob-served in Brγ, that is between −300 and +300 km s−1. This very high ratio is marginally compatible with case-B recombi-nation and would exclude optically thick blackbody emission. The limit for optically thick blackbody emission is Paβ/Brγ ≤ 4 (Antoniucci et al. 2011). However, it is not clear that the Paβ and Brγ lines originate from the same regions as they show both distinct emission profiles (Sect. 5.1.2), and different be-haviors with time (Sect.5.1.5). It is therefore likely that simple models assuming constant density and temperature are not an
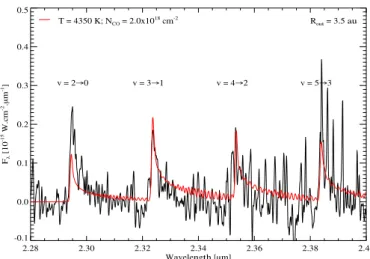
2.28 2.30 2.32 2.34 2.36 2.38 2.40 Wavelength [µm] -0.1 0.0 0.1 0.2 0.3 0.4 0.5 F [ 10 -1 5 W .c m -2.µ m -1] v = 2 0 v = 3 1 v = 4 2 v = 5 3 T = 4350 K; NCO = 2.0x1018 cm-2 Rout = 3.5 au
Fig. 14. CO bandhead seen in the SINFONI spectrum of the HBe (black) compared to our best-fit model for an outer radius of the line-emitting region of 3.5 au (red).
adequate representation of the HI-emitting medium. Models of spherically expanding wind in LTE predict both high Paβ/Brγ ratios and flat HI excitation diagrams (Lorenzetti et al. 2009;
Antoniucci et al. 2011). The observed Paβ flux and Paβ/Brγ ratio would require mass-loss rates ≥10−6 M
yr−1 and an envelope thickness >100 R . Full radiative transfer modeling in either a disk or outflow model would be required, but this is beyond the scope of this paper.
5.1.4. Modeling of the CO emission lines
The CO overtones seen in emission in the HBe component are also a characteristic feature of other EX Or (see Fig. 11).
Eisner et al.(2014) have used interferometry to resolve the CO line emitting areas around Herbig stars. They found that the re-gions of the disks emitting in the CO bandhead lines are located between 0.05 and 2 au from the central star. We therefore mod-eled the CO lines of the HBe spectrum acquired in outburst fol-lowing a similar approach asKóspál et al.(2011b) for EX Lupi. The CO disk emission model and related fitting procedure are described in AppendixA. We conclude that the CO gas in Z CMa has an excitation temperature of about 4300 ± 100 K, and the CO column density is between 2 × 1018cm−2 and 2 × 1019cm−2, depending on the disk size. Combinations of the outer radius of the emitting disk region Routand of the CO column density NCO can give similar fit. We show in Fig.14the best-fitting model for Rout= 3.5 au.
We therefore conclude that the CO emission can be repro-duced to first order by the emission from a disk model. The exci-tation temperature is almost 2000 K hotter than the one derived for EX Lup byKóspál et al.(2011b) with the same disk model-ing procedure.
5.1.5. Spectro-photometric variability
We report in Fig.1the dates of the spectroscopic observations of the HBe on the light curve of the system.
The low-resolution spectrum (R ∼ 250) of the system gath-ered during ourburst by Antoniucci et al. (2009) also displays the O I, the Paschen β emission line, and the Brackett lines seen in the SINFONI H-band spectrum of the HBe (Anto+09 in Fig. 1). The comparison of the SINFONI (this work) and
4700 4800 4900 5000 5100 5200 5300 MJD - 2 450 000 [Days] 0 -1 -2 -3 -4 -5
Equivalent width [Angstroms]
OUTBURST QUIESCENCE AMBER AMBER SINFONI SINFONI OSIRIS OSIRIS 4700 4800 4900 5000 5100 5200 5300 MJD - 2 450 000 [Days] 0 -1 -2 -3 -4 -5
Equivalent width [Angstroms]
8.0 8.5 9.0 9.5 10.0 10.5 11.0
Visual magnitude [mag] -0.4 -0.2 0.0 0.2 0.4 0.6 0.8 1.0
log(-1 x Equivalent width)
AMBER AMBER SINFONI SINFONI OSIRIS OSIRIS
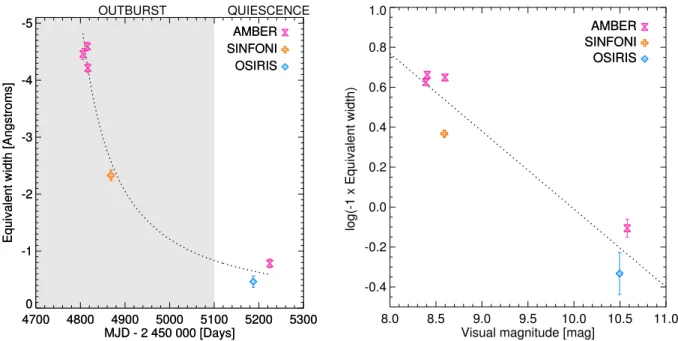
Fig. 15.Decline of the Br γ equivalent width with time (left) and with the system V-band magnitude (right).
P1640 (Hinkley et al. 2013) spectra obtained during outburst, the OSIRIS spectrum (while the system was returning to quiescence; this work), and the pre-outburst (quiescent state) NIRSPEC spectrum from 2006 (Hinkley et al. 2013) enable us to pinpoint the evolution of the features related to the HBe during outburst. This collection of data is complemented by a low-resolution (R ∼ 690) K-band spectrum of each component from Novem-ber 1992 (Liljeström & Olofsson 1997) while the system was in quiescence, but still at a magnitude lower than the one of 2006 and 2009. The evolutions of the equivalent widths of the Paβ, Brγ, and ν= 2 −→ 012CO are reported in TableC.2.
The evolution of the Pa β line (Fig.12) of the HBe shares some behavior with the one of PV Cephei. The blueshifted lobe that is seen in absorption in the spectrum of PV Cephei (P Cygni profile) only appears in the ourburst phase. The equiv-alent widths of the lines for the HBe and this object decreased by ∼50% in 10 and 9 months, respectively, after the outburst. The decline of the equivalent width is consistent with the one of the ν = 2 −→ 012CO overtone.
In Fig.15, we show that the equivalent width of the Br γ line decreases after the photometric outburst. This decline can be re-produced by the function EW(t)= A/(t − B)β, where A and B are constant values modulating the amplitude and epoch of maxi-mum outburst, and β the decline factor. We used a Levenberg-Marquardt fitting tool to estimate A = −1516 ± 1828, B = 4708 ± 25, and β= 1.25 ± 0.20. The B parameter corresponds to an epoch of maximum outburst on August 30, 2008. Unfortu-nately, this falls at a time when the V band was not monitored, but the system was considered to be in outburst at that time. We caution of course that the analysis is limited by the small number of epochs. The equivalent widths of the line decline with that of the V-band magnitude of the system (correlation factor= 0.95) taken from the AAVSO International database6 (Kafka 2016). This line is not detected in the November 1992 low-resolution spectrum of the HBe, which confirms that it is related to the sys-tem activity.
6 http://www.aavso.org
The NIRSPEC spectrum obtained while the system was in a quiescent state shows a He I line (2.1125 µm, 3p3P◦−4s3S). This line is not retrieved in the SINFONI and OSIRIS spectra. It is seen in some YSO spectra and is commonly associated with the stronger 2.0508 µm He I line (2s1S−2p1P◦) (e.g.,
Cooper et al. 2013;Murakawa et al. 2013) which has been de-tected byvan den Ancker et al.(2004) in the IRTF spectrum of the system taken when it was returning to quiescence (post-2000 outburst). This second line is located outside of the NIRSPEC coverage, but it is still missing from our SINFONI and OSIRIS spectra of the HBe.Cooper et al.(2013) proposed that these lines form by collision-induced excitation in a wind. The disppearance of this line system in the outburst (SINFONI) and post-outburst (OSIRIS) state might be due to the evolving contrast with the continuum emission, or to the variable extinc-tion in the line of sight (see below).
The NIR broadband photometry is mostly sensitive to the continuum emission. Therefore, the decrease of the line-equivalent width coupled to the stagnation (K band) or decrease (V band, J and H bands) of the continuum flux indicates that the flux produced by the excited regions does decline as well or that the absorption increases. The bluing of the slope of the HBe in the outburst phase supports the hypothesis of a decrease in ex-tinction as well as an increase of the internal heating of the inner portions of the disk due to an increase in accretion rate. We note that the continuum slope of the SINFONI spectrum is consis-tent with the one obtained with P1640. Both the SINFONI and OSIRIS K-band spectral continua look redder than the one ob-tained in November 1992 (Fig. 1 ofLiljeström & Olofsson 1997) while the system was in quiescence.
The evolution of the HBe in color-color and color-magnitude diagrams (Fig.16) indicates that the photometry of the star has one component that follows the interstellar reddening vector. This suggests that the outburst is at least partly due to a reduced extinction in the line of sight.van den Ancker et al.(2004) re-ported a spectral type B0IIIe for the HBe. Assuming that these stars have NIR photometric colors close to 0, the location of the HBe in the Fig. 16 indicates that the star was extincted by Av = 12 mag during the 2008 outburst. This is consistent
A&A 597, A91 (2017) -1 0 1 2 3 4 [H-K] -0.5 0.0 0.5 1.0 1.5 2.0 [J-H] Herbig 1 2 3 4 5 Fu Ori 1 2 3 4 5 AV=0 AV=1 AV=5 AV=10 AV=15 1 - Oct. 6, 1990 2 - Jan. 31, 2009 3 - Feb. 26, 2009 4 - March 11, 2009 5 - Dec. 07, 2009 0 1 2 3 4 J-H (mag) 6 8 10 12 J (mag) AV=0 AV=1 AV=5 AV=10 AV=15 Herbig 1 2 3 45 Fu Ori 1 2 3 4 5 5 - Dec. 07, 2009 4 - March 11, 20093 - Feb. 26, 2009 2 - Jan. 31, 20091 - Oct. 6, 1990 0 1 2 3 4 5 H-K (mag) 4 6 8 10 H (mag) AV=0 AV=1 AV=5 AV=10 AV=15 Herbig 1 2 3 4 5 Fu Ori 1 2 3 4 5 5 - Dec. 07, 2009 4 - March 11, 20093 - Feb. 26, 2009 2 - Jan. 31, 20091 - Oct. 6, 1990
Fig. 16.Evolution of the FUOR and HBe NIR colors and photometry when Z CMa was in a quiescent state (1; October 1990 observations), in outburst (2-3-4; encircled disks; corresponding to NaCo observations on January 31, February 26, and March 11, 2009 respectively) and returning to a quiescent state in December 2009 (5). The reddening vector for visual extinctions of 0, 1, 5, 10, and 15 mag as well as the colors of pre-main-sequence stars (solid line,Pecaut & Mamajek 2013) and the locus of CTTS (dashed line,Meyer et al. 1997) are overlaid for comparison.
with Av = 10 mag measured byHinkley et al.(2013) from the SED analysis of the star obtained during the outburst. This also agrees with the lower limit on Av derived from line ratio in Sect. 5.1.3. The reduced Av found by Hinkley et al. (2013) is also consistent with the higher flux level of their spectra com-pared to SINFONI’s and shown in Fig.7, although we cannot exclude that the different flux levels may come from differences in the flux-calibration methods used the two sets of spectra.
The variation in H–K color of the HBe component shows an additional contribution perpendicular to the reddening vector. This deviation is reproduced by several EX Ors (Lorenzetti et al. 2006;Kóspál et al. 2011a;Lorenzetti et al. 2012), and in partic-ular EX Lup. EX Lup represents the NIR spectrum of the HBe well (Fig.11).Lorenzetti et al.(2012) showed that during photo-metric outbursts of EX Ors, an additional blackbody component appears with temperatures between 1000 and 4500 K and a flux corresponding to blackbody emission from a uniform disk of ra-dius between 0.01 and 0.1 au.Hinkley et al.(2013) fit the SED of the HBe with two blackbodies at Teff = 8500 and 1100 K behind AV = 10. But their analysis relies on photometric points obtained while the system was at different stages. As shown in Fig. 3 of Giannini et al.(2016b), an increase in temperature of the blackbody component in the SED of the HBe during the out-burst phase might well explain the variation in colors perpendic-ular to the interstellar reddening vector.
5.2. FUOR component
The NIR spectrum of the FUOR component of Z CMa is characteristic of M8-M9 giants of the IRTF spectral library (Rayner et al. 2009), as expected for FU Orionis objects (see
Hartmann & Kenyon 1996) with a luminosity in NIR totally dominated by the accretion disk flux and with the cooler regions of the disk producing deep molecular absorptions. Strong broad absorption bands of H2O, TiO, VO, and CO lines are therefore detected. The CO lines in absorption of the FUOR were previ-ously marginally detected in the unresolved spectrum of Z CMa by Reipurth & Aspin (1997), through the strong contribution of the HBe component the K-band flux. These absorptions are typical of FU Orionis objects (Mould et al. 1978; Carr et al. 1989). The individual spectrum of the component obtained by
Liljeström & Olofsson(1997) andHinkley et al.(2013) showed
that the CO in absorption can be associated with this component. The SINFONI (outburst) and OSIRIS (returning to quiescence) spectra shown in Figs.8−10unambiguously confirm this result. The OSIRIS and SINFONI spectra display a strong Pa β absorption. This line is retrieved in the spectra of FU Orionis objects HBC687 (=IRAS 19266+0932) and V1735 Cyg (=IRAS 21454+4718) of the Connelley & Greene (2010) sample. The overall spectrum of HBC687 better reproduces the slope of the FUOR component of Z CMa.
The profile of the Paschen β absorption can be fit by two Gaussian functions with FWHM of 8 and 11.5 Å (broadly consistent with the spectral resolution), intensity ratio beneath the pseudo-continuum of 1.5, and velocities of −265 km s−1 and −102 km s−1, respectively. This double-peaked profile is characteristic of FU Orionis stars in the optical (e.g.,
Hartmann & Kenyon 1985). It is reminiscent of the Hγ and Hδline profiles extracted from the optical spectrum of Z CMa acquired in February 1983, while the system was not in outburst (Covino et al. 1984). The spectra of HBC687 and V1735 Cyg seem to exhibit an asymetric Pa β line profile similar to the one of Z CMa, although the wavelength sampling of these compar-ison spectra is lower than SINFONI’s. The line profile of the FUOR does not change significantly during the one-year lag cor-responding to the OSIRIS and SINFONI spectra. The line prop-erties are clearly not compatible with the hypothesis of an unre-solved binary.
The colors of the FUOR recorded in 1990 and during the 2008 outburst (Fig. 16) are redder than those of pre-main-sequence stars earlier than K4 (J − H = 0.60, H − K = 0.17,
Pecaut & Mamajek 2013) and typical of classical FU Orionis stars (see Fig. 4 ofGreene et al. 2008). The variations in posi-tion of the source in color−color and color−magnitude diagrams during and after the 2008 outburst is almost perpendicular to the interstellar extinction vector. The colors while the system was returning to quiescence fall outside of the locus of FU Ors and classical T Tauri stars ofMeyer et al.(1997). It is difficult to re-late this behavior to those of other FU Ors since there has not been an extensive follow-up of the NIR photometry of these ob-jects so far. Our observations are consistent with the variation in optical colors, in the period which show a progressive blu-ing of Z CMa colors consistent with the behavior of the HBe in the NIR, but also another dependence that could be induced by
Table 4. Line identification in the 1.1−2.5 µm spectrum of the FUOR components.
λobs Element Transition
(µm) 1.10399 TiO 0–0 band ofΦ(b1Π − d1Σ) 1.11752 TiO 1–1 band ofΦ(b1Π − d1Σ) 1.13502 TR . . . 1.19745 TR . . . 1.17−1.20 VO 0–1 band of A4Π − X4Σ− 1.24339 TiO 0–1 band ofΦ(b1Π − d1Σ) 1.25341 TR . . . 1.25643 [Fe II] ? a6D 9/2− a4D7/2 1.25739 TiO 1–2 band ofΦ(b1Π − d1Σ) 1.27870 TR . . . 1.28104 H I (Paβ) 3∗−5∗ 1.34830 TR . . . 1.3−1.55 H2O 2ν3, ν1+ ν2, 2ν1, 2ν2+ ν3, ν1+ 2ν2 1.50436 TR . . . 1.50898 TR . . . 1.570−1.574 TR . . . 1.597−1.618 12CO ? 5–2 band of X1Σ+− X1Σ+ 1.619−1.634 12CO ? 6–3 band of X1Σ+− X1Σ+ 1.721−1.732 TR . . . 1.70−2.05 H2O ν2+ν3, ν1+ ν2, 3ν2 1.747−1.800 TR . . . 2.00−2.03 TR . . . 2.05−2.08 TR . . . 2.10645 TR . . . 2.20770 TR . . . 2.29452 12CO 2–0 band of X1Σ+− X1Σ+ 2.32382 12CO 3−1 band of X1Σ+− X1Σ+ 2.35−2.40 TR . . . 2.3−2.4 H2O ν1,ν3, 2ν2
the variability of the FUOR component (Grankin & Artemenko 2009).
The intrinsic variation of the FUOR colors could translate into NIR slope variation of our continuum. In that case, the slope of the spectral continuum of the HBe in the H-band OSIRIS data could be uncertain because it has been based on the hypothesis of a non-variation of the spectrum of the FUOR (see Sect.3.2). This does not change our conclusions on the variation of the HBe continuum slope, which mostly relies on the broadband NIR col-ors reported in Table3.
5.3. Resolved structures
The spatial sampling of the SINFONI cubes enable us to look for extended structures down to ∼0.1500. We detected in
Whelan et al. (2010) the FUOR and HBe jets at a position an-gle of ∼235◦and 245◦, respectively into 1.257 µm and 1.644 µm [FeII] lines. In a recent analysis of Hα and [OI] (655.6 nm and
629.5 nm) AO-imaging data (Antoniucci et al. 2016), we report the detection of the wiggling of the FUOR jet. We chose here to re-investigate our data to look for structures in other emission lines in the context of the results ofAntoniucci et al.(2016).
We report extended emission at 1.200, 1.205, and 1.533, and 2.098 µm following the subtraction of the continuum emission (see AppendixB for the details). We classify these emissions into three categories:
– The 1.533 µm emission corresponds to the [Fe II] line seen in our spectrum of the system (TableC.1and Fig.9). The emis-sion map at more than 3σ the noise level is shown in Fig.17. The dashed ellipse corresponds to the era within which the continuum substraction leaves strong residuals. The emis-sion is associated with the FUOR micro jet (orange dashed line in the figures). It is elongated along a position angle of ∼238◦7. The emission is detected in the same velocity range
at 1.257 and 1.644 µm. The emission has a sinusoid shape with a ∼75 mas semi-period from −400 to −100 km s−1that is consistent with the wiggling found by Antoniucci et al.
(2016).
– The 1.200 and 1.205 µm line emissions may be associated with [Fe II] lines at 1.2000278 µm and 1.2054490 µm, re-spectively. We assume that we correctly identified the lines to map the emission in the velocity space in Fig. 18. These lines trace an elongated emission at a position angle of ∼214◦ (green dashed lines in Figs.17to18). The emission is seen from −600 to 110 km s−1. Its elongation is in the same di-rection as the K1 knot reported byWhelan et al.(2010). The structure is not seen in the polarized band imaging data of
Canovas et al.(2015) andLiu et al.(2016), but the position angle corresponds to the one of the elongated stream (see Sect.4.2). The stream does not extend down to 0.1500 how-ever, and does not point toward the HBe (Canovas et al. 2015). Additional observations carried out at these wave-lengths with high-order adaptive optic instruments such as VLT/SPHERE (N_CntJ filter) may help to clarify the nature of this structure.
– A clump is detected at 2.098 µm (Fig.18) at a PA of 164 ± 3◦ and separation of 313 ± 13 mas (291−360 au). This clump is at the same position as the polarized clump or arm detected in the H (1.66 µm) and Ks (2.18 µm) band byCanovas et al.
(2015) andLiu et al.(2016). The He I and H2emission lines seen in jets and embedded objects in this wavelength range translate into an absolute velocity 1000 km s−1. Plausible explanations are that the line is incorrectly identified, or that the structure is unrelated to the system. We detect another clump at a position angle of ∼95◦(labeled as ? in Fig.18). This additional clump is also found at 2.11 µm, and could correspond to an emission in the He I line (2.112583 µm) blueshifted by −400 to −200 km s−1. Nonetheless, it falls close to the PSF Airy ring of the FUOR which moves with wavelength and might produce some residual emission at the continuum subtraction step.
We were unable to detect any extended structures apart from the probable diffraction spikes associated with the HBe and FUOR point sources in images derived from the cubes collapsed in wavelengths and with the stellar halo of each component re-moved with a Gaussian smoothing (with a FWHM = 5, 10, and 15 pixels).
7 This value is consistent with the interval given inPoetzel et al.(1989)
for the large-scale jet and byWhelan et al.(2010) andAntoniucci et al.
A&A 597, A91 (2017) 0 200 400 600 800 Offset [mas] 0 200 400 600 800 Offset [mas] (a) -400 to -340 km.s-1 N E FUOR HBe 0 200 400 600 800 Offset [mas] 0 200 400 600 800 Offset [mas] (b) -300 to -250 km.s-1 N E FUOR HBe 0 200 400 600 800 Offset [mas] 0 200 400 600 800 Offset [mas] (c) -230 to -100 km.s-1 N E FUORHBe 0 200 400 600 800 Offset [mas] 0 200 400 600 800 Offset [mas] (d) -100 to +110 km.s-1 N E FUOR HBe
Fig. 17.Extended structures observed in the [Fe II] line at 1.53 µm.
0 200 400 600 800 Offset [mas] 0 200 400 600 800 Offset [mas] 1.200 µm -600 to 110 km.s-1 N E FUORHBe 0 200 400 600 800 Offset [mas] 0 200 400 600 800 Offset [mas] 1.205 µm -600 to 110 km.s-1 N E FUORHBe 0 200 400 600 800 Offset [mas] 0 200 400 600 800 Offset [mas] 2.097-2.099 µm N E FUORHBe Clump ?
Fig. 18.Extended structures observed at 1.200, 1.205, and 2.098 µm.
6. Origins of the outburst: extinction or accretion?
The architecture of the Z CMa system is reminiscent of those of other EX Ors objects with binary companions such as V1118 Ori (Reipurth et al. 2007), VY Tau (Leinert et al. 1993), and XZ Tau (Hartigan & Kenyon 2003), altough Z CMa may be the most massive system of this class of outbursting binaries, and the only one with a FU Or companion. These three systems have pro-jected separations of 72 au, 95 au, and 43 au respectively. It is possible that the outbursts of Z CMa are related to instabil-ities in the disk surrounding the HBe at the corotation radius (e.g., much closer to the star) where gas accumulates until it is accreted during outbursts (D’Angelo & Spruit 2012). This sce-nario may explain the behavior of EX Lup (D’Angelo & Spruit 2012; Banzatti et al. 2015). In this case, are our spectrophoto-metric data of the HBe of Z CMa more compatible with the sce-nario of an accretion+ejection event, or a variation of the extinc-tion in the line of sight?
The fact that the jet of the HBe wiggles (Whelan et al. 2010), the existence of knots along the direction of the HBe outflow, and the change in velocity of the blueside wing of the Paschen β line associated with the HBe outflow suggest that the 2008 outburst and spectrophotometric properties of the most massive star of the system are related to an accretion+ejection event. The spectrum of the HBe, quite similar to the one of the prototype EX Lup, strengthens this conclusion. Nonetheless, because (i) the Br γ line emission may originate at least partly in a disk wind (Benisty et al. 2010) and (ii) the empirical relation between the Br γ flux and the accretion rate seems to break down in the Be regime (Donehew & Brittain 2011), the accretion rate as well
as the extinctions from line ratio (Paβ/Brγ) cannot be derived reliably from our NIR spectra.
Szeifert et al.(2010) claimed that the 2008 outburst is related to a change in extinction from the dust cocoon surrounding the HBe based on the level of optical polarization in both contin-uum and spectral lines along a position angle roughly perpen-dicular to the outflow launched by the HBe. The characteristics of the HBe component during the 2008 outburst are not fully typical of EX Or objects and outbursting stars. The variation in the NIR continuum slope (colors) of the HBe with respect to the absolute NIR flux is anticorrelated with the one of V1647 Ori, PV Cep, or V1118 Ori (Gibb et al. 2006;Lorenzetti et al. 2009;
Giannini et al. 2016a). The emission lines of these four reference objects are correlated with their overall NIR brightness (outburst or quiescence) like Z CMa, based on the current stage of ob-servations (temporal baseline, frequency of the measurements) of all those systems.Stelzer et al.(2009) noted that V1118 Ori had a different X-ray luminosity and temperature variation dur-ing an outburst with respect to the behavior of Z CMa durdur-ing the 2008 outburst, thus pointing to a different outburst mechanism for these systems. Z CMa may resemble the case of PTF 10nvg where the spectrophotometry of the system seems to be driven by the rotating circumstellar disk material located at short sepa-ration (<1 au) which causes semi-periodic dimming, and by the emission of excited zones in that same disk (Kóspál et al. 2013). PTF 10nvg reproduces the behavior of the absolute flux, NIR spectral slope, and NIR emission lines of Z CMa.
The 2008 outburst can be placed in context now that the sys-tem has been monitored for several years before and after the outburst (Fig.1). VDA04 noted that photometric variations of