Conservation of the endangered Mediterranean tortoise Testudo hermanni
hermanni: The contribution of population genetics and historical demography
Saliha Zenboudji
a,⁎
, Marc Cheylan
a, Véronique Arnal
a, Albert Bertolero
c, Raphael Leblois
d, Guillelme Astruc
a,
Giorgio Bertorelle
e, Joan Ll. Pretus
f, Mario Lo Valvo
g, Giuseppe Sotgiu
h, Claudine Montgelard
a,ba
CEFE UMR 5175, CNRS, Université de Montpellier, Université Paul-Valéry Montpellier, EPHE, 1919 route de Mende, 34293 Montpellier Cedex 5, France
b
Department of Zoology, University of Johannesburg, P.O. Box 524, Auckland Park 2006, South Africa
c
Associació Ornitològica Picampall de les Terres de l'Ebre, C/La Galera 53, 43870 Amposta, Spain
d
INRA, UMR1062 CBGP, F-34988 Montferrier-sur-Lez, France
eDepartment of Life Sciences and Biotechnology, University of Ferrara, via L. Borsari 46, 44100 Ferrara, Italy f
Department of Ecology, University of Barcelona, Spain
g
Department of Biological, Chemical and Pharmaceutical Sciences and Technologies, University of Palermo, via Archirafi 18, 90123 Palermo, Italy
h
Association Zirichiltaggi-Sardinia Wildlife Conservation, s.v. Filigheddu 62/C, 07100 Sassari, Italy
a b s t r a c t
a r t i c l e i n f o
Article history: Received 30 June 2015
Received in revised form 14 December 2015 Accepted 7 January 2016
Available online xxxx
Estimating the genetic variation and demographic trends of species in decline is of major concern in conservation genetics. This study contributes to understanding how historical and anthropogenic factors shape the distribu-tion of current genetic diversity in one of the most endangered reptiles in Western Europe, the Hermann's tortoise Testudo hermanni hermanni. We used 17 microsatellite loci, chosen from a pyrosequencing library specifically developed for the subspecies to genotype eight populations distributed over about 30 sample locali-ties covering almost the entire geographic distribution of the sub-species. The population genetic results reflect a very strong genetic structure and identify three major clusters among the Hermann's tortoise in the occidental Mediterranean basin: a continental cluster (Albera in Spain, Var in France and continental Italy), an insular cluster (Corsica, Sardinia and Sicily) and a cluster of mixed lineage (Minorca). Each of the eight studied populations is characterized by only one lineage except for Minorca, in which two lineages were identified. In contrast to what most empirical studies predict, the genetic diversity of the Hermann's tortoise is greater on islands than on the continent. Islands can therefore be considered as genetic sanctuaries with high conservation potential for this species, particularly in Corsica. Historical demographic patterns inferred with a generalized stepwise-mutation model (GSM) using maximum likelihood showed significant past demographic changes in only two of the eight sampled populations: a demographic bottleneck was detected in the Albera population (Spain) and a demographic expansion in Corsica (France). In contrast to what was argued in previous studies, these results indicate that the Hermann's tortoise lineage found in Corsica is autochthonous. The origin of both lineages found in Minorca remains speculative. Lastly, our study identifies the six most relevant management units (sensu Moritz, 1994) for conservation purposes on the basis that they represent a significant part of the evolutionary leg-acy of the species. Some conservation recommendations were proposed, in particular for the most threatened population in Albera.
© 2016 Elsevier Ltd. All rights reserved.
Keywords: Conservation genetics Demographic history Microsatellites Testudo hermanni Genetic structure Conservation issues 1. Introduction
Conservation biology is an applied science that includes diverse
dis-ciplines (Soulé, 1985). Of these, genetics contributes fundamental
knowledge concerning the genetic state of populations (both genetic structure and diversity), as well as demographic trends, inbreeding/outbreeding and introgression (Frankham et al., 2009). Con-sequently, a variety of roles have been identified for the implications of
genetics in conservation (seeDeSalle and Amato, 2004). According to
Shaffer et al. (2015), one of the most direct roles of genetics in informing amphibian and reptile conservation actions involves identifying and managing the human activities that endanger wild populations. They identify three main topics that we feel are particularly relevant: the trade in threatened species, captive breeding, and the design of natural reserves and parks. For several key species, genetics has helped to identify the source of traded species, the reduction in genetic diversity associated with declining populations, and the patterns of movements
and reintroductions (Velo-Antón et al., 2011; Welton et al., 2013).
Moreover, genetics has contributed to successfully preventing inbreed-ing and outbreedinbreed-ing depression by creatinbreed-ing ex-situ captive breedinbreed-ing programs that mimic natural mating systems, and by managing levels
⁎ Corresponding author at: 1919 route de Mende, 34293 Cedex 5 Montpellier, France. E-mail address:[email protected](S. Zenboudji).
http://dx.doi.org/10.1016/j.biocon.2016.01.007
0006-3207/© 2016 Elsevier Ltd. All rights reserved.
Contents lists available atScienceDirect
Biological Conservation
of genetic variation to maximize the probability of successful
reintroductions into the wild (Austin et al., 2011; Witzenberger and
Hochkirch, 2011). At a larger scale, genetics can and should play a critical role in reserve design (Vasconcelos et al., 2012; von der Heyden et al.,
2014). Understanding the ecological and evolutionary processes that
maintain and generate biodiversity is essential for designing effective natural reserves (Smith and Grether, 2008). Genetics has been used to define many types of conservation units, such as evolutionarily
signifi-cant units (ESUs) and management units (MUs,Moritz, 1994), and
measures such as phylogenetic diversity (PD,Winter et al., 2013). These have all been proposed as critical tools in identifying the most important landscapes for protection as they can help to capture evolutionary processes (Faith, 2008; Smith and Grether, 2008).
The contraction of a species' geographic range as a consequence of habitat fragmentation constitutes a major threat to its diversity (Young and Clarke, 2000; Freeland et al., 2011). Fragmentation in-creases the isolation of populations in sparse remnant patches, causing a decrease in population size often referred to as a population bottle-neck. Its main consequence is the loss of alleles through genetic drift
leading to a reduction in genetic diversity (Bouzat, 2010; Frankham
et al., 2009). In the long term, completely isolated population fragments
will suffer elevated rates of inbreeding due to reduced geneflow
be-tween populations. This negative spiral, leading ultimately to the
disap-pearance of a population, has been named the“extinction vortex”
(Frankham et al., 2009). For the management of populations, effective
population size (Ne) is a critical piece of information (Frankham,
2007). Because reptiles and amphibians are often difficult to count in the wild, direct estimates of the number of breeding individuals are rare (Shaffer et al., 2015). The application of genetic methods can not only help to estimate the effective breeding size of a population, but for several species also offers a valuable alternative that allows the his-torical patterns of population expansion or decline to be inferred (Funk et al., 1999; Phillipsen et al., 2011; Casas-Marce et al., 2013; Kamath et al., 2015). From a conservation perspective, the identification of demographic bottlenecks is crucial because these lessen the chance of
survival of populations that have undergone significant declines
(Peery et al., 2012). The quantification of genetic variation and
demographic trends in declining and/or fragmented species is a major concern in conservation genetics studies (Lozier, 2014) since the evolu-tionary potential and, ultimately, the persistence of a species depend, among other things, on its ability to maintain genetic diversity (Frankham et al., 2009; Lozier, 2014).
Dramatic declines in the abundance of numerous species, particularly reptile species, have been driven by historical climatic events as well as several anthropogenic and ecological factors. These include landscape
transformation, environmental fluctuation and demographic
stochasticity (Collins and Storfer, 2003; Araújo et al., 2006; Bouzat, 2010; Böhm et al., 2013). This study focuses on the genetic diversity and demographic history of one of the most endangered reptiles in Europe, the western Hermann's tortoise Testudo hermanni hermanni Gmelin, 1789. The Hermann's tortoise is distributed in the Mediterranean region (Fig. 1). Two subspecies have been described byWermuth (1952)
on the basis of morphology and coloration patterns: Testudo hermanni boettgeri mainly occupies the Balkans, where it has a large and more or less continuous distribution that extends to north-eastern Italy; whereas T. h. hermanni occupies the western part of Europe in isolated populations (Cheylan, 2001; Bertolero et al., 2011). These two subspecies are separat-ed by the plain of the Po River in northeastern Italy. The fragmentseparat-ed dis-tribution of T. h. hermanni is mainly due to anthropic pressures resulting from habitat destruction and overharvesting, as well as to climate fluctu-ations of the Quaternary period that have reduced population ranges in refuges located on the northern fringe of the Mediterranean Sea (Cheylan, 1981; Morales Pérez and Sanchis Serra, 2009). Due to its
marked decline throughout most of its distribution range (Cheylan,
1984; Bertolero et al., 2011; Cheylan et al., 2011), T. h. hermanni was classed as‘endangered’ on the IUCN Red List (European Reptile and Am-phibian Specialist Group, 1996) 20 years ago. Subsequently, the Var (France) and Albera (Spain) populations were also classified as ‘endan-gered’ on the French and Spanish Red Lists (Llorente et al., 2002; UICN France et al., 2015). In contrast, the populations of T. h. hermanni in Corsi-ca and the Balearic Islands seem to show good demographic dynamism (Cheylan, 1995; Bertolero, 2014a).
Practical conservation measures to protect T. h. hermanni have
mostly been undertaken where the species is identified as vulnerable
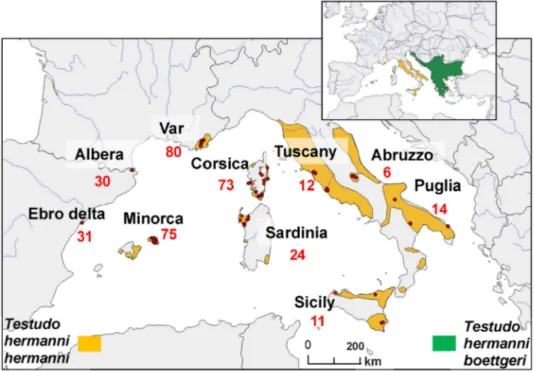
Fig. 1. Sampling areas and sample sizes of Testudo hermanni hermanni (seeTable 1for details). Sampled localities are indicated by red dots. The inset map shows the current distribution of the two Testudo hermanni subspecies: T. h. hermanni in orange and T. h. boettgeri in green (fromBertolero et al., 2011). (For interpretation of the references to color in thisfigure legend, the reader is referred to the web version of this article.)
or endangered (Bertolero, 2010a; Celse et al., 2014); several nature reserves have been created to protect their populations in the Natura 2000 network established around Europe. However, the current network of reserves reproduces the highly fragmented pattern of their distribution. In species with limited dispersal abilities, which is the case of T. h. hermanni, these reserves may become genetic ghettos for
small populations that do not harbor sufficient genetic variation. For
these species, the restoration of populations cannot be achieved through natural migration, and other conservation measures are need-ed. For example, conservation management initiatives for T. h. hermanni populations have included reintroduction projects, breeding programs and reinforcement actions (Bertolero et al., 2011). Most of these have been carried out in Spain by regional governments with the involve-ment of NGOs (Bertolero, 2010a, 2014a) and in France where transloca-tion actransloca-tions have been carried out between 1986 and 1998 by SOPTOM,
an association for the protection of the Hermann's tortoise (Devaux,
1990; Devaux and Stubbs, 1997). Equally, illegal releases are known to have taken place. Up to the current time, tortoises for translocation or breeding programs have been selected by phenotypic coloration and morphology or by known origin, without any genetic guidance or con-trol. Thus, there is some risk of admixture with T. h. boettgeri (sold in larger numbers as pets) or outbreeding depression through the disrup-tion of co-adapted gene complexes (Moritz, 1994) if released tortoises belong to different subspecies or genetic lineages.
Although most continental populations of T. h. hermanni are native, some populations are the result of reintroduction, such as in the Ebro Delta (Spain) (Bertolero et al., 2007). The origin (native or introduced) of T. h. hermanni on Mediterranean islands is debated and has been the subject of several studies based on mitochondrial and nuclear markers (Giacalone et al., 2009; Perez et al., 2013). It is considered
that T. h. hermanni is native to Sicily (Kotsakis, 1980; Delfino and
Chesi, 2008) and was introduced in the Balearic Islands by prehistoric
humans during the Neolithic period (Alcover and Mayol, 1981). The
question remains open in Corsica and Sardinia, though tortoise fossils that date prior to human occupation have been found on both islands (Hervet and Salotti, 2000; Morales Pérez and Sanchis Serra, 2009).
In this context, our study seeks to apply genetics information to conservation biology and is particularly concerned with Frankham's number 1 priority (Frankham, 2010, p. 663):“Institute rational genetic management of threatened species in the wild, especially for fragmented populations”. The objectives of our study were to (i) reveal the number of genetic units in the occidental Mediterranean basin and delimit their spatial geographic boundaries, (ii) determine the origin of the different populations (native versus introduced), (iii) estimate the level of genetic diversity and differentiation within and between groups, (iv) infer temporal demographic changes in effective population sizes, (v) detect the intensity of hybridization with the Balkan subspecies
resulting from illegal releases, and (vi) contribute to defining the
management and conservation strategies implemented for this species in Europe. To answer these questions, we used 17 microsatellite markers and exhaustive sampling covering almost the entire range of the subspecies, including populations in Albera, Minorca and Sardinia that were absent from previous studies. We also evaluated the relevance of
ourfindings in terms of the conservation implications for the species,
in particular concerning the definition of management units (sensu
Moritz, 1994).
2. Material and methods 2.1. Sampling and DNA extraction
Our sampling covered the entire range of the subspecies T. h. hermanni. A total of 357 individuals were analyzed in sample localities throughout the range: 30 individuals from Albera (Spain), 31 from the Ebro Delta (Spain), 75 from Minorca (Spain), 81 from Var (France), 73 from Corsica (France), 24 from Sardinia (Italy), 11 from Sicily (Italy) and 32 from
continental Italy (Tuscany, Abruzzo and Puglia) (seeFig. 1andTable 1). Fifteen T. h. boettgeri tortoises were added to the analysis to identify po-tential hybrids between the two subspecies. These T. h. boettgeri samples were collected at the headquarters of SOPTOM, an association for the pro-tection of the Hermann's tortoise (Station d'Observation et de Propro-tection des Tortues et de leurs Milieux) in Gonfaron, France. The exact geographical or-igin in the former Yugoslavia was known for only three of these T. h. boettgeri tortoises, so this was used as the reference for the boettgeri sam-ples. For each tortoise, 200μl of blood was collected from the nape or coc-cygeal vein and conserved in a saline solution (Queen buffer). Genomic DNA was then extracted using the DNeasy Blood and Tissue Kit (Qiagen) following the manufacturer's procedure.
2.2. Microsatellite analysis
A microsatellite library of 147 markers was specifically developed
for T. h. hermanni by the biotechnology company Genoscreen (Lille, France) using the method of high-throughput pyrosequencing (GS FLX®, Roche Diagnostics®). From this, 15 polymorphic markers were selected for genetic analysis (Zenboudji et al., in prep). We added two polymorphic microsatellite loci (Test10, Test56) characterized for
T. hermanni byForlani et al. (2005). The 17 microsatellite loci were
amplified and sequenced in six multiplexes (Zenboudji et al., in prep). Multiplexed polymerase chain reactions (PCRs) were conducted in a 10μl reaction volume containing 2 μl of H2O, 5μl of the Master Mix
so-lution from Qiagen, 1μl of each multiplexed primer at 2 μM and 1 μl of DNA. All microsatellite loci were run with the following cycling initiated by a denaturation step of 15 min at 95 °C followed by 30 cycles of denaturation (30 s at 94 °C), annealing (1 min 30 s), elongation (1 min
at 72 °C), and ending with afinal elongation step of 30 min at 60 °C.
PCR products were genotyped on a 16 capillary sequencer (3130xl
Genet-ic Analyzer, Applied Biosystems) using the“Genotypage-Séquençage”
platform at the CeMEB LabEx (Montpellier, France).
Electropherograms were visualized using GeneMapper version 4.5 (Applied Biosystems). Two independent readings were performed by two different people in order to minimize genotyping errors.
MicroChecker v.2.2.3 (Van Oosterhout et al., 2004) was used to check
for the presence of null alleles for each sample locality.
Table 1
Genetic diversity indices within each studied population of Testudo hermanni hermanni (N: sample size; AR: allelic richness; AP: number of private alleles; Ho: observed
heterozygos-ity; He:expected heterozygosity). Statistically significant Fisvalues are indicated by
aster-isks: *pb 0.05, **p b 0.01, ***p b 0.001. N AR AP Ho He Fis Continental populations Italy total 32 4.9 12 0.45 0.43 −0.06 Puglia 14 3.4 5 0.41 0.39 0.02 Abruzzo 6 3.2 0 0.56 0.47 −0.04 Tuscany 12 3.6 1 0.45 0.46 −0.06 Var (France) total 81 3.8 2 0.25 0.32 0.25* Var1 60 2.6 4 0.24 0.25 0.11*** Var2 16 2 2 0.22 0.24 0.11* Albera (Spain) 30 2 1 0.17 0.22 0.2*** Ebro Delta (Spain) 31 3.9 0 0.41 0.40 −0.01 Insular populations Minorca total 75 3.3 0 0.33 0.38 0.14*** Minorca1 35 3 0 0.27 0.30 0.1*** Minorca2 40 3.2 0 0.38 0.39 0.03* Corsica total 73 4.4 11 0.34 0.39 0.1*** Corsica1 39 2.7 1 0.33 0.32 −0.01 Corsica2 25 3.8 14 0.35 0.36 0.04 Corsica3 9 2.7 7 0.33 0.33 0.06 Sardinia 24 4.3 3 0.39 0.4 0.03 Sicily 11 3.4 4 0.38 0.38 0.05 T hermanni boettgeri 15 4.5 10 0.43 0.49 0.15*
2.3. Genetic diversity within populations
The level of genetic variation within each sampled group was mea-sured by GenAlEx v 6.3 (Peakall and Smouse, 2006) using several indi-ces: the allelic richness (AR, for a sample size of N = 11), the number of private alleles (AP), the observed heterozygosity (Ho), the expected
heterozygosity (He;Nei, 1978) and the inbreeding coefficient (FIS;
Wright, 1978). Global Hardy Weinberg tests (HW) were performed
using Genepop v.4.0.10 (Rousset, 2008) with a Markov chain
dememorization of 10,000, 100 batches and 10,000 iterations per batch. 2.4. Identification of homogenous genetic units
The number of genetic units within the subspecies T. h. hermanni was evaluated using the Bayesian clustering method implemented in Structure v. 2.3.1 (Pritchard et al., 2000). This software estimates the
likelihood of a specific number of homogenous genetic clusters (K) in
the dataset, and the relative contribution of each individual to each clus-ter, without a priori knowledge of the individual's geographical location. The data was analyzed under the admixture model with a Monte Carlo
Markov Chain (MCMC) run of 2.5 × 10⁶iterations and a burn-in period
of 6.5 × 10⁵for K varying from 1 to 18. For each value of K, 29 runs were performed to test the MCMC convergence. The most likely number of genetic groups was estimated directly using the resulting likelihood, as well as by the Evanno's method (Evanno et al., 2005).
The spatial genetic structure was described using the clustering
analysis implemented in the software BAPS v 4.14 (Corander et al.,
2008). We employed the spatial model option, using the geographical
coordinates of the individuals belonging to each population unit to be clustered. Identical color or particular tessellation cells were inferred using both molecular data and a spatial prior distribution. 1 to 5 clusters were tested and the spatial model wasfitted using 1000 iterations to es-timate the admixture coefficient for each sample with 20 replicate runs. 2.5. Divergence and relationships between populations
The level of genetic divergence between groups (sampled popula-tions as well as inferred genetic clusters) was estimated by calculating
the pairwise FST(Wright, 1978) according toWeir and Cockerham
(1984)using FSTAT v 2.9.3.2 (Goudet, 2001). The significance of the
FSTvalues (i.e.≠0) was tested using 1000 permutations. On the basis
of the pairwise FSTmatrix, a neighbor-joining (NJ) tree was constructed
using the software Population 1.2.28 (Langella, 1999), and the robust-ness of nodes was tested with 500 bootstrap replications. Based on the genetic clusters revealed by Structure, an analysis of molecular variance
(AMOVA) was performed using GenAlEx v 6.3 (Peakall and Smouse,
2006) in order to quantify the fraction of total genetic variance between genetic populations and to characterize the hierarchical distribution of genetic variation between and within populations. The percentage of the variation between populations as well as between individuals with-in populations was calculated. p-Values of F-statistics were estimated after 999 permutations.
2.6. Past demography dynamics
Demographic changes in effective population sizes and the time frame in which these changes occurred were estimated using the pro-gram Migraine Version 0.4.1 (Leblois et al., 2014, http://kimura.univ-montp2.fr/~rousset/Migraine.htm). To infer model parameters, Migraine uses the class of importance sampling algorithms (IS) devel-oped byDe Lorio and Griffiths (2004a,2004b),De Lorio et al. (2005)
and extended inLeblois et al. (2014). As it employs a generalized
stepwise-mutation model (GSM) for microsatellite loci, this method is of particular interest compared to other frequently used alternative
programs such as MSVAR (Beaumont, 1999; Leblois et al., 2014).
Mi-graine provided estimates of three parameters of interest: ancestral
θanc= 4Nancμ, actual θact= 4Nactμ, and D = T/4Nact, where Nactis the
current effective population size, Nancis the ancestral population size
(before the demographic change), T is the time measured in generations since the present, andμ is the mutation rate per locus per generation. The demographic model we used in Migraine considered an exponen-tial change of a population's size starting at T and continuing up to the present. To characterize the strength of the demographic events, we used the extra parameter Nratio= Nact/Nanc, which isb1 in the case of
a reduction in size andN1 in the case of an expansion. A significant Nratio
was determined when 1 lay outside its 95% confidence intervals (CIs)
(Leblois et al., 2014). Migraine runs were done using 20,000 trees,
2400 points and 3–9 iterations. To translate the parameters inferred
from Migraine into effective population size (N) and the timing of the
event in generations (T), we applied two mutation rates: thefirst is
the commonly used mutation rate for microsatellites,μ = 5 × 10⁻⁴
(Sun et al., 2012), and the second is consistent with the previously
reported rate for herpetofauna and long-lived vertebrates, μ =
1.5 × 10⁻³(Zhang and Hewitt, 2003). To convert the timing to years, we defined the generation time of T. h. hermanni as a period of 15 years. 3. Results
3.1. Genetic diversity within populations
In total, 148 alleles were scored for the 17 loci in the entire T. hermanni dataset (372 samples). The number of alleles per microsat-ellite locus ranged from 2 to 22 alleles. Tests for HW equilibrium did not
show significant deviation from the expected frequencies in any
popu-lations, and no linkage disequilibrium was detected among loci. A sum-mary of genetic diversity indices (AR, AP, Ho, He) based on the 17 loci is
presented inTable 1. Mean allelic richness per population (AR) varied between 2 and 4.9, whereas observed (Ho) and expected (He)
heterozy-gosities per population ranged from 0.17 to 0.56 and from 0.22 to 0.49, respectively.
All T. h. hermanni insular populations showed comparable and high genetic diversity (AR and Ho,Table 1) whereas continental populations
were more contrasted: the populations in Italy and Albera presented re-spectively the highest and lowest values for these indices (Table 1).
The meanfixation index FISpresented significant values for most
lo-calities except for those in mainland Italy (Abruzzo, Tuscany and
Pu-glia), Sardinia, Sicily and the Ebro Delta. A deficit in heterozygotes
with significant FISvalues was noted for the populations in the Var
(FIS= 0.25), Albera (FIS= 0.2), Minorca (FIS= 0.14) and Corsica
(FIS= 0.1), which persisted in the subgroups Var1, 2 and Minorca1, 2,
but not in Corsica1, 2, 3.
3.2. Identification of population units
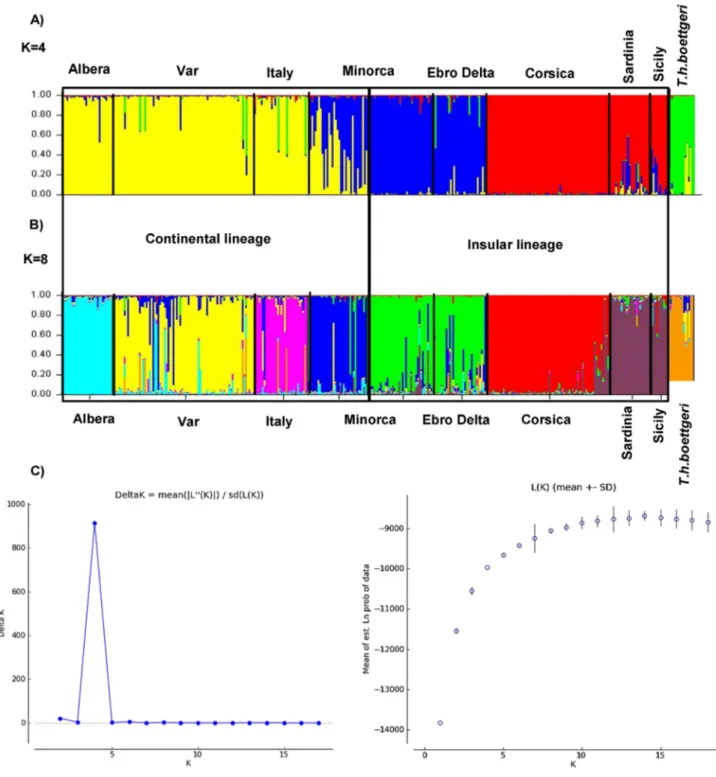
Bayesian clustering assignment, on all individuals of both subspecies (372 samples), revealed that Ln L(K) increased with the number of
clus-ters tested (K) and reached a plateau at K = 10 groups (Fig. 2C). A
strong structure for K = 4 was detected, corresponding to the highest value of the delta (K) (Fig. 2C). The four clusters differentiate the T. h. boettgeri individuals (Fig. 2A) and three clusters of T. h. hermanni: the first one consists of the populations in Albera, Var, continental Italy and one part of the island of Minorca, the second group include populations of three islands (Corsica, Sicily and Sardinia), and the third group consists of the populations of the other part of Minorca and the Ebro Delta. This analysis also revealed that several T. h. hermanni individuals show signs of introgression with T. h. boettgeri, mainly in three populations: Var, continental Italy (especially in the Abruzzo locality) and the Ebro Delta. Moreover, half of the samples from Minorca are the result of introgressions between the two lineages found on the island.
Based on the likelihood values, the result of K = 8 seems to be the
likelihood values from K = 9 to K = 18. For K = 8, of the 29 repetitions performed, 21 had the same result (Fig. 2B). This analysis also identified the group T. h. boettgeri and showed a split within continental and insu-lar lineages of T. h. hermanni structured in seven more or less homoge-neous clusters. These seven groups are structured geographically and correspond to (1) Albera, (2) Var, (3) continental Italy, (4) Corsica, (5) Sardinia and Sicily; the population of Minorca included two well-differentiated groups, (6) Minorca1 and (7) Minorca2 and Ebro Delta. Minorca1 seems to form a more or less homogeneous group. However, some individuals are primarily admixed with those of Minorca2. The latter formed a single cluster with Ebro Delta. Except for Albera, where the rate of introgression is very low, all other groups
showed the presence of admixed individuals (seeSection 4.3). Some in-dividuals from continental Italy showed signs of admixture, mainly with the populations from the Var as well as Albera. In Corsica, about ten in-dividuals, mainly from the region of Ajaccio, are highly introgressed with the group Sardinia + Sicily. The reintroduced population in the Ebro Delta displayed the highest proportion of introgression with all other populations.
The spatial distribution patterns of genetic diversity yielded no spatial structure in Italy, Albera, Sardinia or Sicily. In the Var, as in the
Structure analysis (Fig. 2B) where it appeared rather heterogeneous,
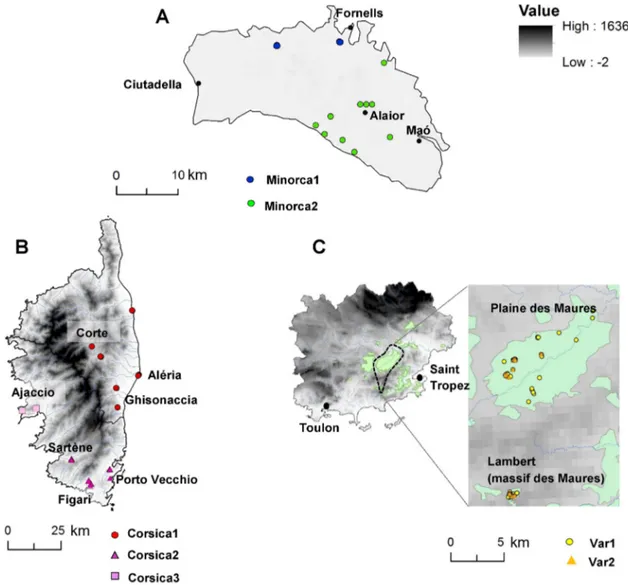
the spatial clustering analyses clearly showed the existence of two genetic subunits (Fig. 3C) that are not geographically structured since
Fig. 2. Population assignment test performed with Structure for the complete dataset. Barplots for (A) K = 4 and (B) K = 8 inferred clusters, where each vertical line represents an individual genotype for the 17 loci and each color corresponds to a genetic group. (C) Graph of likelihood LnL(K) and delta (K) in gray as a function of the number of groups, K, (Evanno's method).
both groups are present in the Plaine des Maures or in a more remote part of the massif (Lambert). Thefirst cluster (Var1 inFig. 3C) included the most samples (80%) and thus possibly represents the local genetic lineage. The other cluster (Var2 inFig. 3C) contained only 16 samples and is significantly divergent from all other groups tested (FSTN 0.3,
see Table A1 and Fig. A1).
In Corsica, three genetic subunits were evidenced (Fig. 3B) that are fully consistent with the geography of the island. Afirst group is located along the eastern plain (and the center of the island, in the Corte re-gion). A second cluster includes the southern localities of Sartène, Figari and Porto Vecchio. The third group contains samples from the area around Ajaccio and includes tortoises that show signs of introgression with the Sardinia + Sicily lineage (Fig. 2B).
In Minorca (Fig. 3A), the analysis provided the same result as Struc-ture (Fig. 2B): that is, two groups, one corresponding to the western part of the island (Minorca1) and the other located in the eastern part of the island (Minorca2). Genetic diversity indices were revalued for the seven clusters detected in the Var, Corsica and Minorca (Table 1). The heterozygosity values were quite similar to previous estimates.
However, we noticed a considerable decrease in the FISvalues for all
populations, certainly due to the disappearance of the Wahlund effect. In Corsica, the FISvalues were not significant, suggesting that the three
subunits are in panmictic equilibrium. In contrast, they remain signi fi-cant for both groups in the Var and Minorca.
3.3. Differentiation between populations
The pairwise FSTbetween the T. h. hermanni clusters varies from
FST= 0.04 between the Ebro Delta vs Minorca2 to FST= 0.58 between
Corsica1 vs Var2 (Table A1B). The test of differentiation with
permuta-tions shows that all FST values are significantly larger than zero
(p≤ 0.01), thus indicating that all populations are very well
differentiat-ed. The NJ tree based on FSTvalues (Fig. A1) was rooted with T. h.
boettgeri and shows that all insular populations and the population of the Ebro Delta clustered in a well-supported group (BP = 90). This corroborates the results from Structure and shows that the Italian populations have a basal position in the tree.
The analysis of molecular variance based on the 14 groups identified for T. h. hermanni revealed that the highest percentage of variation was partitioned within populations (62%) compared to the variation
be-tween populations (30%) and individuals (8%; Table A2). Thefixation
index showed a highly significant genetic structure (FST = 0.31;
pb 0.05). This result corroborates the strong structuring highlighted
by the Bayesian clustering analysis from Structure. 3.4. Demographic dynamics of the populations
According to the Nratioestimates produced by Migraine, only two of
the eight sampled populations showed significant demographic changes
Fig. 3. Spatial genetic clustering inferred with the BAPS program for Minorca (A), Corsica (B), and the Var (C). Light green delimits the main core areas of T. h. hermanni populations in the Var. Identical colors identify populations with a homogeneous genetic composition, whereas different colors represent genetically differentiated populations. (For interpretation of the references to color in thisfigure legend, the reader is referred to the web version of this article.)
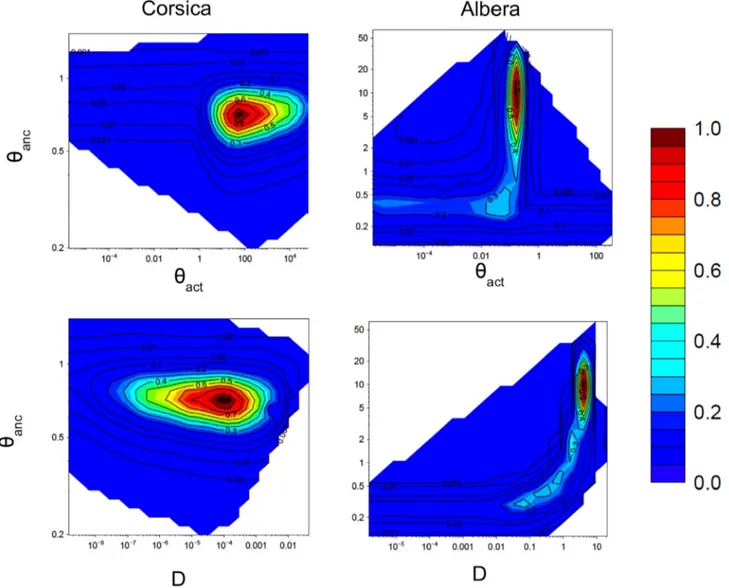
in the past: a bottleneck was detected in the population from Albera and an expansion in the population from Corsica (Table 2,Fig. 4). Migraine detected a highly significant decrease in the effective population size of the Albera population with a current Nactvalue of only 75 (or 25 with
μ2= 1.5 × 10⁻³), whereas the corresponding ancestral Nancvalue is
5000. This bottleneck is very ancient and likely occurred around 1200 generations ago, i.e. approximately 19 kyr ago (seeTable 2). In contrast, the effective population size in Corsica is about 50 times greater now than in the past. Although the CI values are very large, the timing since the beginning of this expansion is about 200 years, indicating that the expansion is probably relatively recent. For the seven remaining popula-tions, the large 95% CI values of the Nratioindicate stability.
4. Discussion
4.1. High genetic structure in T. h. hermanni
There is evidence of the presence of T. h. hermanni in Western Europe since the Plio-Pleistocene limit. The fossil record suggests that its distribu-tion range between 100,000 and 30,000 years ago extended continuously from Portugal to Italy (Cheylan, 1981; Delfino and Bailon, 2000; Morales Pérez and Sanchis Serra, 2009). Since then, two major causes have affect-ed its range by raffect-educing favorable habitats: thefirst is Quaternary climatic fluctuations, and the second, more recent, factor is human impacts such as
agricultural practices, urbanization, human-related forest fires and
poaching (Cheylan, 2004; Bertolero et al., 2011; Couturier et al., 2011; Santos and Cheylan, 2013). Another anthropogenic threat is the illegal and uncontrolled release of tortoises (mainly since 1970), as well as reinforcement programs using captive tortoises of unknown origin. Such displacements have occurred not only in different T. h. hermanni populations, but also concern animals from the Balkan subspecies T. h. boettgeri, which have been sold in large numbers as pets. In this study we assess the relative importance of these factors in explaining the pattern of genetic variability and differentiation observed between the
three major lineages of T. h. hermanni that we have identified on the
basis of 17 polymorphic microsatellite loci.
4.1.1. The continental lineage: Spain (Albera), France (Var) and Italy
One of the three identified lineages includes the three continental
populations of Albera, Var, and peninsular Italy (Fig. 2A). Among all the studied populations, the Albera showed the lowest genetic diversity
for all indices (the lowest number of alleles and private alleles and the
lowest observed heterozygosity;Table 1). This result is in line with
other ecological data indicating its alarming demographic situation (Mascort, 1997; Bertolero, 2010b; Bertolero et al., 2011). Firstly, this population currently occupies a limited geographical area of less than
150 km2, which is fragmented into small patches. Moreover, in the
last 30 years, marked signs of decline have been evidenced by very low population densities (0.3 individuals/ha for the whole distribution
range,Bertolero, 2014b, and 0.6 in the core area,Couturier et al.,
2014), as well as contraction of the surface area of the distribution
range, mainly due to forestfires, habitat destruction, illegal harvesting and intense predation by carnivores and wild boar, particularly impacting juveniles and nests (Vilardell et al., 2012). According to sev-eral studies, the current low density that characterizes this population
indicates that it is rather close to extinction (Budó et al., 2004;
Bertolero, 2010a, 2010b). This conclusion is corroborated by the signif-icant demographic bottleneck our results show for this population (Nanc= 5000 and N = 75,Fig. 4; seeSection 4.2).
The only French continental population (Var) presented an interme-diate diversity level between the Italian and Spanish (Albera)
popula-tions (see Table 1) and appeared rather heterogeneous in the
Structure analysis (Fig. 2B). This is clearly evidenced in the spatial clustering analyses, which revealed two different genetic groups in the Var (Fig. 3C). However, no geographical structure for these different groups was observed, as both are present in the massif (Lambert) and in the Plaine des Maures. A possible explanation for the presence of the minority group might be the release of tortoises originating from a continental locality that was not sampled in this study or a currently ex-tinct population. Another hypothesis is that the two mitochondrial hap-lotypes found in the Var for the ARNr 12S gene (Perez et al., 2013) might correspond to the two genetic clusters in the Var sample. More data, perhaps obtained from microsatellites and sequences in the same local-ities, is required to understand the origin of these two groups in the Var. The populations of Var1 and Albera showed a relatively low FSTvalue
and are more closely related to each other than to the Italian popula-tions (Table A1B). This result is consistent with what is known of their history. Several Late Pleistocene and Holocene fossil deposits located in the French Mediterranean region indicate that the geographic distri-bution of T. h. hermanni covered most of the territory, extending to the Albera massif in the west (Cheylan, 1981). The populations in Catalonia and Provence probably began to become isolated during the Holocene
Table 2
Migraine outputs of past demographic analysis expressed by ancestral (Nanc), current (Nact), and stable (Nstable) effective population sizes, Nratio(Nact/Nanc) and time (T) since the
demo-graphic change occurred. T is given in generations (in bold) and in years, using 15 years as the generation time of Testudo hermanni hermanni. The 95% confidence intervals are given in brackets.
Demographic event μ Nanc Nact Nstable Nratio T
Albera Bottleneck μ1= 0.0005 5000 [560–25,375] 75 [1–170] – 0.015 [0.005–0.9] 1260 [1–2448]
18,900 [1–36,720] μ2= 0.0015 1667 [187–8458] 25 [1–57] 450 [1–816]
6750 [1–12,240] Corsica Expansion μ1= 0.0005 345 [245–470] 16,825 [670–1.7e7] – 48.5 [1.8–14,609] 13.46 [1–1884.4]
202 [1–13,600] μ2= 0.0015 115 [82–156.6] 5608 [223–5.75e6] 4.5 [1–628.13]
67.5 [1–9422] Ebro Delta Stable μ1= 0.0005 – – 400 [300–550] – –
μ2= 0.0015 133 [100–183]
Var Stable μ1= 0.0005 – – 200 [150–280] – –
μ2= 0.0015 67 [50–93]
Italy Stable (expansion signal) μ1= 0.0005 – – 500 [350–650] – –
μ2= 0.0015 167 [116–217]
Minorca1 Stable μ1= 0.0005 – – 300 [200–400] – –
μ2= 0.0015 100 [67–133]
Minorca2 Stable (bottleneck signal) μ1= 0.0005 – – 150 [100–250] – –
μ2= 0.0015 50 [33–83]
Sardinia Stable μ1= 0.0005 – – 500 [400–750] – –
μ2= 0.0015 167 [133–250]
Sicily Stable (expansion signal) μ1= 0.0005 – – 500 [350–750] – –
(Forest and Cheylan, 2015). The populations of continental Italy, France and Spain likely shared a common ancestor at one point in their history as they constitute one cluster (see K = 4,Fig. 2A), which agrees with the fossil data.Perez et al. (2013)have hypothesized that the Var was colo-nized by tortoises of Italian origin. However, these three populations constitute three independent genetic units that are significantly differ-entiated (see K = 8,Fig. 2B). According to their genetic proximity, it is more probable that Var and Albera are two relictual populations that
originated from the same glacial refugium— possibly located in the
south of France or Catalonia. To confirm this hypothesis, more data is re-quired (e.g. molecular dating, tests of evolutionary scenarios or tests of other molecular markers such as SNPs).
Although T. h. hermanni tortoises from continental Italy are found in three distant regions (from Tuscany to Puglia), all samples belong to the
same rather homogeneous genetic group (K = 8 inFig. 2b). Compared
to the other two continental populations (Albera and Var), the Italian genetic group presents the greatest genetic diversity (the highest num-ber of alleles and heterozygosities;Table 1). This result is consistent with previous genetic studies (Van der Kuyl et al., 2002; Parham et al., 2006; Perez et al., 2013) that attest that the Italian peninsula acted as an effective refuge during the last glacial cycles. The presence of T. h. hermanni on the Italian peninsula appears to have been continuous
throughout the Upper Paleolithic and Holocene periods (Morales
Pérez and Sanchis Serra, 2009).
4.1.2. The insular lineage: Corsica, Sardinia and Sicily
The clustering analysis yielded an insular group (Fig. 2A) bringing together Corsica, Sardinia and Sicily. These three populations show equal levels of diversity (AP, AR, Ho;Table 1) that are substantially
higher than in the continental Albera and Var, and are similar to those observed in Italy. Most theoretical as well as empirical studies (see
Frankham, 1998; Frankham et al., 2009) predict that populations should display lower levels of genetic diversity on islands compared to main-land populations, but our data does not support this pattern. Species for which island populations have greater variation than on the
main-land are often characterized by high dispersal ability (Frankham,
1998), but this hypothesis does not hold true for the Hermann's tortoise. It can be assumed that the species' genetic diversity was effectively much higher in mainland populations than in island populations when T. h. hermanni was continuously distributed on the continent from the Iberian to the Italian peninsula. Yet due to the reduction of the continental distribution range, a drastic decrease in genetic diversity probably occurred on the continent, whereas islands are likely to have been able to preserve much of their genetic diversity. According to
Fig. 4. Pairwise likelihood-ratio profiles for Corsica and Albera from the Migraine analysis for the following parameters θanc: ancestral effective population size;θact: actual effective
population size; D: timing of the demographic history events. A past demographic bottleneck is indicated for Albera, contrasting with a very recent expansion detected in Corsica. The profiles of the analyses for the seven remaining populations that did not show significant past change in population sizes are shown in Fig. A2. All axes are represented using the log scale. Point estimate values for each parameter and the associated 95% confidence interval are shown inTable 2.
this hypothesis, islands can thus now be considered as genetic sanctuar-ies with important conservation potential for the Hermann's tortoise, particularly in Corsica.
FSTvalues revealed that the Corsica as well as the Sicily + Sardinia
population are highly differentiated from the continental populations (Albera, Var, Italy; Table A1), allowing the rejection of the hypothesis of recent colonization of the three islands from the neighboring conti-nental populations. This result is also confirmed by the study ofFritz et al. (2006)based on cytochrome b sequences and showing that tor-toises from Corsica, Sicily and Sardinia belong to the same lineage. Moreover, in a study based on the mitochondrial cytochrome b and
control region genes,Giacalone et al. (2009)hypothesized that local
extinction occurred in Corsica and Sardinia followed by a subsequent recolonization of tortoises probably originating from Sicily, either by natural oversea dispersal or translocation by humans. A study by
Perez et al. (2013)validated this assumption, observing a strong genetic similarity between tortoises in Corsica and Sicily. However, our data does not support the hypothesis of lineage replacement in Corsica for the following two reasons: (1) samples from Sardinia and Sicily are much more closely related compared to Corsica, which is more distantly related (seeFig. 2B); (2) over all sampled populations, Corsica shows the largest number of private alleles (Table 1). Thesefindings reinforce the theory of an ancient origin of Corsican tortoises that can thus be
con-sidered as an autochthonous lineage. On the other hand, ourfindings
(FST, clustering) clearly indicate high genetic similarity between the
populations of Sardinia and Sicily, thus corroborating the hypothesis of the extinction of the original lineage in Sardinia followed by repopu-lation from Sicily. The study of chelonian fossils of the Castiglione
(northern Corsica) deposit confirm the presence of Hermann's tortoise
remains dating from the Middle Pleistocene (Hervet and Salotti,
2000), constituting strong evidence that Hermann's tortoise is native
to Corsica, although the timing of the species' arrival is still unclear. 4.1.3. Minorca populations
Two distinct genetic lineages were identified in Minorca. The first is located in the western part of the island (Minorca1) and belongs to the continental lineage (Figs. 2A and A1). The strong significance of the FIS
values for Minorca1 may be explained by a possible recent founder effect. This would suggest that Minorca1 is of recent origin, supporting the idea of human introduction, most likely from a missing continental population that is currently extinct. This assumption is consistent with the history of past commercial exchanges that occurred in the Mediter-ranean region, especially between Catalonia (NE Spain) and Minorca. The second lineage observed (Minorca2) is found exclusively in Minorca and is located in the eastern part of the island. According to the FSTvalues (Fig. A1), Minorca2 is more closely related to the insular
lineage (Corsica + Sardinia + Sicily) than to the continental lineage. The inbreeding coefficient is also significant in Minorca2; however, it re-mains very weak compared to Minorca1. This could be explained by a much older founder effect, possibly reflecting a very ancient introduc-tion or arrival to the island. The origin and arrival of the Minorca2 line-age remain unknown, but in view of the genetic divergence estimates (Fst, Table A1), it is currently difficult to settle on one of two hypotheses:
that the population has an ancient autochthonous lineage or that it was introduced from an unknown insular lineage that is much older than that of Minorca1. There is evidence of the presence of Hermann's tortoise in the Balearic Islands during the Talayotic period (about
3000 BP) (Alcover and Mayol, 1981), which is compatible with a
hypothesis of human introduction during the Neolithic period (Alcover et al., 1981). However, the tortoise remains found in Mallorca were not directly dated, so it is possible that they do not belong to the stratum that was dated (Alcover com. pers.;Bertolero, 2014b). Further study of Mallorca's tortoise populations would be crucial for a better un-derstanding of the colonization scenarios of the Balearic Islands. It should be mentioned that some evidence of introduction already exists in Mallorca; for example, the study ofFritz et al. (2006)revealed the
presence of continental and insular haplotypes based on Cyt b sequences.
Minorca2 belongs to a cluster that includes the reintroduced popula-tion of the Ebro Delta. The latter populapopula-tion is made up of released tor-toises from the Balearic Islands and others from an unknown origin. The Ebro Delta population displays the highest proportion of introgression of all other populations and shows high genetic variability (AR: 3.9,
Table 1), probably because the founder individuals provided alleles of various origins. The results suggest that captive tortoises from the Balearic Islands used for reintroduction programs in the Ebro Delta
Natural Park mainly came from the southeast of Minorca. Thisfinding,
together with the differences found between the continental and insu-lar lineages, does not corroborate the hypothesis suggesting that T. h. hermanni from Sicily could have contributed to the repopulation of the Spanish coast and the Mediterranean islands (Perez et al., 2013). 4.2. Demographic history: congruence between genetic and demographic information?
Our analysis of past demographic dynamics detected a significant
change in the effective population sizes in only two populations: a de-mographic bottleneck for the Albera population and a dede-mographic
ex-pansion in Corsica (Table 2,Fig. 4). However, the inference of the
different model parameters appears globally imprecise, with large con-fidence intervals. These are likely due to the limited amount of informa-tion present in the genetic data. In Albera, the bottleneck signal
represented in the two-dimension likelihood-ratio profile inFig. 4
shows a high peak in the likelihood surface for high D values (around 2–8), suggesting a relatively old contraction in population size. On one hand, considering this peak and the point estimate of the time since the demographic change, this analysis of the Albera population suggests that the contraction occurred approximately at the Last Glacial
Maxi-mum (around 19 kyr, considering a mutation rate ofμ1= 5 × 10⁻⁴).
On the other hand, given the large confidence intervals, one cannot ex-clude a much more recent decrease in population size. In fact, the lower bound of the CI does not allow the exclusion of a very recent contraction that occurred in the last generations/years. Thus the hypothesis that re-cent human impact has been preponderant in the process of population decline is not the strongest signal given by our Migraine analysis, but this cannot be completely rejected. Interestingly, the inference of the ac-tual population size was more precise, suggesting a relatively low cur-rent population size. Given its geographical isolation, the Albera population thus seems exposed to a high risk of inbreeding depression. According toFrankham et al. (2014), a Ne⩾ 100 is required to limit
in-breeding depression to 10% overfive generations. With Neestimated
at between 1 and 170 (95% CI) for Albera, the effective population size falls within the threshold proposed by Frankham et al. as resulting in in-breeding depression. The estimated density available for this population
shows a minimum of 3500 adults (Bertolero, 2010a). Thus, we note a
marked difference between the effective population size (in the genetic sense) and the actual population size (in the demographic sense). This difference is higher than expected (which is often a factor of 10) (Frankham, 2007; Frankham et al., 2014). It is not possible at this stage to provide an explanation for this.
In contrast, our analyses suggest that a demographic expansion occurred in the Corsica population. This expansion may correspond to
the period of high anthropic exploitation in the 19th andfirst half
of the 20th century, during which the clearing of landscapes was
favorable to Hermann's tortoise. However, the confidence interval
proposed (1–13,600 years) does not allow the confirmation of this
hypothesis.
For the other populations, our analyses did not detect any significant past demographic events. In some populations, the likelihood-ratio profiles correspond to perfectly stable populations with a Θstablevalue
allowing the estimation of the stable effective size Nstable(Ebro Delta,
populations, for which we cannot reject a scenario of stability, do, how-ever, show some signs of past changes in population size that were not strong enough or were too recent or old to be detected with the 17 mi-crosatellite loci used in this study (an expansion signal in Italy and Sic-ily; a bottleneck in Minorca2;Table 2, Fig. A2).
The demographic data available for these populations shows con-trasting recent demographic dynamics that were not demonstrated by the genetic analysis. In the genetic analysis, the Var population did not show signs of decline, even though it has been considerably reduced
and fragmented over the course of the last century (Cheylan et al.,
2009). In the same way, the Sicily population, whose genetic data
indicates stability, or even expansion, is today found only in three extremely reduced and isolated patches, clearly showing a process of
contraction in its distribution range on this island (Turrisi and
Vaccaro, 2004). In contrast, the Minorca population, whose numbers were reduced in the 1970s and 1980s by intense agricultural exploita-tion, today shows strong expansion due to the abandonment of farmland, freeing up land that has been recolonized by the species (Bertolero, unpublished). The same goes for the population introduced to the Ebro Delta in 1987, which shows an annual growth rate of 2.5% as well as marked spatial expansion (Bertolero, 2002). The genetic in-formation did not detect any expansion signals in either case. The re-sults obtained for the populations of Sardinia (stable) and continental Italy (stable, expansion signal) also contradict what we know about
the actual population dynamics (Mazzotti, 2004; Corti et al., 2013).
Thus, the results must be interpreted with caution given the insuf ficien-cy of the genetic sample.
The weak apparent congruence between the genetic data and the
demographic data has several explanations. Thefirst is the generation
time. The Hermann's tortoise has a long generation time of around 15 years, which is barely six generations a century. However, events less than 10–20 generations are difficult to detect with currently avail-able methods (Leblois et al., 2014). Secondly, the number of
microsatel-lite loci analyzed may not be sufficient and then has an effect on the
ability to detect changes on a demographic scale. Taking this into account, it is not surprising that recent demographic changes were not detected for these populations, though they have been clearly shown by demographic monitoring or by empirical studies of the recent evolu-tion of these populaevolu-tions.
The marked differences found between effective populations and ac-tual censused populations can be surprising (the effective population size of the Var population is between 50 and 280 individuals, while the actual population size is more than 30,000 adult individuals (Cheylan et al., 2009). This divergence may be due to the weak dispersal ability of the Hermann's tortoise, leading to a strong local genetic struc-ture. As a result, the estimated effective population may not express the effective population of the whole population, but only of the subgroup sampled for the genetic analysis (Leblois et al., 2006). Furthermore, one must take into account the CIs of the estimates, which are often very large, as shown inTable 2.
Given these divergences, it is important to interpret demographic information provided by genetic data with caution, particularly when
considering operational data that will be used to define the
conserva-tion management of populaconserva-tions. 4.3. Conservation issues
In total,five genetic groups (Albera, mainland Italy, Minorca1, and
the two genetic groups of the Var) have been identified as belonging
to the continental lineage, whereasfive others can be considered as
belonging to the insular lineage (Minorca2, Sicily + Sardinia, and the three genetic clusters in Corsica). In order to adapt the conservation strategies for each of these T. h. hermanni populations and to remedy the alarming situation of some of them, our study aimed to identify the most relevant groups for conservation. Our analyses yielded
different genetic lineages of T. h. hermanni on which specific ESUs
(evolutionarily significant units;Moritz, 1994) and MUs (management
units;Moritz, 1994) can be proposed.
4.3.1. Evolutionarily significant units and management units for T. h.
hermanni
Many authors believe that genetically differentiated populations within species should not be treated together and require separate
ge-netic management (seeMoritz, 1994, 1995). These populations are
re-ferred to as evolutionarily significant units, as they represent an
important part of the evolutionary legacy of the species. ESUs are de-fined as sets of populations showing reciprocal monophyly of mtDNA
combined with significant divergence of allele frequencies at nuclear
loci (Moritz, 1994). According to the high genetic differentiation
among the inferred genetic clusters, our results strongly support three genetically isolated ESUs: (i) continental (Albera, Var, peninsular Italy and Minorca1); (ii) island 1 (Corsica, Sardinia and Sicily); and (iii) is-land 2 (Minorca2). Although we have the information about the recip-rocal monophyly of the continental and island 1 ESUs based on the CytB gene (Fritz et al., 2006), a study with a larger number of mitochon-drial markers should be carried out in order to verify the monophyly of the third ESU.
Because the populations of T. h. hermanni are fragmented geograph-ically and the species' limited dispersal ability means these populations are isolated from each other, they can be considered as demographically independent. Hence, it is crucial to supplement ESUs with another type
of conservation unit. Defining management units (MUs) is ideal for
in-situ management of natural populations that justifying distinct conser-vation and management strategies. These are populations that are important to conserve because they are entities connected by such a
weak geneflow that they are functionally independent. Based on this
definition and given their geographical isolation (with the exception
of the two genetic groups of the Var), each genetic entity revealed by our study could be considered a separate MU. However, for management convenience, we propose six MUs for this species: (1) Albera + Minorca1; (2) Var; (3) Italy; (4) Sardinia + Sicily; (5) Cor-sica; and (6) Minorca2. These six genetic groups are isolated geograph-ically, and their genetic uniqueness indicates that they should be considered as independent units. Traditionally, the Balearic populations of Hermann's tortoises have received little attention due to their assumed status as human-introduced fauna. However, as one of the lin-eages we found is actually exclusive to Minorca, we believe it needs to be regarded as a unit of high conservation value.
4.3.2. Hybridization with T. h. boettgeri
Since the last decades of the 20th century, translocations and illegal releases of tortoises are known to have been frequent, notably with regard to the Balkan subspecies T. h. boettgeri, which has been sold in
large numbers as pets (Lambert, 1984). However, signs of admixture
between T. h. hermanni and T. h. boettgeri are rather limited and seem to concern only continental populations, with the exception of Albera.
Four introgressed tortoises (out of 31) were identified in the Ebro
Delta, which is not really surprising since all animals released there were captive-bred. In Italy, three hybrids (out of 32) have been found, which may be explained by illegal introductions as these have been
re-ported in many places (Mazzotti, 2004). In the Var, onlyfive T. h.
hermanni individuals (out of 81) have been detected with T. h. boettgeri alleles, thus revealing less introgression than may have been expected
given the numerous releases that have taken place (Cheylan et al.,
2009). One noteworthy point is that no cases of hybridization between
T. h. hermanni and T. h. boettgeri have been detected on the four studied islands, suggesting that translocations were less frequent there than on
the continent. However, in Corsica some samples have been identified
with alleles originating from Sardinia. It can be presumed that they likely result from human translocations.
4.3.3. Practical recommendations
This study has allowed us to genetically identify almost all the occi-dental populations of T. h. hermanni. We could therefore use genetics to identify captive or collected animals that could potentially be used in translocation programs. In particular, in order to prevent the Albera population from suffering the same fate as its neighboring population on the French side of the border (which completely disappeared in the 1960s), a compromise would be to reinforce this population with
in-dividuals from Minorca1 or Var, which have been identified as the
ge-netically closest populations (see Table A1). Many reintroduction projects that have been carried out in Catalonia and the region of Valen-cia have involved tortoises from Minorca, but there has never been any control or genetic identification of the released individuals. Before
car-rying out releases in natural environments, the genetic identification
of individuals needs to be performed in order to avoid potential prob-lems linked to outbreeding depression (loss of local adaptation, genetic incompatibility and gene disruption through chromosomal differences),
whose effects are expressed from thefirst generations. Moreover, the
genetic monitoring of individuals involved in breeding programs is also essential to prevent inbreeding caused by incorporating new alleles issuing from genetically close individuals.
As is the case for several Spanish populations, new populations consisting of released captive tortoises and/or tortoises of unknown or-igin can be introduced a few hundred kilometers away from natural
populations and be managed independently of the previously defined
MUs. In general, these heterogeneous populations are useful for the conservation of the species as they expand its distribution range. Fur-thermore, because of their isolation from natural populations, intro-duced populations could be used as release sites for captive tortoises that have not been accepted in reinforcement projects (following the required genetic and sanitary controls).
Our recommendation for future reintroduction programs is to genet-ically select all released individuals to ensure they belong to the same ESU as the natural population of the region where the reintroduction will take place.
5. Conclusion
Using fairly exhaustive sampling and a high number of specific and
polymorphic microsatellite markers, this study allowed identify three main genetic lineages among the subspecies T. h. hermanni in the occi-dental Mediterranean basin: one continental and two island lineages. Moreover, the genetic uniqueness of the T. h. hermanni populations within each geographic region reflects a very strong genetic structure.
As a result of ourfindings, we are able to propose six management
units as the most relevant for conservation purposes. Although the ori-gin of the two lineages detected in Minorca remains speculative, one (Minorca2) is actually exclusive to this island. We also confirmed that of the three genetic groups found in Corsica, two are very different from the Sardo-Sicilian group, leading us to conclude that the lineage actually present in Corsica is autochthonous. Using demographic history analyses, we found evidence to indicate that the bottleneck detected in the Spanish Albera was very old and severe.
Taken together, these results allow us to conclude that rigorous monitoring of genetic breeding programs already in place is essential to avoid problems associated with inbreeding depression. One solution would be to incorporate new alleles in a population by the release of in-dividuals from genetically related populations. Finally, our work high-lights the need to further study the impact of landscape and landscape
changes (as a barrier to geneflow) on the fine genetic structure of
each population. Indeed, the minority lineage observed in the Var sug-gests that the full range of genetic diversity of T. h. hermanni has not yet been evidenced. In particular, captive individuals kept as pets de-serve more attention in revealing the whole genetic complexity of the species. Lastly, our results could be taken into account in future
reinforcement programs and used to help identify the genetic member-ship of captive individuals to be released.
Acknowledgments
This study was supported by the Foundation for Research on Biodi-versity (FRB: Fondation pour la Recherche sur la Biodiversité) with CORSEPYR project funding (AAP-IN-2009-15). The French National Action Plan (PNA: Plan National d'Action)financed the sample-collecting field work and partly funded the production of molecular data [French ministery of ecology grants (DREAL-PACA): CNRS contract n° 077100 in 2013 and CNRS contract n° 131759 in 2014]. The regional governments of Catalonia and the Balearic Islands (Generalitat of Catalonia and the Govern de les Illes Balears) authorized our scientific work. Field work in the Ebro Delta, the Albera and Minorca was partially funded by the Ebro Delta Natural Park, the Generalitat de Catalunya, the Institut Menorquí d'Estudis (IME) and the Spanish Ministry of Science and Technology (CICYT CGL2004-0473/BOS). All molecular data were generated at the technical facility of the Mediterranean Center of the Environment and Biodiversity (CeMEB: Centre Méditerranéen de l'Environnement et de la Biodiversité) in Montpellier, France. Microsatellite genotyping was carried out at the MBB platform of the CeMEB LabEx laboratory in Montpellier. The Migraine analysis was carried out using the MIGALE and GenoToul bioinformatics platforms at the French National Institute of Agronomic Research (INRA: Institut National de la Recherche Agronomique) and the computing grids of the Center of Biology for Population Management (CBGP: Centre de Biologie pour la Gestion des Populations) laboratory. Appendix A. Supplementary data
Supplementary data to this article can be found online athttp://dx. doi.org/10.1016/j.biocon.2016.01.007.
References
Alcover, J., Mayol, J., 1981.Espècies relíquies d'amfibis i de rèptils a les Balears i Pitiüses. Bol. Soc. Hist. Nat. Baleares 25, 151–167.
Alcover, J.A., Casasnovas, G.C., Moyà-Solà, S., Moyà, J.P., 1981.Les Quimeres del Passat: Els Vertebrats Fòssils del Plio-Quaternari de les Balears i Pitiüses. Moll.
Araújo, M.B., Thuiller, W., Pearson, R.G., 2006.Climate warming and the decline of am-phibians and reptiles in Europe. J. Biogeogr. 33, 1712–1728.
Austin, J.D., Gorman, T.A., Bishop, D., Moler, P., 2011.Genetic evidence of contemporary hybridization in one of North America's rarest anurans, the Florida bog frog. Anim. Conserv. 14 (5), 553–561.
Beaumont, M.A., 1999.Detecting population expansion and decline using microsatellites. Genetics 153 (4), 2013–2029.
Bertolero, A., 2010a. Cens i distribució de la tortuga mediterrània a la serra de l'Albera. Avaluació de la situació durant 2010. Unpublished report to Ministry of the Environ-ment and Housing. GovernEnviron-ment of Catalonia.
Bertolero, A., 2002.Biología de la tortuga mediterránea Testudo hermanni aplicada a su conservación. PhD thesis, Universitat de Barcelona, Barcelona.
Bertolero, A., 2010b. Tortuga mediterránea Testudo hermanni. In: Salvador, A., Marco, A. (Eds.), Enciclopedia Virtual de los Vertebrados Españoles. Museo Nacional de Ciencias Naturales, Madrid (http://www.vertebradosibericos.org/).
Bertolero, A., 2014a.Statut, répartition actuelle et réintroduction de la Tortue d'Hermann en Espagne. Chelonii 9, 35–40.
Bertolero, A., 2014b.Testudo hermanni Gmelin, 1789. In: Ramos, M.A., et al. (Eds.), Fauna Ibérica, vol. 10, 2nd edición Reptiles. Museo Nacional de Ciencias Naturales. CSIC, Madrid, pp. 217–236 (In: Salvador, A. (Coordinador) revisada y aumentada).
Bertolero, A., Oro, D., Besnard, A., 2007.Assessing the efficacy of reintroduction programmes by modelling adult survival: the example of Hermann's tortoise. Anim. Conserv. 10, 360–368.
Bertolero, A., Cheylan, M., Hailey, A., Livoreil, B., Willemsen, R.E., 2011.Testudo hermanni (Gmelin 1789)—Hermann's tortoise. Conservation biology of freshwater turtles and tortoises: a compilation project of the IUCN/SSC tortoise and freshwater turtle spe-cialist group Chelon. Res. Monogr. 5, 070–071.
Böhm, M., Collen, B., Baillie, J.E., Bowles, P., Chanson, J., Cox, N., Cheylan, M., et al., 2013.
The conservation status of the world's reptiles. Biol. Conserv. 157, 372–385.
Bouzat, J.L., 2010.Conservation genetics of population bottlenecks: the role of chance, se-lection, and history. Conserv. Genet. 11, 463–478.
Budó, J., Capalleras, X., Fèlix, J., Mascort, R., 2004. La Tortuga Mediterrània (Testudo hermanni) a l'Albera: Causes de Regressió, Estat Actual de les Poblacions i Perspec-tives de Futur. Colloqui Internacional l'Albera i el Patrimoni en l'espai Transfronterer (www.tortugues.cat/pdf/05_tortuga_mediterranea.pdf).
Casas-Marce, M., Soriano, L., López-Bao, J.V., Godoy, J.A., 2013.Genetics at the verge of ex-tinction: insights from the Iberian lynx. Mol. Ecol. 22 (22), 5503–5515.