Interplay between SOX9,
β-catenin and PPARγ activation in
colorectal cancer
Anna Panza
a,1, Valerio Pazienza
a,1, Maria Ripoli
a, Giorgia Benegiamo
a, Annamaria Gentile
a,
Maria Rosaria Valvano
a, Bartolomeo Augello
b, Giuseppe Merla
b, Clelia Prattichizzo
c, Francesca Tavano
d,
Elena Ranieri
c, Pierluigi di Sebastiano
d, Manlio Vinciguerra
e, Angelo Andriulli
a,
Gianluigi Mazzoccoli
f,⁎
,1, Ada Piepoli
a,⁎⁎
,1aDepartment of Medical Sciences, Division and Laboratory of Gastroenterology, IRCCS Scientific Institute and Regional General Hospital “Casa Sollievo della Sofferenza”,
Opera di Padre Pio da Pietrelcina San Giovanni Rotondo (FG), Italy
bMedical Genetics Unit, IRCCS Scientific Institute and Regional General Hospital “Casa Sollievo della Sofferenza”, Opera di Padre Pio da Pietrelcina San Giovanni Rotondo (FG), Italy cDepartment of Medical Science and Surgery, University of Foggia, Italy
dDepartment of Surgery, IRCCS Scientific Institute and Regional General Hospital “Casa Sollievo della Sofferenza”, Opera di Padre Pio da Pietrelcina San Giovanni Rotondo (FG), Italy e
University College London, Institute for Liver and Digestive Health, Division of Medicine, Royal Free Campus, London, UK
fDepartment of Medical Sciences, Division of Internal Medicine and Chronobiology Unit, IRCCS Scientific Institute and Regional General Hospital “Casa Sollievo della Sofferenza”,
Opera di Padre Pio da Pietrelcina San Giovanni Rotondo (FG), Italy
a b s t r a c t
a r t i c l e i n f o
Article history: Received 23 July 2012
Received in revised form 3 April 2013 Accepted 5 April 2013
Available online 11 April 2013 Keywords:
SOX9 PPARγ β-catenin Colorectal cancer Colon cancer cell lines
Colorectal carcinogenesis relies on loss of homeostasic mechanisms regulating cell proliferation, differentia-tion and survival. These cell processes have been reported to be influenced independently by transcripdifferentia-tion factors activated downstream of the Wnt pathway, such as SOX9 andβ-catenin, and by the nuclear receptor PPARγ. The purpose of this study was to explore the expression levels and functional link between SOX9, β-catenin and PPARγ in the pathogenesis of colorectal cancer (CRC). We evaluated SOX9, β-catenin and PPARγ expression levels on human CRC specimens by qPCR and immunoblot detection. We tested the hy-pothesis that PPARγ activation might affect SOX9 and β-catenin expression using four colon cancer cell lines (CaCo2, SW480, HCT116, and HT29 cells). In CRC tissues SOX9 resulted up-regulated at both mRNA and protein levels when compared to matched normal mucosa,β-catenin resulted up-regulated at protein levels, while PPARG mRNA and PPARγ protein levels were down-regulated. A significant relationship was ob-served between high PPARG and SOX9 expression levels in the tumor tissue and female gender (p = 0.005 and p = 0.04, respectively), and between high SOX9 expression in the tumor tissue and age (p = 0.04) and microsatellite instability (MSI), in particular with MSI-H (p = 0.0002). Moreover, treatment with the synthetic PPARγ ligand rosiglitazone induced different changes of SOX9 and β-catenin expression and subcellular localization in the colon cancer cell lines examined. In conclusion, SOX9,β-catenin and PPARγ ex-pression levels are deregulated in the CRC tissue, and in colon cancer cell lines ligand-dependent PPARγ ac-tivation unevenly influences SOX9 and β-catenin expression and subcellular localization, suggesting a variable mechanistic role in colon carcinogenesis.
© 2013 Elsevier B.V. All rights reserved.
1. Introduction
Colorectal cancer (CRC) is one of the most common malignancies in developed countries and a major cause of cancer-related death worldwide[1]. Presently, thefirst-choice treatment is surgical exci-sion with or without adjuvant chemotherapy[2], but the identi fica-tion of novel biomarkers for prognosis and molecular targets for therapeutic intervention isfirmly needed. CRC onset and progression are linked to mutational pathways, such as chromosomal instability (CIN) and microsatellite instability (MSI)[3], and colorectal carcino-genesis is related to the progressive loss of homeostatic control of cell proliferation, differentiation and apoptosis[4]. The transcription factors play a key role in the regulation of these cell processes. An
⁎ Correspondence to: G. Mazzoccoli, Department of Medical Sciences, Division of Internal Medicine and Chronobiology Unit, IRCCS Scientific Institute and Regional General Hospital “Casa Sollievo della Sofferenza”, Opera di Padre Pio da Pietrelcina, Viale Cappuccini n.1, 71013, San Giovanni Rotondo (FG), Italy. Tel.:+39 0 882 835228; fax: +39 0 882 410271. ⁎⁎ Correspondence to: A. Piepoli, Department of Medical Sciences, Division and Laboratory of Gastroenterology, IRCCS Scientific Institute and Regional General Hospital “Casa Sollievo della Sofferenza”, Opera di Padre Pio da Pietrelcina, Viale Cappuccini n.1 71013, San Giovanni Rotondo (FG), Italy. Tel.:+39 0 882 416281; fax: +39 0 882 410271.
E-mail addresses:[email protected](G. Mazzoccoli),
[email protected](A. Piepoli).
1
These authors have contributed equally.
0167-4889/$– see front matter © 2013 Elsevier B.V. All rights reserved.
http://dx.doi.org/10.1016/j.bbamcr.2013.04.004
Contents lists available atSciVerse ScienceDirect
Biochimica et Biophysica Acta
j o u r n a l h o m e p a g e : w w w . e l s e v i e r . c o m / l o c a t e / b b a m c remerging role is attributed to SOX [sex-determining region Y (Sry) box-containing], member of a transcription factor family with homol-ogy in their 79-amino acid DNA-binding domain known as the HMG box. SOX family is involved in the control of stem cell maintenance and cell phenotype choice during embryonic development and commit-ted differentiation in multiple organ systems[4]. In particular, SOX9 is considered an important regulator of cell fate and differentiation and is implicated in the maintenance of a non differentiated population of putative stem/progenitor cells for adult tissue renewal in intestinal epithelium, critical for maintaining constant integrity of epithelial barriers[5]. In the colon, SOX9 is localized to the proliferative compart-ment of the intestinal epithelium and is involved downstream in the Wnt/β-catenin signaling for the management of epithelium homeosta-sis[4,6,7]. Aberrant proliferation of tissue-specific stem cells is im-plicated in gastrointestinal tumorigenesis, and SOX9 has been found deregulated in many types of cancer[8–11]including those of the di-gestive system and in particular in colorectal cancer[4].
The key effector protein in Wnt pathway is the transcription acti-vatorβ-catenin, whose coding gene (CTNNB1) can function as an on-cogene involved in tumor cell phenotype onset[12,13]. Cytoplasmic β-catenin forms a complex with APC (adenomatous polyposis coli), the associated protein Axin/Conductin, protein kinases such as casein kinase (CK) and glycogen synthase kinase-3β (GSK-3β), which phos-phorylateβ-catenin and other elements of the molecular proteolytic complex. Phosphorylated (p)β-catenin is an ephemeral, transcrip-tionally inactive mediator, whose half life is settled on by the closely controlled equilibrium between phosphorylation, dephosphorylation, ubiquitination, proteasomal degradation and subcellular localization. β-catenin translocates from the cytoplasm to the nucleus and inter-acts with the TCF/LEF1 family transcription factors, inducing the ex-pression of target-genes such as MYC and CCND1[13,14].β-catenin is also involved in cell adhesion, bridging between cadherins and the actin cytoskeleton at the cell–cell adherens junctions. Deregula-tion ofβ-catenin levels, partly caused by mutations of the APC gene, is thought to play a role in the development of colorectal cancer
[15]. In over 80% of human colon cancers occur mutations in APC, which determine large deletions in the C-terminus of the protein[16]. Another important cell fate regulator is represented by PPARγ (Peroxisome Proliferator-Activated Receptor γ), a ligand-activated transcription factor belonging to the large superfamily of nuclear recep-tors. PPARγ is known to regulate cellular proliferation/differentiation, and could be involved in gastrointestinal cancerogenesis [17–20]. High levels of PPARγ expression are measured in the normal mucosa of colon and rectum [21], and enhanced tumorigenicity in mouse small intestine and colon has been found associated with decreased in-testinal PPARγ levels[22]. Accordingly, in a number of colorectal cancer patients decreased PPARγ expression levels have been found compared with adjacent normal colonic mucosa[23]. On the other hand, in a large series of primary colorectal cancers more than half of tumors were char-acterized by PPARγ overexpression when compared to the matched normal mucosa[24], but with a significant association between PPARγ downregulation, occurrence of distant metastases and poorer overall patients' survival[25,26]. The biomolecular events involved are not yet clear, but PPARγ deregulation probably plays different and context dependent roles in CRC onset and progression. Recently the effects of PPARγ activity on gastrointestinal tract tumor biology have been pinpointed by studies exploring genetic mechanisms to assess the role of PPARγ as a tumor suppressor and inducer of differentiation of cancer stem cells, and evaluating the clinical applications and potential therapeutic employ of PPARγ agonists in colorectal cancer treatment
[24,27–29].
PPARγ is able to maintain lower steady-state levels of β-catenin in the presence of a normal APC pathway, and ligand related PPARγ ac-tivation decreasesβ-catenin levels[30].
Based on these premises, considering the effects of PPARγ ligands on cell fate and its direct interaction onβ-catenin[31,32], and the role
of Wnt/β-catenin target-gene SOX9 in colorectal cancer onset and progression[4,7,8], we hypothesized that the interaction between PPARγ activation and SOX9 expression may play a role via β-catenin signaling in colorectal cancerogenesis. To address this hypothesis, we have investigated PPARγ, SOX9 and β-catenin expression levels in human colorectal cancer specimens, evaluating their relationships to clinical and pathological features, and assessed the effects of PPARγ activation on SOX9 and β-catenin expression in vitro in colon cancer cell lines.
2. Materials and methods 2.1. Patients and tissue specimens
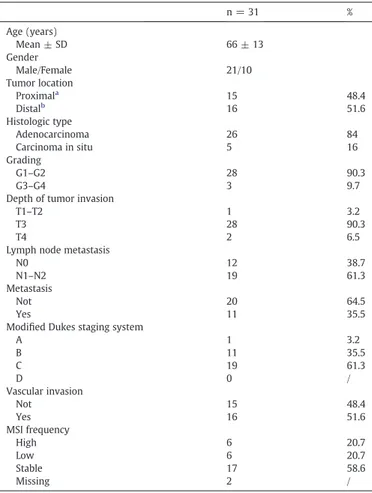
We analyzed primary tumors and matched normal specimens from a cohort of 31 CRC patients undergoing curative surgery at our Institu-tion (21 men and 10 women, mean age ± SD 66 ± 13 years). Clinical and pathological features of colorectal cancer patients are shown in
Table 1. Tissue specimens, collected according to the guidelines of the local Ethical Committee, were immediately frozen in liquid nitrogen and stored at−80 °C until nucleic acid and protein extraction. Written informed consent was obtained from each patient in accordance with the Institutional guidelines.
Our investigation has been conducted in accordance with the eth-ical standards and the Declaration of Helsinki, and according to the national and international guidelines, after approval of our Institu-tional Review Board.
Table 1
Clinical and pathological features of colorectal cancer patients.
n = 31 % Age (years) Mean ± SD 66 ± 13 Gender Male/Female 21/10 Tumor location Proximala 15 48.4 Distalb 16 51.6 Histologic type Adenocarcinoma 26 84 Carcinoma in situ 5 16 Grading G1–G2 28 90.3 G3–G4 3 9.7
Depth of tumor invasion
T1–T2 1 3.2
T3 28 90.3
T4 2 6.5
Lymph node metastasis
N0 12 38.7
N1–N2 19 61.3
Metastasis
Not 20 64.5
Yes 11 35.5
Modified Dukes staging system
A 1 3.2 B 11 35.5 C 19 61.3 D 0 / Vascular invasion Not 15 48.4 Yes 16 51.6 MSI frequency High 6 20.7 Low 6 20.7 Stable 17 58.6 Missing 2 / a
Caecum, ascending colon, proximal transverse.
b
2.2. Cell culture and rosiglitazone treatment
CaCo2, SW480, HCT116, and HT29 cells were cultured at 37 °C in 5% CO2 atmosphere in DMEM and MEM Alpha media, supplemented with 10% fetal bovine serum (FBS), 100 U/ml penicillin and 100 ng/ml streptomycin (Invitrogen Life Technologies, Milan Italy).
The synthetic rosiglitazone (Ros) ligand was used to determine PPARγ activation. The cells were treated with vehicle (ethanol) or 20μM Ros for 24 h.
2.3. Antibodies and chemicals
Rabbit polyclonal antibodies directed against β-catenin and PPARγ were purchased from Cell Signaling Technology (Euroclone, Milan, Italy). Mouse antibodies directed againstβ-actin and rabbit polyclonal antibodies directed against SOX9 were purchased from Santa Cruz (D.B.A., Milan, Italy). Rosiglitazone was purchased from Cayman Chemical Company (Ann Arbor, Michigan, USA).
2.4. Quantitative real time PCR (qPCR)
Total RNA was extracted from tissue samples and from CaCo2, SW480, HCT116, and HT29 cells upon treatment with rosiglitazone using the RNeasy® Mini Kit (QIAGEN S.r.l., Milan, Italy), and subse-quently digested by DNase I. cDNA was synthesized from 500 ng total RNA with High Capacity cDNA Reverse Transcription Kit (Applied Biosystems, Foster City, CA, USA) and random hexanucleotides. For qPCR, we used the following SYBR Green Quantitect Primers pur-chased from Qiagen: human SOX9 (QT00001498), human CTNNB1 (QT00077882), human PPARG (QT00029841). Reactions were set up in 96-well plates using a 7700 RT-PCR System (Applied Biosystems, Foster City, CA, USA) and all samples were assayed in triplicate. The data were analyzed using the default and variable parameters available in the SDS software package (version 1.9.1; Applied Biosystems, Foster City, CA, USA). Target gene expression levels were normalized using the GAPDH housekeeping control and the mRNA amount of each target gene relative to GAPDH was calculated through the comparative Ct method, also called the 2(−ΔΔCt)method.
2.5. Immunoblot detection
Total proteins were extracted from 5 snap frozen CRC specimens ho-mogenized through mechanical and detergent based lysis, Ripa buffer (150 mM NaCl, 50 mM TRIS–HCl pH 7.4, 0.1% sodium dodecyl sulfate (SDS), 1% Triton, 5 mM ethylenediaminetetraacetic acid (EDTA) and 1% cholic acid sodium salt), supplemented with protease inhibitor cocktail (COMPLETE; Roche Diagnostics, Mannheim, Germany), 1 mM phenylmethanesulphonylfluoride and 1 mM sodium orthovanadate, being used as detergent. After boiling at 100 °C for 3 min, equal amounts of proteins were loaded on 10% polyacrylamide gels and separated by electrophoresis. Protein transfer was performed on PVDF membrane (Millipore S.p.A., Milan, Italy). The membranes were blocked with 5% skim milk in wash buffer (20 mM Tris–HCl, pH 7.6, 140 mM NaCl, 0.1% Tween 20) and incubated with the specific primary antibodies diluted in blocking solution, at appropriate dilutions. Follow-ing three washes, membranes were incubated with a secondary goat anti-mouse or goat anti-rabbit horseradish peroxydase-conjugated an-tibody (BioRad, Hercules, CA, USA) diluted 1:3000 in wash buffer. After three further washes, proteins were revealed by chemiluminescence (ECL, Amersham Biosciences AB, Uppsala Sweden) and the signal detected on an X-ray film (Amersham Biosciences AB, Uppsala Sweden). For quantitative measurement, thefilm was scanned and the spots corresponding to the proteins of interest were analyzed using the image processing program ImageJ (NIH Image, Bethesda, MD).
2.6. Indirect immunofluorescence (IFL)
CaCo2, SW480, HCT116, and HT29 cells grown and transfected on coverslips, werefixed for 30 min in 4% paraformaldehyde at 4 °C. Coverslips were then washed three times in PBS and incubated with the β-catenin or SOX9 antibody diluted 1:100 in PBS, 2% bovine serum albumin (BSA), 0.3% Triton X-100 for 2 h at room temperature (RT). After three washes in PBS, cells were incubated 2 h at RT with Alexa 488-labeled anti-rabbit antibodies diluted at 1:50. After rinsing three times in PBS, coverslips were mounted on microscope slides. For fluorescence microscopy, slides mounted for immunofluores-cence were observed using a Nikon Eclipse E600 microscope. 2.7. Immunoprecipitation (IP)
Cells treated with 20μM of rosiglitazone for 24 h were washed with PBS and lysed in 0.5 ml of RadioImmuno Precipitation (RIPA) buffer (150 mM NaCl, 50 mM Tris–HCL, 1% Nonidet P-40, 0.1% sodium dodecyl sulfate, 0.5% sodium deoxycholate, pH 8) for 60 min at 4 °C, centrifuged and the supernatant was collected. For immunoprecipitation (IP) assays a protein G immunoprecipitation kit (Sigma-Aldrich, St. Louis, MO, USA) was used and a pre-clearing step (Protein G Agarose suspension and cell extract sample were incubated for 2 h at 4 °C) was carried out to reduce background caused by non-specific adsorption of irrele-vant cellular proteins to the Protein G Agarose. To 200μg of the lysate 2.5μg of mouse anti-β-Catenin antibody (Santa Cruz Biotechnology, Santa Cruz, CA, USA) was added and left 3 h at 4 °C, followed by addi-tion of 50μl of beads suspension overnight at 4 °C. Beads were washed two times with IP 1× buffer andfive times with IP 0.1× buffer following the specific protocol, and immunoprecipitated proteins were eluted by boiling in 40μl of 1× Laemmli buffer before being loaded onto a SDS gel (10% acrylamide) and transferred to a Nitrocellulose membrane (Bio-Rad Laboratories, Hercules, CA, USA) followed by immunoblot analysis. The primary antibodies used were mouse anti-β-Catenin (Santa Cruz Biotechnology, Santa Cruz, CA, USA), rabbit anti-PPARγ (Cell Signaling Technology, Inc., Danvers, MA, USA) and rabbit anti-SOX9 (Santa Cruz Biotechnology, Santa Cruz, CA, USA) antibodies. The secondary antibodies used were goat anti-mouse IgG HRP-linked or goat anti-rabbit IgG HRP-linked antibodies (Santa Cruz Biotechnolo-gy, Santa Cruz, CA, USA). Chromogenic development of the western blots was obtained by using the Immun-Star Western C kit (Bio-Rad Laboratories, Hercules, CA, USA).
2.8. MTT assays for cell viability and cell proliferation rate
Cell viability assays were carried out in CaCo2, SW480, HCT116, and HT29 cell lines. Cells were plated (1 × 10⁵cells/well) in
quadru-plicate onto a 12-well cultured plate, and treated with 20μM of rosiglitazone for 24 h. On 24, 48, 72 and 96 h the cells were harvested by trypsinization and the reduction in cell viability was determined using the MTT assay. Cell viability was expressed as optical density (OD), which was detected using a NANODrop reader at 570 nm. The results are expressed as the mean of adsorbances from quadrupli-cate samples. Two independent experiments were carried out and the results were expressed based on the following formula: cell viability% = number of cells in drug treatment group / number of cells in control group × 100%.
To evaluate the anti-proliferative effect of rosiglitazone the four cell lines were plated onto 96-well plates at approximately 2 × 10⁴cells/well and treated with increasing concentrations (10,
20, 40 and 60μM) of rosiglitazone for 48 h. Then MTT reagent was added and the absorbance at 570 nm was recorded using an enzyme-linked immunosorbent assay (ELISA) reader. The prolifera-tion inhibiprolifera-tion rate (IR) was calculated according to the following formula: IR% = [1− absorbance of drug treatment group / absorbance of vehicle control group] × 100%.
2.9. Cell cycle assay byflow cytometry
To evaluate the effect of PPARγ activation on the cell cycle, the CaCo2, SW480, HCT116, and HT29 cell lines were treated with 20μM of rosiglitazone for 24 h or 48 h, collected by centrifugation permeabilized with ice-cold 70% ethanol for at least 1 h and washed with PBS. The cells were then treated with RNase A at 37 °C for 30 min and resuspended in PBS containing 20μg/ml propidium iodide and stained at 4 °C for 30 min. The DNA contents were then analyzed by EPICS ALTRA (Beckman Coulter, Inc.).
2.10. Microsatellite instability
The microsatellite instability (MSI) analysis was performed using the Bethesda panel of microsatellite (BAT25, BAT26, D5S346, D17S250 and D2S123) evaluated by means of a multiplex-PCR and PAGE analysis. Tumors showing instability in four or more markers were classified as high MSI (MSI-H), those showing it in two markers as low MSI (MSI-L), and those showing no instability as microsatellite-stable (MSS).
2.11. Statistical analysis
SOX9, PPARG and CTNNB1mRNA expression levels of CRC tissue were compared with those of adjacent normal mucosa, calculated using the formula 2−ΔΔCtand values were reported as median, 25th percentile (first quartile, Q1) and 75th percentile (third quartile, Q3). For continuous variables, normal distribution was verified by the Shapiro–Wilk test and the one-sample Kolmogorov–Smirnov test. For normally distributed variables, hypotheses regarding differ-ences among the groups were compared by means of the paired t-test, Student's t-test or by means of the analysis of variance (ANOVA) as indicated. For non-normally distributed variables, hy-potheses regarding differences among the groups were compared by means of a non-parametric Wilcoxon signed rank sum test, the Mann–Whitney rank sum test or the Kruskal–Wallis rank sum test as indicated. Statistical analyses were also performed on the subjects divided into quartile groups and by using Pearson's chi-square test to evaluate interactions between variables. P-valuesb0.05 were consid-ered statistically significant. Survival rates were calculated by the Kaplan–Meier method for analysis of censored data. All analyses were performed using SPSS Statistical Package (SPSS v17, Chicago, IL, US). For protein expression levels and in vitro experiments, the re-sults are expressed as means ± SE.
3. Results
3.1. SOX9,β-Catenin, PPARG expression levels in tumoral tissue specimens matched to normal mucosa
We previously reported deregulated SOX9, CTNNB1 and PPARG mRNA levels in CRC tissue, evaluated by microarray analysis (ArrayExpress accession n. E-MTAB-57)[33]. As an initial step, we sought to corroborate these data, on 31 pairs of tumor tissue/normal mucosa from 28 well–moderately differentiated (G1–G2) colorectal tu-mors and from 3 poorly differentiated–undifferentiated (G3–G4) colo-rectal tumors, resected from 21 male and 10 female patients (mean age ± SD 66 ± 13 years). Clinical and pathological features of colorec-tal cancer patients are shown inTable 1. Using qPCR, in tumor tissue compared to matched normal tissue was observed SOX9 up-regulation (median = 1.73, Q1–Q3 = 0.62–2.86, p = 0.004) and PPARG down-regulation (median = 0.41, Q1–Q3 = 0.23–0.70, p = 0.0005). No sta-tistically significant difference was observed in CTNNB1 expression levels (median = 1.01, Q1–Q3 = 0.58–1.42, p = 0.984). Median values, 25th and 75th percentile, and extremes of GAPDH-Ct value/target gene-Ct value are shown inFig. 1.
When detected by western blot SOX9 and PPARγ protein expression showed the same trend of RNA expression in tumors as compared to normal tissue (Fig. 2, Panels A and B) while β-catenin expression resulted in an increase only at the protein level, suggesting that a post transcriptional mechanism may be involved.
3.2. Relationship of gene expression levels to clinical–pathological parameters in CRC patients
Associations between gene expression levels and clinical– pathological features (age, gender, tumor site and stage, and MSI status) of CRC patients are shown inTable 2. A statistically significant relationship was observed between higher PPARG and SOX9 expression levels in the tumor tissue and female gender (p = 0.005 and p = 0.04, respectively), and between high SOX9 expression in the tumor tissue and age (p = 0.04) and MSI status, in particular with MSI-H (p = 0.0002) (Table 2).
Kaplan–Meier method for analysis of censored data showed no statistically significant decrease in survival for the patients with high PPARG expression levels (P = 0.414), high SOX9 expression levels (P = 0.437), or high CTNNB1 expression levels (P = 0.371) (Fig. 3).
3.3. Effect of rosiglitazone treatment on SOX9 and CTNNB1 expression levels in colon cancer cell lines
Considering the role of Wnt/β-catenin target-gene SOX9 in colo-rectal cancer onset and progression and the direct interaction of PPARγ ligands on β-catenin, we tested the effect of treatment with 20μM rosiglitazone, a PPARγ activator, on four colorectal cancer cell lines. As shown inFig. 4, after treatment a statistically significant de-crease was observed in SOX9 and CTNNB1 mRNA expression in CaCo2 (FC =−1.47, p b 0.05 and FC = −1.50, p b 0.01, respectively) and in HT-29 (FC =−2.88, p b 0.001 and FC = −2.55, p b 0.001, re-spectively). In HCT116 we observed a statistically significant increase of SOX9 expression (FC = 1.95; pb 0.01). In SW480 rosiglitazone treatment did not cause statistically significant changes of SOX9 and CTNNB1 expression. As a control for the modulation of PPARγ activity by rosiglitazone, we examined whether this ligand increased the ex-pression levels of fatty acid binding protein 1 (FABP1) or fatty acid synthase (FAS), a well-established target of PPARγ activity (Fig. 4).
Fig. 1. SOX9, PPARG and CTNNB1 mRNA expression evaluated by qPCR. SOX9, PPARG and CTNNB1 mRNA expression in 31 CRC specimens (T) paired to normal tissues (N) eval-uated by qPCR. Outliers are indicated by asterisk (*) or circle (°) where appropriate.
3.4. Immunofluorescence detection of SOX9, β-catenin and PPARγ in colon cancer cells upon rosiglitazone treatment
We then performed immunofluorescence staining for SOX9, β-catenin, and PPARγ. Treated and untreated CaCo2 cells displayed nuclear localization for SOX9 staining, and the main difference was represented by decreased levels of SOX9 within nuclei in CaCo2 cells treated with rosiglitazone at a concentration of 20μM (Fig. 5, Panel e) as compared to vehicle treated cells (Fig. 5, Panel a). As shown in Fig. 6, vehicle treated CaCo2 cells displayed classical β-catenin localization around the cellular membrane and within the nucleus (Fig. 6, Panel a). On the other hand,β-catenin protein was not present within nuclei upon 24-hour treatment with rosiglitazone
at a concentration of 20μM (Fig. 6, Panel d). SW480 cells displayed nuclear localization of SOX9, which was unaffected by rosiglitazone (Fig. 5, Panels a and e). As for β-catenin, SW480 untreated cells displayed plasma membrane but not nuclear localization (Fig. 6, Panel a). Conversely,β-catenin protein was present within SW480 nuclei upon 24-hour treatment with rosiglitazone at a concentration of 20μM (Fig. 6, Panel d). No change was observed in the HCT116 cell line for both proteins upon treatment with 20μM rosiglitazone (Fig. 5, Panels a and e;Fig. 6, Panels a and d). In HT-29 cell line, SOX9 staining displayed nuclear localization in rosiglitazone treated and vehicle treated cells (Fig. 5, Panels a and e). Canonicalβ-catenin localization around the cellular membrane, but not within nuclei, was observed in vehicle treated cells (Fig. 6, Panel a) with an increase
Table 2
Clinicopathological parameters in CRC patients and relationship with gene expression levels.
CRC PPARγ SOX9 CTNNB1
n = 31 Median Q1 Q3 p values Median Q1 Q3 p values Median Q1 Q3 p values Age b62 11 0.50 0.23 1.02 2.21 1.76 3.76 0.70 0.58 1.51
62–74 12 0.44 0.26 0.61 0.84 1.21 0.53 1.76 0.04 1.06 0.62 1.61 0.70 >74 8 0.34 0.15 0.65 0.80 0.48 3.19 1.06 0.63 1.20 Gender M 21 0.28 0.14 0.53 0.005 1.07 0.55 1.87 0.70 0.51 1.25
F 10 0.72 0.41 1.02 2.37 1.69 4.52 0.04 1.13 0.90 1.51 0.29 Cancer location Proximal 16 0.53 0.77 0.30 1.86 1.17 3.33 1.10 0.64 1.61
Distal 15 0.25 0.13 0.59 0.07 1.07 0.44 1.87 0.11 0.86 0.49 1.22 0.11 Grading G1/G2 28 0.45 0.20 0.72 1.70 0.58 2.88 1.06 0.58 1.47
G3/G4 3 0.24 0.23 0.66 0.63 2.21 1.69 2.64 0.46 0.70 0.63 0.86 0.42 A 1 0.14 0.14 0.14 0.80 0.80 0.80 0.32 0.32 0.32 Dukes staging system B 11 0.32 0.14 0.56 0.16 1.36 0.27 3.76 0.50 0.86 0.37 1.18 0.12
C 19 0.53 0.25 0.80 1.84 0.98 2.64 1.11 0.63 1.51
D 0
Carcinoma in situ 5 0.53 0.49 0.74 1.07 0.55 1.67 1.22 1.08 1.42 Histologic type Adenocarcinoma 26 0.39 0.23 0.66 0.58 1.81 0.68 2.89 0.24 0.95 0.58 1.25 0.48
MSI-H 6 0.38 0.16 0.70 5.59 2.89 6.87 0.61 0.49 0.90 MSI status MS-L 6 0.44 0.28 0.59 0.94 2.25 1.87 2.86 0.0002 1.10 0.70 1.25 0.27
MSS 17 0.41 0.25 0.74 0.80 0.53 1.73 1.11 0.65 1.51 Vascular invasion Yes 15 0.53 0.14 1.02 1.73 0.68 2.86 1.08 0.49 1.59
Not 16 0.40 0.25 0.54 0.65 1.61 0.58 2.76 1.00 0.95 0.62 1.20 0.57 Fig. 2. Immunoblot detection of SOX9,β-catenin and PPARγ in proteins extracted from selected paired normal tissues and CRC specimens. Panel A: Western blot analysis reveals up-regulated SOX9 andβ-catenin expression in CRC tissue (T) compared to normal mucosa (N) in 5 different specimens. On the contrary an opposite trend was depicted for PPARγ protein. Patient identification numbers are displayed at the top of figure. Panel B: The plots represent the signal quantification of the western blot experiments by densitometry of SOX9,β-catenin and PPARγ normalized to β-actin expression as reference protein.
in cell–cell junction localization upon 24-hour treatment with rosiglitazone at a concentration of 20μM (Fig. 6, Panel d). No change was observed in all cell lines for PPARγ protein upon treatment with 20μM rosiglitazone (Fig. 7, Panels a–d).
3.5. Immunoprecipitation (IP) of SOX9,β-Catenin and PPARγ in colon cancer cells upon rosiglitazone treatment
In order to assess whether the interaction among SOX9,β-Catenin and PPARγ was direct or indirect, an immunoprecipitation experiment was performed upon treatment with rosiglitazone at a concentration
of 20μM for 24 h. We observed that β-catenin and PPARγ co-immunoprecipitated, whereas no band was observed when Sox9 IP was performed (Fig. 8). Immunoprecipitation experiments evidenced a direct interaction betweenβ-catenin and PPARγ but not for SOX9 protein.
3.6. Effect of SOX9 changes on viability and proliferation of colon cancer cell lines
To assess the effect of SOX9 changes induced by PPARγ activation on viability and proliferation of human colon cancer cell lines, we
Fig. 3. Cumulative survival of patient subdivided into quartile groups according to PPARG expression, SOX9 expression and CTNNB1 expression. No statistically significant difference was found in cumulative survival rates of the patients divided into quartile groups. Q1 = lower quartile and Q3 = upper quartile.
Fig. 4. SOX9 and CTNNB1 mRNAs expression evaluated by qPCR in colon cancer cell lines upon rosiglitazone treatment. mRNA expression analysis by qPCR of SOX9, CTNNB1 and FABP1/FAS in CaCo2, SW480, HTC116 and HT-29 cells upon rosiglitazone treatment at concentration of 20μM for 24 h. *, P b 0.05 value; **, P b 0.01; ***, P b 0.001. Dark gray bars correspond to vehicle treated cells, clear gray bars correspond to rosiglitazone treated cells.
Fig. 5. Immunofluorescence of SOX9 in colon cancer cell lines treated with rosiglitazone. Panels (a) show colon cancer cell lines before treatment stained with anti SOX9 antibody. Panels (e) diplay SOX9 staining in colon cancer cell lines upon treatment with rosiglitazone. Nuclei were counterstained with 4′,6′-diamidino-2-phenylindole (blue) (Panels b and f).
Fig. 6. Immunofluorescence of β-catenin in colon cancer cell lines treated with rosiglitazone. Panels (a) show colon cancer cell lines before treatment stained with anti β-Catenin antibody. Panels (d) diplayβ-catenin staining in colon cancer cell lines upon treatment with rosiglitazone. Nuclei were counterstained with 4′,6′-diamidino-2-phenylindole (blue) (Panels b and e).
performed MTT assay after rosiglitazone treatment. CaCo2, SW480, HCT116, and HT29 cell lines were assessed after incubation with 20μM of rosiglitazone at 24, 48, 72, and 96 h. Rosiglitazone treatment reduced HT-29 cells viability up to 20% at 72 h (p = 0.225) and up to 80% at 96 h (p = 0.027), respectively. Viability of the other three cell lines showed a downward trend at 96 h (Fig. 9, Panel A).
The inhibitory effect on proliferation was evaluated on the cell lines treated with increasing concentrations (10, 20, 40 and 60μM) of rosiglitazone for 48 h. After 48 hour incubation statistically signif-icant dose dependent changes were observed in CaCo2 and HT-29 cell lines (Fig. 9, Panel B). The optical density (OD) values of rosiglitazone treated (20μM, 40 μM, and 60 μM) groups were decreased in a
Fig. 7. Immunofluorescence of PPARγ in colon cancer cell lines treated with rosiglitazone. Panels (a) show colon cancer cell lines before treatment stained with anti PPARγ antibody. Panels (c) diplay PPARγ staining in colon cancer cell lines upon treatment with rosiglitazone. Nuclei were counterstained with 4′,6′-diamidino-2-phenylindole (blue) (Panels b and d).
Fig. 8. Immunoprecipitation ofβ-catenin, PPARγ and SOX9 in colon cancer cell lines upon rosiglitazone treatment. Sw480, CaCo2, HT-29 and HCT116 cells were treated with ethanol (v = vehicle) or with 20μM of rosiglitazone (Ros) for 24 h and total cellular proteins were immunoprecipitated (IP) with an anti-β-catenin antibody. The presence of β-catenin, PPARγ and SOX9 in the immunoprecipitated fractions was analyzed by immunoblotting (IB). All experiments were repeated at least two times. The negative control was performed using control IgG on cell extract. WL: whole lysate.
statistically significant way when compared to the untreated groups (pb 0.01 and p b 0.001, respectively) (Fig. 9, Panel B). The inhibitory effect evidenced on proliferation of SW480 and HCT116 cells was sig-nificantly lower with respect to CaCo2 and HT-29 cells.
3.7. Cell cycle analysis
We examined the effect of PPARγ activation on cell-cycle progres-sion by means of rosiglitazone treatment in the four colon cancer cell lines. As shown inFig. 10, CaCo2 cells treated with 20μM of rosiglitazone for 24 h revealed an increase in the number of cells in the G0/G1 phase and reduction in the number of cells in the S phase when compared with the untreated cells. Furthermore, HT-29 cells treated with 20μM of rosiglitazone revealed a slight increase in the number of cells in the G0/G1 phase and a reduction in the number of cells in the S phase at 24 h when compared with the untreated cells, although these effects were more evident at 48 h. No change was observed for SW480 and HCT116 cell lines.
4. Discussion
SOX9 is a target gene of WNT/β-catenin pathway and PPARγ activa-tion causes a decrease inβ-catenin expression in normal intestinal mu-cosa in mice, probably controlling the levels of known regulators of β-catenin, such as APC, axin and GSK-3β[34]. In this study we have evaluated SOX9, CTNNB1 and PPARG expression levels in CRC specimens, and we have put in evidence SOX9 and CTNNB1 up-regulation and PPARG down-regulation, an association with MSI and female gender, but no differences in the survival curves were observed.
Our results are in agreement with previous finding of SOX9 overexpression reported in different papers[11,12], but not with the clinical–pathological correlations and survival rates referred by other authors[35,36]. Anyway, data reported in CRC patients by these authors seem contrasting, considering that high SOX9 expression levels in the
tumor tissue were found associated on the one hand with better surviv-al rates[35]and on the other hand with advanced tumor stage, typically causing poorer survival[36]. Besides, higher tumor tissue levels of SOX9 were found in patients 62 years of age or younger, and higher tumor tis-sue levels of either PPARG and SOX9 expression were found in female CRC patients. These associations might be correlated to the age and gen-der related differences in CRC incidence and prognosis reported in epi-demiological studies[40–42], and should be interpreted in relationship to the molecular pathways modulated by female hormones. In particu-lar, estrogens have been found to influence PPARγ expression in a tissue specific-manner[43,44]and to determine SOX9 subcellular localization
[45].
Few studies report gender-related differences of PPARγ expres-sion. No significant gender-related differences were detected in the tissue distribution of PPARγ subtypes in the zebrafish[46], whereas a gender-related difference in PPARγ expression with up-regulation in female animals was evidenced in rat adipose tissues depending on the levels of the sex hormones[47], and in bladder smooth muscle of female Ossabaw swines, a porcine model of the metabolic syn-drome [48]. In humans, gender-related differences of PPARγ ex-pression have been evidenced in relationship to particular single nucleotide polymorphisms [49], in para-physiological processes, such as aging[50], and in frank pathological conditions, such as coro-nary artery disease[51]or diabetes mellitus[52]. Besides, SOX9 is an important transcription factor required for development and male sex determination, which regulates the expression of target genes in the associated pathways and is involved in the expansion and differ-entiation of multiple cell lineages. Regarding the relationship be-tween SOX9 expression levels and gender in neoplastic disease, it has been evaluated in different types of human cancer, such as hepa-tocellular carcinoma, gastric cancer, malignant glioma, lung cancer, but no significant association between SOX9 mRNA levels and gender was reported[53–57].
As reported above, high levels of SOX9 expression in tumor tissue are strongly correlated with MSI in our CRC patients. Aggressiveness of colorectal tumors is negatively associated with the phenomenon of hypermutation related to altered DNA repair mechanisms and the consequent exceeding rate of genetic mutation, and approximately 15–20% of CRC are hypermutated with 75% of them presenting MSI. Whole-exome sequencing and integrative analysis of genomic data have put in evidence that 93% of non-hypermutated and 97% of hypermutated CRCs have a deregulated WNT signalling pathway and SOX9 is one of the genes most frequently mutated[58].
MSI and CIN mutational pathways are involved in CRC progres-sion, and MSI influences response to irinotecan versus 5-FU chemo-therapy[37,3]and conditionates cancer specific survival[38,39].
SOX9 expression was evaluated in MSS and MSI CRC by comparing transcript profiles of normal mucosa and CRC tissue in two indepen-dent sample sets, and different expression of this transcription factor was found. It is important to consider that analysis was performed through gene expression profile by microarray to evaluate transcrip-tion factors putatively associated with recurrence of stage II MSS and MSI CRC[59]. On the other hand, we did notfind a significant cor-relation for CTNNB1. Anyway, our data show a trend (CTNNB1 expres-sion decreased in MSI-H in respect to MSI-l and MSS) that is in agreement with data evidenced in articles that investigated the relationship between CTNNB1 mutations and underlying pathways of genomic instability: the frequency ofβ-catenin mutations was sig-nificantly higher, and presumably CTNNB1 expression levels lower, in MSI-H than in MSS/MSI-L CRC[60,61].
Besides, Kaplan and Meyer analysis in our study showed no corre-lation of PPARG, SOX9 and CTNNB1 expression levels with patient sur-vival. As reported by Ogino et al.[26], two studies, one considering 86 CRC patients and one considering 99 CRC patients, did not show a prognostic value of tumoral PPARG expression, and he found statisti-cally significant differences only in a very large cohort (470) of CRC
Fig. 9. MTT proliferation assay. Panel A: MTT viability assay of CaCo2, SW480, HTC116 and HT-29 control cells or cells treated with rosiglitazone at concentration of 20μM at 24, 48, 72 and 96 h. Panel B: Inhibitory effect on proliferation was evaluated on the cell lines treated with increasing concentrations (10, 20, 40 and 60μM) of rosiglitazone for 48 h. *, Pb 0.05 value; **, P b 0.01; ***, P b 0.001.
patients. In this huge number of patients was evidenced a statistically significant difference in overall survival (p = 0.0047), and a not sta-tistically significant difference in colorectal cancer specific survival (p = 0.089) after 10 years of follow-up. These results suggest that a very long follow-up and a very large sample size are necessary to put in evidence an effect of these transcription factors on survival, maybe in relationship to pleiotropic effects and influence of genetic background.
In this instance, our study was meant to focus on biomolecular in-teractions and subcellular localizations of SOX9,β-catenin and PPARγ in different colon cancer cell lines.
To assess if SOX9 andβ-catenin expression was influenced by PPARγ activity we used CaCo2, SW480, HCT116, and HT29 colon can-cer cell lines. We found that in some but not all the types of colon cancer cell line examined PPARγ activation reduced SOX9 and CTNNB1 gene expression levels. In particular, the modulation with the PPARγ-agonist rosiglitazone induced a statistically significant de-crease of SOX9 and CTNNB1 expression in CaCo2 and in HT-29 cell
lines, a paradoxical significant increase of SOX9 expression in HCT116 cell line, and no significant expression change in SW480 cells. In a similar way, immunofluorescence detection of SOX9 and β-catenin in colon cancer cell lines evidenced contrasting patterns of subcellular protein localization upon rosiglitazone treatment. The subcellular localizations ofβ-catenin at the level of the membrane, cytoplasm and nucleus affect its functions as a tumor suppressor at the membrane or as an oncogene in the nucleus.
The different patterns of SOX9 and CTNNB1gene expression and subcellular protein localization evidenced in the colon cancer cell lines examined in our study might be related to different mutational statuses for APC and/orβ-catenin. Moreover, the shuttling between the cytosol and the nucleus may occur through the direct interaction of PPARγ with β-catenin, as evidenced in our IP experiment and al-ready demonstrated [31,32]. On the contrary, our IP experiments did not evidence a direct interaction between PPARγ/β-catenin and SOX9 proteins, so that an indirect effect of PPARγ on SOX9 transcrip-tion factor could be supposed.
Fig. 10. Effect of SOX9 decrease following PPARγ activation on cell-cycle. Cell-cycle profile was examined by flow cytometry and percentages of cells in G0/G1, S, and G2/M phase in CaCo2, HT-29, HTC116 and SW480 cell lines are indicated in the graphs.
The CaCo2 cell line has both somatic CTNNB1 mutation (missense variant at codon 245) and APC mutation (truncation at position 1367). The CTNNB1 mutation is located in an amino acid that is direct-ly N-terminal to a serine residue that lies in a consensus site for CK, and might cause a potential change in the accessibility of that site for phosphorylation [62]. Furthermore, PPARγ activation controls the levels ofβ-catenin regulators, such as GSK-3β (crucial for phos-phorylation), and has been found able to decreaseβ-catenin expres-sion in normal intestinal mucosa in mice [30]. Another possible mechanism may be represented by the direct interaction between PPARγ and β-catenin with subsequent inhibition of β-catenin trans-location into the nucleus [32]. The mutation in APC stabilizes β-catenin constitutively activating Wnt-target genes[63]. According-ly, in our study untreated CaCo2 cells displayedβ-catenin localization within nuclei, whereas upon 24-hour treatment with rosiglitazone β-catenin protein was not present within the nuclei. Regarding to SOX9 staining, untreated CaCo2 cells displayed nuclear localization, which was slightly decreased in cells treated with rosiglitazone, prob-ably in relationship to the absence ofβ-catenin nuclear localization.
SW480 are characterized only by a biallelic somatic APC mutation (truncation at position 1338) that does not hamperβ-catenin phos-phorylation, but is not able to promote degradation, determining high pβ-catenin levels[7,64]. We evidenced that untreated SW480 cells displayed membrane-bound β-catenin localization, and upon 24-hour treatment with rosiglitazoneβ-catenin was present within the nuclei, suggesting delocalization from the plasma membrane to the cytoplasm and transport into the nucleus. Regarding to a possible mechanism involved in β-catenin nuclear translocation upon rosiglitazone treatment, we can speculate on the molecular basis rely-ing on previous data reported in the scientific literature. SW480 cells build up high amounts ofβ-catenin (only 20% phosphorylated) that might saturate the degradation machinery[64], and PPARγ activation upon rosiglitazone treatment has been found capable of blocking the phosphorylation of β-catenin suggesting that dephosphorylation might be an alternative pathway that can protectβ-catenin and in-duce its nuclear accumulation[31]. In basal condition SW480 cell are characterized by low PPARγ levels, so that rosiglitazone treat-ment, by increasing the levels of the nuclear receptor, might subse-quently facilitate β-catenin nuclear translocation. Concerning to SOX9 staining, both untreated and rosiglitazone treated SW480 cells displayed nuclear localization.
In HCT 116 cell line CTNNB1 heterozygous mutation (deletion of codon 45) results in loss of highly conserved serine residues in a re-gion of the protein that may be a target for the enzyme GSK-3β; the phosphorylated (p) β-catenin may be derived from the wild-type molecule generated from the intact allele and the proteolytic complex formation is not disrupted. Indeed, no change was observed in the HCT116 cell line for both proteins before and after rosiglitazone treat-ment, with membrane-bound localization ofβ-catenin and nuclear localization of SOX9.
HT-29 cells have a mutant form of the APC gene (truncation at po-sition 1555) that can support someβ-catenin phosphorylation, and is at least partially capable of supporting its degradation[64]. Recently a PPARγ region has been identified as having high homology to the β-catenin binding domain (CBD) within TCF/LEF, which facilitates its interaction withβ-catenin[65]. In HT-29 cells PPARγ activation has been found able to suppressβ-catenin/TCF dependent transcrip-tion via direct binding, which prevents its degradatranscrip-tion and inhibits β-catenin movement into the nucleus[32]. The subcellular distribu-tion of theβ-catenin destruction complex is mostly cytoplasmic and the transient localization ofβ-catenin in junctions may reflect a com-partmentalized shelter from degradation [64]. In untreated HT-29 cells we observed membrane-boundβ-catenin localization, with an increase in cell-cell junction localization upon 24-hour rosiglitazone treatment. SOX9 staining displayed nuclear localization in untreated and treated cells.
The different patterns of response to rosiglitazone treatment that we observed in the colon cancer cell lines examined mirror the conflicting role played by PPARγ in gastrointestinal cancerogenesis, as this nuclear receptor inhibits tumor growth only in the presence of functional APC
[30]. Accordingly, a tumor-promoting effect of PPARγ agonists has been evidenced in the ApcMin/+mice[66], implying that the normal
re-sponse of intestinal epithelial tumor cells to PPARγ agonists may be modified by APC loss or dysfunction. The expression and subcellular lo-calization data for PPARγ, SOX9 and β-catenin that we obtained by IF and IP suggest a reciprocal interactions among these transcription fac-tors, considering also that PPARγ lessens β-catenin levels upon ligand related activation in the presence of a normal APC pathway[30], and SOX9 is transcriptionally repressed by WNT signaling, while in turn the SOX9 protein enhancesβ-catenin degradation[7,8,36]. Our data suggest that the effect of rosiglitazone treatment on expression and traf-ficking of these transcription factors, and ultimately on cell viability and proliferation rate, might be influenced by SOX9 and β-catenin levels, that are decreased in CaCo2 an HT29 cells, and nuclear localization of SOX9, decreased in CaCo2 cells, andβ-catenin, absent in CaCo2 and HT29, but increased in SW480 cells. In HCT116 cellsβ-catenin is not vis-ible in the nucleus, but the paradoxical increase of SOX9 upon rosiglitazone treatment might boost cell proliferation. SOX9 exhibits several pro-oncogenic properties directly binding and activating the promoter of the polycomb Bmi1, an oncogene playing an essential role in proliferation, senescence and carcinogenesis, whose upregulation re-presses the tumor suppressor Ink4a/Arf locus[36]. Besides, expression of SOX9 matches cytoplasmic and nuclearβ-catenin, corroborating the link between SOX9 expression and theβ-catenin/TCF complex activity
[7]. Otherwise, PPARγ could hinder SOX9 nuclear translocation and maintain it in the cytosol, acting the same way as onβ-catenin[32], holding back the transcription processes influenced by SOX9.
Furthermore, in HCT116 cells we observed a statistically signi fi-cant increase of SOX9 expression upon rosiglitazone treatment.
In these cells the M3 promoter region of PPARG is hypermethylated, indicating that extensive promoter methylation influences PPARγ activ-ity[25]. Besides, HCT116 cells are characterized by elevated PPARδ ex-pression and are resistant to PPARγ agonists, because PPARδ activity antagonizes the ability of PPARγ to induce its effects[67]. PPARδ is in-volved in the Wnt/β-catenin signaling pathway interacting with β-catenin binding to TCF/LEF transcription factors and influences also SOX9 expression[68,69]. These evidences have important drawbacks, considering that SOX9 overexpression is associated with an adverse prognosis in colorectal cancer[35].
Furthermore, using MTT assay we have explored the effects on cell proliferation of the decrease of SOX9 and CTNNB1 expression induced by PPARγ activation after rosiglitazone treatment of the colon cancer cell lines examined. Time and dose dependent significant changes after rosiglitazone treatment were evidenced only for CaCo2 and HT-29 cell lines. This evidence is corroborated by cell-cycle progression study performed by fluorescence-activated cell-sorting analysis. In CaCo2, and HT-29 cells treated with rosiglitazone an increase in the number of cells in the G0/G1 phase and a reduction in the number of cells in the S phase were evidenced when compared with the untreated cells. Our results are in agreement with the regulation of proliferation by SOX9 previously reported in primary cells through control of the progression of the cell cycle from the G0/G1 to the S phase[35]. More-over, we evaluated the basal expression levels of PPARG in the different colon cancer cell lines, and we found very high levels in HT29 cells, high levels in HCT116 cells, and very low levels in SW480 cells, normalizing to PPARG expression level in CaCo2 cells (seeSupplementary Fig. 1S). The level of PPARG expression evidenced in the colon cancer cell lines examined is in agreement with the PPARγ protein level reported in a seminal study[70]. The effects of PPARγ activation depend on cell con-text and set in motion downstream gene activation events directing cell fate, and including decreases in proliferation through either cyclins or cyclin-dependent kinases, cell differentiation through up-regulation of
tissue lineage-specific differentiation proteins, cell death through apoptosis-associated proteins, and growth arrest through overcoming the effects of RAS/MEK/MAP kinase pathway derangement[70]. Fur-thermore, the role of PPARγ might depend on a direct interaction with β-catenin, considering that upon ligand-dependent activation PPARγ keeps β-catenin in the cytosol and decreases β-catenin/TCF complex, restraining β-catenin-mediated transcriptional pathways that uphold cell proliferation[32].
Considering that in HCT116 cells promoter hypermethylation modulates PPARG activity and that an effect of rosiglitazone treatment on proliferation and cell cycle is evident only in HT29 and CaCo2 cells, changes in these cell processes seem to be dependent on high basal levels of this transcription factor. In agreement with the literature, the results of our study suggest that basal levels of PPARG expression influence the percentages of cells distributed in the different stages of the cell cycle. Higher percentages of cells in G0/G1 and lower percent-ages of cells in the G2/M phase were found in HT29 and HCT116 cells, which express higher levels of PPARG, whereas the lowest percentage of cells in G0/G1 and highest percentage of cells in the G2/M phase were found in the SW480 cell line, which is characterized by very low levels of PPARG expression. The CaCo2 cell line showed interme-diate values of PPARG expression when compared to the other cell lines examined, and basal percentages of distribution of cells in differ-ent stages of the cell cycle were similar to those found in SW480 cells. However, upon rosiglitazone treatment the former cell line showed percentage changes with increase of cells in the G0/G1 phase, corre-sponding to the disappearance ofβ-catenin nuclear localization, dif-ferently from the latter cell line that did not display modifications of distribution of cells in different stages of the cell cycle, but showed de novoβ-catenin nuclear localization after PPARγ activation.
In conclusion the expression of SOX9,β-catenin and PPARγ which is deregulated in colorectal cancer tissue and the modified levels of SOX9 andβ-catenin evidenced in some colon cancer cell line after PPARγ ac-tivation suggest a novel gene regulatory interaction in colorectal carci-nogenesis. Our results shed light on a possible mechanism through which PPARγ ligand-dependent activation may affect tumor cell pheno-type and behavior, as well as cell viability and proliferation. SOX9 upregulation andβ-catenin delocalization are predictive markers of ag-gressive biological behavior and our study suggests that PPARγ activa-tion may influence SOX9 and β-catenin expression and subcellular localization, at least in some types of colon cancer cell. A better under-standing of these molecular mechanisms may further disclose the role played by SOX9 andβ-catenin and clarify the contrasting effects of PPARγ transcriptional activation on tumorigenesis, testing the feasibil-ity of drug modulation of their gene expression and translating these discoveries into clinical use of new therapeutic targets.
Supplementary data to this article can be found online athttp:// dx.doi.org/10.1016/j.bbamcr.2013.04.004.
Conflict of interest statement
The authors declare that there are no conflicts of interest with re-spect to the authorship and/or publication of this article.
Acknowledgements
The authors thank Prof. Stefano Ferrari for excellent support in the cell-cycle experiment, and Dr. Rosa Di Paola and Dr. Antonella Marucci for technical contribution.
The study was supported by grants from the Italian Ministry of Health (RC1003GA52, RC1003GA53, RC0903GA53 and RC1203ME46) IRCCS Scientific Institute and Regional General Hospital “Casa Sollievo della Sofferenza”, Opera di Padre Pio da Pietrelcina, San Giovanni Rotondo (FG), Italy.
References
[1] R.A. Smith, V. Cokkinides, H.J. Eyre, American Cancer Society guidelines for the early detection of cancer, 2005, CA Cancer Journal for Clinicians. 55 (2005) 31–44. [2] S.D. Markowitz, M.M. Bertagnolli, Molecular basis of colorectal cancer, N. Engl. J.
Med. 361 (2009) 2449–2460.
[3] A. Duval, A. Collura, K. Berthenet, A. Lagrange, C. Garrido, Microsatellite instability in colorectal cancer: time to stop hiding! Oncotarget 2 (2011) 826–827. [4] P. Bastide, C. Darido, J. Pannequin, R. Kist, S. Robine, C. Marty-Double, F. Bibeau, G.
Scherer, D. Joubert, F. Hollande, P. Blache, P. Jay, Sox9 regulates cell proliferation and is required for Paneth cell differentiation in the intestinal epithelium, J. Cell Biol. 178 (2007) 635–648.
[5] A.D. Gracz, S.T. Magness, Sry-box (Sox) transcription factors in gastrointestinal physiology and disease, Am. J. Physiol. Gastrointest. Liver Physiol. 300 (2011) G503–G515.
[6] S. Dupasquier, R. Abdel-Samad, R.I. Glazer, P. Bastide, P. Jay, D. Joubert, V. Cavaillès, P. Blache, C. Quittau-Prévostel, A new mechanism of SOX9 action to reg-ulate PKCalpha expression in the intestine epithelium, J. Cell Sci. 122 (2009) 2191–2196.
[7] P. Blache, M. van de Wetering, I. Duluc, C. Domon, P. Berta, J.N. Freund, H. Clevers, P. Jay, SOX9 is an intestine crypt transcription factor, is regulated by the Wnt pathway, and represses the CDX2 and MUC2 genes, J. Cell Biol. 166 (2004) 37–47. [8] L. Topol, W. Chen, H. Song, T.F. Day, Y. Yang, Sox9 inhibits Wnt signaling by pro-moting β-Catenin phosphorylation in the nucleus, J. Biol. Chem. 284 (2009) 3323–3333.
[9] C. Dong, D. Wilhelm, P. Koopman, Sox genes and cancer, Cytogenetic Genome Re-search 105 (2004) 442–447.
[10] F.J. Swartling, M. Ferletta, M. Kastemar, W.A. Weiss, B. Westermark, Cyclic GMP-dependent protein kinase II inhibits cell proliferation, Sox9 expression and Akt phosphorylation in human glioma cell lines, Oncogene 28 (2009) 3121–3131.
[11] T. Passeron, J.C. Valencia, T. Namiki, W.D. Vieira, H. Passeron, Y. Miyamura, V.J. Hearing, Upregulation of SOX9 inhibits the growth of human and mouse melano-mas and restores their sensitivity to retinoic acid, J. Clin. Invest. 119 (2009) 954–963.
[12] M.K. Thomsen, L. Ambroisine, S. Wynn, K.S. Cheah, C.S. Foster, G. Fisher, D.M. Berney, H. Møller, V.E. Reuter, P. Scardino, J. Cuzick, N. Ragavan, P.B. Singh, F.L. Martin, C.M. Butler, C.S. Cooper, A. Swain, Transatlantic Prostate Group. SOX9 elevation in the prostate promotes proliferation and cooperates with PTEN loss to drive tumor formation, Cancer Res. 70 (2010) 979–987.
[13] H. Clevers, Wnt/β-Catenin signaling in development and disease, Cell 127 (2006) 469–480.
[14] X. Wang, E.L. Goode, Z.S. Fredericksen, R.A. Vierkant, V.S. Pankratz, W. Liu-Mares, D.N. Rider, C.M. Vachon, J.R. Cerhan, J.E. Olson, F.J. Couch, Association of genetic variation in genes implicated in theβ-Catenin destruction complex with risk of breast cancer, Cancer Epidemiol Biomarkers Prevention 17 (2008) 2101–2118. [15] M. Kobayashi, T. Honma, Y. Matsuda, Y. Suzuki, R. Narisawa, Y. Ajioka, H. Asakura,
Nuclear translocation ofβ-Catenin in colorectal cancer, Br. J. Cancer 82 (2000) 1689–1693.
[16] G.G. Chung, E. Provost, E.P. Kielhorn, L.A. Charette, B.L. Smith, D.L. Rimm, Tissue micro-array analysis ofβ-Catenin in colorectal cancer shows nuclear phospho-β-Catenin is associated with a better prognosis, Clin. Cancer Res. 7 (2001) 4013–4020. [17] P. Polakis, Wnt signaling and cancer, Genes Dev. 14 (2000) 1837–1851. [18] M. Schwab, V. Reynders, S. Loitsch, Y.M. Shastri, D. Steinhilber, O. Schröder, J.
Stein, PPARγ is involved in mesalazine-mediated induction of apoptosis and inhi-bition of cell growth in colon cancer cells, Carcinogenesis 29 (2008) 1407–1414. [19] C. Grommes, G.E. Landreth, M.T. Heneka, Antineoplastic effects of peroxisome
proliferator-activated receptorγ agonists, Lancet Oncol. 5 (2004) 419–429. [20] S. Theocharis, A. Margeli, P. Vielh, G. Kouraklis, Peroxisome proliferator-activated
receptor-γ ligands as cell cycle modulators, Cancer Treat. Rev. 30 (2004) 545–554. [21] Y. Dai, W.H. Wang, Peroxisome proliferator-activated receptorγ and colorectal
cancer, World Journal of Gastrointestinal Oncology 2 (2010) 159–164. [22] W. Su, C.R. Bush, B.M. Necela, S.R. Calcagno, N.R. Murray, A.P. Fields, E.A.
Thompson, Differential expression, distribution, and function of PPAR-gamma in the proximal and distal colon, Physiol. Genomics 30 (2007) 342–353. [23] Y. Dai, L. Qiao, K.W. Chan, M. Yang, J. Ye, J. Ma, B. Zou, Q. Gu, J. Wang, R. Pang, H.Y.
Lan, B.C. Wong, Peroxisome proliferator activated receptor-gamma contributes to the inhibitory effects of Embelin on colon carcinogenesis, Cancer Res. 69 (2009) 4776–4783.
[24] I.A. Voutsadakis, Peroxisome proliferator-activated receptor gamma (PPARγ) and colorectal carcinogenesis, J. Cancer Res. Clin. Oncol. 133 (2007) 917–928. [25] M. Pancione, L. Sabatino, A. Fucci, V. Carafa, A. Nebbioso, N. Forte, A. Febbraro, D.
Parente, C. Ambrosino, N. Normanno, L. Altucci, V. Colantuoni, Epigenetic silenc-ing of peroxisome proliferator-activated receptorγ is a biomarker for colorectal cancer progression and adverse patients' outcome, PLoS One 5 (2010) e14229. [26] S. Ogino, K. Shima, Y. Baba, K. Nosho, N. Irahara, S. Kure, L. Chen, S. Toyoda, G.J.
Kirkner, Y.L. Wang, E.L. Giovannucci, C.S. Fuchs, Colorectal cancer expression of peroxisome proliferator-activated receptorγ (PPARG, PPARγ) is associated with good prognosis, Gastroenterology 136 (2009) 1242–1250.
[27] A.B. Carter, S.A. Misyak, R. Hontecillas, J. Bassaganya-Riera, Dietary modulation of inflammation-induced colorectal cancer through PPARγ, PPAR Res. 2009 (2009) 498352.
[28] J.M. Peters, Y.M. Shah, F.J. Gonzalez, The role of peroxisome proliferator-activated re-ceptors in carcinogenesis and chemoprevention, Nat. Rev. Cancer 12 (2012) 181–195. [29] G.T. Robbins, D. Nie, PPAR gamma, bioactive lipids, and cancer progression, Front.
[30] G.D. Girnun, W.M. Smith, S. Drori, P. Sarraf, E. Mueller, C. Eng, P. Nambiar, D.W. Rosenberg, R.T. Bronson, W. Edelmann, R. Kucherlapati, F.J. Gonzalez, B.M. Spiegelman, APC-dependent suppression of colon carcinogenesis by PPARγ, 99, Proceeding of the National Academy of Sciences, USA, 2002, pp. 13771–13776. [31] E.A. Jansson, A. Are, G. Greicius, I.C. Kuo, D. Kelly, V. Arulampalam, S. Pettersson, The
Wnt/β-Catenin signaling pathway targets PPARγ activity in colon cancer cells, 102, Proceedings of the National Academy of Sciences, USA, 2005, pp. 1460–1465. [32] T. Fujisawa, A. Nakajima, N. Fujisawa, H. Takahashi, I. Ikeda, A. Tomimoto, K.
Yonemitsu, N. Nakajima, C. Kudo, K. Wada, N. Kubota, Y. Terauchi, T. Kadowaki, H. Nakagama, R.S. Blumberg, Peroxisome proliferator-activated receptor gamma (PPARγ) suppresses colonic epithelial cell turnover and colon carcinogenesis through inhibition of theβ-Catenin/T cell factor (TCF) pathway, Journal of Phar-macological Science 106 (2008) 627–638.
[33] A. Piepoli, R. Cotugno, G. Merla, A. Gentile, B. Augello, M. Quitadamo, A. Merla, A. Panza, M. Carella, R. Maglietta, A. D'Addabbo, N. Ancona, S. Fusilli, F. Perri, A. Andriulli, Promoter methylation correlates with reduced NDRG2 expression in advanced colon tumour, BMC Med. Genet. 2 (2009) 11.
[34] M. Jalving, J.J. Koornstra, S. De Jong, E.G. De Vries, J.H. Kleibeuker, Review article: the potential of combinational regimen with non-steroidal anti-inflammatory drugs in the chemoprevention of colorectal cancer, Aliment. Pharmacol. Ther. 21 (2005) 321–339.
[35] B. Lü, Y. Fang, J. Xu, L. Wang, F. Xu, E. Xu, Q. Huang, M. Lai, Analysis of SOX9 ex-pression in colorectal cancer, Am. J. Clin. Pathol. 130 (2008) 897–904. [36] A. Matheu, M. Collado, C. Wise, L. Manterola, L. Cekaite, A.J. Tye, M. Canamero, L.
Bujanda, A. Schedl, K.S. Cheah, R.I. Skotheim, R.A. Lothe, A. López de Munain, J. Briscoe, M. Serrano, R. Lovell-Badge, Oncogenicity of the developmental tran-scription factor Sox9, Cancer Res. 72 (2012) 1301–1315.
[37] M.M. Bertagnolli, D. Niedzwiecki, C.C. Compton, H.P. Hahn, M. Hall, B. Damas, S.D. Jewell, R.J. Mayer, R.M. Goldberg, L.B. Saltz, R.S. Warren, aM Redston, Microsatel-lite instability predicts improved response to adjuvant therapy with irinotecan, fluorouracil, and leucovorin in stage III colon cancer: Cancer and Leukemia Group B Protocol 89803, J. Clin. Oncol. 27 (2009) 1814–1821.
[38] C.M. Wright, O.F. Dent, R.C. Newland, M. Barker, P.H. Chapuis, E.L. Bokey, J.P. Young, B.A. Leggett, J.R. Jass, G.A. Macdonald, Low level microsatellite instability may be associated with reduced cancer specific survival in sporadic stage C colo-rectal carcinoma, Gut 54 (2005) 103–108.
[39] D. Cunningham, W. Atkin, H.J. Lenz, H.T. Lynch, B. Minsky, B. Nordlinger, N. Starling, Colorectal cancer, Lancet 375 (2010) 1030–1047.
[40] M.T. Mandelson, D. Miglioretti, P.A. Newcomb, R. Harrison, J.D. Potter, Hormone replacement therapy in relation to survival in women diagnosed with colon can-cer, Cancer Causes Control 14 (2003) 979–984.
[41] P.C. Hannaford, S. Selvaraj, A.M. Elliott, V. Angus, L. Iversen, A.J. Lee, Cancer risk among users of oral contraceptives: cohort data from the Royal College of General Practitioner's oral contraception study, Br. Med. J. 335 (2007) 651.
[42] E. Fernandez, C. La Vecchia, A. Balducci, L. Chatenoud, S. Franceschi, E. Negri, Oral con-traceptives and colorectal cancer risk: a metaanalysis, Br. J. Cancer 84 (2001) 722–727. [43] Z.C. Dang, R.L. van Bezooijen, M. Karperien, S.E. Papapoulos, C.W. Löwik, Exposure of KS483 cells to estrogen enhances osteogenesis and inhibits adipogenesis, J. Bone Miner. Res. 17 (2002) 394–405.
[44] S.L. Valles, P. Dolz-Gaiton, J. Gambini, C. Borras, A. Lloret, F.V. Pallardo, J. Viña, Es-tradiol or genistein prevent Alzheimer's disease-associated inflammation corre-lating with an increase PPAR gamma expression in cultured astrocytes, Brain Res. 1312 (2010) 138–144.
[45] A.J. Pask, A role for estrogen in somatic cell fate of the mammalian gonad, Chromosom. Res. 20 (2012) 239–245.
[46] A. Ibabe, E. Bilbao, M.P. Cajaraville, Expression of peroxisome proliferator-activated receptors in zebrafish (Danio rerio) depending on gender and developmental stage, Histochem. Cell Biol. 123 (2005) 75–87.
[47] K. Kadowaki, K. Fukino, E. Negishi, K. Ueno, Sex differences in PPARγ expressions in rat adipose tissues, Biol. Pharm. Bull. 30 (2007) 818–820.
[48] H.M. Mattern, P.G. Lloyd, M. Sturek, C.D. Hardin, Gender and genetic differences in bladder smooth muscle PPAR mRNA in a porcine model of the metabolic syn-drome, Mol. Cell. Biochem. 302 (2007) 43–49.
[49] E. Morini, V. Tassi, D. Capponi, O. Ludovico, B. Dallapiccola, V. Trischitta, S. Prudente, Interaction between PPARγ2 variants and gender on the modulation of body weight, Obesity (Silver Spring) 16 (2008) 1467–1470.
[50] M. Barbieri, M. Bonafè, M.R. Rizzo, E. Ragno, F. Olivieri, F. Marchegiani, C. Franceschi, G. Paolisso, Gender specific association of genetic variation in
peroxisome proliferator-activated receptor (PPAR) gamma-2 with longevity, Exp. Gerontol. 39 (2004) 1095–1100.
[51] A. Amoruso, C. Bardelli, L.G. Fresu, A. Palma, M. Vidali, V. Ferrero, F. Ribichini, C. Vassanelli, S. Brunelleschi, Enhanced peroxisome proliferator-activated receptor-gamma expression in monocyte/macrophages from coronary artery disease patients and possible gender differences, J. Pharmacol. Exp. Ther. 331 (2009) 531–538. [52] S. Ben Ali, F. Ben Yahia, Y. Sediri, A. Kallel, B. Ftouhi, M. Feki, M. Elasmi, S. Haj-Taieb, O.
Souheil, H. Sanhagi, H. Slimane, R. Jemaa, N. Kaabachi, Gender-specific effect of Pro12Ala polymorphism in peroxisome proliferator-activated receptor gamma-2 gene on obesity risk and leptin levels in a Tunisian population, Clin. Biochem. 42 (2009) 1642–1647.
[53] X. Guo, L. Xiong, T. Sun, R. Peng, L. Zou, H. Zhu, J. Zhang, H. Li, J. Zhao, Expression features of SOX9 associate with tumor progression and poor prognosis of hepato-cellular carcinoma, Diagn. Pathol. 19 (2012) 44.
[54] C.M. Shao, Q.S. Shao, H.B. Yao, Z.K. Zhao, J. Xu, Z.S. Zhao, H.Q. Tao, Association of SOX9 expression and prognosis in patients with gastric cancer, Zhonghua Wei Chang Wai Ke Za Zhi 15 (2012) 736–739.
[55] L. Wang, S. He, J. Yuan, X. Mao, Y. Cao, J. Zong, Y. Tu, Y. Zhang, Oncogenic role of SOX9 expression in human malignant glioma, Med. Oncol. 20 (2012), ([Epub ahead of print]).
[56] C.H. Zhou, L.P. Ye, S.X. Ye, Y. Li, X.Y. Zhang, X.Y. Xu, L.Y. Gong, Clinical significance of SOX9 in human non-small cell lung cancer progression and overall patient sur-vival, J. Exp. Clin. Cancer Res. 31 (2012) 18.
[57] M. Sun, H. Uozaki, R. Hino, A. Kunita, A. Shinozaki, T. Ushiku, T. Hibiya, K. Takeshita, M. Isogai, K. Takada, M. Fukayama, SOX9 expression and its methyla-tion status in gastric cancer, Virchows Arch. 460 (2012) 271–279.
[58] Cancer Genome Atlas Network, Comprehensive molecular characterization of human colon and rectal cancer, Nature 487 (2012) 330–337.
[59] C.L. Andersen, L.L. Christensen, K. Thorsen, T. Schepeler, F.B. Sørensen, H.W. Verspaget, R. Simon, M. Kruhøffer, L.A. Aaltonen, S. Laurberg, T.F. Ørntoft, Dysregulation of the transcription factors SOX4, CBFB and SMARCC1 correlates with outcome of colorectal cancer, Br. J. Cancer 100 (2009) 511–523.
[60] L. Mirabelli-Primdahl, R. Gryfe, H. Kim, A. Millar, C. Luceri, D. Dale, E. Holowaty, B. Bapat, S. Gallinger, M. Redston,Β-Catenin mutations are specific for colorectal carcinomas with microsatellite instability but occur in endometrial carcinomas irrespective of mutator pathway, Cancer Res. 59 (1999) 3346–3351.
[61] K. Shitoh, T. Furukawa, M. Kojima, F. Konishi, M. Miyaki, T. Tsukamoto, H. Nagai, Frequent activation of the β-Catenin-Tcf signaling pathway in nonfamilial colorectal carcinomas with microsatellite instability, Gene Chromosome Cancer 30 (2001) 32–37.
[62] M. Ilyas, I.P. Tomlinson, A. Rowan, M. Pignatelli, W.F. Bodmer,Β-Catenin muta-tions in cell lines established from human colorectal cancers, 94, Proceedings of the National Academy of Science, USA, 1997, pp. 10330–10334.
[63] J.M. Mariadason, M. Bordonaro, F. Aslam, L. Shi, M. Kuraguchi, A. Velcich, L.H. Augenlicht, Down-regulation ofβ-Catenin TCF signaling is linked to colonic epi-thelial cell differentiation, Cancer Res. 61 (2001) 3465–3471.
[64] E. Sadot, M. Conacci-Sorrell, J. Zhurinsky, D. Shnizer, Z. Lando, D. Zharhary, Z. Kam, A. Ben-Ze'ev, B. Geiger, Regulation of S33/S37 phosphorylatedβ-Catenin in nor-mal and transformed cells, J. Cell Sci. 115 (2002) 2771–2780.
[65] J. Liu, H. Wang, Y. Zuo, S.R. Farmer, Functional interaction between peroxisome proliferator-activated receptor gamma and β-Catenin, J. Mol. Cell Biol. 26 (2006) 5827–5837.
[66] M.V. Pino, M.F. Kelley, Z. Jayyosi, Promotion of colon tumors in C57BL/6J-APC(min)/+ mice by thiazolidinedione PPARγ agonists and a structurally unrelated PPARγ agonist, Toxicol. Pathol. 32 (2004) 58–63.
[67] D. Wang, W. Ning, D. Xie, L. Guo, R.N. DuBois, Peroxisome proliferator-activated receptor δ confers resistance to peroxisome proliferator-activated receptor γ-induced apoptosis in colorectal cancer cells, Oncogene 31 (2012) 1013–1023. [68] J. Ren, Y. Duan, R. Qiao, F. Yao, Z. Zhang, B. Yang, Y. Guo, S. Xiao, R. Wei, Z. Ouyang,
N. Ding, H. Ai, L. Huang, A missense mutation in PPARD causes a major QTL effect on ear size in pigs, PLoS Genet. 7 (2011) e1002043.
[69] C.E. Macsai, B.K. Foster, C.J. Xian, Roles of Wnt signalling in bone growth, remodelling, skeletal disorders and fracture repair, J. Cell. Physiol. 215 (2008) 578–587.
[70] P. Sarraf, E. Mueller, D. Jones, F.J. King, D.J. DeAngelo, J.B. Partridge, S.A. Holden, L.B. Chen, S. Singer, C. Fletcher, B.M. Spiegelman, Differentiation and reversal of malignant changes in colon cancer through PPARgamma, Nat. Med. 4 (1998) 1046–1052.