1.
I
NTRODUCTIONDealing as it does with current operating reactors, this activity is carried out in close collaboration with IRSN (L'Institut de Radioprotection et de Sûreté Nucléaire), France. The collaboration has been ongoing for nearly six years and may be divided chronologically as follows:
1) Evaluation of the effect of a heavy steel reflector of a GEN-III PWR design on the signal in the ex-core neutron detectors in the pressure vessel well;
2) Analysis of the phenomenon of “flux tilt” in a GEN-III PWR design and its possible magnification due to a heavy steel reflector;
3) Calculation of the responses of a range of neutron and gamma detectors, present for additional safety requirements, placed in the pressure vessel well and within the concrete surrounding the well. This was done both for the above GEN-III PWR design and for a GEN-II PWR model (TIHANGE in Belgium).
In support of the above applications there is an ongoing activity of development of Monte Carlo methodology. This has focused in the last years on applying variance reduction techniques to the source-iteration algorithm solution of the eigenvalue problem. The immediate application of this development is to avoid the necessity of decoupling when calculating ex-core responses.
The period covered by the current report (Sept. 2015 – Sept. 2016) covers the latter part of point 3) above (responses of ex-core neutron and gamma detectors placed in the pressure vessel well and in the surrounding concrete of TIHANGE). Furthermore, during this period there was an important didactic element epitomized by a 4-day course on advanced variance reduction techniques in Monte Carlo, held at IRSN in May, 2016. (A copy of this course is available on request.)
There are two external publications covering much of the work in the period in question:
K.W. Burn, P. Console Camprini, “Radiation transport out from the reactor core: to decouple or not to decouple”, Proc. Int. Conf. Rad. Shielding (ICRS-13), Paris, Oct. 3-6, 2016
M. Brovchenko, B. Dechenaux, K.W. Burn, P. Console Camprini, I. Duhamel, A. Peron, “Neutron-gamma flux and dose calculations in a Pressurized Water Reactor (PWR)”, Proc. Int. Conf. Rad. Shielding (ICRS-13), Paris, Oct. 3-6, 2016
These papers are not attached for copyright reasons but will appear in the proceedings of the International Conference of Radiation Shielding, ICRS-13, Paris, Oct. 2016.
This report is divided into the following sections: a summary of methodological developments relevant to such PWR applications; a short account of the TIHANGE calculations; the TAPIRO calculations (TAPIRO has been proposed to be employed for actinide cross-section measurements) - although this is a small, fast, core it is useful as a benchmark for the application of variance reduction techniques to the source-iteration algorithm solution of the eigenvalue problem; the ongoing PCA Replica experimental benchmark calculations.
The Monte Carlo vehicle employed was MCNP, either version 5.1.4 [1] or version 6.1 [2]. The variance reduction technique was the DSA, for fixed sources [3] and for eigenvalue problems [4-6], both modes employing version 5.1.4 of MCNP as a vehicle. (Having generated variance reduction parameters, they were then converted to a weight window and run with MCNP 6.1.)
The computing resources and the related technical support used for this work have been provided by CRESCO/ENEAGRID High Performance Computing infrastructure and its staff. CRESCO/ENEAGRID High Performance Computing infrastructure is funded by ENEA, the Italian National Agency for New Technologies, Energy and Sustainable Economic Development and by Italian and European research programmes, see http://www.cresco.enea.it/english for information. [7]
S
UMMARY OFM
ETHODOLOGICALD
EVELOPMENTSFurther benchmarking of the technique described in [4-6] focusing on ex-core responses was carried out. Two complementary sample problems were adopted: TAPIRO, a small fast research reactor and the large GEN-III PWR model employed before the TIHANGE model for the calculation of neutron and gamma detectors in and outside the pressure vessel well.
The TAPIRO model provided a good benchmark. Superhistories of one fission neutron generation were sufficient and the results with the decoupled and single calculation approaches were consistent. Instead the PWR model did not maintain the fundamental mode with one fission neutron generation per superhistory. Superhistories of 10 or more fission generations however did maintain the fundamental mode. Further details are provided in the Appendix in presentational form and in the first ICRS-13 paper mentioned in the Introduction.
2.
TIHANGE
CALCULATIONSThe calculation was decoupled in a standard fashion into an eigenvalue part that wrote the fission source and a fixed source part that read the same source and ran out from the core. The fixed source part included variance reduction. The source was defined for each fuel pin over a whole 360° azimuthal segment and with 21 axial segments. Given space limitations, 3 calculations were required (with identical tracks but different tallies) to write the source.
Such a pin-by-pin source could not be read by standard MCNP and required an in-house MCNP patch. The rest of the calculational sequence is reasonably standard. Neutron and gamma responses were requested radially, between the pressure vessel and the concrete and at various depths in the side concrete, and axially, on the lower surface of the pressure vessel, on the surface of the concrete at the bottom of the well and at various depths in the concrete at the bottom of the well. After pruning the total number of requested responses to 50 (36 neutron and 14 gamma), variance reduction parameters were generated for all the neutron and gamma responses in a single run using the multi-response capability [3].
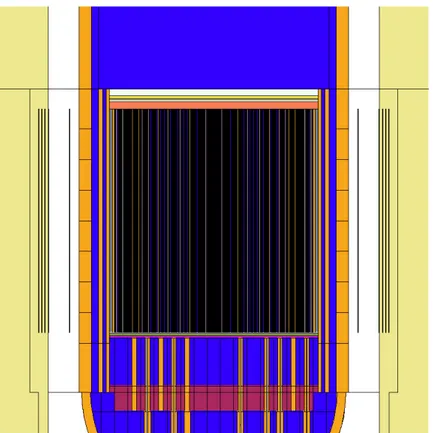
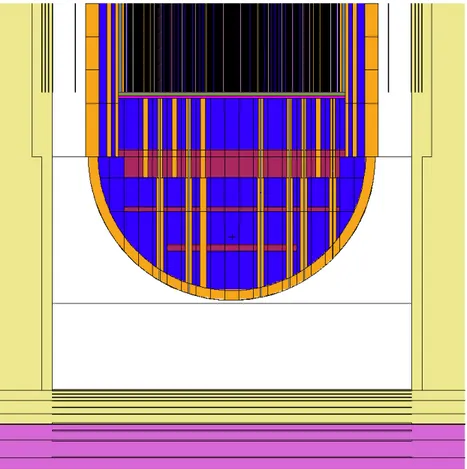
The following figures show some cross-sections of the MCNP model:
Figure 2.2 - Axial cross-section centred at 4m below the core mid-plane (width of figure: 7m)
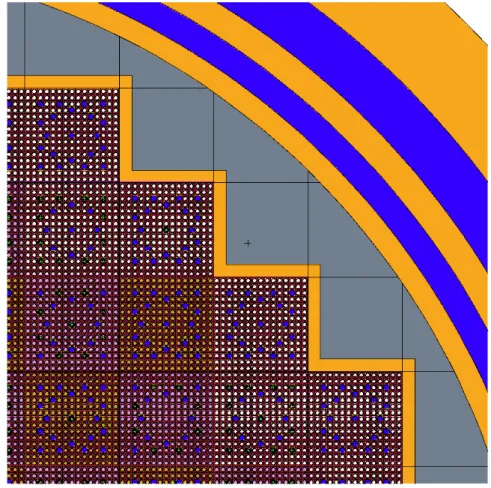
Figure 2.4 - Radial cross-section at the core mid-plane showing detail at edge of core (width of figure: 1.1m)
Further details of this study may be found in: M. Brovchenko, B. Dechenaux, K.W. Burn, P. Console Camprini, I. Duhamel, A. Peron, “Neutron-gamma flux and dose calculations in a Pressurized Water Reactor (PWR)”, Proc. Int. Conf. Rad. Shielding (ICRS-13), Paris, Oct. 3-6, 2016.
The responses in the calculations up to this point had all been azimuthally averaged. A second series of calculations were then made employing detectors that were at given azimuthal positions. Firstly, a single neutron detector was studied, then 10 neutron and gamma detectors at 5 different positions. These calculations were intended more as a benchmark for variance reduction techniques and some comparisons with the weight window generator in MCNP were made. Further details may be found in [8].
3.
S
IMULATIONS FORTAPIRO
R
EACTORWithin the framework of the activities concerning the methodological comparison between fixed source and eigenvalue calculations for ex-core response, a fast-spectrum and geometrically small nuclear system has been analysed.
The present study offers particular ex-core evaluations aiming at preliminary simulations of some irradiation campaigns for Minor Actinides in the TAPIRO research reactor. Efforts have been conducted on MAs transmutation study, mainly about nuclear data, due to the poor knowledge in this field. Several NEA and IAEA Working Groups addressed these issues, even recommending integral measurements, complementary to parallel efforts for differential measurements, for the several nuclides of MAs from viewpoints of design of transmutation systems and of fuel cycle. In the framework of one of the NEA Expert Group on Integral Experiments for Minor Actinide Management (EGIEMAM) [9] the feasibility of MAs irradiation campaign in TAPIRO research reactor is carried out in this report.
Thus, results are obtained and compared, according to following methods:
1. standard eigenvalue simulation followed by a decoupled analog fixed source calculation
2. standard eigenvalue simulation followed by a fixed source calculation with DSA variance reduction tool
3. eigenvalue simulation implementing directly DSA variance reduction methodology Graphical explanation of the workflow is reported:
Workflow simulation approach
3.1
TAPIRO
R
ESEARCHR
EACTORTAPIRO (TAratura PIla Rapida a potenzazerO), a fast nuclear research reactor located at ENEA CASACCIA research center, was developed by ENEA, based on the project of the Argonne Fast Source Reactor (AFSR, Idaho falls). The startup was in 1971 and is currently used in supporting experimental programs finalized to [10]:
• validation of calculation codes for studies on the development of Gen-IV reactors and ADS systems
• analysis on fast neutrons damages on materials and electronics components • training and experiences for nuclear engineering courses
Eigenvalue calculation: core source sampled and stored
Fixed source simulation: Analog method Fixed source simulation:
DSA variance reduction
Eigenvalue calculation:
DSA variance reduction is performed at the same time
Method (1)
Method (2)
In the following picture a view of TAPIRO reactor room is showed in Figure 3.1:
Figure 3.1 - TAPIRO reactor room.
It has a maximum power of 5 kW with a neutron flux of 4 x 10¹² n/(cm2 s) in the centre of the core. The core is cylindrical with a diameter of about 12 cm and a similar height. It is made with metallic uranium (98.5 % uranium and 1.5 % molybdenum) with an enrichment of 93.5 % in 235U. It consists of 2 parts: the upper part is fixed while the lower one is movable. The core is surrounded by a double layer of copper reflector and by an external biological shield of borate concrete. It is refrigerated by helium as coolant. The reactor is equipped with 2 shim rods, 2 safety rods and a regulating rod. These rods are realized with the same material of the reflector and the reactor is controlled increasing or reducing the leaks of neutrons.
A horizontal section of the reactor at 1 m from the floor is showed in Figure 3.2:
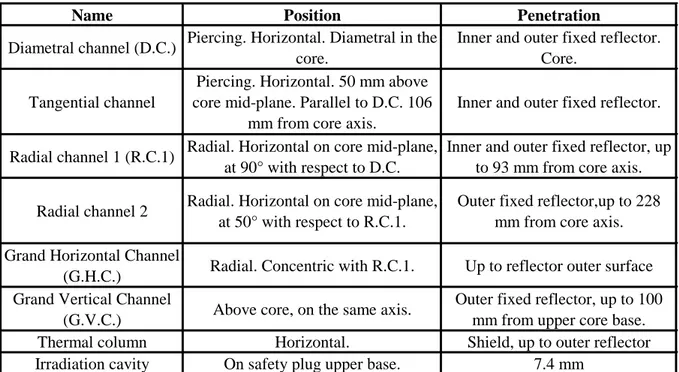
To allow irradiation experiences, the system has different channels, located in different positions; they are realized with a metallic cylindrical clad and they are filled with plugs made of copper, in the reflector's area, and of shielding material in the external part. The copper part of each plug is removable to permit the insertion of sample material or detectors used for experiences. An important characteristic of the channels is that their sections are gradually reduced to cut down the gamma ray streaming effect. The main channels are shown in Table 3.1) [10]:
Name Position Penetration
Diametral channel (D.C.) Piercing. Horizontal. Diametral in the core.
Inner and outer fixed reflector. Core.
Tangential channel
Piercing. Horizontal. 50 mm above core mid-plane. Parallel to D.C. 106
mm from core axis.
Inner and outer fixed reflector.
Radial channel 1 (R.C.1) Radial. Horizontal on core mid-plane, at 90° with respect to D.C.
Inner and outer fixed reflector, up to 93 mm from core axis. Radial channel 2 Radial. Horizontal on core mid-plane,
at 50° with respect to R.C.1.
Outer fixed reflector,up to 228 mm from core axis. Grand Horizontal Channel
(G.H.C.) Radial. Concentric with R.C.1. Up to reflector outer surface Grand Vertical Channel
(G.V.C.) Above core, on the same axis.
Outer fixed reflector, up to 100 mm from upper core base. Thermal column Horizontal. Shield, up to outer reflector Irradiation cavity On safety plug upper base. 7.4 mm
Table 3.1 - TAPIRO experimental channels
3.2
TAPIRO
MCNP
M
ODELThe TAPIRO model implemented in MCNP code is the standard reference model utilized for reactor operation and experiment modelling. It is actually constructed through surface-based cell volumes allowing a complete domain representation of both reactor core, reflector and irradiation channels.
The core is composed of a number of fuel cylindrical plates cooled by helium and a calibration pellet. The central part of the diametral channel is filled by radially oriented pellets as well.
The MCNP results presented here are obtained without the calibration pellet and with the central pellets inserted. In addition, the Safety Rods (SR1 and SR2) and Shim Rods (S1 and S2) are considered inserted.
Considered irradiation channels are the diametrical channel, tangential channel and radial channel 1. They are all filled with air and the copper plugs are also removed.
Nuclear data library utilized is JEFF3-1 provided by NEA Data Bank and processed at 300 K [11].
Diametrical channel characterization is obtained through flux evaluation and minor actinides fission and capture reaction rate. This is performed with the mesh tally MCNP feature through which cells are created dividing the actual geometry to obtain the response in a customized calculation grid.
3.3
S
AMPLING OFC
OREF
ISSIONS
OURCEAccording to usual practice, a decoupled approach has been followed in order to produce a fixed source simulation after an eigenvalue calculation. In fact, scalability - in fixed source simulations - allows better improvement in time efficiency more than eigenvalue simulations.
Foremost, eigenvalue simulations have been carried out in order to prepare the fission source, which has been sampled through the fundamental mode: 20000 cycles were run, made by 10000 histories each.
Source has been sampled by a spatial subdivision of the TAPIRO core, by means of different iterations in an optimization approach.
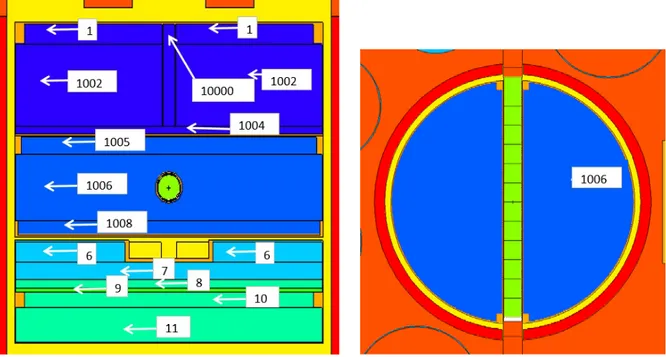
Figure 3.3 - Sections of TAPIRO MCNP input: vertical (left) and horizontal at midcore (right).
The highly enriched cylindrical core has been divided in many horizontal layers (Fig. 3.3 left). In addition, cylindrical shells have been accounted for (Fig. 3.3 right). Thus, the fundamental mode distribution of the flux has been sampled in small volumes through radial and axial binning. Fission production has been tallied in each volume to be used in the following studies as source. Of course each volume averages the fission reaction rate inside itself, introducing an approximation. One could in principle consider a particular fission distribution as source, considering what MCNP stores at the end of each cycle. The latter approach would avoid volume discretization but it would not utilize all the information belonging to all previous cycles.
Initial cell subdivision of the TAPIRO core is depicted in Fig. 3.3, cell numbers are reported as in the standard input which is optimized just for suitable geometrical description of the system.
Considering TAPIRO core as a starting point (Fig. 3.4), division of the fissile portion has been optimized as follows. In principle, azimuthal symmetry seemed to hold at least for radial and diametrical channel responses, which are main part of the analysis to be carried out.
Following steps have been implemented (Fig. 3.5):
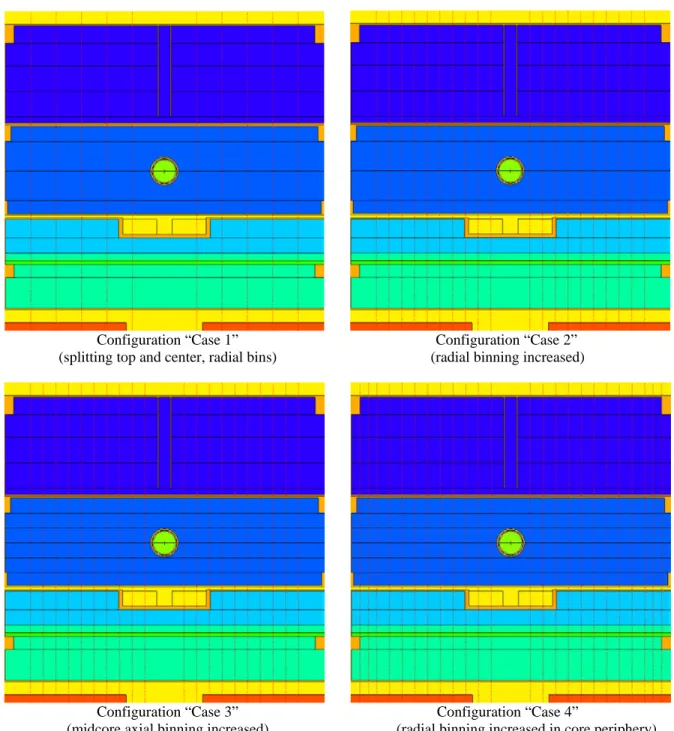
1) initial geometry is used splitting cells 1002 (in cells 99992, 99993 and 99994) and 1006 (in cells 99995 and 99995) producing the “case 1”
2) previous geometry subdivision has been improved introducing more radial bins through the facility available in MCNP by which a response can be tallied according to cell splitting, using several surfaces: “case 2” is then obtained
3) more axial bins are introduced in “case 3”, more precisely in central region and relative to initial 1006 cell.
4) more radial bins are introduced in “case 4” concerning the outermost portion, since it presents a less regular geometry compared to the approximations of the previous configurations
5) particular azimuthal effect is introduced taking into account the diametrical channel which passes through the core. “Case 5” is then prepared using the MCNP facility of rejecting source particles outside a particular cell which is configured as a merge of all fissile portions, reproducing the real TAPIRO core, even inside the diametrical channel which violates the azimuthal symmetry (cookie cutter cell tool).
Figure 3.4 - TAPIRO core in MCNP input: vertical split of cylindrical elements.
Each step in the process has been verified in terms of consistency of the sample source to be used in the subsequent simulation – after the decoupling.
Once a fission rate distribution in the volumes is obtained, a fixed source simulation is carried out tallying the same responses in different reactor positions. In particular, neutron
flux in the experimental channels has been considered as a reference for comparisons, values obtained during a previous eigenvalue calculations are considered.
Thus, diametrical, tangential and radial channels basically agreed since the configuration reported at Case 1.
Volumes belonging to diametrical channel inside the core center showed some discrepancy between the eigenvalue results and those obtained through fixed source based on sampled fission distribution.
TAPIRO core is a relatively small and a fast-spectrum nuclear system and this explains how external experimental channels do not require a fine core subdivision, of course central core responses require more precision.
Configuration “Case 1” Configuration “Case 2” (splitting top and center, radial bins) (radial binning increased)
Configuration “Case 3” Configuration “Case 4”
(midcore axial binning increased) (radial binning increased in core periphery)
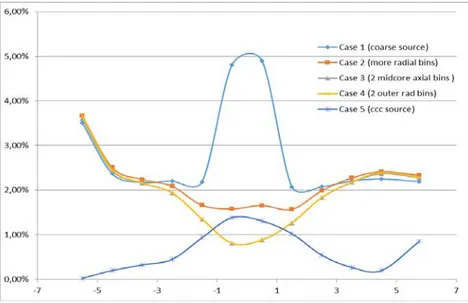
For each simulation, relative difference between eigenvalue central core flux and those obtained with different core discretization are reported in the plot in Fig. 3.6, with respect to radial coordinate in cm. An acceptable description has been achieved once all differences attained 2% value at most (relative error related to this difference has been calculated as well, being less than 1%).
Figure 3.6 - Relative difference between eigenvalue calculation and sampled fixed fission source
Coherence between sampled core source and eigenvalue calculation could have been verified in a number of methods – namely flux leakage from core for instance as in ICRS13 papers cited in the Introduction; the current approach just considered the main objective at which the next simulations are aimed at.
3.4
F
IXEDS
OURCEC
ALCULATIONSSecond stage of present analysis consists of a fixed source simulation, in which the source previously prepared is utilized. This is interesting since different variance reduction techniques are possibly implied in MCNP code: both through source biasing and by means of embedded facilities such as weight window.
In particular, a methodological comparison has been carried out within this study between an analog approach and the Direct Statistical Approach (DSA). Both are utilized and a comparison is outlined.
DSA is an in-house ENEA MCNP patch which optimizes importance values to the calculational domain starting from the evaluation of both second moment and time per history [4-6]. Variance reduction parameters are then obtained minimizing these two functions which contribute to the improvement of the efficiency of the calculation, namely increasing of the Figure of Merit (FOM).
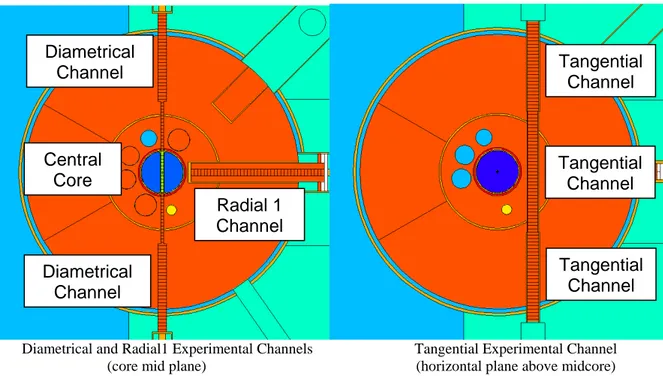
The objective of present simulation is to determine capture and fission reaction rates inside the experimental channels (Fig. 3.7), 11 nuclides are considered for 2 reaction rates each.
In addition, 226 space cells are created to tally reaction rates in the channel as follows: - diametrical channel (15003 and 15000): 42 + 42 cells
- tangential channel (44, 42 and 43): 27 + 36 + 27 cells - radial1 channel (230): 40 cells
Diametrical and Radial1 Experimental Channels Tangential Experimental Channel (core mid plane) (horizontal plane above midcore)
Figure 3.7 – TAPIRO Experimental channels as in MCNP input description
Fixed source simulations are performed under two following conditions:
- Analog simulations have been performed with 6 M histories, on cluster system and parallel computing using 24529.16 cpu-min.
- Simulation implementing DSA method for variance reduction improving estimation of the results. 6 M histories are run on cluster system using 29951.00 cpu-min.
3.5
E
IGENVALUES
IMULATIONS USINGDSA
Independent eigenvalue simulations are carried out and DSA methodology for variance reduction is directly implemented at the same time. In fact, multi-response capability is used both for local responses – outside core in experimental channels – and for global responses. Latter global responses are zones in which the core is divided and in these portions the convergence of the fundamental mode is controlled at each superhistory.
This simulation is performed using 60000 cycle, each cycle is made by 10000 histories. Calculation time has been about 64294.83 cpu-min.
3.6
R
ESULTSPerformed simulations were conducted as follows:
-
Analog fixed source calculation after source preparation in eigenvalue simulation-
DSA fixed source calculation after source preparation in eigenvalue simulation - Eigenvalue calculation using DSA variance reductionDiametrical Channel Diametrical Channel Radial 1 Channel Tangential Channel Tangential Channel Tangential Channel Central Core
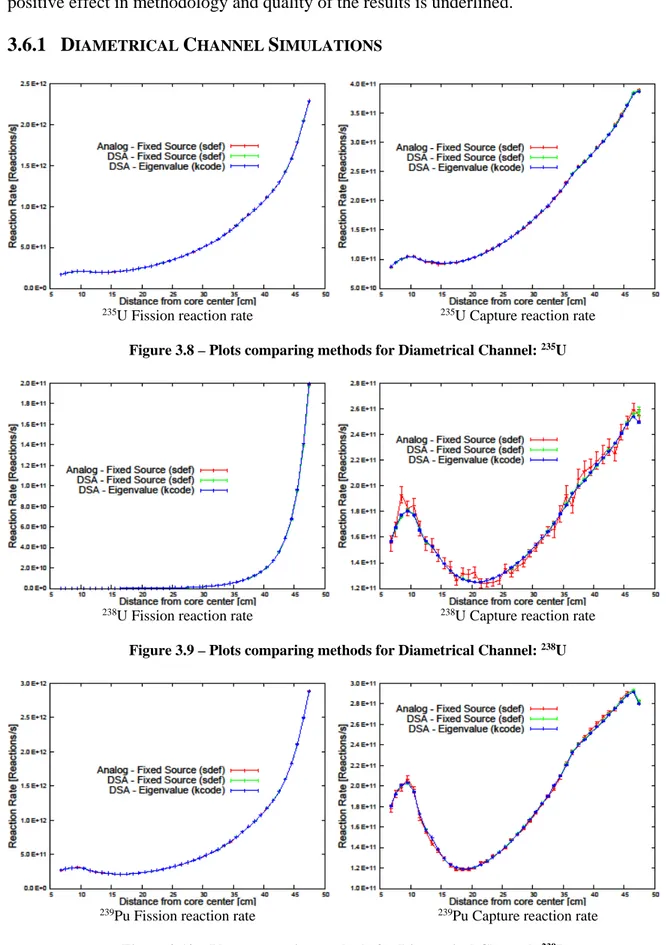
Results are showed in the following pictures. Errors are reported in graphical bars. DSA positive effect in methodology and quality of the results is underlined.
3.6.1 D
IAMETRICALC
HANNELS
IMULATIONS235U Fission reaction rate 235U Capture reaction rate
Figure 3.8 – Plots comparing methods for Diametrical Channel: 235U
238U Fission reaction rate 238U Capture reaction rate
Figure 3.9 – Plots comparing methods for Diametrical Channel: 238U
239Pu Fission reaction rate 239Pu Capture reaction rate
. 240Pu Fission reaction rate 240Pu Capture reaction rate
Figure 3.11 – Plots comparing methods for Diametrical Channel: 240Pu
. 242Pu Fission reaction rate 242Pu Capture reaction rate
Figure 3.12 – Plots comparing methods for Diametrical Channel: 242Pu
. 237Np Fission reaction rate 237Np Capture reaction rate
. 241Am Fission reaction rate 241Am Capture reaction rate
Figure 3.14 – Plots comparing methods for Diametrical Channel: 241Am
. 243Am Fission reaction rate 243Am Capture reaction rate
Figure 3.15 – Plots comparing methods for Diametrical Channel: 243Am
. 243Cm Fission reaction rate 243Cm Capture reaction rate
. 244Cm Fission reaction rate 244Cm Capture reaction rate
Figure 3.17 – Plots comparing methods for Diametrical Channel: 244Cm
. 245Cm Fission reaction rate 245Cm Capture reaction rate
3.6.2 R
ADIAL1
C
HANNELS
IMULATIONS235U Fission reaction rate 235U Capture reaction rate
Figure 3.19 – Plots comparing methods for Radial1 Channel: 235U
238U Fission reaction rate 238U Capture reaction rate
Figure 3.20 – Plots comparing methods for Radial1 Channel: 238U
239Pu Fission reaction rate 239Pu Capture reaction rate
240Pu Fission reaction rate 240Pu Capture reaction rate
Figure 3.22 – Plots comparing methods for Radial1 Channel: 240Pu
242Pu Fission reaction rate 242Pu Capture reaction rate
Figure 3.23 – Plots comparing methods for Radial1 Channel: 242Pu
237Np Fission reaction rate 237Np Capture reaction rate
241Am Fission reaction rate 241Am Capture reaction rate
Figure 3.25 – Plots comparing methods for Radial1 Channel: 241Am
243Am Fission reaction rate 243Am Capture reaction rate
Figure 3.26 – Plots comparing methods for Radial1 Channel: 243Am
243Cm Fission reaction rate 243Cm Capture reaction rate
244Cm Fission reaction rate 244Cm Capture reaction rate
Figure 3.28 – Plots comparing methods for Radial1 Channel: 244Cm
245Cm Fission reaction rate 245Cm Capture reaction rate
3.6.3 T
ANGENTIALC
HANNELS
IMULATIONS235U Fission reaction rate (tangential channel) 235U Capture reaction rate (tangential channel)
Figure 3.30 – Plots comparing methods for Tangential Channel: 235U
238U Fission reaction rate (tangential channel) 238U Capture reaction rate (tangential channel)
Figure 3.31 – Plots comparing methods for Tangential Channel: 238U
239Pu Fission reaction rate (tangential channel) 239Pu Capture reaction rate (tangential channel)
240Pu Fission reaction rate (tangential channel) 240Pu Capture reaction rate (tangential channel)
Figure 3.33 – Plots comparing methods for Tangential Channel: 240Pu
242Pu Fission reaction rate (tangential channel) 242Pu Capture reaction rate (tangential channel)
Figure 3.34 – Plots comparing methods for Tangential Channel: 242Pu
237Np Fission reaction rate (tangential channel) 237Np Capture reaction rate (tangential channel)
241Am Fission reaction rate (tangential channel) 241Am Capture reaction rate (tangential channel)
Figure 3.36 – Plots comparing methods for Tangential Channel: 241Am
243Am Fission reaction rate (tangential channel) 243Am Capture reaction rate (tangential channel)
Figure 3.37 – Plots comparing methods for Tangential Channel: 243Am
243Cm Fission reaction rate (tangential channel) 243Cm Capture reaction rate (tangential channel)
244Cm Fission reaction rate (tangential channel) 244Cm Capture reaction rate (tangential channel)
Figure 3.39 – Plots comparing methods for Tangential Channel: 244Cm
245Cm Fission reaction rate (tangential channel) 245Cm Capture reaction rate (tangential channel)
4.
PCA-R
EPLICAB
ENCHMARKWithin the framework of the TIHANGE simulations implementing DSA methodology, common procedure suggests the verification of the implemented calculational tools with a robust experimental benchmark.
The PCA-Replica low-flux engineering neutron shielding experiment has been considered simple but valuable case for this objective [13-14].
PCA-Replica is a water/iron (H2O/Fe) benchmark experiment including two water layers (12cm/13cm) alternated with a PWR thermal shield (TS) simulator and a PWR pressure vessel (RPV) simulator. The PCA-Replica experimental facility (see Fig. 4.1) duplicated exactly the ex-core radial geometry of the ORNL PCA (Poo1 Critical Assembly) similar experiment (Oak Ridge, US, 1981), simulating the ex-core radial geometry of a PWR. In particular, PCA-Replica reproduced the 12/13 configuration of the PCA experiment with a layer of water of about 12 cm between the core and the thermal shield simulator and a layer of water of about 13 cm between the thermal shield simulator and the pressure vessel simulator. An important feature differentiated the two experiments: the low flux reactor neutron source of the PCA experiment was replaced in the PCA-Replica experiment with a neutron source emitted by a thin fission plate containing highly enriched uranium with a rectangular cross-sectional area identical to that of the PCA reactor source.
Figure 4.1 – PCA-Replica setup in ASPIS facility at NESTOR research reactor
It is underlined that this simpler source configuration of the PCA-Replica experiment could more easily be calibrated with a high degree of accuracy, reducing in this way a possible cause of the in-vessel neutron flux underpredictions noted in transport analyses dedicated to the PCA experiment, despite the extensive work addressed to obtain an accurate calibration.
4.1
G
EOMETRYD
ATA ANDM
ATERIALSThe simple configuration of PCA-Replica and the small source uncertainty make it an interesting case to benchmark calculation methodologies – as it is the case.
Figure 5.1 – PCA-Replica horizontal section with main materials
The geometry represents the ASPIS facility of the NESTOR reactor. A moving trolley is filled with demineralized water and both a thermal shield sample and a pressure vessel specimen are inserted. The neutron flux gets inside through a particular aluminum window and after moderation by means of a graphite layer.
Fig. 5.1 depicts the main components: the fissione plate (source of the problem) is an aluminum uranium alloy AlU (93% enriched in 235U) plate with aluminum clad. It is composed by 13 vertical strips, each composed by 4 thin layers.
Thus, produced neutrons cross the aluminum clad and the window up to the water content. The first water layer is 12 cm thick, from the source to the thermal shield plate. Then, 13 cm water layer is between the thermal shield (stainless steel) and the pressure vessel sample (mild steel).
Beyond the pressure vessel specimen, void box is placed to measure leakage surrent outside the side shield of nuclear reactors. Void box is actually filled with room temperature and pressure air. For material composition, see Table 5.1.
water Void box Pressure Vessel Thermal Shield Fission plate
Table 5.1 - PCA-Replica materials composition
Neutron cross-sections utilised are JEFF 3.11 processed at 300 K temperature [11]
Benchmark responses are obtained by several detectors counting: 103Rh103, 115In and 32S respectively. Their responses are evaluated within the simulation by means of dosimetric nuclear data as follows: MCNP as-received 531 [15] dos and 532 dos [15], as well as lllos [15] prepared at Lawrence Livermore. In addition, IRDF2002 [16] and IRDFFv1.05 [17] are obtained for this simulation and obtained. In fact, 10 dosimeters are place all along the depth of the problem in order to have a good experimantal scannin of the problem even in significant penetration areas (see Fig. 5.2).
Figure 5.2 – PCA-Replica setup: 10 detectors positioned at different depths: fission plate (blue) thermal shield (green), vessel (yellow) and void box (red)
Simulations are performed both in analog mode and implementing variance reduction DSA methodology. Results are reported in following tables. Experimental values are compared with MCNP simulations results corrected for the background due to NESTOR core leackage: it yields 2% flux increase in alla positions except for positions 8,9 and 10 in which it yileds 4% flux increase. Dosimeters rely on different nuclear reaction thresholds: 0.69 MeV for 103Rh, 1.30 MeV for 115In and 2.7 MeVfor 32S. Thus, this simulation appears to be a significant penetration problem concerning phase space in position and energy.
Results for analog simulations are reported as follows:
- 103Rh detectors in positions 1 to 10 (systematic error about 3.00% in all positions, statistical error 3.00% in positions 1-5, 4.00% in positions 6 and 7, 1.00% in position 8, 1.90% in position 9 and 1.60% in position 10).
- 115In detectors in positions 8-10 (systematic error about 2.00% and 0.90% in 8, 1.40% in 9 and 1.50% in 10).
- 32S detectors are placed in position 8-10 as well (systematic error about 4.00% in all positions, 1.50% in position 8, 1.90% in position 9 and 1.30% in position 10).
Table 5.2 - PCA-Replica results for 103Rh detectors in all 10 positions
Table 5.3 - PCA-Replica results for 115In detectors in positions 8-9-10
Nuclear Data Value MCNP Error Correction Experimental C/E Position 1 LLLDOS 1.72703E-20 0.05% 1.76157E-20
1.69E-20
1.04
z = 1.91 cm IRDF2002 1.71871E-20 0.05% 1.75308E-20 1.04
IRDFFv1.05 1.71871E-20 0.05% 1.75308E-20 1.04
Position 2 LLLDOS 3.50172E-21 0.10% 3.57175E-21
3.78E-21
0.94
z = 7.41 cm IRDF2002 3.48618E-21 0.10% 3.55590E-21 0.94
IRDFFv1.05 3.48618E-21 0.10% 3.55590E-21 0.94
Position 3 LLLDOS 1.28605E-21 0.17% 1.31177E-21
1.40E-21
0.94
z = 12.41 cm IRDF2002 1.28154E-21 0.17% 1.30717E-21 0.93
IRDFFv1.05 1.28154E-21 0.17% 1.30717E-21 0.93
Position 4 LLLDOS 1.11598E-21 0.18% 1.13830E-21
1.27E-21 0.90
z = 14.01 cm IRDF2002 1.11136E-21 0.18% 1.13359E-21 0.89
IRDFFv1.05 1.11136E-21 0.18% 1.13359E-21 0.89
Position 5 LLLDOS 4.21814E-22 0.28% 4.30250E-22
4.23E-22
1.02
z = 19.91 cm IRDF2002 4.18868E-22 0.29% 4.27245E-22 1.01
IRDFFv1.05 4.18868E-22 0.29% 4.27245E-22 1.01
Nuclear Data Value MCNP Error Correction Experimental C/E Position 6 LLLDOS 1.06927E-22 0.49% 1.09066E-22
1.15E-22
0.95
z = 25.41 cm IRDF2002 1.06602E-22 0.49% 1.08734E-22 0.95
IRDFFv1.05 1.06602E-22 0.49% 1.08734E-22 0.95
Position 7 LLLDOS 4.34483E-23 0.77% 4.43173E-23
4.73E-23
0.94
z = 30.41 cm IRDF2002 4.33903E-23 0.78% 4.42581E-23 0.94
IRDFFv1.05 4.33903E-23 0.78% 4.42581E-23 0.94
Position 8 LLLDOS 2.04225E-23 1.00% 2.12394E-23
2.07E-23
1.03
z =39.01 cm IRDF2002 2.01942E-23 1.02% 2.10020E-23 1.01
IRDFFv1.05 2.01942E-23 1.02% 2.10020E-23 1.01
Position 9 LLLDOS 5.88046E-24 1.69% 6.11567E-24
5.53E-24 1.11
z =49.61 cm IRDF2002 5.72351E-24 1.74% 5.95245E-24 1.08
IRDFFv1.05 5.72351E-24 1.74% 5.95245E-24 1.08
Position 10 LLLDOS 1.69766E-24 2.86% 1.76556E-24
1.80E-24
0.98
z = 58.61 cm IRDF2002 1.64583E-24 2.95% 1.71166E-24 0.95
IRDFFv1.05 1.64583E-24 2.95% 1.71166E-24 0.95
Nuclear Data Value MCNP Error Correction Experimental C/E Position 8 531DOS 3.73688E-24 1.39% 3.88635E-24
3.93E-24
0.99
z = 39.01 cm 532DOS 3.73688E-24 1.39% 3.88635E-24 0.99
IRDF2002 3.94544E-24 1.38% 4.10326E-24 1.04
IRDFFv1.05 3.92354E-24 1.37% 4.08049E-24 1.04
Position 9 531DOS 7.92867E-25 2.85% 8.24582E-25
8.23E-25
1.00
z = 49.61 cm 532DOS 7.92867E-25 2.85% 8.24582E-25 1.00
IRDF2002 8.44322E-25 2.82% 8.78095E-25 1.07
IRDFFv1.05 8.40239E-25 2.81% 8.73848E-25 1.06
Position 10 531DOS 2.06125E-25 5.04% 2.14370E-25
2.31E-25
0.93
z =58.61 cm 532DOS 2.06125E-25 5.04% 2.14370E-25 0.93
IRDF2002 2.20132E-25 4.95% 2.28937E-25 0.99
Table 5.4 - PCA-Replica results for 32S detectors in positions 8-9-10
PCA-Replica activity is still ongoing and the final objective is to provide simulations in support of the Tihange simulations verifying firstly reliability of nuclear data. DSA is currently implemented to reduce error in results, mainly in positions far from the fission plate and concerning detectors with high energy threshold.
Nuclear Data Value MCNP Error Correction Experimental C/E Position 8 531DOS 1.05130E-24 2.52% 1.09335E-24
1.08E-24
1.01
z = 39.01 cm 532DOS 9.65787E-25 2.55% 1.00442E-24 0.93
LLLDOS 9.65787E-25 2.55% 1.00442E-24 0.93
IRDF2002 9.59899E-25 2.56% 9.98295E-24 0.92
IRDFFv1.05 1.03108E-24 2.49% 1.07233E-24 0.99
Position 9 531DOS 1.67835E-25 6.14% 1.74548E-25
1.46E-25
1.20
z = 49.61 cm 532DOS 1.54150E-25 6.27% 1.60316E-25 1.10
LLLDOS 1.54150E-25 6.27% 1.60316E-25 1.10
IRDF2002 1.52728E-25 6.26% 1.58837E-25 1.09
IRDFFv1.05 1.65766E-25 6.07% 1.72397E-25 1.18
Position 10 531DOS 3.97266E-26 11.70% 4.13157E-26
3.73E-26
1.11
z =58.61 cm 532DOS 3.68432E-26 12.17% 3.83169E-26 1.03
LLLDOS 3.68435E-26 12.17% 3.83172E-26 1.03
IRDF2002 3.60467E-26 11.98% 3.74885E-26 1.01
Acknowledgements
Mariya Brovchenko (IRSN, Fontenay-aux-Roses, France) supplied the TIHANGE MCNP model and the simplified generic PWR GEN-III model for calculation comparison and defined the ex-core responses of interest.
Mario Carta and Georgios Glinatsis (ENEA, Casaccia, Italy) conceived the actinide measurement proposal and Valentina Fabrizio and Alfonso Santagata (ENEA, Casaccia, Italy) supplied the TAPIRO geometry model.
References:
1. MCNP Team, LA-UR-05-8617 (2005) 2. J.T. Goorley et al., LA-UR-13-22934 (2013) 3. K.W. Burn, Nucl. Technol. 175-1 138-145 (2011) 4. K.W. Burn, Ann. Nucl. Energy, 73, 218 (2014) 5. K.W. Burn, Ann. Nucl. Energy, 85, 776 (2015)
6. K.W. Burn, PHYSOR 2014, JAERI-Conf 2014-003 (2014)
7. G. Ponti et al., Proc. of the 2014 International Conference on High Performance Computing and Simulation, HPCS 2014, 1030
8. L.Tillard, « Validation des calculs d’irradiation ex-core dans un réacteur à eau sous pression en comparant plusieurs méthodes de réduction de variance », IRSN PSN-EXP/SNC/2016-338
9. Expert Group on Improvement of Integral Experiments Data for minor Actinide Management (EIGEMAM-II), Nuclear Energy Agency (NEA), https://www.oecd-nea.org/science/ma-ii/
10. ENEA: General Information and Technical Data of TAPIRO Research Reactor http://www.enea.it/en/research-development/documents/nuclear-fission/tapiro-eng-pdf 11. Nuclear Energy Agency – Nuclear Data Bank: Joint European Fission and Fusion
library: http://www.oecd-nea.org/dbforms/data/eva/evatapes/jeff_31/
12. M. Carta, M. Palomba, "TRIGA RC-1 and TAPIRO, ENEA Research Reactors", ENEA, Italian National Agency for New Technologies, Energy and Sustainable Economic Development C.R Casaccia, Wien, June 10-12, 2013.
13. J. Butler, M.D. Carter, I.J. Curl, M.R. March, A.K. McCracken, M.F. Murphy, A. Packwood, The PCA-Replica Experiment Part I Winfrith Measurements and Calculations, UKAEA, AEE Winfrith Report AEEW-R 1736, January 1984
14. J. Butler, The NESTOR Shielding and Dosimetry Improvement Programme NESDIP for PWR Applications, PRPWG/P (82)5, Internal UKAEA Document, November 1982.
15. R. C. Little and R. E. Seamon, Dosimetry/Activation Cross Sections for MCNP, MS B226, LANL Memorandum
16. International Reactor Dosimetry File IRDF-2002, IAEA website https://www-nds.iaea.org/irdf2002/index.htmlx
17. International Reactor Dosimetry and Fusion File, IRDFF v.1.05 https://www-nds.iaea.org/IRDFF/