Role of MRI in term new-born
hypoxic-ischemic encephalopathy: correlation with
motor outcome
Abstract
Objectives: 1) To correlate the severity of brain lesions seen on magnetic resonance imaging (MRI) with the general movements, Hammersmith scoring and motor outcome in term new-borns with ipoxic-ischemic encephalopathy; 2)Assessing the trend of all ADC and FA values calculated in specific regions of interest in relation to the acquisition time in the patients of several groups study.
Materials and methods: in the period between April 2009 and February of 2012 we studied whit MR imaging twenty-three term neonates (14M e 9F) with diagnosis of encephalopathy according to the criteria of Sarnat and Sarnat. Brain MR scan has been performed within the first 3 postnatal weeks and scored in 5 patterns of injury based on a modified classification system of Okereafor et al. General movements as at both 1 and 3 postnatal months, Hammersmith scoring as at 1week, 1 and 3 postnatal months have been evaluated. Motor outcome was assessed as at 6 both and 12 months.
Conclusion: in term infants with HIE, the severity of brain lesions seen on early MRI are significantly correlated with general movements, Hammersmith scoring and motor outcome. The main data arising from our study is that conventional MRI in the subacute phase is the main tool in both diagnostical and predictive terms.
Key Words: basal ganglia, motor outcome, term newborn, hypoxic-ischemic encephalopathy.
Introduction
Hypoxic-ischemic encephalopathy (HIE) is an important cause of mortality, morbidity, and adverse neurodevelopmental outcome in infants who are born at term, with an overall incidence between 1 and 2 per 1000 live births. Asphyxia accounts for up to 25% of total perinatal morbidity and mortality, as well as up to 15% of all cases of cerebral palsy1. The pattern of injury after a hypoxic-ischemic event depends on the gestational age (GA) of the infant and also the duration and the severity of asphyxia to which they are subjected.
Different from adults, in whom diffuse and prolonged anoxic-ischemic injury causes diffuse brain injury that predominantly involves the gray matter, neonatal HIE is generally more selective, both in premature and full term infants. The selectiveness of brain damage caused by HIE in new-borns follows the rapid changes in biochemical, cellular, and anatomical constitutes of the neonatal nervous system. Relative energy requirements in various portion of the brain are related to the state of brain maturity a the time of the injury. 2
MR imaging is gold standard in detecting perinatal brain injury, to help determine the underlying cause, extent and approximate timing of the injury. Studies with conventional MRI have characterized HIE-associated lesions, 3-4 and these have been shown to correlate with the type of hypoxic-ischemic injury, apparent clinical features,5 neurologic examination,6 and
electroencephalographic measurements.7 MR imaging has been shown to be good predictor of neurologic outcome in neonates with HIE.8-9 Conventional qualitative MRI can not clearly show injury brain within the first days after delivery, but in this time, this limit is overcome by the
quantitative MR techniques.
Neuropathological pattern and pathogenesis
Two major varieties of injuries can be observed in full-term new-born HIE : a) selective neuronal necrosis, and b) parasagittal cerebral injury.
Selective neuronal necrosis (SNN) is the most common variety of injury in neonatal HIE. According to the different type of insult, four basic regional patterns of SSN have been identified: a) Diffuse pattern: severe and prolonged insult in both term and premature infants;
b) Cerebral cortex–deep nuclear pattern: moderately to severe, relatively prolonged insult, primarily in term infants;
c) Deep nuclear–brainstem pattern: severe, abrupt insult, primarily in term infants; d) Pontosubicular pattern: undefined temporal pattern, primarily in preterm infants.
Obviously, the pattern refers to the areas of predominant neuronal injury, and a considerable overlap is common.
a) Diffuse pattern. In case of very severe and prolonged insult, a diffuse neuronal injury occurs in both premature and term infants. Neurons of the cerebral cortex are extremely vulnerable; the most vulnerable cortical region is the hippocampus, followed by the perirolandic and calcarine cortex. In very severe insults, a diffuse involvement of the cortex occurs and neurons in the deeper cortical layers (particularly those located in the depth of the sulci) are significantly affected. Thalamic neurons can be consistently affected, as well as hypothalamic neurons and those of the lateral geniculate bodies. Neurons of the putamen are somewhat more likely to be affected in the term infant, whereas neurons of the globus pallidus are predominantly affected in the preterm infant. The combination of putaminal-thalamic neuronal injury is one of the typical features of HIE, particularly in term infants. Neurons of the brainstem can be involved as well, and their involvement can frequently be observed in combination with basal ganglia-thalamic involvement. Finally, also cerebellar neurons seem to be extremely vulnerable to hypoxic-ischemic insults; Purkinje cells are the most vulnerable cerebellar neurons in the term infant, as opposed to internal granule cell neurons in the premature infant.
b) Cerebral cortex–deep nuclear pattern. This is probably the most typical magnetic resonance imaging (MRI) pattern, and refers to an involvement of some characteristic cortical areas (typically the perirolandic area) together with the putamen and thalamus. It could be secondary to a moderate or moderate-severe insult that evolves in a gradual manner.
c) Deep nuclear–brainstem pattern. In approximately 15%–20% of infants with HIE, involvement of deep nuclear structures (basal ganglia, thalamus, and brainstem tegmentum) is the predominant lesion; however, until the advent of MRI, detection of this kind of injury in the first weeks or months of life was not frequent. This is probably due to the fact that at least part of these lesions may evolve into the so-called status marmoratus, a condition that cannot be neuropathologically detected before age 9–10 months.
d) Pontosubicular pattern. In this type of SNN, neurons of the basis pons and the subiculum of hippocampus are primarily involved. The lesion is characteristic of premature infants, and is strongly associated with periventricular leukomalacia.
Pathogenesis of SNN
Different factors may explain the typical selective vulnerability to asphyxia demonstrated by some neuronal groups in the neonatal brain. In recent years, there has been increasing evidence regarding the importance of regional metabolic factors and of the regional distribution of glutamate receptors. As demonstrated in vivo by PET studies, the neonatal gray matter exhibits strong regional
differences in FDG consumption; as a general rule, areas with higher myelinogenesis and/or synaptogenesis, i.e., areas already having activated functions, show higher metabolic rate and energy utilization. These metabolic conditions may consequently render these neurons particularly vulnerable to severe, abrupt ischemic insults. On the other hand, the regional distribution of glutamate receptors, particularly of the NMDA type, now appears to be the single most important determinant of the distribution of selective neuronal injury . The topography of glutamate synapses parallels that of hypoxic-ischemic neuronal death in vivo, and the particular vulnerability of certain neuronal groups in the perinatal period correlates with a transient, maturation-dependent density of glutamate receptors. Finally, factors related to the severity and temporal characteristics of the insult appear to be of particular importance in determining SNN. As previously reported, in the different patterns of SNN the severity and the duration of the injury can greatly modify the regional distribution of neonatal brain lesions.
Parasagittal Cerebral Injury
The term parasagittal cerebral injury (PCI) refers to lesions involving both the cerebral cortex and subcortical white matter, with a bilateral, parasagittal distribution at the level of the superomedial aspect of the cerebral convexity. Albeit usually roughly symmetrical, PCI can be more evident in one hemisphere; the parieto-occipital aspect of the hemispheres is usually more severely affected that the anterior part. PCI is characterized by cortical necrosis, usually without hemorrhagic component. Atrophic gyri or ulegyria are the chronic neuropathological features. PCI almost invariably affects full-term infants suffering from perinatal asphyxia.
Pathogenesis of PCI
The pathogenesis of PCI primarily relates to cerebral perfusion imbalance. It can be considered the dominant ischemic lesion of the full-term infant. The areas of necrosis involve the border zones between the end fields of the major cerebral arteries, particularly at the level of the parieto-occipital aspect at the border zone of the three major cerebral arteries. Border zones are the brain regions most susceptible to falls in cerebral perfusion pressure. To a large extent, it can be stated that diminished cerebral blood flow secondary to systemic hypotension is the major pathogenetic factor in neonatal PCI.
Multicystic Encephalomalacia
When the anoxic insult is particularly severe and prolonged, a diffuse damage of the brain ensues. Brain swelling with diffuse T1 hypointensity and T2 hyperintensity can be detected in the first 2– 3 days, followed by marked T1 hyperintensity and T2 hypointensity involving the basal ganglia and thalami. The lesions rapidly evolve in cavitation, with the final aspect of multicystic encephalomalacia . Calcifications can be detected on CT within the first 3–4 weeks after the anoxic insult . The only preserved regions in multicystic encephalomalacia are the medulla oblongata and cerebellum.2
MRI features in HIE
Conventional T1- and T2-weighted images are used most often but findings may be normal despite significant brain injury, especially when imaging is performed early, during the first few days after the event. Diffusion-weighted imaging (DWI) often reveals HI brain injury at an earlier stage than conventional MR imaging; in addition, it provides quantitative apparent diffusion coefficient (ADC) values in brain tissue. Diffusion-weighted imaging can demonstrate at an early twenty-four hours after the insult, the presence of widespread or selective damage loading of the brain. The time window more reliable for a study of diffusion in the acute phase is roughly between II and IV day. The presence in the acute phase of ADC values <0,82x10⁻³ mm2 /s at the level of the basal ganglia is correlated with more severe damage in chronic phase. After 7-10 days the ADC values in the context of the lesions increase and pseudonormalize whereas conventional T1- and T2-weighted images are more sensitive. The selective involvement can begin to be appreciated, particularly
T1-weighted images, in the form of net signal hyperintensity. Conventional images, by themselves in front of a damage of small claims are sometimes not resolutive. At birth the structures more susceptible to damage from hypoxia (posterior region of the lenticular nuclei, the ventro-lateral regions of the thalamus, the posterior arm of the internal capsule and perirolandic cortex) are myelinated showing a physiological signal hyperintensity on T1-weighted images which is individually variable. Hence sometimes the difficulty in discriminating a physiological myelination by a modest damage to the gray matter deep that determines a shortening of T1, which translates into an accentuation of the hyperintensity signal. The rear arm of the internal capsule is in normal conditions most of the nuclei hyperintense gray, conversely, the signal of the nuclei is more gray hyperintense of the internal capsule. According to some authors highlight the lack of physiological T1 hyperintensity in the posterior arm of the internal capsule correlates with neurodevelopmental disease. The cause of pathological T1 hyperintensity in the acute phases of sub-acute HIE is not clearly defined: the hypothesis currently most accredited are: 1) the presence of lipid particles contained in macrophages or in reactive glial cells present in the injury areas; micromineralization of necrotic cells occurring in neurons or swollen axons near perinatal lesion.
Proton MRS is extremely valuable in the assessement of encephalopathic neonates, is particularly useful in the assessment of neonates in the first hours after birth, when the imaging studies are normal or subtly abnormal and diffusion studies are unreliable. Lactate elevation, resulting from anaerobic glycolysis secondary to mitochondrial dysfunction, is detected on long echo proton MRS by identification of the characteristic lactate doublet (two sharp peaks) centered at 1,33 ppm. Elevated lactate can be detected by proton MRS as early as 4 to 8 hours after birth, although lactate levels remain relatively low until the onset of secondary energy failure, about 24 hours after the injury. It appears that the most important metabolite values in the assessement of brain injury are NAA and lactate. Cheong et al. looked at absolute concentration of metabolites and found increased lactate and decreased NAA, choline, and creatine after neonatal hypoxic –ischemic injury. Of these metabolites, the decresed NAA was the most prognostically accurate in distinguishing normal/mildly injured neonates from severely injured neonates. Howewer, calculation of absolute metabolite concentrations is impractical in the acute clinical setting, so the ratio of peaks areas (which depend upon both concentration and T2 relaxation time) are more commonly used. We have found Lac/NAA to be the most useful ratio. Barkovich et al. found that initial lactate elevation (in the first few hours after injury) usually diminishes and remains at low levels until 18 to 24 hours when it begins to increase; this delayed elevation is thought to relate to delayed energy failure. Hanrahan et al. found that lactate to creatine ratios (La/Cr) correlated well with a reduction of high energy phosphates as detected by P MRS and with stormy neonatal courses. They found that (La/Cr) greater than 1 in the first 18 hours of life had a high predictive value (87%) of either neonatal death or abnormal neurodevelopmental outcome at age 12 months. Amess et al. found that thalamic Lac/Naa wase more predictive than Lac/Cr or Lac/Cho. Barkovich et al. found that the basal ganglia Lac/Cho ratio was most predictive of 12-month outcome. Penrice et al. found that normal control neonates have Lac/NAA ratios less than 0,3 in the thalami, but asphyxiated neonates generally have values above 0,4 and seriously injured infant above 0,5; they found that elevated Lac/NAA ratios wee associated with poor long term prognosis. Others have also found correlations between brain lactate levels in the first few days of life and neurologic outcome. In general the present of a detectable lactate peack in the first few days after birth is a sign of significant brain injury and is predictive of subsequent neurologic impairment; higher lactate predicts worse prognosis. Reduced NAA and creatine in the subsequent few days to weeks is also evidence of significant brain damage and emphasizes the poor prognosis of the child affected. It is important to recognize, however, that the presence of lactate is normal in the immature white matter and that the quantity of NAA in the brain varies with maturity. Moreover, different regions of the brain mature at different rates. Therefore, it is crucial to know the postconceptional age of the infant and the region of the brain from which the spectrum was obtained before interpreting the proton spectra.10
Brain Cooling
Until recently, there were non specific treatments for hipoxic- ischaemic encephalopathy.
Systematic reviews of randomised trials have shown improved survival and neurological outcomes after therapeutic hypothermia in newborns with hypoxic–ischaemic encephalopathy. However, only three trials have reported outcomes to 18 months of age and the study design and outcomes differed among the trials: the selective head cooling with mild systemic hypothermia after neonatal encephalopathy trial (the Coolcap trial) used selective head cooling with mild whole-body cooling, whereas the whole-body hypothermia for neonates with hypoxic–ischaemic encephalopathy trial (the NICHD trial) and the TOBY trial used whole-body cooling. Only the NICHD trial showed a significant reduction in the primary outcome of the combined rates of death and disability. The finding of a reduction in cerebral lesions on MRI that are associated with subsequent neurodevelopmental abnormalities and a higher rate of normal scans in cooled compared with non-cooled infants strengthens the evidence for the neuroprotective efficacy of prolonged moderate hypothermia in newborns with hypoxic–ischaemic encephalopathys.
Materials and methods
In the period between April 2009 and February of 2012 we studied with MR imaging twenty-three term neonates (14M e 9F) after parental informed written consent had been obtained.
Inclusion criteria were birth at GA >37 weeks’, abnormal cardio-tocography or meconium-stained amniotic fluid, Apgar score < 7 at 5 minutes, umbilical artery pH <7.0 and/or base deficit <-10mmol/L, a diagnosis of encephalopathy defined during the first postnatal week (according to Sarnat and Sarnat criteria). All neonates underwent MR imaging without pharmacologic sedation within the first 3 postnatal weeks (range, 6-21 days). The spontaneous motility have been assessed at 1 month and 3 months after birth. Hammersmith scoring at 1week, at 1 and 3 months were evaluated. Motor outcome was assessed at 6 and 12 months. Neuroprotective hypothermia was performed in 19 infants. Exclusion criteria were congenital malformations or major dysmorphic features, congenital viral infections, and defined metabolic syndromes. For the control cohort we used 14 healthy term-born infants taken from the literature.
MRI acquisition and analysis of imaging
Each neonate underwent a MR study between the 6th and the 21th day after birth (mean 10,4 day). The MR examination was performed on a 1.5T scanner. The anatomic MR imaging consisted of axial T1-weighted (TR 500 ms; TE 9 ms; 3-mm section thickness, FOV 16x12cm, matrix 320x244) and axial T2-weighted fast-spin-echo (TR 4240 ms; TE 104 ms; 3-mm section thickness, FOV 16x12cm, matrix 320x244). Diffusion- weighted images were obtained in 14 neonates by using single-shot spin-echo echo-planar sequences (TR/TE, 5000/68 ms with a b-value of 1000 s/mm2). In 9 neonates diffusion tensor imaging (DTI) data were acquired by using a single-shot echo planar sequence (diffusion-gradient directions 6; TR/TE 6000/97 ms, b-value of 800-1000 s/mm2). In all neonates apparent diffusion coefficients (ADC) were calculated in 12 regions of interest (ROI), that is in the basal ganglia (BG), ventrolateral thalami (VLN), corticospinal tracts (CST), anterior and posterior white matter (WM) in the centrum semiovale, and posterior limb of the internal capsule (PLIC) bilaterally (see Fig.1). In the same regions fractional anisotropy (FA) values were calculated in patients who had DTI data. The ROIs location was defined by a single operator on anatomical T1-weighted images.
Two neuroradiologists evaluated each scan separately to assess signal intensity abnormalities and scored them in five patterns of injury according to the modified classification system of Okereafor et al.: pattern 1- moderate/severe basal ganglia and thalami damage associated with moderate/severe WM changes and cortical injury; pattern 2- basal ganglia and thalami damage associated with mild
WM changes with or without cortical injury; pattern 3- focal thalamic lesion with or without cortical injury; pattern 4- predominant WM damage (moderate/severe) with or without cortical injury with or without mild basal ganglia and thalami changes; pattern 5- mild WM abnormalities with or without mild cortical changes but with normal basal ganglia and thalami, or normal imaging (see Fig.2). In all cases the neuroradiologists reached a consensus for classification. The appearance of PLIC on conventional imaging was graded as normal, abnormal and absent signal intensity.
Fig 1:Locations of regions of interest for DWI and DTI date. A, Corticospinal tracts, anterior and posterior WM in centrum semiovale. B Basal Ganglia, thalamy and posterior limb of the internal capsule.
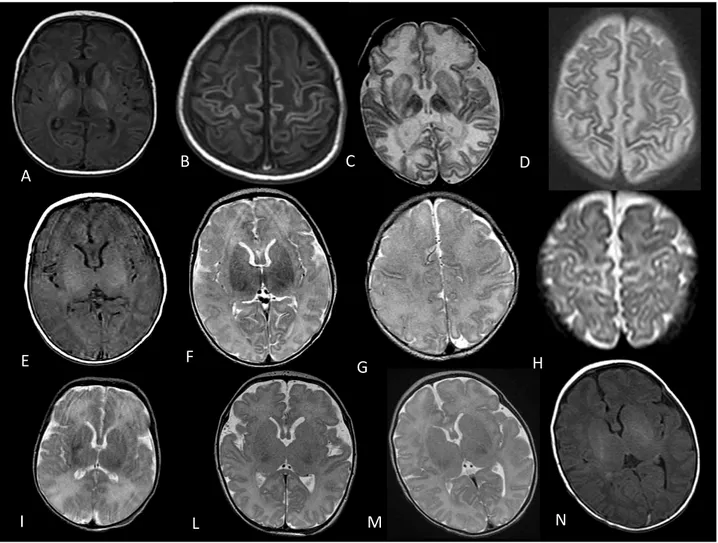
Fig 2: A–B, T1-weighted axial spin echo images showing severe bilateral abnormally increased SI in the lentiform nuclei and thalami, with absent of normal SI in the posterior limb of the internal capsule and cortical highlighting. C-D,
E" F" G" H" N" M L" I" D" C" B" A"
Axial T2-weighted images show cavitations of the deep gray nuclei and the abnormal edema (hyperintensity) of the white matter. E-F, T1 and T2-weighted axial images showing moderate changes SI in the in the lentiform nuclei and thalami, and associated with mild changes. G-H, Axial T2-weighted images show changes increased SI in white matter with poor differentiation between gray and white matter, and subcortical white matter perirolandic. I, Axial T2-weighted image shows mildly increased SI in the frontal and posterior white matter. L-M-N, T2 and T1-T2-weighted axial images showing nearly normal appearance.
Neurologic assessment
Neurologic development has been evaluated to the first year of life according to a precise timetable as follows: a) assessment of general movements (GMs) at 44-46 weeks gestational age and at 3 months post term; b) neurological assessment by Hammersmith Neonatal or Infant Neurologic Examination at 1 week, 1 month and 3 months; c) motor outcome 6-12 months has been graded as normal, mildly or severely abnormal (mild or severe cerebral palsy), or minimal neurological deficit (e.g. language delay).
General movements are endogenously generated movements that involve the whole body. They are present from early fetal life until the end of the second month after term, although minor age-related differences do exist. At term equivalent age, general movements have a writhing character; their form is typically ellipsoid and creates the impression that the infant is writhing. There are three main types of abnormal general movements to apply to the term period (7 days – 1 month): (1) poor repertoire general movements (PR), which is a monotonous sequence of successive movement while arm, leg, trunk and head movements do not occur in the normal rich and complete sequence; (2) cramped synchronized general movements (CS), which is a rigid and stiff appearance of general movements, lacking the normal smooth and fluent character, while all limb and trunk muscles contract and relax almost simultaneously; (3) chaotic general movements (C) of large amplitude, which occur chaotically lacking of fluency or smoothiness. At around 2 months after term the writhing general movements gradually disappear and Fidgety general movements emerge. These movements are present up to 5 to 6 months after term. Fidgety movements are characterized by small amplitude, moderate speed, and variable acceleration of neck, trunk, and limbs in all directions, and are continuously present in the awake infant. Fidgety movements coexist with other movements and concurrent motor repertoire such as manipulating clothing, reaching, leg lifting, head rotation, postural control etc. The presence of Fidgety movements (F+) indicates a good neurological prognosis. Fidgety movements were determined at the age of 3 months after term and classified as absent (F-) when normal Fidgety movements were never observed in the recording or abnormal when Fidgety movements could be detected but their amplitude, speed and jerkiness were moderately or greatly exaggerated.
Hammersmith Neonatal Neurological examination is a standardized neurological assessment evaluating tone, tone patterns, reflexes, movements, abnormal signs and behaviour. Hammersmith Infant Neurological examination assesses cranial nerve function, posture movements, tone, reflexes, motor function, state of behaviour. Both assessments are convertible in a numerical score, which is compared to an optimality score related to gestational age at delivery and chronological age. Results are defined as normal (N), moderate (M) or severe (S) impaired, on the basis of optimality score age-related range.
Motor outcome has been scored as normal or impaired on the basis of the absence/presence of cerebral palsy or minor developmental abnormalities. Mild motor outcome means presence of spastic-dystonic cerebral palsy with sustained head control and grasping for objects at 6-12 months. Severe motor outcome means severe cerebral spastic dystonic cerebral palsy without any head control nor reaching. Minor neurological deficit has been scored for nonspecific developmental delay.
Statistical analysis
A Spearman rank correlation coefficient (r) was adopted to investigate the correlations among MRI lesion pattern and general movement assessment at 1 month and 3 months, Hammersmith scoring at 1week, 1 and 3 postnatal months and motor outcomes. General movement at 1 month assessment
was categorized as poor repetitive general movements (PR), cramped-synchronized movements (CS), writing movements (NW). General movement at 3 months assessment was categorized as fidgety movements (F+, 0), abnormal fidgety (AF, 1), absent fidgety movements (F-, 2). Hammersmith scoring at 1week, 1 and 3 postnatal months assessment was categorized as normal (N, 0), moderate (M, 1) and severe (S, 2). Motor outcome motor 6-12 months has been graded as normal (N, 0), minimal neurological deficit (1), PCI dystonic moderate (PCI, 2 ), PCI spastic or dystonic severe (PCI 3). Sensitivity, specificity, positive predictive value (PPV) and negative predictive value (NPV) for MRI, general movement, Hammersmith scoring and motor outcome assessment were calculated.
Previous DWI studies showed that ADC values rapidly evolve in the first days after birth in both encephalopathic and control infants. Due to this assumption, in our study DWI-DTI data were stratified on the basis of the post-natal age at scan. The variations of ADC and FA data in relation to the age at MRI scan were investigated by linear regression analysis. The hypothermia treated infants were divided into 2 groups on the basis of the lesion pattern at MRI. By detail the first group included patients with pattern 1 and 2, the second group those with patterns 3, 4 or 5. Untreated infants were considered in a distinct group. All data were compared with those of the control group of healthy infants taken from the literature.
Results
Perinatal DataThe study group included 23 infants (14 males, 9 females), with a mean gestational age of 39,99 (range, 37-41,71) weeks. Cardiotocographic abnormalities were present in 8 infants, and a clearly identifiable sentinel event was seen in 4 infants (1 with placental abruption, 1 with umbilical cord prolapse, and 2 with uterine rupture). Four infants had a prolonged second stage (2 with shoulder dystocia) and 5 infants had meconium-stained amniotic fluid. Twelve infants were delivered by emergency caesarean section. Mean birth weight was 3490 gr (range, 2870- 4400 gr), mean cord pH was 6.92 and mean cord base deficit was -19,4 mmol/L. Mean Apgar score was 4 at 5 minutes. In all cases major resuscitation was required. Eleven infants developed stage 2 HIE, 12 infants had stage 3 HIE (see Table 1).
Neurologic assessment
23 children with several degrees of hypoxic-ischemic encephalopathy have been enrolled in the study group. Clinical evaluation has been performed according to age.
General movements at 1 month have been evaluated in 21 of 23 children. Normal writhing (NW) has been scored in 10 of 21 children; 6 children have a Poor Repertoire (PR) General Movements; 5 children have a Cramped synchronized (CSGM) General Movements. General Movements at 3 months have been evaluated in 19 of 23 children 10 children have a normal Fidgety Movements
Table 1: Perinatal Clinic data
Neaonate
GA at MRI (weeks)
Apgar Score (1min/5 min) Sarnat
Cord Gas
(pH/Base Deficit) Hypot. Seizures Perinatal History
1 37,00 0/1 3 6,58/-33,1 Yes Yes
No respiratory activity and heart rate, cardio-pulmonary resuscitation, mask ventilation, chest compressions, intubation OT and adrenaline end-TR.
2 41,29 2/4 2 6,88/-15,4 Yes Yes
At birth absence of respiratory activity, generalized hypotonia, extreme bradycardia was intubated and mechanically ventilated for about 2 hours.
3 40,29 4/5 3 n.a. Yes Yes At birth without crying and spontaneous breathing, meconium-stained amniotic fluid, endotracheal intubation immediately.
4 40,29 1/1 3 n.a. Yes Yes
Cyanosis, absence of spontaneous breathing and crying, marked bradycardia, OT intubation and mechanical cardiopulmonary resuscitation, and adrenaline end-TR
5 39,29 0/5 2 n.a. Yes No
Absence of spontaneous breathing and asystole, mask ventilation and cardiopulmonary resuscitation with chest compressions, adrenaline end-TR, OT intubation.
6 41,43 n.a./4 3 n.a. Yes No
Absence of spontaneous cardiorespiratory activity, generalized hypotonia, cardio-respiratory resuscitation with ambu, oro-tracheal intubation, external cardiac massage.
7 40,00 /5 3 n.a. Yes Yes Corioamniosite mother, crying and lack of spontaneous breathing,intubation OT. 8 39,14 3/5 2 7,287/-16,6 Yes No Generalized hypotonia, bradycardia associated with pale-colored,OT intubation, manual ventilation.
9 40,86 0/0 3 6,96/-13,4 Yes Yes
Absence of cardio-pulmonary resuscitation and cardio-polmonae adrenaline, after 27 minutes of asystole spontaneous onset of heart.
10 40,00 0/3 3 n.a. Yes Yes
Absence of spontaneous breathing and asystole, mask ventilation and cardiopulmonary resuscitation with cardiac massage and adrenaline administration intubation OT.
11 40,43 0/2 2 n.a. Yes No
At birth, three turns of cord around the neck, absence of breathing and heart activity, cardio-pulmonary resuscitation with intubation OT.
12 40,00 2/3 3 n.a. Yes Yes Mother with gestational diabetes, birth of meconium stained fluid,mask ventilation and subsequent intubation.
13 41,00 n.a./3 2 6,8/-22 Yes No
Heavily meconium stained fluid, not born spontaneously breathing, bradycardia, and hypotonia, mask ventilation and subsequent endotracheal intubation.
14 41,00 4/5 3 7,09/-18,7 Yes Yes At birth without crying, hypotonia, and bradycardia, resuscitationwith cardiac massage and intubation OT. 15 39,43 6/8 2 6,7/n.a. Yes No Clear amniotic fluid, quick-mask ventilation.
16 37,57 n.a./4 2 6,97/-16,1 Yes No Cyanotic, without spontaneous breathing, mask ventilation andresuscitation with cardiac massage.
17 39,71 1/3 3 n.a. Yes Yes
Complete detachment of the placenta and uterine rupture, and subsequent intubatzione mask ventilation, cardiac resuscitation with massage, clear amniotic fluid.
18 39,29 n.a./4 3 6,6/-30,9 Yes No
Clear amniotic fluid, at birth framework of asphyxiation after intubation and resuscitation with asystole cardiac massage, clear amniotic fluid
19 40,57 n.a./5 2 6,78/n.a. No Yes Absence of spontaneous crying, cyanosis, and generalizedhypotonia, mask ventilation and subsequent intubation. 20 41,71 0/5 2 6,96/-18,4 No Yes Meconium-stained amniotic fluid, asystole at birth withventilation, intubation, cardiac resuscitation with massage. 21 41,57 n.a./5 2 7,22/-18 No Yes Eipotono pallor at birth with the absence of spontaneous breathing, ventilation, clear amniotic fluid.
22 38,00 4/7 2 n.a. No Yes
Clear amniotic fluid, pulmonary resuscitation with intubation at birth for about 20 minutes later with NCPAP and subsequent repositioning of the endotracheal tube.
23 40,00 1/3 3 7,17/-10,7 Yes Yes
Meconium stained fluid, absence of spontaneous breathing and crying, generalized hypotonia and extreme bradycardia, cardio-respiratory resuscitation with mask and after intubation OT and chest compressions.
(F+). 8 children have an Absent Fidgety (F-) scoring. Only 1 child has an Abnormal Fidgety (AF) scoring.
Hammersmith Neonatal Neurological examination has been performed at 7 days in 21 of 23 children; 10 children have a normal scoring, while 11 children have been scored as abnormal. At 1 month Hammersmith Neonatal Neurological examination 10 children have a normal evaluation, while 11 children resulted abnormal. Hammersmith Infant Neurological examination confirmed 10 normal outcome while 11 resulted abnormal.
17 of 23 children enrolled have been scored for motor outcome. 6 children have a normal motor outcome (score 0); 3 children have a minor neurological deficit (score 1); 3 children have a mild motor outcome (score 2); 5 children have a severe cerebral palsy (score 3).
Conventional MR imaging
Five of the 19 hypothermia treated infants were scored as pattern 1, 4 infants as pattern 2, 1 infant as pattern 3, 9 infants as pattern 5. One of 4 untreated infants was scored as pattern 4, 3 untreated infants were scored as pattern 5
The PLIC signal was normal in 13 infants (3 infants with pattern 5 untreated, 9 infants with pattern 5 treated, 1 infant with pattern 3 treated) while was abnormal in 3 infants (2 infants with pattern 2 treated, 1 with pattern 4 untreated). The PLIC signal was absent in 7 infants (5 infants with pattern 1 treated, 2 infants with pattern 2 treated).
MRI pattern versus General Movements
MRI-detected injury patterns significantly correlated with both 1-month and 3-months GMs. In particular MRI-detected injury patterns correlated with 1-month GMs in 21 infants and with 3-months GMs in 19 infants showing a significant correlation level (respectively r=0,86 and r=0,81, both with P<0,01). MRI patterns had a sensitivity of 81,82% and a specificity of 100% for 1-month GMs (PPV 100%; NPV 83,33%), a sensitivity of 88,89% and a specificity of 90% for 3-months GMs (PPV 88,89%; NPV 90%).
MRI pattern versus Hammersmith scoring
MRI-detected injury patterns significantly correlated with 1-week, 1-month and 3-month Hammersmith scoring, respectively in 21, 22 and 20 infants (respectively r=0,85, r=0,85 and r=0,89 with P<0,01). MRI pattern had a sensitivity of 81,82 and a specificity 100% for 1-week Hammersmith scoring (PPV 100%; NPV 83,33%), a sensitivity of 90% and a specificity of 100% for 1-month Hammersmith scoring (PPV 100%; NPV 92,31%), a sensitivity of 100% and a specificity of 100% for 3-months Hammersmith scoring (PPV 100%; NPV 100%).
MRI pattern versus Motor Outcome
MRI-detected injury patterns significantly correlated with 6-12 months motor outcome in 17 infants (r=0,84 with P<0,01). MRI patterns had a sensitivity of 100% and a specificity of 100% (PPV 100%; NPV 100%).
ADC and FA measurements
ADC and FA values are shown in Table 2. In 1 neonate the presence of motion artifacts prevented the visual assessment of DWI weighted sequence as well as the calculation of the ADC.
ADC Values
A linear regression analysis was used to examine the ADC trend for age at MRI in different groups in each region of interest (the mean of right and left values was considered for each region of interest).
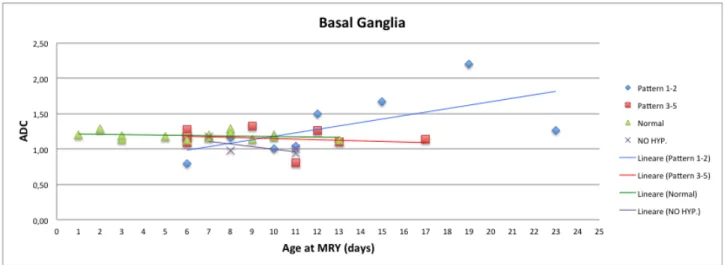
-Basal Ganglia and Thalamy
In the first week of postnatal life mean ADC values (10-3mm2/s) in BG and T of hypothermia-treated infants with pattern 1-2 (BG=0,80, T=0,61) tended to reduce compared to the mean ADC values of healthy control infants (BG=1,19, T=0,97) and of patients with pattern 3-5, both hypothermia-treated (BG=1,18, T=1,05) and untreated infants (BG=1,18, T=1,14). In the second and third week the mean ADC values in BG and T of hypothermia-treated infants with pattern 1-2 (BG=1,40, T=1,14) tended to increase compared to the mean ADC values of healthy control group (BG=1,19, T=0,98) and hypothermia-treated patients with pattern 3-5 (BG=1,13, T=1,04) which maintain substantially the same values of first week. On the other side, untreated infants (pattern 4-5) showed a slight decrease of ADC values during the second week (BG=0,97, T=1,03) with respect to the first one. See figures 3 and 4.
Fig. 3 ADC data (10-3mm2/s)
Fig. 4 ADC data (10-3mm2/s)
-White Matter
In the first week of postnatal life, mean ADC values (10-3mm2/s) in Corticospinal Tracts, Anterior White Matter and Posterior White Matter of hypothermia-treated infants with pattern 1-2 (CT=0,85, AWM=0,77, PWM=0,96) tended to reduce compared to the mean ADC values of healthy control group (CT=1,22, AWM=1,49, PWM=1,51), of hypothermia-treated infants with pattern 3-5 (CT=1,38, AWM=1,47, PWM=1,55) and of untreated infants with pattern 4-5 (CT=1,42, AWM=1,50, PWM=1,34). In the second and third week the mean ADC values of hypothermia-treated infants with pattern 1-2 (CT=1,44, AWM=1,49, PWM=1,46) tended to increase compared with the mean ADC values of the other three groups: healthy control group (CT=1,18, AWM=1,47, PWM=1,40), hypothermia-treated pattern 3-5 (CT=1,44, AWM=1,54, PWM=1,58), and untreated infants with pattern 4-5 (CT=1,34, AWM=1,41, PWM=1,68). The data show that the ADC values in Corticospinal Tracts of hypothermia-treated infants with pattern 3-5 and untreated infants with pattern 4-5 were higher than those of healthy control group in both first and second-third week. See figures 5,6 and 7.
Fig. 5 ADC data (10-3mm2/s)
Fig. 6 ADC data (10-3mm2/s)
Fig. 7 ADC data (10-3mm2/s)
FA Values
A linear regression analysis was used to examine the FA trend for age at MRI in different groups in each region of interest (the mean of right and left values was considered for each region of interest).
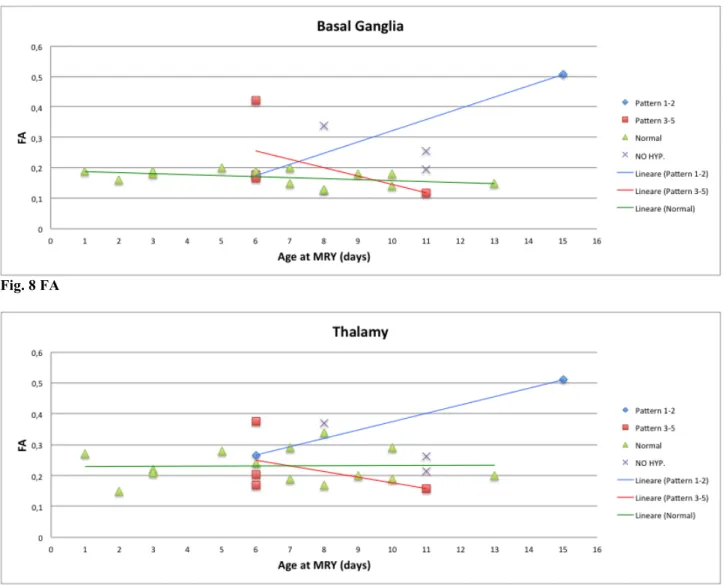
- Basal Ganglia and Thalamy
In the first week of postnatal life, mean FA values in both BG and T of hypothermia-treated infants with pattern 1-2 (BG=0,17, T=0,27) are substantially similar to FA values of other groups,
particularly infants healthy control group (BG=0,18, T=0,23). In the second and third week the mean FA values in both BG and T of hypothermia-treated infants with pattern 1-2 (BG=0,51, T=0,51) tended to increase compared with the mean FA values of the other groups which show a slight decrease, particularly infants healthy control group (BG=0,15, T=0,23) and hypothermia-treated infants with pattern 3-5 (BG=0,12, T=0,16). See figures 8 and 9.
Fig. 8 FA
Fig. 9 FA
- White Matter
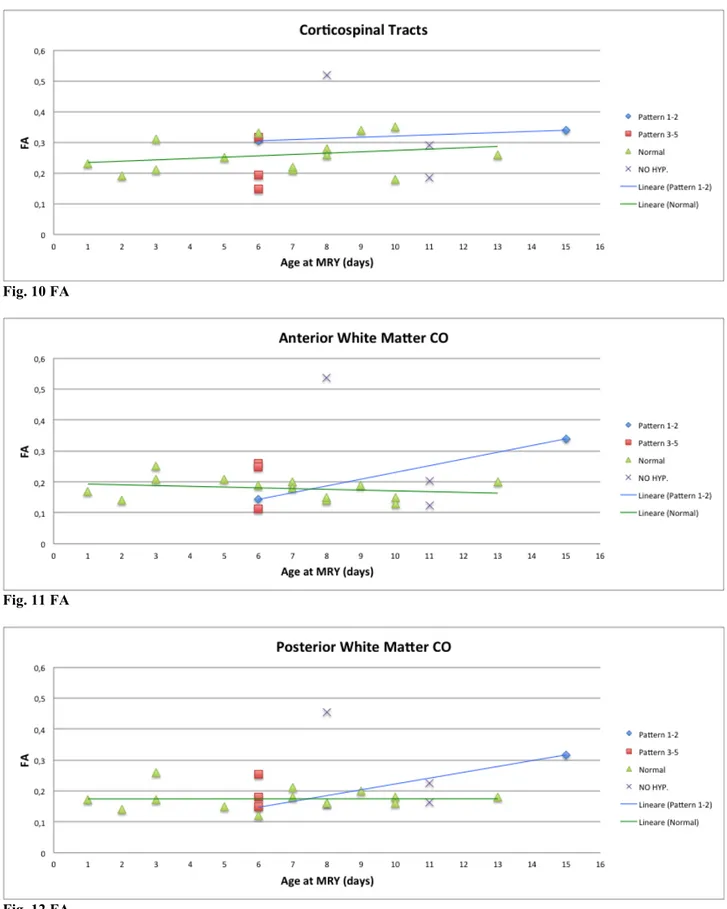
In first week of postnatal life, mean FA values in Corticospinal Tracts of hypothermia-treated infants with pattern 1-2 (CT=0,31) are greaten that the FA values of other groups, particularly pattern 3-5 (CT=0,22) and infants healthy control group (CT=0,24), whereas in second and third week all mean FA values tended to increase with mean FA values of infant with pattern 1-2 (CT=0,34) that remain higher than the other groups, particularly infants healthy control group (CT=0,28) and untreated infants (CT=0,33). In both Anterior White Matter and Posterior White Matter of first week of postnatal life, mean FA values of infants with pattern 1-2 (AWM=0,14, PWM=0,15) are less that the FA values of other groups, particularly pattern 3-5 (AWM=0,21, PWM=0,19) and infants healthy control group (AWM=0,19, PWM=0,18). In second and third week the mean FA values tended to increase in hypothermia-treated infants with pattern 1-2 (AWM=0,34, PWM=0,32) whereas the values of infants healthy control group remain substantially stable (AWM=0,16, PWM=0,17). No FA values were available for patients scanned during the first post-natal week. See figures 10, 11, 12.
Fig. 10 FA
Fig. 11 FA
Fig. 12 FA
Discussion
According to Ferrari at al. previous studies, we found a high correlation between MRI-detected injury patterns and general movements. In our study we have extended the correlation of MRI-detected injury patterns also to Hammersmith scoring and motor outcome. In particular we found that MRI pattern had a high predictive value for both Hammersmith scoring and motor outcome.
The other main goal was to evaluate the trend of the ADC and the FA in the different groups of patients in order to establish a more sensitive detector of tissue damage than the conventional MRI. According to previous studies we found that ADC values tend to be lower in patients with moderate or severe damage (pattern 1-2) in the first week in both white matter and in the Basal Ganglia and Thalamy, and successively they increased in the second and third week. This pseudonormalization obviously limits the absolute sensitivity of the parameter but, by the time it has occurred, lesions become usually more obvious on conventional imaging. Patients with mild or moderate damage (pattern 3,4,5) show similar or increased ADC values with respect to the control group both in the first and second-third week. From our study it appears that in two patients having pattern 5, the ADC values are significantly lower in most of regions of interest in comparison to those observed in both healthy control group and in patients with similar MR pattern. To date these patients have a normal GMs and Hammersmith scoring, however the evaluation of the motor outcome is needed to disclose a possible predictive value of ADC values. Concerning with untreated infants (3 patients with MR pattern 5 and 1 patient with pattern 4) the ADC values show a trend similar to that of treated infants with pattern 3-5, that is they tend to be lower than ADC values of healthy controls both in the first and second-third week.
In disagreement with previous study by Phil Ward et al., in our study the FA values tend to increase from the first to the second-third weeks in hypothermia treated patients with pattern 1-2. This pseudormalization could limit the sensitivity of FA parameter for the tissue damage.
The present study has some limitations. First of all the small sample size did not allow to evaluate the statistical significance of ADC and FA differences among groups. Moreover, MRI scans were performed at the different age over the first three postnatal weeks.
In conclusion, the main result arising from our study is that conventional MRI is the main tool in the subacute phase, for both diagnostical and predictive purposes.
References
1. Hagberg B et al. Changing panorama of cerebral palsy in Sweden. VIII. Prevalence and origin in the birth year period 1991–94. Acta Paediatr. 2001;90:271–277
2. Tortori Donati et al. Pediatric Neuroradiology Brain Head and Neck Spine – Chapter 6. 3. Barkovich AJ, Westmark K, Partridge C, Sola A, Ferriero DM. Perinatal asphyxia: MR
findings in the first 10 days. AJNR Am J Neuroradiol. 1995;16:427– 438
4. Rutherford MA et al. Hypoxic ischemic encephalopathy: early magnetic resonance imaging findings and their evolution. Neurope- diatrics. 1995;26:183–191
5. Kaufman SA et al. Encephalopathy as a predictor of magnetic resonance imaging abnormalities in asphyxiated newborns. Pediatr Neurol. 2003;28:342–346
6. Mercuri E et al. Neonatal neurological examination in infants with hypoxic ischemic encephalopathy: correlation with MRI findings. Neuropediatrics. 1999;30:83–89
7. Biagioni E et al. Combined use of electroencephalogram and magnetic resonance imaging in full- term neonates with acute encephalopathy. Pediatrics. 2001;107: 461– 468
8. Rutherford MA et al. Abnormal magnetic resonance signal in the internal capsule predicts poor neurodevelopmental outcome in infants with hypoxic-ischemic encephalopathy. Pediatrics. 1998;102:323–328
with neonatal encephalopathy: relationship with neonatal brain MRI. Neuropediatrics. 2002;33:242–248
10. Sarnat HB, Sarnat MS. Neonatal encephalopathy following fetal distress. A clinical and electroencephalographic study. 1976 Oct;33(10):696-705.
11. Okereafor A. et al. Patterns of brain injury in neonates exposed to perinatal sentinel events. Pediatrics 2008;121:906.
12. A. James Barkovich et al. Prediction of Neuromotor Outcome in Perinatal Asphyxia: Evaluation of MR Scoring Systems AJNR Am J Neuroradiol 19:143–149, January 1998. 13. Linda S.de Vries et al. Patterns of neonatal hypoxic-ischemic brain injury. Neuroradiology
(2010) 52:555-566.
14. A. James Barkovich et al. Prediction of Neuromotor Outcome in Perinatal Asphyxia: Evaluation of MR Scoring Systems. AJNR Am J Neuroradiol 19:143–149, January 1998. 15. Fabrizio Ferrari et al. Movements in Full-Term Infants with Perinatal Asphyxia Are Related
to Basal Ganglia and Thalamic Lesions. J Pediatr 2011;158:904-11.
16. A.I. Bartha et al.The Normal Neonatal Brain: MR Imaging, Diffusion Tensor Imaging, and 3D MR Spectroscopy in Healthy Term Neonates. AJNR Am J Neuroradiol 28:1015–21; Jun-Jul 2007.
17. Phil Ward et al. Reduced Fractional Anisotropy on Diffusion Tensor Magnetic Resonance Imaging After Hypoxic-Ischemic Encephalopathy. Pediatrics 2006;117;e619.
18. Rod W. Hunt et al.Apparent et al. Diffusion Coefficient in the Posterior Limb of the Internal Capsule Predicts Outcome After Perinatal Asphyxia. Pediatrics 2004;114;999.
19. Christophe Boichot, MD et al. Term Neonate Prognoses after Perinatal Asphyxia: Contributions of MR Imaging, MR Spectroscopy, Relaxation Times, and Apparent Diffusion Coefficients. Radiology: Volume 239: Number 3—June 2006.
20. O. Brissaud M. et al.Efficiency of Fractional Anisotropy and Apparent Diffusion Coefficient on Diffusion Tensor Imaging in Prognosis of Neonates with Hypoxic-Ischemic Encephalopathy: A Methodologic Prospective Pilot Study. AJNR Am J Neuroradiol 31:282–87, Feb 2010.
21. L. Liauw et al. Is There a Way to Predict Outcome in (Near) Term Neonates with Hypoxic-Ischemic Encephalopathy Based on MR Imaging? AJNR Am J Neuroradiol 29:1789–94; Oct 2008.
22. A. J. Barkovich et al. MR Imaging, MR Spectroscopy, and Diffusion Tensor Imaging of Sequential Studies in Neonates with Encephalopathy. AJNR Am J Neuroradiol 27:533–47; Mar 2006.
23. Mary Rutherford et al. Assessment of brain tissue injury after moderate hypothermia in neonates with hypoxic–ischaemic encephalopathy: a nested substudy of a randomised controlled trial. Lancet Neurol. 2010 January ; 9(1): 39–45.
24. Georg Simbruner, MD et al. Systemic Hypothermia after neonatal encephalopathy:outcomes of neo.nEuro.network RCT. Pediatrics Volume 126, Number 4, October 2010.
25. Susan E. Jacobs, MD et al. Whole-body hypothermia for term and near-term newborns with hypoxic-ischemic encephalopathy. Arch Pediatr Adolesc Med. 2011; 165(8): 692-700.