Autore:
Fabio Moretti
Relatori:
Prof. Francesco D’Auria Prof. Walter Ambrosini
CONTRIBUTION TO THE ASSESSMENT OF
CFD CODES FOR IN-VESSEL FLOW
INVESTIGATION
Anno 2009
UNIVERSITÀ DI PISA
Scuola di Dottorato in Ingegneria “Leonardo da Vinci”
Corso di Dottorato di Ricerca in
SICUREZZA NUCLEARE E INDUSTRIALE
ABSTRACT
The present research aims at contributing to the CFD code assessment process for nuclear reactor applications, and particularly for the predictive analysis of the fluid-dynamic phenomena occurring inside the reactor pressure vessel of a pressurized water reactor. The importance of such phenomena relies, for instance, on the influence that they can have on the spatial and temporal distribution of coolant properties (such as temperature or boron concentration) at the core inlet during certain accident transients involving perturbations of such properties with respect to nominal conditions; furthermore, in-vessel mixing phenomena can also affect the thermal interaction between coolant and pressure vessel during pressurized thermal shock scenarios.
The contribution provided by this work consists in the proposal of a general and systematic methodology to be applied in the CFD code assessment for in-vessel flow investigations. Within the proposed approach, the relevant modelling issues are identified and discussed, so as to point out the main capabilities and limitations in the present state-of-the-art tools and methods. Then, the main steps of the code application procedure are described and discussed analytically, thus providing guidance for a quality-oriented use of the codes, and complementing the existing best practice guidelines for this specific problem.
Furthermore, the research addresses the problem of the quantification of the accuracy for numerical predictions (both from CFD and integral codes) about coolant properties perturbations at the core inlet. As a result, a methodology is proposed based on a set of accuracy indicators, which can represent a means for judging whether the code results are sufficiently close to experimental data, once acceptance thresholds have been defined and the method has been completely assessed.
The work is supported by extensive CFD code validation and application results obtained in the frame of several international research projects and co-operations, and by a continuous interaction with the involved International scientific community.
LIST OF CONTENTS
ABSTRACT... 2
LIST OF CONTENTS... 3
LIST OF FIGURES ... 8
LIST OF TABLES... 12
ABBREVIATIONS AND ACRONYMS ... 13
1. INTRODUCTION ... 15
1.1.OBJECTIVES OF THE RESEARCH... 15
1.2.FRAMEWORK... 16
1.3.PRELIMINARY REMARKS... 18
1.4.BASIC NOMENCLATURE... 19
2. STATE-OF-THE-ART IN THE APPLICATION OF CFD CODES TO NRS PROBLEMS ... 21
2.1.GENERAL REMARKS... 21
2.2.IDENTIFICATION OF NRS ISSUES REQUIRING CFD ... 21
2.3.STATE-OF-THE-ART IN CFD QUALITY ASSURANCE... 22
2.3.1. Historical remarks... 23
2.3.2. The CSNI BPGs for CFD application to nuclear reactor problems ... 23
2.3.3. Concluding remarks on CFD quality assurance... 25
2.4.REVIEW OF EXISTING CFD CODE ASSESSMENT DATABASE RELATED TO IVF INVESTIGATION... 26
2.4.1. Experimental database... 26
2.4.1.1. ROCOM facility...26
2.4.1.2. Gidropress mixing facility...27
2.4.1.3. Vattenfall mixing facility ...28
2.4.1.4. Fortum PTS test facility ...29
2.4.1.5. University of Maryland 2x4 loop facility ...29
2.4.1.6. UPTF...30
2.4.1.7. Kozloduy NPP VVER-1000 ...31
2.4.1.8. Paks NPP VVER-440...31
2.4.2. International activities and events on CFD code assessment ... 32
2.4.2.1. OECD-NRC ISP-43...32
2.4.2.2. OECD Benchmark V1000CT-2 ...32
2.4.2.3. ECORA Project...32
2.4.2.4. FLOMIX-R Project...33
2.4.2.5. TACIS R2.02/02 Project ...36
2.4.2.6. Further existing validation databases...37
3. RELEVANCE OF IVF INVESTIGATION TO NUCLEAR REACTOR SAFETY . 38 3.1.GENERAL REMARKS... 38
3.2.RELEVANT SCENARIOS... 39
3.2.1. Boron dilution transients ... 39
3.2.1.1. Historical remarks ...39
3.2.1.2. Origin of a boron dilution event ...41
3.2.1.4. Boron Dilution Scenarios...42
3.2.2. Overcooling transients... 45
3.3.THE POSITION OF THE USNRC ... 46
3.3.1. Generic safety issues ... 46
3.3.2. Standard Review Plan ... 48
3.3.2.1. Boron Dilution ...48
3.3.2.2. Asymmetrical Temperature Distribution...49
3.4.THE POSITION OF USINDUSTRY... 52
3.4.1. Existing Reactors ... 52
3.4.1.1. Westinghouse...52
3.4.1.2. Babcock & Wilcox ...54
3.4.1.3. ASEA Brown Boveri – Combustion Engineering (ABB-CE) ...54
3.4.2. Innovative Reactors: Westinghouse AP-600 and AP-1000 ... 56
3.4.2.1. Boron Dilution ...56
3.4.2.2. Asymmetric Temperature Distribution ...59
3.5.USRESEARCH CONTEXT... 60
3.5.1. BNL... 60
3.5.2. University of Maryland ... 61
3.5.3. The OECD/NEA - USNRC PWR Main Steam-Line Break Benchmark . 62 3.6.BRIEF REVIEW OF EUPROJECTS RELATED TO COMPUTATIONAL TOOLS... 62
3.6.1. EUBORA... 63 3.6.2. EUROFASTNET ... 63 3.6.3. ECORA ... 63 3.6.4. ASTAR... 63 3.6.5. FLOMIX-R... 63 3.6.6. VALCO... 63 3.6.7. CRISSUE-S ... 64 3.6.8. NURESIM ... 64 3.6.9. BOROND ... 64 3.7.THE POSITION OF IAEA ... 65
4. ASSESSMENT METHODOLOGY FOR IVF INVESTIGATIONS... 68
4.1.GENERAL REMARKS... 68
4.2.INVOLVED PHENOMENA AND FLOW CONFIGURATIONS... 68
4.2.1. Pipe flow in cold and hot legs ... 69
4.2.1.1. Cross-sectional profiles ...69
4.2.1.2. Thermal stratification...69
4.2.1.3. Effect of elbows ...69
4.2.1.4. Effects due to circulation pump outlet...70
4.2.1.5. Experimental issues ...70
4.2.1.6. Numerical and modelling issues ...72
4.2.2. ECC injection into CL ... 73
4.2.2.1. Jet impingement ...73
4.2.2.2. Inducing thermal stratification ...73
4.2.2.3. Inducing thermal oscillations...73
4.2.2.4. Connection to two-phase flow conditions ...74
4.2.3. RPV inlet... 74
4.2.3.1. Jet impingement ...74
4.2.3.2. Effect of fillets and diffusion regions...75
4.2.3.3. Meshing issues ...75
4.2.3.5. Coupling with TH-SYS...77 4.2.4. Downcomer flow... 77 4.2.4.1. Flow distribution...77 4.2.4.2. DC flow rotation ...80 4.2.4.3. Geometrical features...81 4.2.4.4. Meshing issues ...82
4.2.4.5. Further modelling issues ...83
4.2.5. Lower plenum flow ... 84
4.2.5.1. Geometrical features...84
4.2.5.2. CFD meshing issues ...86
4.2.5.3. Porous media ...87
4.2.6. Core region flow ... 88
4.2.6.1. Level of complexity ...88
4.2.6.2. Channel-type vs. open space ...89
4.2.6.3. Inclusion in the computational domain ...90
4.2.6.4. Pressure loss assessment...92
4.2.7. Upper plenum & outlet nozzle flow... 94
4.2.7.1. Relevance of UP flow...94
4.2.7.2. Modelling issues ...95
4.3.MAIN STEPS OF IVFCFD ANALYSIS... 96
4.3.1. Definition of the objectives of the analysis... 96
4.3.2. Definition of the computational domain ... 98
4.3.3. Creation of the 3D solid model... 99
4.3.4. Meshing ... 100
4.3.4.1. Modular approach...102
4.3.4.2. Meshing strategies...103
4.3.4.3. Managing interfaces...104
4.3.4.4. Mesh sensitivity analysis ...105
4.3.5. CFD simulations set-up ... 105
4.3.5.1. Choosing transient vs. steady state ...106
4.3.5.2. Defining material properties...107
4.3.5.3. Turbulence modelling...107
4.3.5.4. Defining additional balance equations...108
4.3.5.5. Defining initial conditions...108
4.3.5.6. Inlet boundary conditions...109
4.3.5.7. Outlet boundary conditions...111
4.3.5.8. Wall boundary conditions ...112
4.3.5.9. Spatial discretization ...113 4.3.5.10. Time discretization ...113 4.3.5.11. Source terms ...114 4.3.5.12. Convergence control ...114 4.3.5.13. Results storage...116 4.3.5.14. Sensitivity analyses...117 4.3.6. CFD simulations execution ... 118
4.3.6.1. Parallel calculation issues ...118
4.3.6.2. On-line results monitoring...119
4.3.6.3. On-line convergence monitoring ...119
4.3.7. Results post-processing and analysis ... 119
4.3.7.1. 2D and 3D plots ...119
4.3.7.2. 1D plots...120
4.3.7.3. Results analysis...120
4.3.8. Coupling... 121
4.3.8.2. Data transfer between CFD and neutron kinetics codes ...122
4.3.8.3. Data transfer between CFD and structural mechanics codes ...122
4.4.ROLE OF CFD IN SUPPORT TO TH-SYS CODE APPLICATION AND VALIDATION.. 123
4.4.1. Interpretation of system code results ... 123
4.4.2. Extension of the experimental database ... 125
4.4.3. Development of TH-SYS nodalizations: pressure loss estimation... 126
4.4.4. Development of TH-SYS nodalizations: investigation of 3D flows... 126
5. ACCURACY EVALUATION... 128
5.1.GENERAL REMARKS... 128
5.2.CURRENT APPROACHES IN ACCURACY EVALUATION... 128
5.3.PROPOSAL OF A MORE EXHAUSTIVE QUANTIFICATION OF ACCURACY... 131
5.3.1. Qualitative analysis ... 131
5.3.2. Quantitative analysis ... 133
5.3.2.1. Preliminary data processing (time and space dependent quantities) ...134
5.3.2.2. Scalar quantities related to perturbation appearance...143
5.3.2.3. Scalar quantities related to overall maximum perturbation ...144
5.3.2.4. Scalar quantities related to core-averaged perturbation ...145
5.3.2.5. Scalar quantities related to accumulated perturbation...148
5.3.2.6. Scalar quantities related to the perturbation barycentre ...148
5.3.2.7. FLOMIX deviations ...149
5.3.2.8. Spatial gradients ...150
5.3.2.9. Application of 3D FFTBM ...150
5.4.SAMPLE APPLICATION OF THE PROPOSED APPROACH... 151
5.4.1. Preliminary remarks ... 151
5.4.2. Parameters for accuracy quantification ... 152
5.4.3. The selected experiments... 155
5.4.4. The selected simulations ... 156
5.4.5. Results of the application of the accuracy quantification approach .... 158
5.5.CONCLUDING REMARKS ON ACCURACY EVALUATION... 164
6. FINAL REMARKS ON THE WORK DONE AND CONCLUSIONS ... 166
6.1.WORK, EXPERIENCE AND FRAMEWORK... 166
6.2.ACHIEVEMENT OF THE OBJECTIVES... 168
6.3.PERSPECTIVES FOR FUTURE RESEARCH... 170
REFERENCES ... 172
ANNEX A. CFD VALIDATION WORK ... 178
A.1.CFD SIMULATIONS OF ROCOM EXPERIMENTS... 178
A.1.1. General remarks ... 178
A.1.2. ROCOM Experiments ... 179
A.1.2.1. The ROCOM Test Facility ...179
A.1.2.2. The simulated experiment...182
A.1.3. CFD Simulations... 184
A.1.3.1. Computational Grids ...184
A.1.3.2. Simulations Set-up ...187
A.1.4. Results ... 190
A.1.4.1. Results of Calculations #1 to #4 ...191
A.1.4.2. Results of Calculation #5 ...193
References to Section A.1... 199
A.2.CFD SIMULATIONS OF VVER-1000 ... 200
A.2.1. Introduction... 200
A.2.2. Grids preparation ... 201
A.2.3. Test calculations ... 205
A.2.4. Thermal mixing simulations... 206
A.2.4.1. The swirl effect ...208
A.2.4.2. The effect of numerical diffusion...210
A.2.5. Slug-mixing simulations ... 210
A.2.6. Conclusions ... 213
Nomenclature ... 213
References to Section A.2... 214
A.3.CFD SIMULATIONS OF GIDROPRESS MIXING FACILITY... 215
A.3.1. Introduction... 215
A.3.2. Description of the experiment... 216
A.3.3. Description of the computational model... 218
A.3.3.1. Computational grid ...218
A.3.4. Simulations set-up ... 222
A.3.5. Results ... 223
A.3.6. Conclusions ... 233
LIST OF FIGURES
Figure 1 – ROCOM facility: a) sketch of the facility; b) Plexiglas RPV model... 26
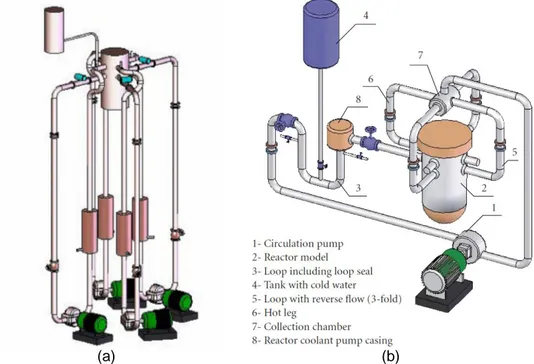
Figure 2 – Sketch of Gidropress mixing facility: a) new layout; b) old layout... 27
Figure 3 – Vattenfall test facility: a) facility layout; b) RPV cross-section ... 28
Figure 4 – Fortum mixing test facility (Ref. [21])... 29
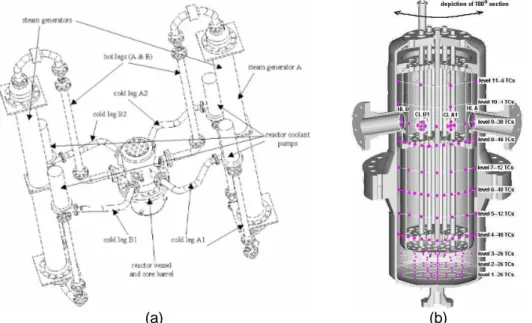
Figure 5 – University of Maryland 2x4 loop facility: a) overall sketch; b) inside view of the RPV, showing thermocouple locations... 30
Figure 6 – Sketch of UPTF facility (Ref. [39])... 31
Figure 7 – Effect of CL elbow on RPV inlet flow... 70
Figure 8 – Wire-mesh sensor at ROCOM inlet nozzle (200 measuring points over the cross-section) ... 71
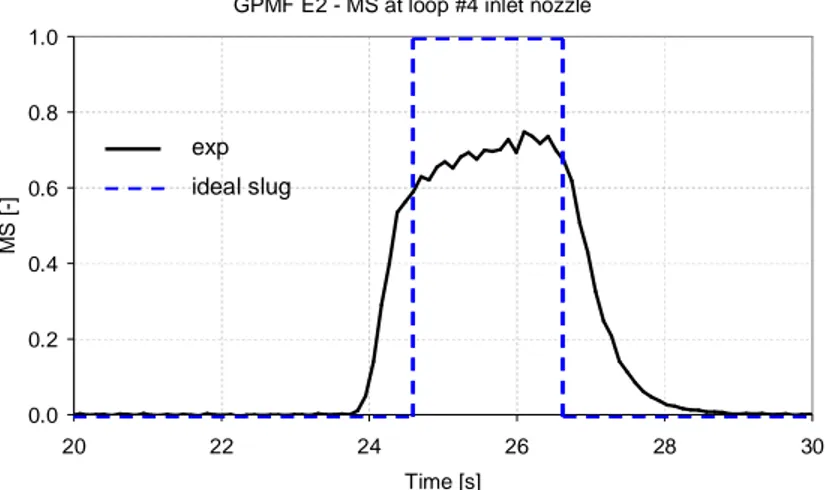
Figure 9 – External mixing: MS at RPV inlet during GPMF slug-mixing test #2... 72
Figure 10 – RPV inlet (CFD model) ... 74
Figure 11 – Effect of inlet nozzle fillet on flow distribution in the DC ... 75
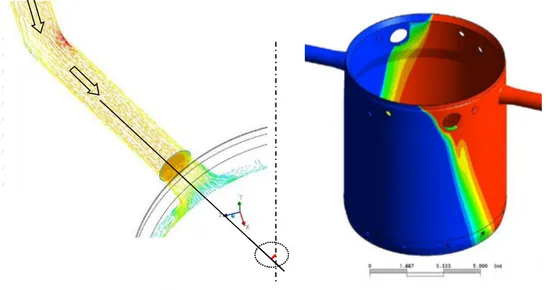
Figure 12 – Meshing the inlet nozzles: a) improvable quality; b) excellent quality. 76 Figure 13 – CFD simulation of symmetric and steady pump operation experiment at Gidropress facility (with tracer injection into loop #4): a) streamlines from loop #1; b) perturbation sector at core inlet (Refs. [13] and [47]) ... 78
Figure 14 – Effect of mixing in DC (see Section A.1) ... 79
Figure 15 – CFD simulation mixing experiment at Gidropress facility, featuring pumps no. 1 and 2 in steady operation, and tracer injection into loop no. 4): a) streamlines from loop #1; b) perturbation sector at core inlet (Ref. [47])... 79
Figure 16 – CFD simulation of ROCOM pump start-up test with tracer injection in starting loop: streamlines and mixing scalar field at two different instants (Ref. [80]). ... 80
Figure 17 – Effect of the downcomer flow rotation on the perturbation at core inlet (Ref. [47]) ... 81
Figure 18 – Spacer between RPV and barrel in VVER-1000 reactor: a) geometry (Ref. [8]); b) 3D solid model prior to meshing (Section A.2)... 82
Figure 19 – Diameter variation below inlet nozzle region: a) VVER-1000 (Section A.2); b) Atucha-II PHWR (Ref. [3])... 82
Figure 20 – Perturbation azimuthal profile in DC (top), ROCOM slug mixing test (Section A.1)... 83
Figure 21– Perturbation azimuthal profile in DC (bottom), ROCOM slug mixing test (Section A.1)... 84
Figure 22 – ROCOM LP internals: perforated drum (a); core support plate (b) ... 85
Figure 23 – VVER-1000 LP internals (from Ref. [8]) ... 85
Figure 24 – Atucha-II LP internals (LP region indicated by dashed zone; Ref. [3]) 86 Figure 25 – Hybrid mesh for ROCOM LP ... 87
Figure 26 – Porous medium for ROCOM perforated drum (blue) ... 88
Figure 27 – CFD simulation of Atucha-II moderator flow: a) computational domain; b) predicted thermal stratification (Ref. [4]) ... 89
Figure 28 – Simplified modelling for the core region in ROCOM facility (Ref. [22]) 90 Figure 29 – Sensitivity analysis on location of outlet boundary (Ref. [13) ... 91
Figure 30 – Simulation of Atucha-II fuel assemblies: a) computational domain; b) mesh detail ... 92
Figure 31 – ROCOM lower support plate: a) drawing (with indication of sub-region for CFD analysis); b) picture from the top (wire-mesh sensor well recognizable, as
well as the thin plate in the bottom, on which small holes are drilled) ... 93
Figure 32 – CFD mesh for detailed simulation of pressure losses through ROCOM lower plate: a) detailed domain; b) simplified domain... 93
Figure 33 – CFD study of pressure losses through ROCOM lower plate ... 93
Figure 34 – Including the UP and the core region in the computational domain for IVF investigation: a) UNIPI simulations of ROCOM (Section A.1); b) Russian simulations of Gidropress facility (Ref. [13])... 94
Figure 35 – CFD analysis of Atucha-II upper plenum: a) computational domain; b) velocity field predicted for a pump shaft break scenario... 95
Figure 36 – Definition of finite control volumes from nodes and elements in CFX (2D example), Ref. [10] ... 102
Figure 37 – Non-uniform concentration profile at inlet boundary in a ROCOM test ... 111
Figure 38 – Convergence control: reaching the “asymptotic region”... 115
Figure 39 - Convergence control: stabilization of the solution ... 115
Figure 40 – Convergence control: checking imbalances ... 116
Figure 41 – In-vessel flow distribution during pump start-up scenario (CFD result) ... 124
Figure 42 – Tracer distribution in the downcomer (a) and at the core inlet (b) during pump start-up scenario (CFD result)... 124
Figure 43 – Tracer distribution at the core inlet during pump start-up scenario (system code result)... 125
Figure 44 – Typical channel-by-channel comparison (from Ref. [31])... 130
Figure 45 – Another typical comparison approach (from Ref. [7])... 131
Figure 46 Example of maximum perturbation time history... 135
Figure 47 Examples of core-averaged perturbation time history... 136
Figure 48 Examples of accumulated perturbation time history ... 137
Figure 49 Example of perturbation distribution at core inlet at a given instant .... 139
Figure 50 Example of slope map... 139
Figure 51 Sample maps of “dev2”-type deviations ... 142
Figure 52 Sample plots of “dev4” deviations ... 143
Figure 53 Possible core-averaged perturbation trends... 147
Figure A. 1 – Sketch of ROCOM facility layout ... 180
Figure A. 2 – Locations of wire-mesh sensors ... 182
Figure A. 3 – ROCOM_STAT_02 experiment: time history of inlet MS ... 183
Figure A. 4 – Whole computational domain ... 184
Figure A. 5 – LP solid model (drum in evidence)... 185
Figure A. 6 – DC mesh (A01) ... 186
Figure A. 7 –LP mesh (A01, A04)... 186
Figure A. 8 – Reduced core (A07 grid) ... 187
Figure A. 9 – Non uniform inlet MS profile ... 189
Figure A. 10 – Locations of monitor points... 190
Figure A. 11 – CFD results: streamlines from loop 1 (a) and MS field (b) ... 191
Figure A. 12 – Azimuthal profile of MS at the upper DC sensor... 192
Figure A. 13 – Azimuthal profile of MS at the lower DC sensor ... 192
Figure A. 15 – Azimuthal profile of MS at the upper DC sensor (t=30s)... 194
Figure A. 16 – Azimuthal profile of MS at the lower DC sensor (t=30s) ... 194
Figure A. 17 – Comparison of MS at core inlet (ch. #53)... 195
Figure A. 18 – Comparison of MS at core inlet (ch. #16)... 195
Figure A. 19 – Comparison of MS at core inlet (ch. #25)... 196
Figure A. 20 – Map for identification of measurement points at core inlet wire mesh sensor ... 196
Figure A. 21 – Comparison of MS at inlet of peripheral channels (t=30s) ... 197
Figure A. 22 – Comparison of maximum and space-averaged MS at core inlet.. 197
Figure A. 23 – Comparison of MS at core inlet for some selected instants (15 s, 30 s and 40 s respectively) ... 198
Figure A. 24 –Sketch of the LP internals (left, from Ref. [5]) and related CAD model (right)... 201
Figure A. 25 – Sketch of the consoles (left, from Ref. [5]) and related CAD model ... 202
Figure A. 26 –CAD model of the computational domain... 202
Figure A. 27 – Cross-section of the lower part of the computational domain ... 203
Figure A. 28 – Particulars of the mesh: a) quarter of the DC; b) consoles region 204 Figure A. 29 – Mesh in the LP region ... 204
Figure A. 30 – Cross section of the Kozloduy-6 reactor at inlet nozzle level, with indication of symmetries... 205
Figure A. 31 – Fuel assemblies’ layout and identification. FA with inlet thermocouples are also indicated (from Ref. 5) ... 207
Figure A. 32 – Temperature distribution at core inlet: comparison of CFX results, RELAP5-3D results, and plant data... 208
Figure A. 33 – Thermal mixing problem: comparison of fuel assembly inlet temperatures values from experiment (V1000CT-2 data), CFX simulations (both High Resolution and Upwind schemes). ... 209
Figure A. 34 – The effect of numerical diffusion: steady-state thermal mixing calculation, with upwind scheme (a and c) and high resolution scheme (b and d) ... 211
Figure A. 35 – Results of CFX calculations of the slug-mixing problem (1 m/s case), solving either the full set of equations or only the passive scalar transport equation. Time histories of scalar concentration at some selected FA inlets are compared 213 Figure A. 36 – Vertical cross-section of the RPV model (a); 3D isometric sketch of the facility (b) ... 217
Figure A. 37 – Location of the tracer slug ... 217
Figure A. 38 – Sketch of the computational domain chosen for CFD simulations 219 Figure A. 39 – Mesh: a) overall view; b) vertical cross-section view ... 221
Figure A. 40 – Mesh: a) inlet nozzle detail; b) LP detail... 221
Figure A. 41 – Loop flowrates (post-test values coincide with experimental values) ... 223
Figure A. 42 – Numerical results: velocity field (streamlines from loop 4) ... 224
Figure A. 43 – Numerical results: azimuthal velocity profile in DC... 224
Figure A. 44 – Comparison of MS distribution at core inlet during slug passage. 226 Figure A. 45 – Maximum mixing scalar at core inlet ... 228
Figure A. 46 – Core-averaged mixing scalar... 228
Figure A. 47 – Accumulated perturbation at core inlet... 228
Figure A. 49 – Maps of DEV2 deviations ... 231 Figure A. 50 – Core-averaged deviations (DEV4): sign, abs. value, root mean square ... 232
LIST OF TABLES
Table 1 – NRS issues needing CFD (from Ref. [6])... 22
Table 2 – List of scalar parameters for accuracy quantification (Calc. / Exp.) ... 153
Table 3 – List of scalar parameters for accuracy quantification (Deviations)... 154
Table 4 – Selected experiments ... 155
Table 5 – Selected simulations... 157
Table 6 – Results of accuracy quantification for selected calculations (first set of parameters) ... 160
Table 7 – Results of accuracy quantification for selected calculations (second set of parameters) ... 161
Table A. 1 – Used grids... 186
Table A. 2 –Summary of CFX calculations for ROCOM_STAT_02 test ... 188
Table A. 3 – Inlet boundary conditions for thermal mixing problem... 207
Table A. 4 – Size of reference grid (M=106)... 220
Table A. 5 – Comparison of results (perturbation appearance; max. perturbation; core-average) ... 229
ABBREVIATIONS AND ACRONYMS
ABWR Advanced Boiling Water Reactor APWR Advanced Pressurized Water ReactorASCII American Standard Code for Information Interchange
BC Boundary Condition
BCM Boiler-Condenser Mode BDBA Beyond Design Basis Accident BIC Boundary and Initial Conditions BPG Best Practice Guidelines BWR Boiling Water Reactor CAD Computer Aided Design
CCL CFX Command Language
CEA Commissariat à l’Energie Atomique CFD Computational Fluid Dynamics CFR Code of Federal Regulations CHT Conjugate Heat Transfer
CL Cold Leg
CSNI Committee on the Safety of Nuclear installation CVCS Chemical and Volume Control System
DBA Design Basis Accident
DNB Departure from Nucleate Boiling DNS Direct Numerical Simulation ECCS Emergency Core Cooling System
EC European Commission
ESBWR Evolutionary Simplified Boiling Water Reactor
EU European Union
FDA Final Design Approval
FFTBM Fast Fourier Transform Based Method
FP Framework Programme
FSAR Final Safety Analysis Report FSER Final Safety Evaluation Report FSI Fluid-Structure Interaction FZD Forschungszentrum Rossendorf GGI General Grid Interface
GPMF Gidropress Mixing Facility
GRNSPG Gruppo di Ricerca Nucleare – San Piero a Grado GSI General Safety Issue
GUI Graphical User Interface
HL Hot Leg
IVF In-Vessel Flow
LDA Laser Doppler Anemometry LES Large Eddy Simulation LOCA Loss Of Coolant Accident LOOP Loss Of Offsite Power
LP Lower Plenum
LWR Light Water Reactor
MS Mixing Scalar
MSLB Main Steam Line Break NEA Nuclear Energy Agency
NK Neutron Kinetics
NPP Nuclear Power Plant NRS Nuclear Reactor Safety
OECD Organization for the Economic Cooperation and Development PHWR Pressurized Heavy Water Reactor
PSU Pennsylvania State University PTS Pressurized Thermal Shock PWR Pressurized Water Reactor RANS Reynolds-Averaged Navier-Stokes RCP Reactor Coolant Pump
RCS Reactor Coolant System RHR Residual Heat Removal
RMS Root Mean Square
RNG Re-Normalized Group ( turbulence model) ROCOM ROssendorf COolant Mixing (Model)
RPV Reactor Pressure Vessel SAR Safety Analysis Report SB-LOCA Small Break LOCA SCM Second Closure Model
SG Steam Generator
SGTR Steam Generator Tube Rupture SRP Standard Review Plan
SST Shear Stress Transport SYS System (code, analysis)
TH Thermal Hydraulics
UNIPI University of Pisa
UP Upper Plenum
1. INTRODUCTION
In many statements about the need to further validate Computational Fluid Dynamics (CFD) codes for nuclear reactor applications, there is an underlying belief that, behind the attractive features of CFD interfaces, there is not a completely reliable predictive tool, at least not reliable enough for being applied to safety related problems.
CFD codes are not yet – generally speaking – fully reliable tools: being inherently “three-dimensional” and “local” does not constitute per se a sufficient condition for assuring that 3D and local phenomena are accurately predicted. Colourful pictures and high definition movies that can easily be produced with CFD post-processing tools often give the illusion of a realistic and trustworthy representation of the reality, but may hide code deficiencies in achieving the needed level of accuracy. On the other hand, intensive CFD code development and assessment work has been and is being carried out in recent years, made more and more effective by the availability of increasing computing resources.
Such advancements are certainly oriented to obtaining reliable and efficient predictive tools; however, some additional efforts are necessary to meet the quality assurance requirements that would make such tools applicable to the nuclear reactor technology, and in particular to the safety analysis within the licensing process.
1.1. Objectives of the research
This research is aimed at contributing to the assessment of CFD codes in their application to problems related to nuclear reactor safety and technology, in particular for the predictive analysis of in-vessel flows in pressurized water reactor (PWR) systems and of the related transport and mixing phenomena affecting the space and time distribution of coolant properties at core inlet.
This aim is pursued by:
directly contributing to the CFD code validation in selected applications; suggesting a general methodology for the code validation against the
existing experimental database;
examining critically and analytically each step of the validation process, evidencing the limitations in the state-of-the-art tools and approaches, proposing solutions and improvements;
proposing a systematic approach to accuracy evaluation.
The approaches and methodologies proposed are partly extendable to thermal-hydraulic system (TH-SYS) codes with three-dimensional capabilities (e.g. RELAP5-3D®, CATHARE 3D, etc.), since data related to the space and time distribution of coolant properties at core inlet are handled in the same form if it comes either from CFD or system code results, or from experimental measurements.
The result of this work can also represent a sort of extension of the existing Best Practice Guidelines (BPG) for application of CFD to nuclear reactor technology
(see Section 2.3), which represent the state-of-the-art as far as the quality assurance of CFD calculations is concerned. In fact such guidelines are still rather general and incomplete and do not address in detail the specific nuclear reactor issues for which CFD is expected to bring a real benefit to the safety assessment. The present work addresses one of such issues, i.e. the analysis of in-vessel flows, systematically and can hopefully contribute to improving the existing tools for achieving the due quality in CFD.
The work is the result of the following CFD-related activities carried out within the San Piero a Grado Research Group (GRNSPG) – University of Pisa:
CFD analyses for various purposes such as code assessment, phenomena investigation, supporting system code assessment and application, supporting nuclear reactor safety and design studies, etc.;
participation in international meetings, workshops and events, being in contact with several internationally recognized experts;
planning and coordination of all CFD-related activities at GRNSPG. Next sub-section provides a picture of the framework of the activities performed.
1.2. Framework
The research has been carried out in the framework of the CFD-related activities and international research projects in progress at the University of Pisa –GRNSPG, and has thus profited of the availability of large experimental databases and numerical resources, as well as of the connection to a wide number of internationally recognized experts in the fields of nuclear reactor safety and thermal-hydraulic and CFD code development and assessment.
A representative list of the main international Projects that have constituted the framework of this research is given below.
Project TACIS R2.02/02, “Simulation tools for transients involving spatial variations of coolant properties”
This project funded by the European Commission was a part of the TACIS programme (Technical Assistance to the Commonwealth of the Independent States), and was conducted in the period January 2005 to June 2007. The work was conducted by a Consultant – a consortium formed by AREVA (the Project leader), the University of Pisa (UNIPI) and the Forschungszentrum Dresden-Rossendorf (FZD) – in cooperation with a Director of Experiments (the Russian utility Gidropress), and had as a “beneficiary” the Rosenergoatom, i.e. the Russian Ministry for the atomic energy.
The objective of the project was to provide a validation database for a set of selected Russian thermal-hydraulics system codes, regarding the investigation of mixing inside the RPV during transients involving perturbation of the coolant properties distribution at the core inlet. The validation database achieved is constituted by ten experiments conducted in the Gidropress mixing facility (GPMF) and pre- and post-test calculations with the selected system codes. All experiments were also simulated (both by UNIPI and FZD) with the CFD code ANSYS CFX,
which provided a valuable support to the system code validation process (see Section 4.4.1). The CFD validation was obviously a useful by-product of the activity.
Agreement UNIPI-FZD
A long lasting research cooperation agreement exists between FZD and the Department of Mechanics, Nuclear and Production Engineering (DIMNP). In this framework, FZD provided UNIPI specialists with measured data from some ROCOM experiments for code validation purposes; such experiments have been simulated both with CFD codes (such as ANSYS-CFX, Fluent and Trio_U) and the system code RELAP5-3D (see ANNEX A, A.1).
NURESIM Integrated Project (EU 6th FP), “European Platform for Nuclear Reactor Simulations”
This project, part of the 6th Framework Programme of the EURATOM, was conducted by a consortium of more than twenty European participants (including University of Pisa) in the period 2005-2007, with the objective of developing and establishing a common European software platform for nuclear reactor simulation. One of the five sub-projects dealt with the development and the validation of thermal-hydraulics tools, and in particular of specific models to be implemented into the French CFD code NEPTUNE_CFD (owned by CEA and EDF) for the simulation of two-phase phenomena occurring in light water reactors during accidental scenario (e.g., boiling crisis and pressurized thermal shock).
NURESIM is also a long-term development programme, of which the NURESIM IP was the fist step. The next step is the Project NURISP which is just starting.
Authors’ contributions to the CFD validation activities can be found in Refs. [1] and [2].
Research Agreement between UNIPI and N.A.-S.A.
UNIPI and the utility Nucleoeléctrica Argentina – Sociedad Anonima (N.A.-S.A.) have established a cooperation agreement in 2006, within which UNIPI provides support to the safety analysis of the pressurized heavy water reactor (PHWR) Atucha-II (currently under construction in Argentina).
In this context, many CFD investigations have been and are being performed among other studies, addressing specific issues relevant to the safety and operation of Atucha-II reactor (including in-vessel flow). Further information can be found in technical documentation of the activity (e.g. Ref. [3] and [4]).
OECD/NEA/CSNI Writing Groups on CFD Issues
Three international groups of experts were established since 2002 by the Committee on the Safety of Nuclear installation (CSNI), and have periodically met to deal with the following topics (respectively):
1. writing Best Practice Guidelines (BPG) for the application of CFD codes to nuclear reactor safety problems;
2. identifying, characterizing and prioritizing the reactor safety issues which require (or would benefit of) the application of single-phase CFD, and making a state-of-the-art on the assessment of current tools;
3. making a state-of-the-art as regards the currently available multi-phase CFD tools.
The Author of the present work participated in the meetings of the above three groups as representative of UNIPI and contributed to the issue of the following two reports: “Best Practice Guidelines for the use of CFD in Nuclear Reactor Safety
Applications” (Ref. [5]) and “Assessment of CFD Codes for Nuclear Reactor Safety Problems” (Ref. [6]).
OECD “V1000CT-2” Benchmark, “VVER-1000 Coolant Transient: Coolant Mixing Tests and MSLB”
This international benchmark, in which UNIPI participated, had the purpose of testing existing tools for computation of coolant mixing in reactivity transients, such as for instance a Main Steam Line Break (MSLB) scenario in a PWR. The benchmark was based on measured plant data from Kozloduy NPP Unit 6. Both system codes and CFD codes were adopted by the participants (including UNIPI) to simulate the transient and quasi steady-state phases of the scenario (Refs. [7], [8] and [9]).
OECD – NUPEC “BFBT” Benchmark
This international benchmark was based on NUPEC BWR Full-size Fine-mesh Bundle Tests (BFBT) and was aimed at assessing the boiling flow modelling capabilities of existing CFD and sub-channel codes. The test facility had provided in the past very accurate measurements of the void fraction at the outlet of a boiling channel (0.3 mm space resolution) for several experiments at different operating conditions, and such data constitute a valuable database for two phase flow CFD code validation.
UNIPI participated in the benchmark performing CFD simulations with both CFX and NEPTUNE_CFD codes.
1.3. Preliminary remarks
The following considerations constitute the basis and the framework for the present work.
1. The attention focuses on the application and assessment of CFD codes for single-phase flows; multiphase-flow CFD applications are addressed only marginally.
2. The fluid-dynamic phenomena that are the main object of the above mentioned CFD investigations are those occurring inside the reactor pressure vessel (RPV) of pressurized water reactors (PWR), including those of Russian technology (i.e. VVER), and pressurized heavy water reactors (PHWR) such as Atucha-I and Atucha-II. Reference will often be made to “in-vessel flow” (IVF). In many cases, the CFD applications deal with experiments conducted on test facilities that reproduce (usually at reduced scales) such kind of reactors.
3. The mentioned IVF phenomena are relevant to the reactor safety because they affect the space and time distribution of the coolant properties (such
as the temperature and the boron concentration) at the core inlet and its deviation from nominal conditions during incidental scenarios. Therefore, the prediction of the “perturbation” of such properties distribution is often the main objective of the CFD analysis.
4. Unless differently specified, the CFD analyses performed by the Author were run using a commercial, general-purpose CFD code, namely ANSYS CFX (releases 10.0 and 11.0, Ref. [10]). Analogously, most computational grids were developed with ANSYS ICEM-CFD package (releases 10.0 and 11.0, Ref. [11]).
1.4. Basic nomenclature
Assessment
It is considered, in this context, as a synonym of the term “qualification” (see below).
Demonstration calculations
Demonstration calculations are often run with the purpose of checking the capabilities of a given code to perform certain calculations, obtaining information on the computational resources required and thus helping in the decision making as regards the code assessment process. They are performed when experimental information for code validation is not yet available or is still incomplete. Demonstration calculations are, in a sense, a support to the validation and cannot in any way replace it.
Mixing Scalar (MS)
Any “perturbation” (see below) of coolant properties transported by the fluid can be expressed in a non-dimensional normalized form with respect to reference values for the unperturbed (i.e. nominal) and perturbed conditions. The resulting quantity is often called the “mixing scalar” (name that was probably introduced by FZD scientists in the framework of ROCOM investigations, Ref. [12]).
The MS, as a function of time and space, can be thus obtained as in Equation 1, where C represents any coolant property (such as temperature, boron or tracer concentration, etc.), while the subscripts 0 and 1 indicate the two reference conditions.
0 1 0,
C
C
C
t
x
C
MS
Equation 1For example, C0 and C1 may be respectively the boron concentration in a PWR’s
coolant in normal operation and in a deborated or low-borated slug which has formed during reflux-condensing mode, or due to a malfunctioning of the Chemical and Volume Control System (CVCS). Otherwise they may represent the normal coolant temperature at core inlet and the temperature of a cold slug which has formed following a Steam Line Break event, or the minimum and the maximum electrical conductivity in a mixing experiment where a salt tracer is utilized to simulate a perturbation in coolant properties (such as in ROCOM, for example). If the two reference values are extreme values i.e. (a minimum and a maximum), then the MS will range between 0 and 1. Otherwise it can assume also values
greater than 1 (such as, for instance, in the injection-type experiments performed on Gidropress mixing facility, Ref. [13]).
Perturbation
“Perturbation” here means any deviation from normal conditions value of a coolant property (namely: core inlet temperature or boron concentration in a NPP, or tracer concentration in a test facility). It can be easily quantified by the “mixing scalar” (see above).
Qualification
The “qualification” or “assessment” process, as herein conceived, involves both verification and validation (see below).
Sometimes the terms “qualification” and “assessment” are used as synonyms of “validation”.
The following definition of validation can be found in Ref. [14]: “Determination of
adequacy of the conceptual model to provide an acceptable level of agreement for the domain of intended application.”
Validation
The validation process aims at answering the following questions: is the code able to simulate and reproduce the real behaviour? Does it solve the proper equations and use the proper models?
The validation involves comparison against experimental data.
The following definition of validation can be found in Ref. [14]: “The process of
determining the degree to which a model is an accurate representation of the real world from the perspective of the intended uses of the model.”
According to another effective definition, validation means to check that a code “solves the right equations” (see analogous definition for “verification”).
Verification
The verification process aims at answering the following question: are the equations, which describe the real phenomena, correctly implemented in the code? The verification involves the debugging of the code.
The following definition of validation can be found in Ref. [14]: “The process of
determining that a model implementation accurately represents the developer's conceptual description of the model and the solution to the model.”
According to another effective definition, validation means to check that a code “solves the equations right” (see analogous definition for “validation”).
2. STATE-OF-THE-ART IN THE APPLICATION OF CFD CODES
TO NRS PROBLEMS
2.1. General remarks
An exhaustive description of the state-of-the-art in the application of CFD codes to nuclear reactor safety (NRS) problems has recently been produced by the three “Writing Groups on CFD” already mentioned in Section 1.2. Those groups of experts were created by the CSNI in 2002, and have periodically met (twice per year) with the aims of providing BPGs (WG1), evaluating the existing CFD assessment database and related limitations (WG2), and exploring the possibilities of extension to two-phase flows (WG3). They have met until the end of 2006, 2007 and 2008 respectively, and the result of their work consists of three reports (Ref. [5], [6] and [15])1.
Moreover, several experimental campaigns and code development and assessment activities have been carried out in the recent years, both in international and national frameworks, as well as international workshops and conferences devoted to the CFD application in the nuclear field.
This Chapter includes information from the aforementioned CSNI reports (in particular the first two, since two-phase flow is not addressed in this document), as well as from the surveyed literature. Furthermore, the main achievements from the mentioned research activities and international events are briefly summarized.
2.2. Identification of NRS issues requiring CFD
An important outcome of the work done by one of the CSNI Writing Groups on CFD was a sort of classification of a number of NRS problems identified as needing the support of CFD. Such problems are indicated in Table 1 (extracted from Ref. [6]), along with the following information:
- to which part of the nuclear system they are related (reactor core, primary/secondary circuit, containment);
- whether they are relevant to normal operation, DBA or BDBA; - whether they involve single-phase or two-phase flow (or both).
Information on the current modelling capabilities and limitations and on the availability of experimental data for validation was gathered and reported for each of the above problems in Ref. [6].
1
The Author of the present work participated in the meetings of all the three groups since 2004, as a representative of the University of Pisa.
Table 1 – NRS issues needing CFD (from Ref. [6]) NRS problem System classification Incident classification Single- or multi-phase
1 Erosion, corrosion and deposition
Core, primary and secondary circuits
Operational Single/Multi
2 Core instability in BWRs Core Operational Multi 3 Transition boiling in BWR/determination of
MCPR Core Operational Multi
4 Recriticality in BWRs Core BDBA Multi
5 Reflooding Core DBA Multi
6 Lower plenum debris coolability/melt
distribution Core BDBA Multi
7 Boron dilution Primary circuit DBA Single 8 Mixing: stratification/hot-leg heterogeneities Primary circuit Operational Single/Multi
9
Heterogeneous flow distribution (e.g. in SG inlet plenum causing vibrations, HDR experiments, etc.)
Primary circuit Operational Single
10 BWR/ABWR lower plenum flow Primary circuit Operational Single/Multi 11 Waterhammer condensation Primary circuit Operational Multi 12 PTS (pressurised thermal shock) Primary circuit DBA Single/Multi 13 Pipe break – in-vessel mechanical load Primary circuit DBA Multi 14 Induced break Primary circuit DBA Single 15 Thermal fatigue (e.g. T-junction) Primary circuit Operational Single 16 Hydrogen distribution Containment BDBA Single/Multi 17 Chemical reactions/combustion/detonation Containment BDBA Single/Multi 18 Aerosol deposition/atmospheric transport
(source term) Containment BDBA Multi 19 Direct-contact condensation Containment/ Primary circuit DBA Multi 20 Bubble dynamics in suppression pools Containment DBA Multi 21 Behaviour of gas/liquid surfaces Containment/
Primary circuit Operational Multi 22 Special considerations for advanced
(including Gas-Cooled) reactors
Containment/
Primary circuit DBA/BDBA Single/Multi
DBA–Design Basis Accident; BDBA–Beyond Design Basis Accident; MCPR–Minimum Critical Power Ratio
2.3. State-of-the-art in CFD quality assurance
The application of numerical analysis tools to problems connected to nuclear technology should be performed so as to reduce the related uncertainties and inaccuracies as far as possible, to collect all the necessary information to assess the degree of reliability of the results, and to optimize the exploitation of the available computational resources. This is what, in other terms, can be referred to as the “quality assurance” of the analyses.
An efficient means to implement a quality-oriented approach in the use of codes consists in providing the user with written guidance on the “best practice” to follow when addressing given problems, where the “best practice” is the synthesis of all the experience achieved by the most advanced users on those problems and of the common knowledge about capabilities and limitations of the tools.
2.3.1. Historical remarks
The idea of providing best practice guidelines (BPG) for the application of CFD to nuclear reactor problems is rather recent. This reflects the fact that only recently (say in the past 10-15 years) the use of CFD in industrial applications has become so widespread, owing to the dramatic increase in the computing power. BPGs for CFD use in the non-nuclear industry have appeared first, such as:
- BPGs for marine applications of CFD (MARNET-CFD, Ref. [16]);
- ERCOFTAC best practice guidelines for the application of CFD (Ref. [17]); - EU 5th Framework Programme “QNET-CFD network” best practice advices
(www.qnet-cfd.net).
In 2002, the “BPGs for the CFD Code Validation for Reactor-Safety Applications” were produced as the first deliverable of the ECORA Project (see Section 2.4.2.3, and Ref. [18]): these are the first official guidelines oriented to nuclear applications, and represent thus a milestone, even though they are quite general and do not address specific problems in a detailed way.
The need of establishing BPGs was then recognized by the CSNI, which assigned the task of producing a new document to one of the above mentioned Writing Groups. A panel composed by 15-20 experts of CFD and nuclear reactor technology have thus met twice a year for three years and has finally come out with the “Best Practice Guidelines for the use of CFD in Nuclear Reactor Safety Applications” (Ref. [5]), which represent a further milestone in the process of quality assurance establishment.
Again, also the latter document is incomplete and not exhaustive. It provides useful guidance for a range of single phase applications to a relatively general level of detail; however, a deeper level of specificity is envisaged for each application, but not covered by the document, which is thus intended as the preliminary part of a wider set of (future) guidelines addressing thoroughly many specific problems. A brief description of the CSNI BPGs is provided in the following.
2.3.2. The CSNI BPGs for CFD application to nuclear reactor problems
The topics covered by the CSNI BPGs are reported in the list below, which also indicates the structure of the BPGs report.
1. Problem definition:
a. isolation of the problem;
b. phenomena identification and ranking table (PIRT); c. considerations on special phenomena.
2. Selection of appropriate simulation tool: a. classic thermal-hydraulic system code; b. component code (porous CFD); c. CFD code;
d. potential complementary approaches (e.g. CFD-1D coupling). 3. User selection of physical models:
a. guidelines for turbulence modelling in NRS applications; b. buoyancy model;
c. heat transfer;
d. free surface modelling; e. fluid-structure Interaction. 4. User control of the numerical model:
a. transient or steady model; b. grid requirements;
c. discretization schemes; d. convergence control; e. free surface consideration. 5. Assessment strategy:
a. demonstration of capabilities; b. interpretation of results.
6. Verification of the calculation and numerical model: a. error hierarchy;
b. round-off errors;
c. spatial discretization errors; d. time discretization errors; e. software and user errors. 7. Validation of results:
a. validation methodology; b. target variable and metrics; c. treatment of uncertainties. 8. Documentation.
A detailed discussion of the above topics is not presented here. However it is worth placing stress on the fact that each single step of the analysis, from the definition of the problem through the meshing, the simulation set-up and the result post-processing and comparison to the final documentation, is identified and considered analytically.
In particular, a special effort is required to assess the errors affecting the results, which implies that a number of sensitivity analyses have to be performed. This is clearly that aspect which makes the systematic application of the BPGs so difficult, since the computational expense to be allocated can easily grow by one order of magnitude or more.
Obviously, this is not to be regarded as a weak point of the BPGs, but rather as a limitation that is embedded in the state-of-the-art methods, tools and resources, and that will hopefully be removed soon by the progress in technology.
A stated above, what is still missing from the BPGs is a set of guidelines devoted to each specific type of problems of those identified as relevant to the reactor safety and as requiring the CFD application. For example, general guidance is given on mesh generation, i.e. on common strategies to achieve high-quality grids and thus reduce the errors associated with spatial discretization as far as possible, but no detailed discussion is provided yet on the specific meshing problems to be faced when dealing with a RPV lower plenum, or a fuel assembly spacer, or a pump, etc. The main part of this dissertation (Chapters 4 and 5) deals particularly with one of those types of nuclear reactor problems (i.e. the in-vessel flow investigation) and
provides guidance on how to conduct the analysis. For this reason, it can be a candidate to be a first integration to the CSNI BPGs.
2.3.3. Concluding remarks on CFD quality assurance
As explained above, a systematic application of the BPGs usually implies the execution of a large number of calculations for each single problem addressed, which normally results to be prohibitive for most users. Therefore, in most cases only a partial application of the BPGs is possible. For example, grid sensitivity studies are often missing in published works and demonstrations of the achievement of grid-independence of the results are very rare.
Nevertheless, the efforts to follow this quality-oriented approach as far as allowed by the available resources appear to be rapidly growing, as testified by the increasing amount of references to the BPGs in published works on CFD analysis of nuclear reactor problems. In other words, the idea that demonstrating the quality of the performed CFD analysis is an essential step of the analysis itself is becoming more and more widely accepted, which was exactly the intention of the BPGs Authors.
Two international workshops have already been organized by the CSNI Writing Groups on CFD2, under the sponsorship of the OECD/NEA and of the IAEA, with the purpose of collecting and exchanging information on the most recent advancements in the development, validation and application of CFD methods for nuclear reactor problems. The participants had been invited to follow the BPGs as far as possible, and the submitted papers were evaluated, among various criteria, also on the basis of the efforts made in that sense. Noticeable improvements in the participants’ attitude to quality assurance were noticed from the first workshop to the second one.
It is also worth recalling the IAEA/NEA Technical Meeting on the “Use of CFD codes for safety analysis of reactor systems”, which was hosted by the University of Pisa in 2002, and which provided a comprehensive view of the current state-of-the-art (see Ref. [19]).
The recommendation to establish BPGs for the application of CFD codes to nuclear reactor safety problems was one of the main outcomes of the meeting.
2
1) “CFD4NRS: Benchmarking of CFD Codes for Application to Nuclear Reactor Safety”, Garching, Germany, 5-7 September 2006. 2) “XCFD4NRS: Experiments and CFD Code Applications to Nuclear Reactor Safety”, Grenoble, France, 10-12 September 2008. The Author was a member of the Scientific Committees of both workshops.
2.4. Review of existing CFD code assessment database related
to IVF investigation
2.4.1. Experimental database
Several experimental facilities have been realized by industries and research institutions to investigate the IVF phenomena and provide reference data for CFD code validation. A brief review of the most relevant ones is reported hereafter. 2.4.1.1. ROCOM facility
The Rossendorf Coolant Mixing (ROCOM) test facility was constructed by FZD in 1998. It is a 1:5 scaled model of a German PWR KONVOI; it includes a Plexiglas RPV model and four loos with fully controllable coolant pumps (Figure 1). The geometry of RPV internal is accurately reproduced up to the core support plate, while the core region and the upper plenum are represented in a simplified way. Salt tracer is used to simulate the presence of slugs of deborated or overcooled water; its space and time distribution inside the RPV is obtained via electrical conductivity measurements (by the so-called “wire-mesh sensors”) and proper calibration procedures. Moreover, other additives (such as glycol or alcohol) are used to alter the fluid density for the investigation of buoyancy effects.
In addition to salt concentration measurements, also laser Doppler anemometry (LDA) is also used in some tests for velocity measurement in the downcomer.
(a) (b)
Figure 1 – ROCOM facility: a) sketch of the facility; b) Plexiglas RPV model
Many experiments have been and are being conducted at ROCOM facility, reproducing a wide range of loop operation configurations and of fluid properties perturbations. Normally, each experiment consists of multiple repetitions of the same tests in the same conditions, which allow quantifying the measurement uncertainties via statistical processing and defining confidence intervals for comparison with code simulation results.
Measured data for some tests are available at the University of Pisa and have been used by the Author for CFD code validation purposes (Section A.1).
ROCOM experiments have been used for code validation also in the frame of FLOMIX-R Project (see Section 2.4.2.4).
Many published works exist which deal with ROCOM experiments and related CFD simulations (e.g. Refs. [12] and from [20] to [32]).
2.4.1.2. Gidropress mixing facility
The Gidropress mixing facility, located in Podolsk (Moscow region, Russia), reproduces a VVER-1000 reactor at a 1:5 scale.
In its current configuration (Figure 2-a) it includes a metal RPV and four independent loops, and the measurement system is based on the use of salt tracer (and other additives for altering the slug density) and electrical conductivity sensors. 60% of the core coolant channels are equipped with conductivity probes, while no concentration measurement is made in the downcomer. Local probes are installed also at each inlet and outlet nozzle. Loop flowrates are measured, while no measurement is made about the in-vessel velocity distribution.
The facility has been operated in the frame of TACIS Project R2.02/02 mentioned in Section 1.2 for the conduction of ten mixing experiments (see Ref. [33]) which have then been used for CFD and system code validation (see, for instance, Section A.3). Several repetitions were made of each experiment in order to provide statistical information on measurement uncertainties.
(a) (b)
As in ROCOM, the RPV internals up to the core bottom are accurately reproduced (apart from some minor simplifications), while the core region is occupied only by the conductivity probes supporting structures.
Although the facility is not as sophisticated as ROCOM, it produced a valuable experimental database for code assessment.
In the past, the same facility used to have a different loop configuration, which is illustrated in Figure 2-b. Measured data from experiments conducted in that facility were used for code validation in the frame of FLOMIX-R Project (Section 2.4.2.4, and Ref. [34]).
2.4.1.3. Vattenfall mixing facility
The Vattenfall mixing facility is a 1:5 scaled model of a 3-loop Westinghouse PWR. The RPV is made of acrylic glass (except the upper part). All geometrical details which affect the in-vessel flow distribution and mixing are accounted for. Two of the four loops are idle and allow for inverse flows. Salt is used as a tracer to simulate deborated water; electrical conductivity measurements are made at the inlet of 181 coolant channels. Alcohol is used for water density adjustment. Further information can be found in Refs. [24] and [35].
As in the ROCOM facility, LDA techniques have been adopted in this facility for flow velocity measurements.
Also Vattenfall mixing experiments were utilized for the CFD code validation activities carried out within the FLOMIX-R Project (Section 2.4.2.4). Obviously, only slug mixing experiments featuring a pump start-up can be conducted on this facility.
(a) (b)
2.4.1.4. Fortum PTS test facility
The Fortum mixing facility was constructed in 1983 to study thermal mixing phenomena occurring during safety cold injection during scenarios relevant to PTS. The facility is a 1:2.56 scaled model of the Loviisa VVER-440 reactor. The RPV model, made of acrylic glass, reproduces only one half of the real RPV. Three of the six cold legs are partially included. The measured quantity is the fluid temperature (ranging between 10 °C and 75 °C). A salt is added to enhance the density effects. More of 60 thermocouples are installed in the downcomer and in the cold leg where the cold injection is made.
Measured data from some selected tests were used for code validation purposes in the frame of the FLOMIX-R Project (Section 2.4.2.4); further information can be found in Ref. [21]. Moreover, CFD investigations of Fortum PTS experiments are presented in Ref. [36].
Figure 4 – Fortum mixing test facility (Ref. [21])
2.4.1.5. University of Maryland 2x4 loop facility
The University of Maryland, College Park 2x4 Thermal-Hydraulic Loop Facility (Figure 5) is a scaled down model of the Three Mile Island Unit-2 Babcock & Wilcox PWR (Refs. [36] and [38]).
(a) (b)
Figure 5 – University of Maryland 2x4 loop facility: a) overall sketch; b) inside view of the RPV, showing thermocouple locations
Several mixing experiments were performed on this installation within the OECD/CSNI International Standard Problem (ISP) No. 43 (see Section 2.4.2.1). The following experiments were executed, where the presence of a deborated slug is simulated by cold water:
A. 16 “front mixing” redundant tests (infinite slug of cold water entering the RPV);
B. 6 “slug mixing” redundant tests (finite slug of cold water entering the RPV). Fluid temperature in DC and LP was measured in about 300 locations by thermocouples. Pressure difference between LP and hot led was measured as well. Both buoyancy-driven and momentum-driven flow patterns were observed. Further information on the experimental investigation carried out at this facility is given in Section 3.5.2.
2.4.1.6. UPTF
The UPTF facility was constructed by Siemens/KWU in Germany in the eighties; it is a full-scale replica of the primary system of a 4-loop Westinghouse PWR (see three-dimensional view in Figure 6). It was designed to perform separate-effect investigations on multi-dimensional thermal hydraulic phenomena in the upper plenum, across the upper core tie plate, in the downcomer and the loops, as well as in the surge line and the pressurizer during various simulated accidents (Ref. [39]).
The “Tram-C3” test series dealt with boron dilution events which may take place during postulated LOCA scenarios. The mixing of hot and cold water in the RPV was investigated, as well as thermal stratification phenomena after the restart of natural circulation. The measured data have recently been utilized in the frame of the validation of the French CFD code Trio_U (Ref. [40]).
Figure 6 – Sketch of UPTF facility (Ref. [39]) 2.4.1.7. Kozloduy NPP VVER-1000
During the plant-commissioning phase at the Kozloduy NPP Unit 6 (a VVER-100/320 reactor), several experiments were conducted by Bulgarian and Russian engineers. Measured data from some of those tests, which simulated MCP start-up and main steam line break transients, have been adopted for system and CFD code validation, within the OECD Benchmarks V1000CT-1 and V1000CT-23. 2.4.1.8. Paks NPP VVER-440
Useful data for code validation came also from the commissioning tests of Paks NPP (Hungary) performed in the years 1987-1989. The tests addressed the mixing among coolant loop flows in the downcomer and up to the core inlet in forced flow conditions. The goal of the tests was investigation of potential loop temperature asymmetry that might occur and significantly affect power distribution in the core. Also those data were utilized in the frame of the FLOMIX-R Project (Section 2.4.2.4).
3
Information on those Benchmarks can be found on this website: http://www.nea.fr/html/science/egrsltb/v1000ct/index.html.
2.4.2. International activities and events on CFD code assessment
2.4.2.1. OECD-NRC ISP-43
The above mentioned ISP-43 (“Rapid Boron-dilution Transient Tests for Code Verification”) was organized by the OECD/NEA/CSNI and sponsored by the United States Nuclear Regulatory Commission (USNRC) with the purpose of demonstrating the capability of CFD codes to predict boron mixing in the downcomer of a reactor vessel. The ISP-43 was based on experiments carried out at the University of Maryland 2x4 loop facility (see Section 2.4.1.5).
Several “blind” CFD simulations were performed by the participants to the ISP-43, using specified boundary conditions. Later on, open recalculations followed. See Ref. [41] for further information on the CFD simulations.
The main achievement of the ISP-43 was that CFD codes have reached a sufficient degree of maturity for being applied to the investigation of single-phase mixing problems in PWRs, in particular those related to boron dilution events, from the point of view of both the model development and the availability of computing power. Nevertheless, further efforts are needed for improving the accuracy of the results, which is mainly affected by the turbulence modelling and by the mesh refinement.
2.4.2.2. OECD Benchmark V1000CT-2
A short description of this Benchmark has already been given in Section 1.2. Measured data from Kozloduy VVER-1000 NPP were used for code validation (Section 2.4.1.7).
Information on the code validation activity performed by the Author in this framework is reported in Section A.2, and interesting information on the results obtained by other researchers can be found in Ref. [42].
The final re-elaboration of the Benchmark results is still in progress; therefore no reference is available yet to published papers or reports which summarize the main achievements.
However, it is worth mentioning here that this activity placed stress on the “downcomer flow rotation” issue in VVER-1000 RPV, and on the difficulties to predict such phenomenon with current CFD methods (see also Section 4.2.4.2). 2.4.2.3. ECORA Project
The ECORA Project (“Evaluation of Computational Fluid Dynamics Methods for Reactor Safety Analysis”) was part of the EURATOM 5th FP. It started in October 2001 for a 36-month duration, and was led by GRS-Garching (Germany). See Refs. [43] to [46].
The ECORA project was aimed at evaluating the capabilities of CFD codes for the simulation of the primary system and containment of nuclear reactors, in particular of those thermal-fluid-dynamic problems which are inherently multi-dimensional and cannot be accurately simulated by traditional one-dimensional thermal-hydraulics system codes.
One of the main topics addressed in the project is the establishment of standard quality criteria, on a European basis, for the application of CFD to problems related to nuclear reactor safety; as already mentioned in Section 2.3.1, a major outcome
of this was a document containing BPGs for the use of CFD for nuclear reactor safety applications (Ref. [18]), which has then constituted a basis for the development of upgraded BPGs in the OECD/CSNI framework (Ref. [5]).
Another topic addressed within ECORA was the evaluation of the present state of the CFD code assessment process regarding the primary loop flow. The existing experimental databases were reviewed, as well as the CFD analyses addressing the primary circuit thermal-hydraulics (e.g. reactor core, PTS, boron dilution, asymmetric loop operation etc.) As a result, the main limitations and capabilities of available CFD modelling approaches were pointed out. The evaluation was partly extended also to two-phase flow and heat transfer.
Moreover, several problems typical of nuclear systems were addressed through CFD simulations, model development and validation, in order to demonstrate current capabilities.
In particular, the following CFD investigations were performed (Ref. [45]). Verification calculations:
o oscillating manometer; o liquid sloshing;
Validation calculations:
o jet impingement with heat transfer; o water jet into air (no heat transfer); o water jet on a free surface;
o contact condensation on stratified steam/water flow; Demonstration calculations:
o UPTF Test 1 (single-phase mixing in cold leg and downcomer); o UPTF Test 2 (steam/water phenomena in cold leg and downcomer
during cold safety injection with RPV filled with steam).
Eventually, the ECORA Project gave a valuable contribution to the improvement of quality in CFD calculations, by:
establishing BPG;
identifying capabilities and limitations in current CFD methods for addressing primary system and containment flows;
identifying needs for extension in the experimental databases for code verification and validation;
identifying needs for improvements and development in CFD codes; developing and validating improved turbulence and two-phase flow models
for the simulation of PTS phenomena in PWR. 2.4.2.4. FLOMIX-R Project
Like ECORA, also the FLOMIX-R Project (“Fluid Mixing and Flow Distribution in the Primary Circuit “) was part of the 5th FP. It started in October 2001 for a 36-month duration, and was led by FZR (Germany). See Refs. [20], [21] and [23].
![Table 1 – NRS issues needing CFD (from Ref. [6]) NRS problem System classification Incident classification Single- or multi-phase](https://thumb-eu.123doks.com/thumbv2/123dokorg/7351015.93130/22.723.90.631.113.602/table-issues-needing-problem-classification-incident-classification-single.webp)


![Figure 18 – Spacer between RPV and barrel in VVER-1000 reactor: a) geometry (Ref. [8]); b) 3D solid model prior to meshing (Section A.2)](https://thumb-eu.123doks.com/thumbv2/123dokorg/7351015.93130/82.723.103.632.99.315/figure-spacer-barrel-vver-reactor-geometry-meshing-section.webp)
