POLITECNICO DI MILANO
Scuola di Ingegneria dei Sistemi
Polo territoriale di Como
Master of Science in
Management, Economics, and Industrial Engineering
A model for the supply chain representation
and financial assessment
Supervisor:
Assistant supervisor:
Prof. Alessandro PEREGO
Dr. Paolo CATTI
Master graduation thesis by:
Luca Mattia GELSOMINO
Student Id: 759936
Academic Year: 2011/2012
Contents
Executive Summary 1
Sommario 11
1 Literature Review 21
1.1 Supply Chain Definition . . . 22
1.2 Supply Chain Management . . . 24
1.2.1 Barriers to Supply Chain Management implementation . . . 25
1.2.2 Trends in Supply Chain Management . . . 26
1.3 Supply Chain Representation . . . 27
1.3.1 A quantitative approach to SCR literature contributions . . . 28
1.3.2 A qualitative analysis of most relevant contributions . . . 30
1.4 Supply Chain Finance . . . 35
1.4.1 Players in the supply chain finance framework . . . 35
1.4.2 General benefits of a Supply Chain Finance program . . . 36
1.4.3 Typical solutions of SCF . . . 36
1.4.4 Expected future development of supply chain finance . . . 37
1.5 The financial performance . . . 38
1.5.1 Utility theory . . . 38
1.5.2 Graphical means . . . 38
1.5.3 Balanced scorecard . . . 40
1.5.4 Common measures of financial performance . . . 40
1.6 Financial Assessment of a Supply Chain . . . 41
1.6.1 Supply chain performance measurement systems . . . 41
1.6.2 Other relevant contributions . . . 44
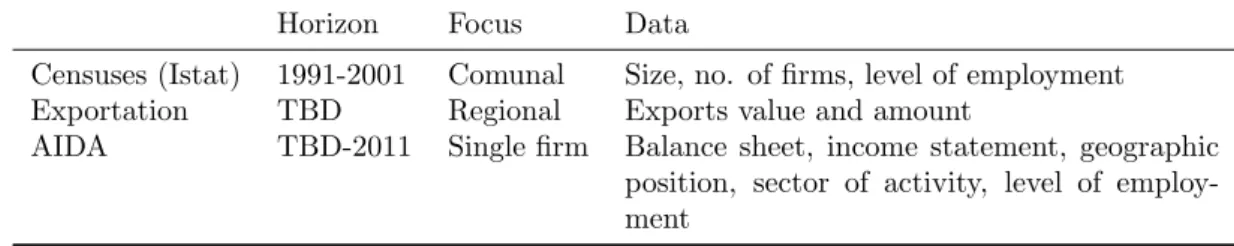
1.7 A literature drill-down: the mechanical indusrty . . . 45
1.7.1 Definition of mechanical industry in Italy . . . 45
1.7.2 The importance of the mechanical industry in Italy . . . 47
1.8 The mechanical industry object of this work . . . 47
1.8.1 Manufacture of tubes . . . 47
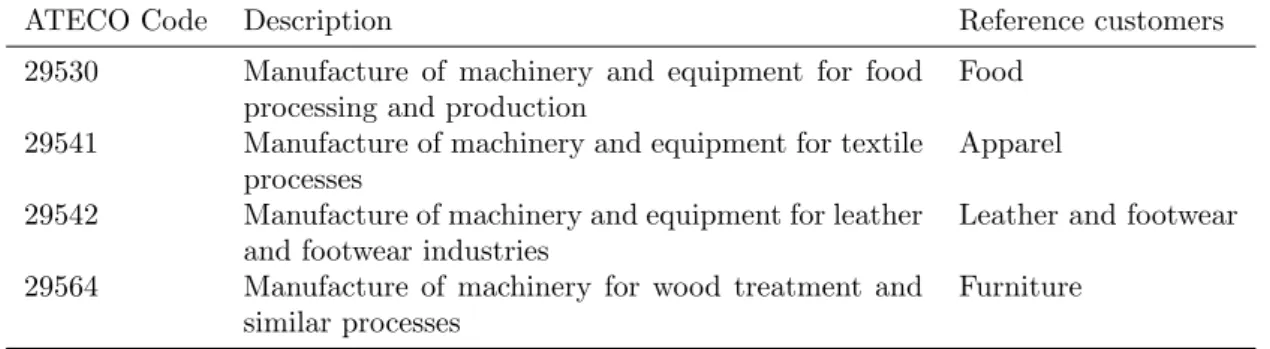
1.8.2 Manufacture of machinery for the food industry . . . 49
2 Objectives and Methodology 53 2.1 Objectives . . . 54
2.2 Methodology . . . 55
2.2.1 Literature review . . . 55
2.2.2 Model development . . . 56
2.2.3 Model application: quantitative data . . . 56
2.2.4 Data Preparation . . . 57
2.2.5 Data Exploration . . . 59
2.2.6 Model application: other relevant quantitative data sources . . . 60
2.2.7 Model application: qualitative data . . . 62
3 Model 65
3.1 Introduction to the model . . . 66
3.2 Definition of supply chain . . . 67
3.2.1 Motivation for a different definition . . . 67
3.3 Model ontology . . . 68
3.4 Model description . . . 70
3.4.1 Part 1: Supply chain flowchart . . . 70
Guidelines for the development of a Supply Chain Flowchart . . . 71
A note on the value of the arcs . . . 73
An example . . . 73
Benefits, innovative aspects, and limitations . . . 74
3.4.2 Part 2: the node exchanges matrix . . . 74
Input-output theory . . . 74
Node exchanges and production coefficients matrices . . . 76
An example . . . 77
Model output motivation . . . 77
3.4.3 Part 3: the financial assessment . . . 78
The financial assessment of a supply chain . . . 78
Parameters estimation . . . 79
Figures of merit . . . 81
Financial assessment scatter plots . . . 82
Evaluation of non-canonical financing solutions . . . 83
An example . . . 86
Considerations on the financial assessment . . . 88
3.5 Model prototype . . . 88
3.5.1 Purpose of the prototype . . . 89
3.5.2 Limitations . . . 89
3.5.3 Prototype structure . . . 89
3.5.4 Snapshots . . . 91
4 Model application and testing 93 4.1 The mechanical industry in Italy and its Supply Chain . . . 94
4.2 Definition of the part of mechanical industry object of this work . . . 95
4.3 Manufacture of Tubes in Italy . . . 97
4.3.1 Raw Material for tube manufacture in Italy . . . 98
4.3.2 Screws and fasteners . . . 98
4.3.3 Distribution and service center . . . 98
4.4 Manufacture of machinery for the food industry . . . 100
4.4.1 Engines, turbines, pumps and compressors . . . 100
4.4.2 Taps and valves . . . 101
4.4.3 Bearings, gears, gearing and driving elements . . . 101
4.4.4 General mechanical engineering and tools . . . 101
4.4.5 Manufacture of locks and hinges . . . 102
4.5 Model application . . . 102
4.5.1 Two important notes . . . 102
4.5.2 Model output part 1 . . . 102
4.5.3 Model output part 2 . . . 106
4.5.4 Model output part 3 . . . 107
5 Conclusions 117 5.1 Answers to the research questions . . . 118
5.2 Consideration on the model testing . . . 120
5.3 Generalization . . . 120
5.4 Managerial implications . . . 121
A Qualitative data: the case studies 125 B Attributes included in D 131 C Geographic maps of industry concentration 137 D SQL code for prototype database 151
List of Figures
1 The research framework. . . 2
2 The recursive steps of the methodology followed in the development of this work. . . 3
3 The supply chain flowchart for the manufacture of tube supply chain. . . 4
4 The financial assessment matrix and the two scatter plots from which it derives. . . 6
5 Radar charts for the tube manufacture supply chain. . . 7
6 Il quadro di riferimento di questa tesi. . . 12
7 I passi metodologici ricorsivi utilizzati nello sviluppo del modello. . . 13
8 Il Supply Chain Flowchart per la supply chain della fabbricazione di tubi. . . 14
9 Il piano cartesiano per la stima dello stato di salute e i due piani da cui deriva. . . 16
10 I grafici radar per la supply chain della fabbricazione di tubi. . . 17
1.1 The three supply chains defined by Mentzer et al. [2001]. . . 23
1.2 A representation of the mechanical supply chain. . . 23
1.3 SCM Framework . . . 24
1.4 A general framework for SSCM. . . 26
1.5 Main areas providing contributes to the SCR literature. . . 30
1.6 Literature considered by SC modeling typology (% on total). . . 30
1.7 Chatfield’s Visual Supply Chain Editor. . . 31
1.8 Cope and Fayez’s tool methodology. . . 32
1.9 Supply Chain Guru screenshot. . . 34
1.10 A representation of a supply chain through BPMN based on the SCOR methodology. . . 34
1.11 Graphical means to measure the performance of a system. . . 39
1.12 The classical representation of a general SCOR model. . . 42
1.13 An example of metrics hierarchical breakdown. . . 43
1.14 Main materials of tubes considered in this work. . . 48
1.15 The Mannesmann process for tube making. . . 49
1.16 Example of tube fittings (specifically: commercial cast-steel flanged fittings). . . 50
1.17 The ten main categories of machinery for the food industry. . . 51
1.18 An example of part-related solid food separation: skin removal from fish fillet. . . 52
2.1 The research framework. . . 54
2.2 The recursive steps of the methodology followed in the development of this work. . . 55
2.3 Work reference per contribution source. . . 56
2.4 An example of histograms and normal probability plot . . . 58
2.5 The outliers detection process . . . 59
2.6 Difference in the query procedure to download data for the different groups. . . 60
2.7 Equity distribution for data based on ATECO codes and Bilanci d’Acciaio names list. . . 61
2.8 Representation of the inconsistency problem among the two main datasets. . . 61
2.9 The representation of the equations system for arc estimation, in case of two consecutive nodes. . . 64
3.1 IDEF0 of the model. . . 66
3.2 A graphical representation of the motivation for a different definition of supply chain. . . 67
3.3 Model ontology. . . 69
3.4 IDEF0 of model part 1. . . 70
3.5 The basic components of a supply chain flowchart. . . 70
3.6 An example of rule 3 violation. . . 72
3.7 A generic representation of two consecutive nodes. . . 73
3.8 The supply chain flowchart for the example proposed. . . 74
3.9 IDEF0 of model part 2. . . 75
3.10 Coefficients aij for the example supply chain. . . 78
3.11 IDEF0 of model part 3. . . 78
3.12 The financial assessment model theoretical definition. . . 79
3.13 Example of radars charts, output of model part 3. . . 81
3.14 Example of scatter plots. . . 82
3.15 Example of scatter plots with highlighted zone of interest. . . 83
3.16 The matrices overlap process. . . 84
3.17 Radar charts for the example supply chain. . . 87
3.18 The final scatter plot for the example supply chain. . . 88
3.19 The steps undertook to develop the prototype. . . 89
3.20 The ER model. . . 90
3.21 Snapshots of the prototype interfaces. . . 92
4.1 The triangular metal-mechanical supply chain. . . 94
4.2 Classification of tube manufacture by Brasili et al. [2011]. . . 97
4.3 The flowchart for the two supply chains object of this work (values in billion ofe). . . 104
4.4 The supply chain flowchart for the manufacture tube supply chain (blne). . . 105
4.5 The supply chain flowchart for the machinery for the food industry supply chain (blne). 105 4.6 aij coefficients for the supply chins object of this work. . . 107
4.7 Radar charts for the tube manufacture supply chain. . . 109
4.8 The financial assessment matrix and the two scatter plots from which it derives. . . 110
4.9 Radar charts for the machinery for the food industry supply chain. . . 114
4.10 The financial assessment matrix and the two scatter plots from which it derives. . . 115
5.1 Radar charts for the tube manufacture supply chain. . . 119
5.2 aij coefficients for the manufacture of tube supply chain. . . 119
5.3 A first attempt of the Supply Chain Flowchart compared to the final version (part of). . . 121
C.1 An example of map construction. . . 138
C.2 Map for reference group 1. . . 139
C.3 Map for reference group 2. . . 140
C.4 Map for reference group 3. . . 141
C.5 Map for reference group 4. . . 142
C.6 Map for reference group 5. . . 143
C.7 Map for reference group 6. . . 144
C.8 Map for reference group 7. . . 145
C.9 Map for reference group 8. . . 146
C.10 Map for reference group 9. . . 147
C.11 Map for reference group 10. . . 148
List of Tables
1 Node exchanges matrix for the supply chain object of this work (blne). . . 5
2 Production coefficients matrix for the supply chain object of this work. . . 5
3 Parameters for the financial assessment of a supply chain, and relative measures. . . 6
4 The nine identified clusters. . . 8
5 Legend for tables and figures in this executive summary. . . 10
6 La matrice node exchanges per la supply chain oggetto di questa tesi (mlde). . . 15
7 La matrice production coefficients per la supply chain oggetto di questa tesi. . . 15
8 Parametri e misure per la stima dello stato di salute di una supply chain. . . 16
9 I nove cluster identificati. . . 19
10 Legenda per le tabelle e figure di questo sommario. . . 20
1.1 Classification of supply chain representation models. . . 28
1.2 Variables used for classify SCR literature contributions. . . 28
1.3 Classification of literature contribution on SCR with relevance respect to this work. . . . 29
1.4 Example of financial prospective of a Balanced Scorecard. . . 40
1.5 Main indicator of financial performance. . . 40
1.6 Levels of SCOR model. . . 42
1.7 Main supply chain measures related to financial performance in SCOR model. . . 43
1.8 Measures used in financial perspective of supply chain-focused balanced scorecard. . . 44
1.9 Chain-level metrics in Lanier et al. [2010]. . . 44
1.10 Other relevant measures from academic literature. . . 45
1.11 Type of data available for analyses in the mechanical industry . . . 45
1.12 “Core” Ateco codes in the definition of the mechanical industry . . . 46
1.13 Definition of mechanical industry by ISTAT, used by Russo, Pirani, and Pratelini (2006) . 46 1.14 Definition of mechanical industry by Ferri, and Ventura (2007) . . . 46
1.15 Summary of the typology of tubes and pipes divided by raw materials and production process. . . 49
1.16 Construction materials for food storage equipments. . . 50
1.17 Summary of metals used in food equipment construction . . . 52
2.1 Outlier detection rules . . . 59
2.2 First principal components (|ωkj| > 0.1) . . . 60
2.3 Summary of the qualitative data body of knowledge . . . 62
2.4 Questionnaire for the first set of interviews . . . 62
2.5 Questionnaire for the second set of interviews . . . 63
3.1 Figures for the example supply chain. . . 73
3.2 Node exchanges matrix for the example supply chain, values in billion ofe. . . 77
3.3 Production coefficients matrix for the example supply chain. . . 77
3.4 Measures used for each parameter of the model part 3. . . 80
3.5 Dummy variables used in the model. . . 82
3.6 Cluster identification. . . 85
3.7 Logic expressions for each cluster. . . 86
3.8 Arithmetic means for radar creation. . . 86
3.9 Values used to plot the radars. . . 87
3.11 Values of the four parameters for the example supply chain. . . 88
4.1 Main output markets of the mechanical industry. . . 95
4.2 ATECO codes used in the analysis . . . 96
4.3 ATECO codes for manufacture of tubes . . . 97
4.4 Traditional and innovative manufacture of tubes . . . 98
4.5 ATECO codes of raw material for manufacture of tubes . . . 98
4.6 ATECO code for the production of screws and fasteners . . . 98
4.7 ATECO codes for the manufacture of machinery for the food industry . . . 100
4.8 ATECO codes for the production of engines, turbines, pumps, and compressors . . . 100
4.9 ATECO code for the production of taps and valves . . . 101
4.10 ATECO code for the production of bearings, gears, gearing and driving elements . . . 101
4.11 ATECO codes for the production of bearings, gears, gearing and driving elements . . . 101
4.12 ATECO codes for the production of metal structure . . . 102
4.13 IDs for supply chain nodes. . . 103
4.14 Node exchanges matrix for the supply chain object of this work (bln e). . . 106
4.15 Production coefficients matrix for the supply chain object of this work. . . 106
4.16 Values for the four parameters for the manufacture of tubes. . . 107
4.17 Arithmetic means per measure per node. . . 108
4.18 Radar axis values per measure per node. . . 108
4.19 Belonging cluster for each node of the manufacture of tube supply chain. . . 110
4.20 Values of the four parameters for the machinery for the food industry supply chain. . . . 112
4.21 Arithmetic means per measure per node. . . 113
4.22 Radar axis values per measure per node. . . 113
4.23 Belonging cluster for each node of the machinery for the food industry supply chain. . . . 115
A.1 Questionnaire for the first set of interviews . . . 125
A.2 Results of the first set of interviews . . . 127
A.3 Questionnaire for the second set of interviews . . . 128
A.4 Results of the second set of interviews. . . 129
B.1 Legend of table B.2 . . . 131
B.2 Attributes in database D . . . 136
Acknowledgments
I would like to thank the supervisor of this thesis, professor Alessandro Perego, for giving me the opportunity to carry out this thesis, as well as spend time and build experience within the Osservatori world. I would also like to thank the co-supervisor, Paolo Catti, for his time, support, and extremely valuable advices throughout the whole devel-oping process of this work.
I would also like to thank the team which I had the opportunity to work with during the model application phase: Christian Mondini and Chiara Borea.
Thus, I thank my family, for their invaluable support and encourage-ment during my entire university career: their never ending faith in me played a crucial role in this achievement; moreover, I thank my friends and classmates as well, the latter belonging to both the Bovisa and Como campuses.
Ultimately, I would like to thank Paola, for her huge support, compre-hension, and advices, especially during the developing of this thesis. I am aware that she is accountable for a great deal of the successful outcome of this work.
Abstract
Widely-accepted models for the performance assessment of a supply chain (e.g.: SCOR) fail to take into account high-level, product-centric supply chains, defined as interconnected network of nodes constituted by groups of organizations. Nevertheless, this view of a supply chain, and a consequently methodology for its financial assessment, play a paramount role in the early stage of assessment of non-canonical financing solution, such as Supply Chain Finance (SCF) programs, that often exploit, among other factors, the strength of supply chain links.
Therefore, this work has as objective the development of a model for the supply chain representation and financial assessment. The model is based on academic contribution and empirical experience, gained through the profiling of two real-world supply chains; it is divided into three parts: the first presents a formal, graphical, representation of the supply chain, the second a tabular instrument highlighting relevant information regarding exchanges among nodes, while the third provides the financial assessment of each node, relatively to the whole supply chain.
The model is connected to the evaluation of SCF solutions. In particular, from its outcome is possible to deduct information to support the supply chain-level analyses often necessary in the evaluation of the application of SCF solutions to a supply chain. Such supply chain-specific information define the likelihood that organizations in a node will be suitable for specific sets of SCF solutions, as well as the roles that they may play in an SCF framework.
Ultimately, a web-based prototype based on this model has been developed. Its purpose is to show the expected implementation of the model in a tool. It collects the required inputs, inserted by the user, process them, and provides dynamic and interactive outputs. The prototype concludes the work and highlights its benefits, that are, the possibility of formally profiling a supply chain, with the purpose of its financial assessment, and to use the results of such assessment as support to the supply chain-level analyses, often required in the evaluation of the application of SCF solutions that benefit from the exploiting of the strength of supply chain links.
Executive Summary
Introduction and objectives
The last years have witnessed the growth of different sets of non-canonical financing solution for organi-zations. One of this sets, called Supply Chain Finance (SCF), is characterized by financing solutions that provide benefits to the parties involved through the exploitation of links and relationships among supply chain players. For this reason, the availability of a formal methodology for the financial assessment of an entire supply chain becomes critical. Therefore, the purpose of this thesis is to develop a model for the performing of such financial assessment, apt to its application within the analyses required for the application of SCF solutions to a supply chain.
Objectives
The objectives of this work can be effectively summarized in three research questions. Such questions compose the research framework of this work. The research framework is also represented in figure 1. RQ 1. The financial assessment of a supply chain
What does it mean to financially assess a whole supply chain? How does this concept differs from the financial assessment of a single organization?
What are possible choices of drivers that might suit the needs for the financial assessment of a supply chain?
As showed in the literature review, the financial assessment of a supply chain is a concept that finds few academic contributions. Therefore, this question aims at developing a formal definition of financial assessment for a supply chain, providing a choice of measures and functions for the practical financial assessment of a supply chain.
RQ 2. Financial assessment and supply chain profiling
Are there more effective ways to represent a supply chain, in relation with its financial assessment?
Is there a link between the representation methodology and the effectiveness of the financial assessment of a supply chain? Can a correct representation of a supply chain be part and parcel of its financial assessment?
The supply chain profiling is a concept that finds application in many different topics, and benefit from an effective representation methodology. This question aims at inquiring if the financial assessment of a supply chain is affected by the way in which the supply chain is represented, and if a more effective way to represent it in relation with its financial assessment exists.
RQ 3. Financial assessment and supply chain finance
Are there links between the financial assessment of a supply chain and an effective application of financing solution, and in particular of non-canonical financing solution, such as solutions of Supply Chain Finance?
How the different financial performance of supply chain nodes affects the implementation of non-canonical financing solutions?
This third questions wishes to analyze the financial assessment methodology in terms of possible appli-cation of SCF solutions to a whole supply chain: possible roles for organizations within a specific node, areas of interest for particular sets of solutions, and, more in general, indications for effective implemen-tations of those solutions based on the financial characteristics of the supply chain nodes. Moreover, it wants to analyze the differences in the application of SCF solutions to a whole supply chain, respect to a mere group of organizations.
Figure 1: The research framework.
Literature review
The literature review provides the conceptual basis for this work, and consists in the critical evaluation of the most relevant academic contributions in all the topics constituting the research framework for the development of the model. Different typologies of contributions have been taken into account, namely:
Journal articles, 42% of total contributions referenced in this work; Books or book chapters, 18%;
Unpublished contributions (mainly conference proceedings and lecture notes), 16%; Technical reports, manuals, 16%;
Patents, 4%;
Other type of contributions, 4%.
On one side, the literature review has been focused on the determination of a shared definition of key concept (such as supply chain and supply chain management ). Particular importance has been given to the study of the concept and of existing solutions of supply chain finance.
On the other side, it has been focused on the understanding of the current state of the models and methodologies developed for the representation and the financial assessment of a supply chain. In particular, major contributions in the development of methodologies, tools, and prototypes for the practical representation of a supply chain, as well as the most common commercial software have been inquired, together with the current models, methodologies, and set of measures used for the assessment of the financial performance of an entire supply chain.
Ultimately, the literature review has been focused on the context to which the model has been applied and tested: the Italian mechanical industry. In particular, this last part provides an initial, more formal, understanding of the supply chain used to test the model, as well as a basis to structure the analyses of secondary sources.
Methodology
The methodology followed in this work is reported in figure 2.
Figure 2: The recursive steps of the methodology followed in the development of this work. An initial analysis of secondary sources brought to the selection of the two supply chains that have served as empirical base for the model development and application (namely, the manufacture of tubes and the manufacture of machinery for the food industry supply chains); once selected the two sub-groups, a series of ATECO1codes, representing the possible nodes of the supply chain, have been identified. These
initial steps brought the required analyses for the development of the model; such analyses can be divided into two groups:
Quantitative analyses: related to the preparation, exploration, and utilization of data downloaded from the AIDA on-line database. The queries through which the data have been downloaded are based on the ATECO code selected at the beginning of the work; later in the work it was necessary to add nodes to the supply chain that were not reliably identifiable through an ATECO code; for such node, the query has been based on the business name lists provided by Bilanci d’acciaio [2011]. In the end, a total of around 18.000 balance sheets and income statements have been analyzed, and represent the source from which the data in the model application chapter are based;
Qualitative analyses: related to the gather and analyses of secondary sources, including technical reports and interviews. In particular, the purpose of the interviews has been to gather the nec-essary information for building a reliable understanding of the supply chains object of the model applications. The body of knowledge built comprehends 29 interviews, of which 18 to practitioners, and the remaining to experts, professors, and industry associations.
The application of the model has been concurrent with its development. After a first application to the two selected supply chains, the recursive process adopted have refined progressively the model generalizing it.
Model description
The model developed is divided into three parts. The first part, called Supply Chain Flowchart, is a graphical representation of the supply chain through basic flowcharting components. The second part provides the structural matrices, called node exchanges matrix and production coefficients matrix, that summarize the structure of the exchanges among players. The third output is the financial assessment of the supply chain, and provides a series of radar charts, correlated with a scatter plot from which is possible to highlight relevant information about the supply chain nodes; this last part provides also information that can be used to assess the possibility of effectively apply non-canonical financing solution (and in particular Supply Chain Finance solutions) to the supply chain.
1ATECO is the Italian system of classification of economic activities, which high-level codes correspond to the
Supply Chain Flowchart
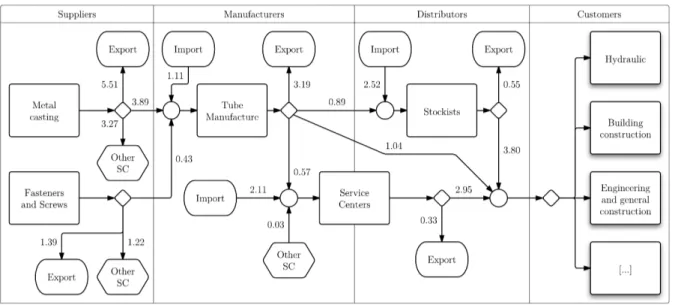
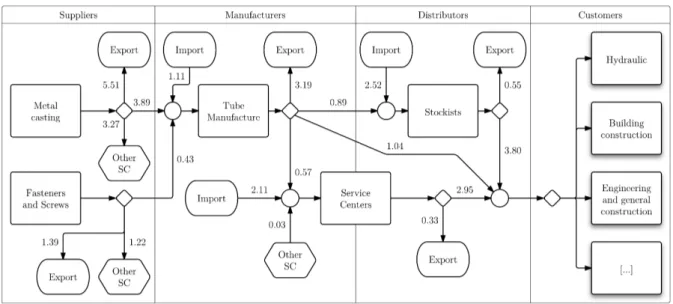
Figure 3 reports the first output of the model for the manufacture of tube supply chain.
Figure 3: The supply chain flowchart for the manufacture of tube supply chain.
Such representation concentrates relevant information about the structure of the supply chain nodes and arc. It is divided in four swim-lanes, that categorize the nodes in suppliers, manufacturers (the focal point of the representation), distributors, and customers. This model output presents innovative charac-teristics in the formality through which it defines the representation methodology, and in the orientation of the representation to the financial assessment of the supply chain. The unification of different compo-nents, traditionally not present under a single representation methodology, and its capacity of directly and indirectly affecting the financial assessment of the supply chain bring a component of innovation to the representation methodology proposed. Furthermore, the formality of the methodology (including the definition of an ontology at the base of the model) represents an innovative contribution for the representation methodologies based on a concept of supply chain composed by nodes represents groups of organizations, compared to the more common, organizational-centric, supply chain.
Structural matrices
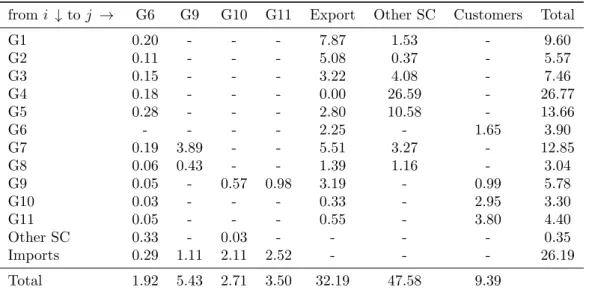
The second output of the model is represented by the node exchanges and production coefficients matrices. These two matrices summarize in a tabular form structure and value of the exchanges among supply chain nodes. The first matrix, which application to the supply chain object of this work is reported in table 1, shows the value of the exchanges among nodes (i.e.: the value of the arcs); such representation allows a quick visualization of the value and structure of exchanges between a node and every single other node, as well as between a node and the entire supply chain. Table 5 at page 10 provides the legend for the name of nodes in figure and table of this section.
The second matrix, the production coefficients matrix, is reported in table 2. Such matrix contains the production coefficients, that represents, for a generic node i, how many euro of output must flow from a generic node to i, in order for it to produce one euro of output.
The production coefficients matrix gives several indications on the structure of dependences and links among nodes in the supply chain. The values, deviation, and distribution of the coefficients allow to understand how strong supply chain links are, in terms of economic value exchanged. Moreover, the total value of each column describes the dependencies of a node from its suppliers; being the coefficients estimable also for the import row, they can be used to compare the node dependencies from national and abroad production. An uniform distribution of the coefficients, and a low total value, represents a node that relies relatively little on raw materials and more on internal transformation (cf.: G6 in table 2 and 1), while a single, high, coefficient represents a node that relies strongly on the output produced by one of its suppliers (note that this may, as may not, imply the vice versa).
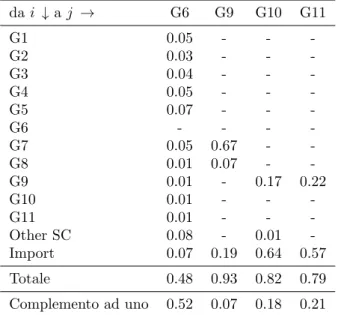
from i ↓ to j → G6 G9 G10 G11 Export Other SC Customers Total G1 0.20 - - - 7.87 1.53 - 9.60 G2 0.11 - - - 5.08 0.37 - 5.57 G3 0.15 - - - 3.22 4.08 - 7.46 G4 0.18 - - - 0.00 26.59 - 26.77 G5 0.28 - - - 2.80 10.58 - 13.66 G6 - - - - 2.25 - 1.65 3.90 G7 0.19 3.89 - - 5.51 3.27 - 12.85 G8 0.06 0.43 - - 1.39 1.16 - 3.04 G9 0.05 - 0.57 0.98 3.19 - 0.99 5.78 G10 0.03 - - - 0.33 - 2.95 3.30 G11 0.05 - - - 0.55 - 3.80 4.40 Other SC 0.33 - 0.03 - - - - 0.35 Imports 0.29 1.11 2.11 2.52 - - - 26.19 Total 1.92 5.43 2.71 3.50 32.19 47.58 9.39
Table 1: Node exchanges matrix for the supply chain object of this work (blne). from i ↓ to j → G6 G9 G10 G11 G1 0.05 - - -G2 0.03 - - -G3 0.04 - - -G4 0.05 - - -G5 0.07 - - -G6 - - - -G7 0.05 0.67 - -G8 0.01 0.07 - -G9 0.01 - 0.17 0.22 G10 0.01 - - -G11 0.01 - - -Other SC 0.08 - 0.01 -Import 0.07 0.19 0.64 0.57 Total 0.48 0.93 0.82 0.79 Ones’ complement 0.52 0.07 0.18 0.21
Table 2: Production coefficients matrix for the supply chain object of this work.
Financial Assessment of a Supply Chain
The third part of the model, the financial assessment methodology, assesses financially each node, in relation to the whole supply chain. The assessment is based on the analytic estimation of four parameters, summarized in table 3. Three measures are assigned to each parameter, for a total of twelve measures.
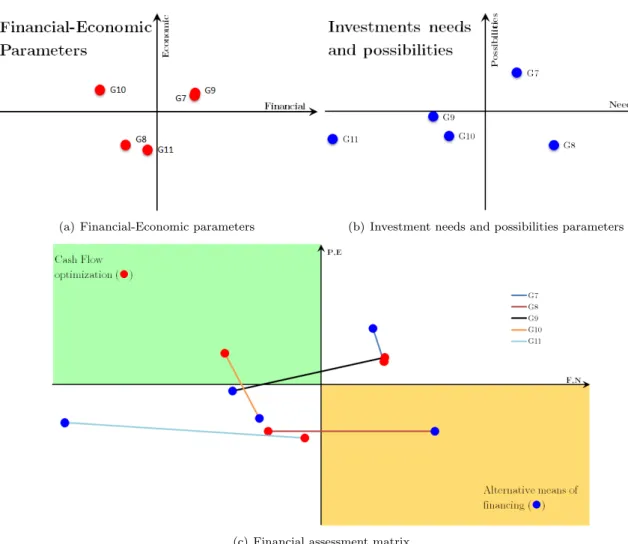
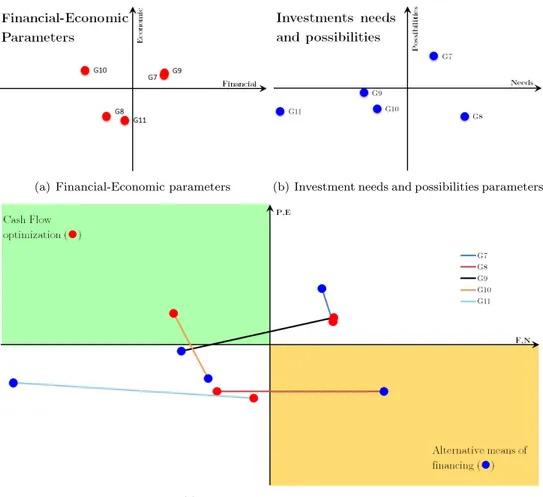
The three measures, estimated for each node, are normalize with respect to the other nodes, and positioned on two six-axes radar charts (the first with parameters F and E, the second with parameters N and P ). Such radar charts are useful to compare the profile of different nodes, and give a first insight on the strength and weaknesses of each node, in relation to the other nodes of the supply chain. The set of radar charts for the manufacture of tubes supply chain is reported in figure 5.
Once the four parameters have been estimated, through the application of the appropriate function, they are placed on two scatter plots, the first in the space (F, E), the second in the space (P, N ). Such scatter plots can be overlapped, and the points referring to the same node connected, creating segments. The process, applied to the manufacture of tube supply chain, is reported in figure 4.
Parameter Description Measures
Financial (F ) Ability to manage cash flows Days of receivables, Days of inventories, Days of payables
Economic (E ) Ability to generate profit EBITDA, EBIT, ROS Investment
Possibilities (P )
Possibility of increase debt through canonical financing solutions
Leverage, Financial Charges over EBITDA, Net Financial Position Investment
Needs (N )
Necessity of increase debt to financing investment (especially in tangible assets)
Depreciation and Amortization over Total Asset, percentage increase of tan-gible assets, Asset Turnover
Table 3: Parameters for the financial assessment of a supply chain, and relative measures.
(a) Financial-Economic parameters (b) Investment needs and possibilities parameters
(c) Financial assessment matrix
Figure 5: Radar charts for the tub e man ufacture supply chain.
Assessment of non-canonical financing solutions
The financial assessment of a supply chain has a clear implication in the evaluation of non-canonical financing solutions, in particular, of solutions of Supply Chain Finance (SCF). Such solutions, exploiting the links among parties belonging to a supply chain, increase the value2 of the organizations involved
providing means of financing apt to optimize the cash to cash cycle and the WACC.
For the practice purpose of interpreting the result of the financial assessment methodology, SCF solutions can clustering in two groups: the first, called Cash Flow Optimization (CFO), contains solutions apt at optimizing the cash to cash cycle of organizations involved; the second, called Alternative Means of Financing (AMF), containing solutions apt at providing to organizations competitive alternative means of financing that exploit the strength of the links among two players in a supply chain.
Taking as a reference the chart reported in figure 4(c), it can be noticed that, considering the quad-rants only and not the specific coordinates, there are sixteen different possible segments (eight segments, twice two, considering that orientation matters). Such sixteen segments can be grouped in nine clusters. The nine clusters present characteristics that indicate the likelihood of organizations belonging to the analyzed node to benefit from the application of an SCF solution to the supply chain, as well as the likelihood of organizations to have a role in an SCF framework. The nine clusters are described in table 4.
Cluster Logic expression1 Description
1 High performer F ∧ E ∧ P ∧ N The node presents high level of each parameter, and is con-sidered a strong performer.
2 Cash provider F ∧ E ∧ P ∧ ¬N The node is an high performer who has (in relative terms) possibilities of increase debt higher respect to its needs (P > N ); organizations in this node are likely to be cash providers.
3 AMF F ∧ E ∧ ¬P ∧ N The node shows high investment needs, but low possibili-ties; it is likely to benefit from SCF solutions called alter-native means of financing, exploiting the links with other supply chain players able to provide them debt at a lower cost (e.g.: those in cluster 2).
4 Doubtful case (F ∧E ∧¬P ∧¬N )∨ (¬F ∧ ¬E ∧ P ∧ N )
The cluster contains the cases for which it is difficult to draw conclusions related to possible financing solutions. Specific and more detailed analyses are usually required. 5 Low performer ¬E ∧ (¬F ∨ ¬N ∨
P ) ∧ (F ∧ N ∨ ¬P )
The node presents weak performance in generating profit and in one or more other parameters. It is likely that such performance cannot be improved through the sole applica-tion of an SCF soluapplica-tion.
6 Possible AMF ¬E ∧ F ∧ ¬P ∧ N This node shares similar characteristics respect to node in cluster 3, but its low profit generation performance weaken its suitability for AMF solutions.
7 CFO E ∧ ¬F ∧ (P ∨ ¬N ) This node is strong in profit generation, but weak in man-aging cash flows: it is suitable to SCF solutions of cash flow optimization.
8 SCF needy E ∧ ¬F ∧ ¬P ∧ N Sharing both characteristics of both cluster 3 and 7, node in this cluster presents the needs for both the typologies of SCF solution proposed.
9 Potential cash provider
¬E ∧ P ∧ ¬N With characteristics similar to cluster 2, nodes in this clus-ter are less likely than them to be cash provider, given their weak economic performance.
1A parameter is true if > 0, false otherwise. Convention: AND → ∧, OR → ∨, negation → ¬.
Table 4: The nine identified clusters.
2Defined as: V (0) =P∞ t=0
N CF (t) (1+WACC)t
The combined presence of nodes belonging to different clusters shapes the possible financing solution that can have a positive effect on organizations within the supply chain. For example, the presence of nodes in cluster 2 (cash providers), and in cluster 3 (AMF), draws a context in which the latter may benefit from an alternative mean of financing provided by the former, e.g.: organizations in cluster 2 can likely have an interest rate i2, while the ones in cluster 3 an interest rate i3; the former can provide to
the latter debt at an interest ik ⇔ i2< ik< i3 beneficial for both of them.
The interpretation of the segments cannot exempt from the contextual interpretation of the messages coming from the other outputs of the model. If an SCF solution requires the presence of a link among two nodes, such link should be inquired not only in terms of quality of the relationships among parties, but also in quantitative terms: a node that relies entirely, or almost entirely, from abroad production, is less likely to have the necessary strength for an SCF solution involving its national suppliers. In the same way, if a node requires a solution of cash flow optimization, such solution is likely to be more beneficial if it involves the more relevant supplier node in terms of value exchanged. Such considerations can be drawn from the first two outputs of the model.
Prototype
After the definition of the model, a web-based prototype has been developed. Such prototype has the purpose of show the model outputs in a dynamical and interactive way. This allow to highlight features that are difficult to highlight in a written document, and to provide insights in the desired, practical, usage of the model.
The prototype is available at the url http://supplychain.altervista.org. It allows a user without deep knowledge about the topic of this work, to assess financially a supply chain, and to gather insights on the possible application of SCF solution in the provided supply chain. The user is required to input basic information about the supply chain (no. of nodes, value of arcs and of indicators), and the prototype provides the desired three outputs of the model. The objective of the prototype is to show the possible integration of the model within a tool ; in fact, being part of a tool, the model can be practically used and inserted in the flow of the analyses required for the assessment of the application of SCF solution to a supply chain, where it can enhance the quality of the first, unavoidable, supply chain-level analysis.
Model application and testing
The model has been applied to two Italian supply chains: the manufacture of tube, and the manufacture of machinery for the food industry supply chain. The application provided an empirical base for testing the developed model. The test has been based on the comparison of messages about the supply chains gathered through the analyses of secondary sources and interviews, and the messages provided by the model application. Most of the messages identified in the model output have found a parallel in the ones gathered through the secondary sources, and vice versa. In particular, some of that are:
The service centers node (within the distribution tier of the manufacture of tube supply chain) belongs to cluster 7 (Cash Flow Optimization), given its good profit generation and weak cash flow management performances. This is confirmed by the analyses of secondary sources, that highlights the difficulties of the service centers in dealing with the upstream nodes, that have more bargaining power;
The stockists node (belonging to the same tier of the service centers) present a weak performance (cluster 5), confirmed by the analyses of secondary sources. They suffer the same criticality of the service center, worsened by the lack of possibility of customize products to met the demands of specific customers (like the service centers); this factor, likely, affected their ability to generate profit;
The production coefficient matrix for the machinery for the food industry highlights how they do not rely strongly on any of the numerous suppliers, as gathered through the interviews and the analyses of secondary sources.
Conclusions and future researches
The model developed in this thesis addresses the need for a comprehensive methodology for the financial assessment of a supply chain. Such methodology relies on a standardized representation of the supply chain, that through graphical and tabular instruments highlights the structure of the supply chain, as well as strength and dependencies in the links between its nodes. The methodology for the financial assessment generate an output that represent the assessment of each single node, in relation to the whole supply chain. Such output has been found to provide insights about the implementation of SCF solutions to the supply chain. In particular, the model outputs can be used to assess if organizations within a node will benefit from the application of an SCF solution, as well as if they are suitable to play specific roles within an SCF framework.
The model has been implemented in a prototype3, with the purpose of highlight how the model can be used as a practical instrument within the necessary analyses for the implementation of SCF solution to a supply chain. Such practical use present different managerial implications: a correct implementation and usage of the tool can be beneficial for financial institutions, industry associations, and single organizations, especially within the analyses for the assessment of the benefit of an SCF solution; in fact, a player willing to analyze the benefits of an SCF solution, often cannot avoid a first analysis at the supply chain level, that can be carried out with the proper application of the present model.
Future recommendations include:
Modification of the model structure and further validation, included further application of the model for testing purposes: test of different sets of measures respect to the ones proposed, test with non-financial indicators, application of the model to non-manufacturing supply chains; Modification related to the topic of Supply Chain Finance, included the consideration of less-known
SCF solutions, as well as the updating of the model with new, innovative, sets of SCF solutions. Moreover, the model can be modified to include a quantitative assessment of benefits of specific SCF solutions for the supply chain object of the analysis;
Inquiring the relationships between the correct implementation of ICT practices (e.g.: an ePayable system) in the supply chain and the outcome of the financial assessment methodology, as well as the likelihood that such practices have on the application of SCF in the supply chain;
Improvement to the prototype, till an eventual development of a software for the financial as-sessment of the supply chain, that includes the analyses required to assess the benefit of an SCF solution.
ID Extended name G1 Engines
G2 Taps and valves G3 Gearings
G4 General mechanical engineering G5 Metal structures
G6 Machinery for the food industry G7 Metal casting
G8 Screws and fasteners G9 Tube manufacturing G10 Service center - tubes G11 Stockists - tubes
Table 5: Legend for tables and figures in this executive summary.
Sommario
Introduzione ed obiettivi
Gli ultimi anni hanno mostrato una tendenza alla crescita di soluzioni non canoniche di finanziamento per le imprese. Un sottoinsieme di tali soluzioni, dette soluzioni di Supply Chain Finance (SCF), contiene soluzioni che generano benefici per le parti coinvolte attraverso lo sfruttamento delle relazioni all’interno della supply chain. Per questa ragione, `e quindi critica la necessit`a di una metodologia formale per la stima dello stato di salute di un’intera supply chain. L’obiettivo alla base di questa tesi `e quindi la definizione di tale metodologia, orientata a fornire uno strumento utile nelle fasi iniziali dell’analisi dell’applicazione di soluzioni di SCF.
Obiettivi
Gli obiettivi di questo lavoro possono essere efficacemente riassunti in tre domande di ricerca. Tali domande compongono il quadro di riferimento di questo lavoro. Tale quadro `e rappresentato graficamente in figura 6
DdR 1. Lo stato di salute di una supply chain
Che cosa significa stimare lo stato di salute di una supply chain? Come differisce tale concetto dalla stima per una singola organizzazione
Quali sono le possibili scelte di misure che possono essere utilizzate per la stima dello stato di salute di una supply chain?
Come mostrato nell’analisi della letteratura, la stima dello stato di salute di una supply chain `e un concetto che trova scarsi contributi. Quindi, questa domanda di ricerca `e mirata allo sviluppo di una definizione formale di stima dello stato di salute per una supply chain, fornendo contestualmente una scelta di misure e funzioni per la stimare praticamente tale stato per una supply chain.
DdR 2. Stato di salute e rappresentazione della supply chain
Ci sono modi efficienti per rappresentare una supply chain in relazione con il suo stato di salute?
Ci sono legami tra la metodologia rappresentativa e l’efficacia della stima dello stato di salute di una supply chain? Pu`o una corretta metodologia rappresentativa essere parte integrante della stima dello stato di salute?
La rappresentazione di una supply chain `e un concetto che trova applicazioni in svariati argomenti. Questa domanda mira a indagare se la stima dello stato di salute di una supply chain `e influenzato dal modo in cui tale supply chain `e rappresentata, e se esistono metodi pi`u efficaci per rappresentarla in relazione a tale stima.
DdR 3. Stato di salute e Supply Chain Finance
Ci sono legami tra la stima dello stato di salute ed una effettiva applicazione di soluzioni di finanziamento, ed in particolare di soluzioni non-canoniche come quelle di Supply Chain Finance?
In che modo lo stato di salute dei nodi che compongono la supply chain influenza l’applica-zione di soluzioni non canoniche di finanziamento?
Questa terza domanda di ricerca si pone l’obiettivo di analizzare la metodologia di stima dello stato di salute in termini di possibili applicazioni di soluzioni di SCF ad un’intera supply chain, nonch´e indicazioni basate sullo stato di salute dei nodi utili per una implementazione efficace di tali soluzioni. Inoltre, tale domanda indaga le differenze nell’applicazione di soluzioni di SCF ad un intera supply chain, respetto che ad un generico gruppo di organizzazioni.
Figure 6: Il quadro di riferimento di questa tesi.
Analisi della letteratura
L’analisi della letterature costituisce la base concettuale di questo lavoro, e consiste nella valutazione critica dei contributi pi`u rilevanti riguardanti gli argomenti che costituiscono il quadro di riferimento per questo lavoro. Diverse tipologie di contributi sono stati presi in considerazione:
Articoli scientifici, per il 42% dei contributi; Libri di testo, 18%;
Contributi non pubblicati (atti di convegni e lezioni), 16%; Manuali, report di osservatori 16%;
Brevetti, 4%; Altre tipologie, 4%.
Da un lato, l’analisi si `e concentrata sulla definizione di concetti chiave per il lavoro (quali quelli di supply chain o supply chain management ), dando particolare importanza allo studio del concetto e delle soluzioni esistenti di supply chain finance.
Dall’altro lato, `e stato approfondito lo studio dei modelli e delle metodologie esistenti per la rappre-sentazione e la stima dello stato di salute di una supply chain. Nello specifico, sono stati analizzati i principali contributi in termini di metodologie, strumenti e prototipi per la rappresentazione pratica di una supply chain, cos`ı come sono stati analizzati i principali software presenti sul mercato; allo stesso modo sono stati analizzati i modelli, le metodologie, e gli insiemi di misure utilizzati per la valutazione della performance finanziaria di un’intera supply chain.
Infine, la letterature si `e focalizzata sul contesto di applicazione e test del modello: l’industria mec-canica italiana. In particolare, la parte conclusiva del capitolo presenta un quadro iniziale, formale, della supply chain usata per testare il modello, cos`ı come le basi su cui `e stata strutturata l’analisi delle fonti secondarie.
Figure 7: I passi metodologici ricorsivi utilizzati nello sviluppo del modello.
Metodologia
La metodologia utilizzata in questo lavoro `e riportata in figura 7.
Un iniziale analisi delle fonti secondarie ha portato alla selezione delle due supply chain che sono state utilizzate come base empirica per questo lavoro (ossia: la fabbricazione di tubi e la fabbricazione di macchine per l’industria alimentare); una volta selezionati i due ambiti di applicazione, una serie di codici ATECO4, rappresentanti i possibili nodi della supply chain, sono stati selezionati. Da questi passi
iniziali `e stato possibile procedere con le analisi, che possono essere suddivise in due gruppi:
Analisi quantitative: preparazione, esplorazione ed effettivo utilizzo dei dati scaricati dal database online AIDA. I dati sono stati scaricati attraverso delle opportune interrogazioni basate sui codici ATECO selezionati precedentemente; nelle fasi successive del lavoro `e stato necessario aggiungere dei nodi della supply chain che non potevano essere identificati in modo chiaro attraverso un codice ATECO; per questi nodi, le interrogazioni sono state basate sulla lista delle ragioni sociali prodotta da Bilanci d’acciaio [2011]. In sostanza, sono stati analizzati circa 18.000 stati patrimoniali e conti economici, che rappresentano la base per i valori numerici presentati nel capitolo di applicazione del modello;
Analisi qualitative: raccolta ed analisi di fonti secondarie, inclusi rapporti di osservatori ed intervi-ste. In particolare, l’obiettivo delle interviste `e stato quello di raccogliere le necessarie informazioni per comprendere e analizzare la struttura delle due supply chain oggetto dell’applicazione del mo-dello. Sono state effettuate 29 interviste, di cui 18 ad imprese, e le rimanenti a esperti, professori, e associazioni di filiera.
L’applicazione del modello `e stata condotta in parallelo con lo sviluppo del modello stesso. Dopo una prima applicazione alle due supply chain selezionate, il processo ricorsivo adottato ha rifinito il modello attraverso un processo di generalizzazione e successive applicazioni.
Descrizione del modello
Il modello oggetto di questa tesi `e diviso in tre parti. La prima, chiamata Supply Chain Flowchart, `
e una rappresentazione grafica della supply chain che utilizza dei componenti classici dei diagrammi di flusso. La seconda parte fornisce invece due matrici strutturali, chiamate node exchanges matrix e production coefficients matrix, che sintetizzano la struttura degli scambi tra i diversi nodi. La terza parte rappresenta la stima dello stato di salute della supply chain, e produce una serie di grafici radar e piani cartesiani da cui `e possibile evidenziare informazioni rilevanti sui nodi della supply chain: questa terza parte `e anche legata alla valutazione della possibilit`a di applicare una soluzione di finanziamento non canonica (in particolare una soluzione di SCF) alla supply chain.
4La nomenclatura ATECO `e il sistema italiano di classificazione delle attivit`a economiche, equivalente (ad alti livelli
Il Supply Chain Flowchart
In figura 8 `e riportato il risultato della prima parte del modello per la supply chain della fabbricazione di tubi.
Figure 8: Il Supply Chain Flowchart per la supply chain della fabbricazione di tubi.
Tale rappresentazione racchiude le principali informazioni sulla struttura dei nodi e degli archi della supply chain. Essa `e divisa in quattro corsie, che categorizzano i nodi in suppliers, manufacturers (nodi focali della rappresentazione), distributors, e customers. Tale rappresentazione racchiude caratteristiche innovative nella formalit`a con cui `e definita la metodologia sviluppata, e nel suo orientamento alla stima dello stato di salute di una supply chain. L’insieme di diversi componenti, comunemente non presenti sotto una stessa metodologia rappresentativa, e la capacit`a di influenzare direttamente e indirettamente la stima dello stato di salute di una supply chain rappresenta l’innovativit`a di questa parte di modello. Inoltre, la formalit`a della metodologia (che `e basata sulla definizione di un’ontologia), rappresenta un contributo innovativo nel quadro delle metodologie di rappresentazione di quelle supply chain composte da nodi rappresentanti gruppi di organizzazioni, in contrapposizione con la pi`u tradizionale, impresa-centrica, supply chain.
Matrici strutturali
La seconda parte del modello `e costituita dalle matrici node exchanges e production coefficients. Tali matrici sintetizzano in forma tabulare la struttura ed il valore degli scambi tra i nodi della supply chain. La prima matrice, la cui applicazione alla supply chain oggetto di questa tesi `e riportata in tabella 6, presenta il valore degli scambi tra i nodi (ossia: il valore degli archi); tale rappresentazione permette una rapida visualizzazione del valore e della struttura di tali scambi tra un nodo ed ogni altro nodo della supply chain, cos`ı come tra un nodo e il resto della supply chain. La tabella 10, a pagina 20, fornisce la legenda delle sigle dei nodi riportate nelle tabelle e figure di questa sezione.
La seconda matrice, detta production coefficients, `e riportata in tabella 7. Tale matrice contiene i coefficienti di produzione, che rappresentano, per un generico nodo i, quanti euro di produzione devono provenire da ogni altro nodo della supply chain ad i, in modo tale che egli possa generare un euro di produzione.
La matrice production coefficients fornisce diverse indicazioni sulla struttura delle dipendenze e legami tra nodi della supply chain. I valori, deviazione e distribuzione dei coefficienti permettono di capire la forza dei legami della supply chain, in termini di valore economico scambiato. Inoltre, il valore totale di ogni colonna descrive le dipendenze di un nodo da i suoi fornitori; poich´e il coefficiente di produzione pu`o essere stimato anche per il nodo delle importazioni, la matrice pu`o essere usata per comparare le dipendenze di un nodo dalla produzione nazionale ed internazionale. Una distribuzione uniforme dei coefficienti, ed un valore totale basso, rappresentano un nodo che fa affidamento pi`u sulla trasformazione
da i ↓ a j → G6 G9 G10 G11 Export Other SC Customers Total G1 0.20 - - - 7.87 1.53 - 9.60 G2 0.11 - - - 5.08 0.37 - 5.57 G3 0.15 - - - 3.22 4.08 - 7.46 G4 0.18 - - - 0.00 26.59 - 26.77 G5 0.28 - - - 2.80 10.58 - 13.66 G6 - - - - 2.25 - 1.65 3.90 G7 0.19 3.89 - - 5.51 3.27 - 12.85 G8 0.06 0.43 - - 1.39 1.16 - 3.04 G9 0.05 - 0.57 0.98 3.19 - 0.99 5.78 G10 0.03 - - - 0.33 - 2.95 3.30 G11 0.05 - - - 0.55 - 3.80 4.40 Other SC 0.33 - 0.03 - - - - 0.35 Imports 0.29 1.11 2.11 2.52 - - - 26.19 Totale 1.92 5.43 2.71 3.50 32.19 47.58 9.39
Table 6: La matrice node exchanges per la supply chain oggetto di questa tesi (mlde). da i ↓ a j → G6 G9 G10 G11 G1 0.05 - - -G2 0.03 - - -G3 0.04 - - -G4 0.05 - - -G5 0.07 - - -G6 - - - -G7 0.05 0.67 - -G8 0.01 0.07 - -G9 0.01 - 0.17 0.22 G10 0.01 - - -G11 0.01 - - -Other SC 0.08 - 0.01 -Import 0.07 0.19 0.64 0.57 Totale 0.48 0.93 0.82 0.79 Complemento ad uno 0.52 0.07 0.18 0.21
Table 7: La matrice production coefficients per la supply chain oggetto di questa tesi.
interna che sulle materie prime (cf.: gruppo G6, tabelle 7 e 6), mentre un singolo, alto, coefficiente rappresenta un nodo che fa affidamento su un solo singolo nodo per la fornitura di materie prime.
Stima dello stato di salute di una supply chain
La terza parte del modello, la stima dello stato di salute della supply chain, stima tale stato per ogni nodo, in relazione all’intera supply chain. La metodologia `e basata sulla stima analitica di quattro parametri, riassunti nella tabella 8. Per ogni parametro, sono state identificate tre misure, per un totale di dodici misure. Tali tre misure, calcolate per ogni nodo, sono normalizzate rispetto agli altri nodi, e posizionate su due grafici radar da sei assi l’uno (il primo grafico con le misure relative ai parametri F e E, il secondo con quelle relative ai parametri N e P ). Tali grafici sono utili per confrontare i diversi profili dei nodi, e forniscono una prima serie di intuizioni sui punti di forza e debolezza di ogni nodo, in relazione agli altri nodi della supply chain. L’insieme dei grafici radar per la supply chain della fabbricazione dei tubi `
Una volta che sono stati stimati i quattro parametri (per ogni nodo), attraverso l’applicazione di una funzione atta allo scopo essi possono essere posizionati su due piani cartesiani, il primo nello spazio (F, E), il secondo nello spazio (P, N ). Tali piani cartesiani possono essere sovrapposti, e i punti relativi allo stesso nodo collegati, creando cos`ı una serie di segmenti. Il processo, relativo alla supply chain della fabbricazione di tubi, `e riportato in figura 9.
Parametro Descrizione Misure
Finanziario (F ) Gestire flussi di cassa Durata media crediti, durata media debiti, durata media giacenza
Economico (E ) Generare profitti EBITDA, EBIT, ROS Possibilit`a
inve-stimento (P )
Aumentare debito canonicamente Leva, oneri fin. su EBITDA, posizione finanziaria netta
Necessit`a inve-stimento (N )
Necessit`a aumentare debito per investi-menti (specialmente in IIM)
Ammortamenti su attivo, incremento IIM, Asset Turnover
Table 8: Parametri e misure per la stima dello stato di salute di una supply chain.
(a) Financial-Economic parameters (b) Investment needs and possibilities parameters
(c) Financial assessment matrix
Figure 10: I grafici radar p er la supply ch ain della fabbricazione di tub i.
Valutazione delle soluzioni non canoniche di finanziamento
La stima dello stato di salute di una supply chain presenta un chiaro legame con la valutazione di soluzioni non canoniche di finanziamento, nello specifico, soluzioni di supply chain finance (SCF). Tali soluzioni, sfruttando il legame tra imprese appartenenti alla stessa supply chain, aumentano il valore delle organizzazioni5 interessate fornendo mezzi di finanziamento alternativi atti all’ottimizzazione del ciclo commerciale e del WACC.
Al fine di interpretare i risultati della metodologia di stima dello stato di salute, le soluzioni di SCF possono essere categorizzate in due gruppi: il primo, detto Cash Flow Optimization (CFO), include soluzioni che ottimizzano il ciclo commerciale delle imprese coinvolte; il secondo, detto Alternative Means of Financing (AMF), include le soluzioni che forniscono alle imprese coinvolte mezzi di finanziamento alternativi che sfruttano la forza dei legami tra imprese appartenenti alla stessa supply chain.
Prendendo in considerazione il piano cartesiano riportato in figura 9(c), pu`o essere notato come, considerando i quadranti e non le specifiche coordinate, esistano sedici possibili segmenti (otto segmenti per due, considerando l’orientamento). Questi sedici segmenti possono essere raggruppati in nove cluster. Questi nove cluster presentano caratteristiche che indicano la possibilit`a che organizzazioni appartenenti ai nodi analizzati possano beneficiare dall’applicazione di soluzioni di SCF alla supply chain, cos`ı come la possibilit`a che tali organizzazioni abbiano un ruolo nel quadro di riferimento di una possibile soluzione di SCF. I nove cluster sono descritti nella tabella 9.
La presenza combinata di nodi appartenenti a diversi cluster influenza le possibilit`a che una soluzione di SCF posso essere efficacemente applicata alla supply chain. Ad esempio, la presenza di nodi nel cluster 2 (cash provider) e nel cluster 3 (AMF), rappresentano un contesto in cui i secondo possono beneficiare di mezzi di finanziamento alternativi forniti dai primi: specificatamente, `e probabile che organizzazioni nel cluster 2 avranno un tasso di interesse sui prestiti uguale ad i2, mentre quelle nel cluster 3 un tasso
i3, e che i primi possano fornire debito ai secondi ad un tasso ik ⇔ i2< ik < i3, benefico per entrambi.
L’interpretazione dei segmenti non pu`o esimersi dalla contestuale interpretazione dei messaggi che provenienti dalle altre parti del modello. Se una soluzione di SCF richiede la presenza di un legame tra due nodi, tale legame dovrebbe essere indagato non solo in termini di di qualit`a delle relazioni esistenti, ma anche in termini quantitativi: un nodo che fa affidamento quasi interamente sulla produzione estera indebolisce la possibilit`a di applicare efficacemente una soluzione SCF che riguardi lui e i suoi fornitori. Allo stesso modo, se un nodo presenta caratteristiche adatte ad una soluzione CFO, tale soluzione sar`a benefica se includer`a i fornitori o i clienti (a seconda delle necessit`a) pi`u rilevanti in termini di valore scambiato. Tali considerazioni possono essere tratte dalle prime due parti del modello.
Il prototipo
Dopo la definizione del modello, ne `e stato sviluppato un suo prototipo computerizzato. Tale prototipo ha l’obiettivo di mostrare le caratteristiche di dinamicit`a e interattivit`a del modello. Questo permette di sottolineare quelle caratteristiche che difficilmente sono individuabili in un documento scritto, e fornisce intuizioni sull’utilizzo del modello in un contesto pratico.
Il prototipo `e raggiungibile all’indirizzo http://supplychain.altervista.org. Esso permetta ad un utente, senza approfondite conoscenze dei temi trattati, di stimare lo stato di salute di una supply chain, e di raccogliere informazioni sulla possibile applicazione di soluzioni di SCF riguardo alla supply chain oggetto dell’analisi. L’utente inserisce i dati necessari (n° di nodi, valore degli archi e degli indicatori), e il prototipo produce i risultati desiderati. Il fine del prototipo `e di mostrare la possibile integrazione del modello in un pratico strumento: infatti, essendo implementato in uno strumento, il modello pu`o essere usato in modo pratico ed inserito nell’insieme delle analisi richieste per la valutazione dell’applicazione di soluzioni di SCF ad una supply chain, dove pu`o migliorare la qualit`a delle prime, inevitabili, analisi al livello dell’intera supply chain.
Applicazione e test del modello
Il modello `e stato applicato a due supply chain italiane: la fabbricazione di tubi e la fabbricazione di macchinari per l’industria alimentare. L’applicazione ha fornito la base empirica per la fase di test
5Definito come: V (0) =P∞ t=0
N CF (t) (1+WACC)t
Cluster Espressione logica1 Descrizione
1 High performer F ∧ E ∧ P ∧ N Il nodo presenta alti valori in ogni parametro.
2 Cash provider F ∧ E ∧ P ∧ ¬N Il nodo `e un high performer con una possibilit`a di in-vestimento (in termini relativi) maggiore delle necessit`a (P > N ); organizzazioni in questo nodo sono inclini ad assumere il ruolo di cash provider.
3 AMF F ∧ E ∧ ¬P ∧ N Il nodo presenta un alto valore di N, ed un basso valore di P ; `e probabile che organizzazioni in questo nodo pos-sano beneficiare di soluzioni AMF, sfruttando legami con altri membri della supply chain che possano fornire debito a condizioni concorrenziali (es.: imprese in cluster 2). 4 Doubtful case (F ∧E ∧¬P ∧¬N )∨
(¬F ∧ ¬E ∧ P ∧ N )
Il cluster racchiude tutti casi di difficile interpretazione in relazione alle soluzioni di SCF. Ulteriori, dettagliate, indagini sono spesso necessarie.
5 Low performer ¬E ∧ (¬F ∨ ¬N ∨ P ) ∧ (F ∧ N ∨ ¬P )
Il nodo presenta una scarsa performance nel generare pro-fitti unita ad una scarsa performance in almeno un altro parametro. E probabile che tale performance non possa` essere migliorata attraverso la mera applicazione di una soluzione di SCF.
6 Possible AMF ¬E ∧ F ∧ ¬P ∧ N Questo nodo presenta caratteristiche simili ai nodi in clu-ster 3, ma la sua bassa performance in generazione dei profitti indebolisce l’opportunit`a che soluzioni AMF siano applicabili.
7 CFO E ∧ ¬F ∧ (P ∨ ¬N ) Il nodo presenta una forte performance in generazione dei profitti, ma una debole performance nella gestione dei flussi di cassa: `e quindi idoneo all’applicazione di soluzioni di cash flow optimization.
8 SCF needy E ∧ ¬F ∧ ¬P ∧ N Il nodo presenta caratteristiche comuni ai cluster 3 e 7, rendendolo idoneo all’applicazione di entrambe le soluzioni di SCF.
9 Potential cash provider
¬E ∧ P ∧ ¬N Con caratteristiche simili al cluster 2, la possibilit`a che or-ganizzazioni in questo cluster possano assumere il ruolo di cash provider `e negativamente influenzata dalla bassa performance in generazione di profitti.
1Un parametro `e detto vero se > 0, falso altrimenti. Convenzione: AND → ∧, OR → ∨, NOT → ¬.
Table 9: I nove cluster identificati.
e sviluppo del modello. Il test `e stato basato sul confronto dei messaggi derivanti dall’analisi delle fonti secondarie (comprese le interviste), e da quelli provenienti dall’applicazione del modello. Molti dei messaggi identificati dall’applicazione del modello hanno trovato un parallelo nell’analisi delle fonti secondarie, e vice versa. In particolare, si sottolinea:
I centri servizio (che fanno parte del comparto distributivo della fabbricazione di tubi) cadono nel cluster 7 (Cash Flow Optimization), data la loro alta performance nella generazione di profitto, e bassa nella gestione dei flussi di cassa. Questo `e confermato dall’analisi delle fonti secondarie, che sottolineano il rapporto difficoltoso dei centri servizio con i fornitori, che possiedono un maggior potere di contrattazione;
I distributori dal pronto (che appartengono allo stesso comparto dei centri servizio) presentano una performance debole (cluster 5), confermata dall’analisi delle fonti secondarie. Tale nodo soffre la stessa criticit`a dei centri servizio, ma senza la possibilit`a di adattare i prodotti alle specifiche esigenze dei singoli clienti (come i centri servizio), fattore che `e probabilmente alla causa della cattiva performance in generazione dei profitti.
I coefficienti di produzione per la fabbricazione di macchinari per l’industria alimentare sottolinea come questi non facciano particolare affidamento su uno specifico nodo di fornitori, come segnalato dall’analisi delle fonti secondarie.
Conclusioni e sviluppi futuri
Il modello sviluppato in questo lavoro `e focalizzato sulla necessit`a di sviluppare una metodologia per la stima dello stato di salute di una supply chain, basata su una rappresentazione standardizzata della supply chain, che fornisce una rappresentazione della struttura della supply chain attraverso strumenti grafici e tabulari, sottolineando forza e dipendenza nei legami tra i nodi. La metodologia effettua tale stima per ogni singolo nodo, in relazione all’intera supply chain. Il risultato fornisce messaggi riguardanti l’applicazione di soluzioni di SCF all’intera supply chain. In particolare, gli output del modello possono essere usati per stimare la possibilit`a che organizzazioni all’interno di uno specifico avranno benefici dall’applicazione di soluzioni di SCF, cos`ı come quella che organizzazioni siano adatte a rivestire specifici ruoli nel quadro di riferimento di una soluzione di SCF.
Un prototipo basato sul modello `e stato sviluppato6con l’obiettivo di sottolineare l’utilizzo pratico del modello all’interno delle necessarie analisi per l’implementazione di soluzioni di SCF ad una supply chain. Tale uso presenta diverse implicazioni manageriali: una corretto utilizzo del prototipo (o di eventuali evoluzioni) pu`o essere utile ad istituzioni finanziarie, associazioni di filiera, e semplici organizzazioni, specialmente se interessate alla valutazione di soluzioni di SCF; infatti, un organizzazione che voglia analizzare i benefici di una soluzione di SCF, spesso non pu`o evitare una prima analisi al livello dell’intera supply chain, che pu`o essere facilitata dal corretto utilizzo del presente modello. Sviluppi futuri includono: Modifiche della struttura del modello e ulteriori validazioni, incluse successive applicazioni del modello per ulteriori test: si dovranno testare differenti insiemi di misure rispetto a quello proposto, anche di natura non finanziaria, cos`ı come il modello dovr`a essere applicato a supply chain di natura non manifatturiera;
Modifiche relative al supply chain finance, incluse la considerazione di ulteriori soluzioni (meno conosciute o non ancora sviluppate). Inoltre, `e possibile modificare il modello per includere una analisi quantitativa dei benefici della specifica applicazione di soluzioni di SCF alla supply chain; Indagini relative al legame tra una corretta implementazione di pratiche di ICT (come ad esempio
un sistema di fatturazione elettronica) nella supply chain e i risultati della metodologia di stima dello stato di salute, cos`ı come un’analisi dell’impatto di tali pratiche su possibili soluzioni di SCF; Il prototipo pu`o essere migliorato; in particolare, un intero software pu`o essere sviluppato per
l’effettivo utilizzo nelle analisi di valutazione dell’applicazione di soluzioni di SCF. Sigla Nome per esteso
G1 Motori
G2 Rubinetti e valvole G3 Ingranaggi
G4 Lavori di meccanica generale G5 Telai e parti di telai
G6 Macchinari per l’industria alimentare G7 Fusione di metallo
G8 Viti e bulloni
G9 Fabbricazione di tubi G10 Centri servizio (tubi)
G11 Distributori dal pronto (tubi)
Table 10: Legenda per le tabelle e figure di questo sommario.
Chapter 1
Literature Review
This first chapter highlights the more relevant contributions coming from the literature analysis carried out as theoretical basis of this work. Such review is divided into two parts: the first one includes the illustration of the most common definitions of supply chain, followed by the analysis of the topics of Supply Chain Management and Supply Chain Finance; thus, it presents recent models, tools, and prototypes developed for the representation of a supply chain, to conclude with the analyses of relevant models and methodologies for the financial assessment of a supply chain. The second part concerns the literature framework for the context analysis on which the application of the model (cf.: chapter 4) is based.
![Figure 1.1: The three supply chains defined by Mentzer et al. [2001].](https://thumb-eu.123doks.com/thumbv2/123dokorg/7499254.104370/35.892.152.744.107.392/figure-supply-chains-defined-mentzer-et-al.webp)