Disorders of the Nervous System
Meta-Analysis of MicroRNAs Dysregulated in the
Hippocampal Dentate Gyrus of Animal Models of
Epilepsy
Prashant K. Srivastava,1,ⴱPaolo Roncon,2,ⴱKatarzyna Lukasiuk,3 Jan A. Gorter,4Eleonora Aronica,5Asla Pitkänen,6Enrico Petretto,7Michael R. Johnson,1,† and Michele Simonato2,8,9,10†
DOI:http://dx.doi.org/10.1523/ENEURO.0152-17.2017
1Division of Brain Sciences, Imperial College London, Charing Cross Hospital, W12 0NN London, United Kingdom,2Division of
Neuroscience, University Vita-Salute San Raffaele, Milan 20132, Italy,3Nencki Institute of Experimental Biology, Polish Academy of
Sciences, 02-093 Warsaw, Poland,4Swammerdam Institute for Life Sciences, Center for Neuroscience University of Amsterdam,
1105 Amsterdam, The Netherlands,5Department of (Neuro)Pathology, Academic Medical Center and SEIN – Stichting Epilepsie
Instellingen Nederland, The Netherlands,6Department of Neurobiology, A.I. Virtanen Institute for Molecular Sciences University of
Eastern Finland, FIN-70 211 Kuopio, Finland,7Duke-NUS Medical School, Singapore 169857, Singapore,8Department of Medical
Sciences, Section of Pharmacology, University of Ferrara, Ferrara, Italy,9National Institute of Neuroscience, Italy, and10Laboratory for
Technologies of Advanced Therapies (LTTA), Ferrara 44121, Italy
Abstract
The identification of mechanisms transforming normal to seizure-generating tissue after brain injury is key to devel-oping new antiepileptogenic treatments. MicroRNAs (miRNAs) may act as regulators and potential treatment targets for epileptogenesis. Here, we undertook a meta-analysis of changes in miRNA expression in the hippocampal dentate gyrus (DG) following an epileptogenic insult in three epilepsy models. We identified 26 miRNAs significantly differen-tially expressed during epileptogenesis, and five differendifferen-tially expressed in chronic epilepsy. Of these, 13 were not identified in any of the individual studies. To assess the role of these miRNAs, we predicted their mRNA targets and then filtered the list to include only target genes expressed in DG and negatively correlated with miRNA expression. Functional enrichment analysis of mRNA targets of miRNAs dysregulated during epileptogenesis suggested a role for molecular processes related to inflammation and synaptic function. Our results identify new miRNAs associated with epileptogenesis from existing data, highlighting the utility of meta-analysis in maximizing value from preclinical data. Key words: dentate gyrus; epilepsy; hippocampus; meta-analysis; miRNA; mRNA
Received April 28, 2017; accepted November 22, 2017; First published December 13, 2017.
The authors declare no competing financial interests.
Authors contributions: P.K.S., P.R., M.R.J., and M.S. performed research; E.P., K.L., J.A.G., E.A., and A.P. designed research; P.K.S., P.R., M.R.J., and M.S. wrote the paper.
Significance Statement
Meta-analyses of data from human research studies are an invaluable tool, and the methods to conduct these investigations are well established. However, meta-analyses of preclinical data are rarely undertaken, due to the typically small sample sizes and the substantial heterogeneity between studies. We implemented a meta-analysis of microRNA (miRNA) expression changes in animal studies of epilepsy. This is the first study of its kind in the field of epilepsy and one of the first in preclinical research. Our analyses identify new miRNAs associated with epileptogenesis and epilepsy, highlighting common mechanisms across different animal models. These miRNAs and their predicted effects on gene expression generate new hypotheses about the causes of epilepsy that will prompt new studies in the field.
Introduction
Epilepsy is a serious, common neurologic disorder pri-marily characterized by the occurrence of spontaneous seizures. The treatment of epilepsy remains as one of the major unmet medical needs in neurology because, de-spite of over 20 antiepileptic drugs on the market, sei-zures are not controlled in about one third of the patients. The most common form of epilepsy in adults originates in temporal structures of the brain (temporal lobe epilepsy, TLE; Hauser et al., 1993). Epilepsy (TLE in particular) frequently arises as a consequence of brain injury (“ac-quired epilepsy”). While ac(“ac-quired epilepsies are in princi-ple preventable by the therapeutic targeting of molecular processes underpinning their development (i.e., antiepi-leptogenic therapies), there are currently no established treatment options for halting the transformation of normal brain tissue to epileptic (Simonato et al., 2014). Identifi-cation of the mechanisms underlying epileptogenesis would therefore facilitate the identification of therapies for preventing the development of epilepsy and may inform new strategies for overcoming drug resistance in epilepsy more generally (Simonato et al., 2012;2013;2014).
Recent studies have suggested that microRNAs (miRNAs) play an important role in the pathogenesis of acquired epilepsy and may represent novel therapeutic targets (Jimenez-Mateos et al., 2012; Brennan et al., 2016; for review, seeCattani et al., 2016;Henshall et al., 2016). miRNAs are a family of small (21-25 nucleotides) noncoding RNAs, which can modulate various cellular and biological processes by degrading or repressing translation of specific mRNAs (Bartel, 2004, Guo et al., 2010). In systems analysis, miRNAs and their gene targets are described as following a “many-to-many” data model, such that each miRNA may regulate many transcripts and a single transcript may be regulated by many miRNAs (Ebert and Sharp, 2012). miRNAs have been implicated in various neuronal functions that are relevant in the patho-genesis of neurologic diseases, including epilepsy (Tan et al., 2013;Rajman et al., 2017; for review, seeKarnati et al., 2015).
Interpretation of data investigating the dysregulation of miRNAs in the brains of patients with epilepsy is chal-lenged by the absence of appropriate human control brain tissue (Roncon et al., 2016). Research on the role of miRNAs in epilepsy has therefore focused on the use of experimental models of epilepsy, revealing changes in the expression of hippocampal miRNAs at different stages of the epileptogenic process (Henshall et al., 2016). How-ever, methodological differences between the various preclinical animal models of epilepsy have made compar-isons between studies difficult and the identification of common pathways dysregulated in epileptogenesis and epilepsy problematic. The current preclinical miRNA stud-ies vary in multiple parameters, including brain region analyzed, animal model, sample size, microarray platform and analysis technique. Moreover, these studies are gen-erally substantially underpowered to reliably detect mod-est changes in miRNA expression.
One particular concern is that analysis of large brain regions (like the hippocampus or the cortex) across dif-ferent studies may confound interpretation and compari-son because of variable cellular composition (e.g., relating to variable neuronal loss, astrocytosis, microgliosis, etc.). One way to address this issue could be to focus on a specific cell population. In this respect, dentate gyrus (DG) granule cells (GCs) seem particularly attractive as a target of analysis as the DG GC layer is a compact layer of (almost) identical cells, facilitating the dissection of a nearly pure cell population (GCs). Moreover, the DG has been traditionally described as a “gate” to inhibit hip-pocampal overexcitation (Chevaleyre and Siegelbaum, 2010) and recently, this hypothesis found support from new technologies; optogenetic GC hyperpolarization was found to stop spontaneous seizures, whereas optoge-netic GC activation exacerbated spontaneous seizures, and activating GCs in nonepileptic animals evoked acute seizures (Krook-Magnuson et al., 2015). Finally, the DG is known to undergo important functional changes during epileptogenesis (neurogenesis, mossy fiber sprouting, in-creased excitation;Pitkänen and Lukasiuk, 2011).
To date, three studies have investigated differential expression of miRNAs in the DG during the epileptogen-esis and the chronic phase of epilepsy in rats (Bot et al., 2013; Gorter et al., 2014;Roncon et al., 2015). Each of these studies used a different method to trigger epilepto-genesis: focal electrical stimulation of the lateral nucleus of the amygdala (Bot et al., 2013); focal electrical stimu-lation of the angular bundle, a major afferent pathway from the entorhinal cortex to the hippocampus (Gorter et al., 2014); and the systemically administered chemo-convulsant pilocarpine (Roncon et al., 2015). Interestingly, all these models imply a key involvement of the DG in the development of epilepsy but via a different epileptogenic insult: direct activation in the case of angular bundle stimulation, indirect in amygdala stimulation, and a wide-spread brain activation in the case of pilocarpine (Peng and Houser, 2005).
Here, we aimed to overcome some of the limitations related to individual studies by combining these three studies in a meta-analysis, the aim being to increase the
This work was supported by funding from the European Union’s Seventh Framework Programme (FP7/2007-2013) under Grant Agreement 602102 (EPITARGET; to M.R.J., M.S., E.P., K.L., E.A., A.P.), the Imperial College National Institute for Health Research Biomedical Research Centre Scheme (M.R.J., E.P.), and the Polish Ministry of Science and Education Grant W19/ 7.PR/2014 (to K.L.).
ⴱP.K.S. and P.R. contributed equally to this work. †
M.R.J. and M.S. share the position of senior author and Authors who analyzed data are P.K.S., P.R., M.R.J., and M.S.
Acknowledgements: We thank Dr. Ray Dingledine (Emory University, At-lanta, GA) for helpful discussions and for critically reading this manuscript.
Correspondence should be addressed to either of the following: Prof. Mi-chele Simonato, Department of Medical Sciences, Section of Pharmacology, University of Ferrara, Via Fossato di Mortara 17-19, 44121 Ferrara, Italy, E-mail:[email protected]; or Prof. Michael Johnson, Division of Brain Sciences, Imperial College London, Charing Cross Hospital, W12 0NN Lon-don, United Kingdom, E-mail:[email protected].
DOI:http://dx.doi.org/10.1523/ENEURO.0152-17.2017
Copyright © 2017 Srivastava et al.
This is an open-access article distributed under the terms of theCreative Commons Attribution 4.0 International license, which permits unrestricted use, distribution and reproduction in any medium provided that the original work is properly attributed.
statistical power for detecting differentially expressed miRNAs while accounting for study heterogeneity, ulti-mately leading to more robust and accurate predictions of dysregulated downstream pathways (Ramasamy et al., 2008; Yang et al., 2014). Moreover, this approach offers the opportunity to identify miRNA changes that are inde-pendent of the model of epilepsy, i.e., more likely to be disease rather than model related. Our meta-analysis was performed at two time points in the “natural history” of the experimental disease: epileptogenesis and the chronic phase of epilepsy.
Materials and Methods
Inclusion criteria and study designWe collected datasets for meta-analysis based on available genome-wide expression profiles of miRNAs from the DG from epileptic and control hippocampi during epileptogenesis and chronic epilepsy. To assist the func-tional inference of differentially expressed miRNAs we analyzed publicly available gene expression data ob-tained from the DG of epileptic rodents.
To identify relevant studies, we first undertook a sys-tematic search to identify all published studies of miRNA expression levels and/or gene expression between cases (epileptic) and controls, in the DG of animal models of epilepsy. We conducted a PubMed search based on the string: “(microRNA OR miRNA) AND (dentate gyrus OR dentate cells OR granule cells) AND epilepsy.” miRNAs or genes expression profiles data obtained from the whole hippocampi or different brain regions to the DG were not included in the meta-analysis. This search and inclusion criteria identified only three relevant articles (Bot et al., 2013;Gorter et al., 2014;Roncon et al., 2015).
Time points for each stage of epileptogenesis and for the chronic phase of epilepsy have not been standard-ized. For the purposes of this study, we considered 7-8 d after SE as the “epileptogenesis phase” and more than two months after SE as the “chronic phase.”
The following models were used in the three relevant papers and considered for the meta-analysis. (1) Pilo-carpine model: a microarray study based on the investi-gation of miRNAs differentially expressed in the laser-microdissected GC layer of the DG of the hippocampi of
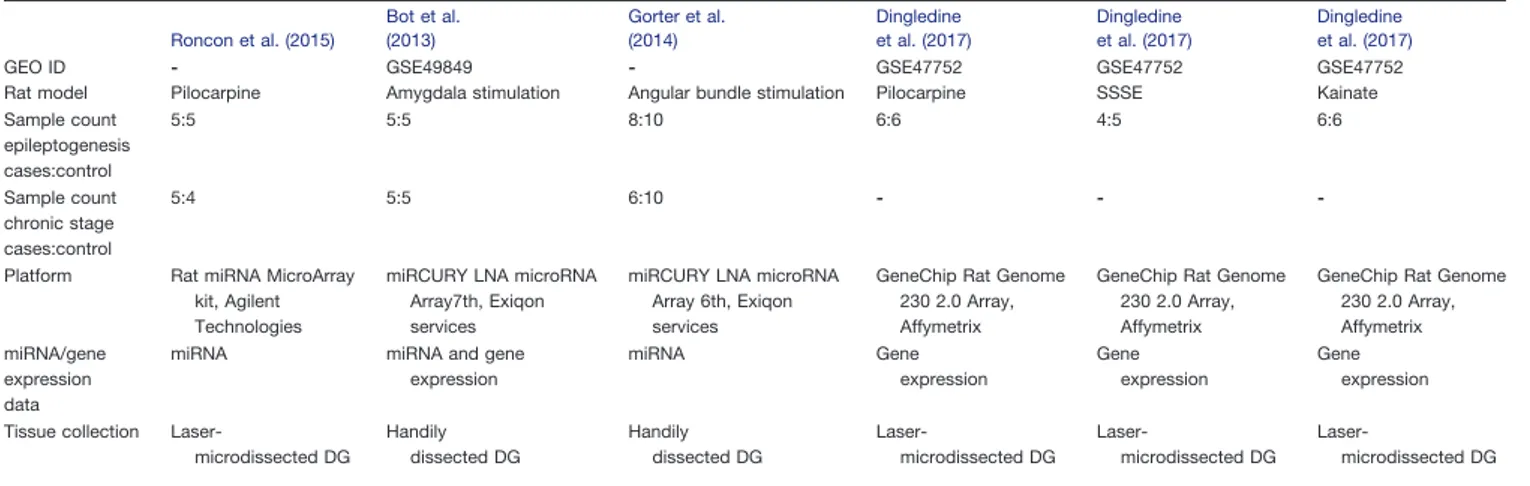
pilocarpine-induced epileptic rats and matched controls (n⫽ 4), killed during the late phase of latency, 8 d after SE (n ⫽ 5) and in the chronic stage, 50 d after the first spontaneous seizure (n ⫽ 5; Roncon et al., 2015). (2) Amygdala stimulation: a microarray study focused on the differential expression of miRNAs and genes in hand-dissected DG in the amygdala stimulation rat model dur-ing the phase of epileptogenesis, 7 d after the stimulation (n⫽ 5), in the chronic stage, 60 d after the stimulation (n ⫽ 5) and controls (n ⫽ 5;Bot et al., 2013). (3) Perforant path stimulation: a microarray miRNA study based on the perforant path stimulation rat model of epilepsy. We an-alyzed DG samples obtained from stimulated and control rat hippocampi, during latency (8 d after SE; n⫽ 8) and three to four months after the stimulation for the chronic stage (n⫽ 6) and controls (n ⫽ 10;Gorter et al., 2014). The datasets considered for the meta-analysis are summa-rized inTable 1.
Power calculation
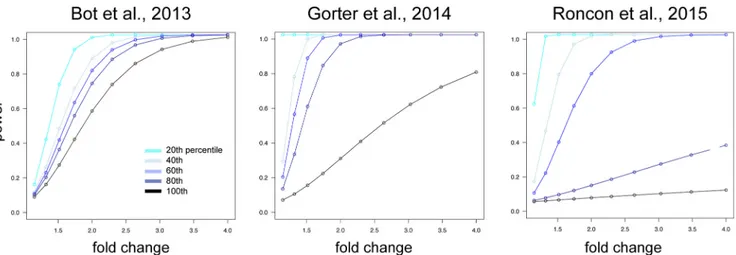
The statistical power of cases and controls for each individual model was calculated using pooled SD of each expressed miRNA. Power to detect miRNAs differentially expressed at multiple fold changes (1, 1.5, 2, 2.5, 3, 3.5, and 4) were calculated, considering miRNA expression variability ranging from 20th, 40th, 60th, and 80th to 100th percentile of the respective SD profiles per model (Fig. 1). Power calculations were performed using R bioconductor package ‘pwr’ version 1.2.
Data processing
From each identified study the following information was extracted: platform, number of cases and controls, and miRNA expression data at different time points of the disease. When available, GEO accession number and gene expression data were extracted (Table 1).
Data transformation
Since different platforms had been used to generate miRNA expression values, a linear transformation ap-proach was applied to each miRNA using a Z-score trans-formation according to the formula:
Table 1. Datasets included in the meta-analysis
Roncon et al. (2015) Bot et al. (2013) Gorter et al. (2014) Dingledine et al. (2017) Dingledine et al. (2017) Dingledine et al. (2017)
GEO ID - GSE49849 - GSE47752 GSE47752 GSE47752
Rat model Pilocarpine Amygdala stimulation Angular bundle stimulation Pilocarpine SSSE Kainate Sample count epileptogenesis cases:control 5:5 5:5 8:10 6:6 4:5 6:6 Sample count chronic stage cases:control 5:4 5:5 6:10 - -
-Platform Rat miRNA MicroArray kit, Agilent Technologies
miRCURY LNA microRNA Array7th, Exiqon services
miRCURY LNA microRNA Array 6th, Exiqon services
GeneChip Rat Genome 230 2.0 Array, Affymetrix
GeneChip Rat Genome 230 2.0 Array, Affymetrix
GeneChip Rat Genome 230 2.0 Array, Affymetrix miRNA/gene
expression data
miRNA miRNA and gene expression miRNA Gene expression Gene expression Gene expression
Tissue collection
Laser-microdissected DG Handily dissected DG Handily dissected DG Laser-microdissected DG Laser-microdissected DG Laser-microdissected DG
Z–score⫽ Xi ⫺ X ␦
Where Xi is the normalized intensity data for each miRNA, X is the average normalized miRNA intensity within a single study, and ␦ is the SD of cases and controls within respective studies.
Effect size estimation
A meta-analysis is “a technique for quantitatively com-bining and integrating the results of multiple studies on a given topic” (Polit and Beck, 2004). Thus, a key aspect of meta-analysis is to measure differences and direction of change from quantitative research studies (Polit and Beck, 2004;Berben et al., 2012). A common metric used to provide this important information is the effect size calculation. Accordingly, to give a statistical expression of the magnitude of the difference between groups (i.e., epileptogenesis vs controls and chronic stage vs controls) in regard of miRNAs expression, we estimated the effect size of each individual study defined as the standardized mean difference (SMD) between cases and controls. The SMD has been calculated using the Hedge’s method with the following formula:
g ⫽ X1 ⫺ X2 ␦
Where X1 is the mean of cases, X2 the mean of the
control group, and␦ is the SD.
Statistical heterogeneity
Different animal models, tissue collection methods, and platforms were used to generate the datasets. This makes it difficult to directly compare the data, the risk being of skewing comparison results, reducing the reliability of measurements of individual miRNA expression changes (Yang et al., 2014). Statistical heterogeneity was assessed using Cochrane meta-regression approach calculated by Q test, I2statistics, and Tau2statistics. These measures were applied at each dataset to assess the overall heter-ogeneity (Higgins et al., 2003;Ioannidis et al., 2007). To test the total variance of each miRNA within the studies, the Cochran Q test have been run, according to the formula: Q ⫽ k共k ⫺ 1兲
兺
T⫺1 k共
xT⫺ N k兲
2兺
i⫺1 b xT共k ⫺ xT兲Where k is the number of the studies included in the meta-analysis, T is the number of variables observed, b is the number of miRNAs included in the test, and N is the total number. A Benjamini-Hochberg (BH) adjusted p⬍ 0.05 was considered statistically significant for the Co-chrane Q test.
Furthermore, I2statistic has been employed to describe
the percentage of the variability in the effect size esti-mates, following the formula:
I2 ⫽
共
Q⫺ df Q兲
*100%Where Q is the value derived from the Cochran Q test and df are the degrees of freedom. Tentatively, I2statistic
can be considered as an indicator of heterogeneity, where low, moderate, and high heterogeneity corresponds to I2
values of 0 – 0.3, 0.3– 0.7, and 0.7–1, respectively (Higgins et al., 2003).
Finally, to estimate the variance across studies the Tau2
has been applied:
Tau2 ⫽ Q⫺ df C
Where Q is the value derived from the Cochran Q test, df are the degrees of freedom and C is a scaling factor which takes into consideration that the Q value is the weighted sum of squares.
Meta-analysis
The presence of statistical heterogeneity among the studies led us to use a random-effect model for the meta-analysis rather than a fixed-effect model. The pooled effect size (PES) for each miRNA was obtained applying the random effect size model based on the DerSimonian and Laird method (DerSimonian and Laird, 1986;DerSimonian and Kacker, 2007). We generated one forest plot for each miRNA in both the epileptogenesis and the chronic phase to depict the SMD along with its 95% confidence interval (95% CI) for individual studies as well as the pooled MD from the meta-analysis.
miRNAs:mRNAs inverse-fold change
miRNAs predominantly act by repressing their target genes by decreasing target mRNA levels (Bartel, 2004;
Guo et al., 2010). Therefore, we investigated the correla-tion of mRNAs predicted targets expression in the avail-able transcriptomic datasets.
To predict miRNA target genes, the miRNA-target in-teractions were analyzed with the web-based tool miR-walk (Dweep et al., 2011; Dweep et al., 2014). The rule that the 5’ region of miRNA from nucleotides 2-8 (“seed region”) has importance in targeting, is commonly ac-cepted as the canonical mechanism by which miRNAs complementary convey functional binding to mRNA tar-gets (Jinek and Doudna, 2009). However, despite the importance of the seed region, the 3’ end of a mRNA also contributes to the binding in ⬃2% of all preferentially conserved sites (Grimson et al., 2007;Shkumatava et al., 2009). In addition, some validated miRNAs have a binding site that exhibits few continuous base pairs in the control region (Shin et al., 2010). Thus, to figure out the complete mechanism of miRNA regulation, we expanded the miRNAs-binding site prediction within the 3’, 5’ untrans-lated regions (UTRs), and the seed sequence, with a minimum seed length of seven nucleotides. Furthermore, to exclude overprediction we applied a comparative anal-ysis by six prediction programs: miRMap, RNA22, mi-Randa, RNAhybrid, PICTAR2, and Targetscan. Following this approach, a candidate mRNA target has to be
iden-tified by all these programs. As we did for the miRNAs, we conducted PubMed search based on the keywords: “gene expression, epilepsy, dentate gyrus.” Two studies were identified that were then included in our analysis (Table 1):Dingledine et al. (2017; GEO repository acces-sion number: GSE47752) andBot et al. (2013; GEO re-pository accession number: GSE49850). The first includes gene expression data obtained from laser-microdissected DG of rats that received different SE models of epilepsy: pilocarpine, self-sustained SE (SSSE), and kainite, it also included kindling, not considered in this study not being a post-SE model. We considered in our analysis only those rats killed 10 d after SE that did not develop spontaneous seizures, as the best time point matching the epileptogen-esis phase used for the miRNAs meta-analysis (7-8 d after SE). InDingledine et al. (2017), the kainate and pilocarpine models were performed in two independent labs, while the SSSE model that was performed in only one lab. For studies undertaken in multiple labs, we combined the p values (obtained from differential expression analysis) from the independent labs using Fisher’s method. The second dataset (GSE49850) was obtained from the same amygdala-stimulated rats used for the miRNA analysis.
To investigate miRNA-mRNA interactions, we included only those mRNAs that had inverse relationship to miRNA changes in at least three datasets in the epileptogenesis phase; while for the chronic phase, we considered all predicted mRNAs that presented an inverse relationship to miRNA changes in the amygdala stimulation dataset only.
miRNA functional enrichment analysis
Functional enrichment analysis using gene ontology (GO) and pathways enrichment analysis based on the Kyoto encyclopedia of genes and genomes (KEGG) data-base were performed using Webgestalt webserver (Zhang et al., 2005; Wang et al., 2013). The enrichment was performed with a hypergeometric test separately for the list of predicted targets based on those miRNAs dysregu-lated in epileptogenesis and in the chronic stage.
Signif-icant canonical pathways maps were selected according to a false discovery rate (FDR)⬍ 5%.
To infer functional relationships between miRNAs iden-tified using meta-analysis, a network of miRNAs based on their ability to target common pathways has been gener-ated. A connection was made between a pair of miRNA, if respective mRNA targets belonged to the same pathways or GO terms that were significantly (FDR⬍ 0.05) enriched for combined miRNA targets. The network was visualizes using Cytoscape version 2.8.2.
Results
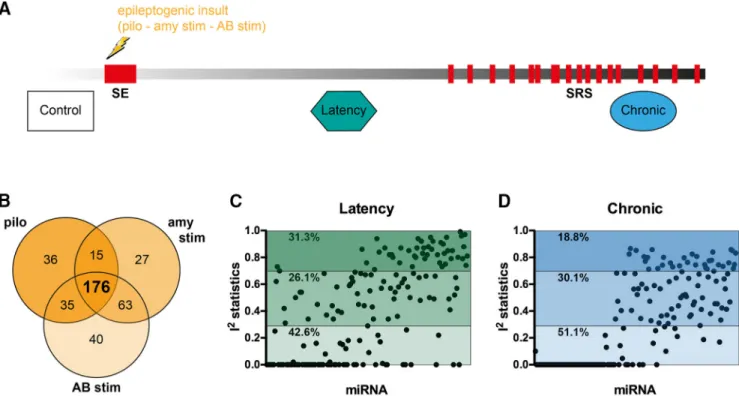
Study designWe included in the meta-analysis all published miRNA expression datasets from dissected DG of the hippocam-pus that compared control (baseline) tissue with tissue from epileptogenesis and chronically epileptic rats (Fig. 2A). Based on these inclusion criteria, we identified three datasets that used different epilepsy models (Table 1): (1) pilocarpine (Roncon et al., 2015), (2) amygdala stim-ulation (Bot et al., 2013), (3) angular bundle stimulation (Gorter et al., 2014). We first calculated the power of each individual study to detect significant changes in miRNA expression and found that all three individual studies were substantially underpowered to detect modest fold changes (⬍2.0) in miRNA expression (Fig. 1). Of the total number of miRNAs expressed at any time point in any of the three models, the expression levels of 176 miRNAs were detectable across all three studies (Fig. 2B). The expression values of these 176 miRNAs were then Z-score transformed and meta-analyzed across the three studies.
Estimation of statistical heterogeneity
Meta-regression analyses were performed separately for epileptogenesis and chronic stages of epilepsy for the 176 miRNAs that were expressed in all three datasets (Fig. 2B). There are two models that are commonly used to perform meta-analysis, the fixed effect and the random effects models. The fixed effect model assumes that the
Figure 1. Power calculation. Power calculation is plotted as the power (y-axis) to detect a miRNA with fold change (x-axis) according
to the percentile of the ranked SDs for miRNAs for each study. Across all three models, the power to detect miRNA with fold change 2 or less falls below 80% for at least 40% of the miRNAs.
effect size is the same in all studies, while the random effects analysis assumes that the effect can vary from one study to another. To determine the correct model for this study, we first estimated statistical heterogeneity using the Cochrane’s Q test, separately for the epileptogenesis and the chronic phase. This revealed significant hetero-geneity between studies at both stages of the disease (BH, adjusted p⬍ 0.05). Next, to assess the proportion of miRNAs that were differentially expressed between stud-ies, during epileptogenesis and the chronic stage sepa-rately, we calculated the I2statistics (Higgins et al., 2003). Of the 176 miRNAs measured across the three studies, 26.14% revealed a high level of heterogeneity: 31.25% a moderate level and 42.61% a low rate of heterogeneity during epileptogenesis (Fig. 2C). In the chronic stage, 18.75% displayed high, 30.11% moderate, and 51.14% low level heterogeneity (Fig. 2C). Collectively, these ob-servations favor the use of the random effects model.
Differential expression of miRNAs in the epileptic DG
Using a random effects meta-analysis of miRNA changes in the three models of epileptogenesis and adopting a stringent correction for multiple testing to minimize false positives (Bonferroni adjusted p⬍ 0.05), we identified 26 and 5 differentially expressed miRNAs between control and latency and between control and chronic epilepsy, respectively. Full results of all these miRNAs including PES estimations, I2, Tau2and p values
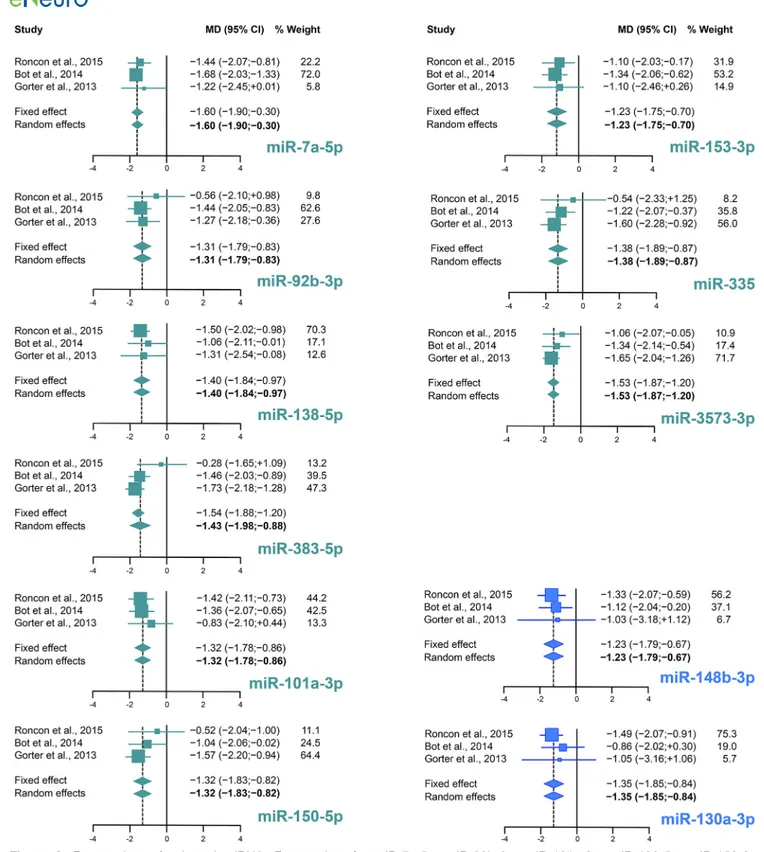
are shown inTables 2,3. Forest plots for selected miRNA are shown inFigure 3. Comparing these results with those
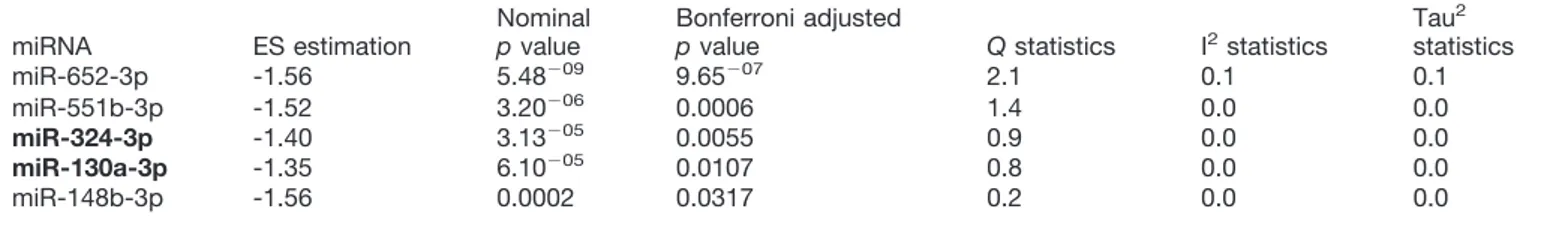
presented in each original studies that have been meta-analyzed here, our meta-analysis identified 11 miRNAs differentially expressed in epileptogenesis compared to control and two miRNAs (i.e., miR-324-3p and miR-130a-3p) in the chronic stage of epilepsy that were not identified as significantly differentially expressed in any of the indi-vidual studies (Tables 2,3, miRNAs highlighted in bold). The datasets employed in this meta-analysis do not allow a precise evaluation of the abundance of expression of these 26 plus five miRNAs under control conditions, but a relative abundance estimate based on the internal stan-dards employed in each study suggests that almost all are expressed at medium to high abundance in the control DG (only miR-212-5p was expressed at relatively low levels but upregulated during epileptogenesis).
Relationship between miRNAs and mRNAs expression changes
Previous transcriptomic studies in epilepsy models have revealed dysregulation of many genes in the differ-ent phases of the experimdiffer-ental disease (Lukasiuk and Pitkänen, 2004). It can be hypothesized that differentially expressed miRNAs may contribute to these alterations (upregulated miRNAs may downregulate their mRNA tar-gets whereas downregulation of miRNAs may allow up-regulation of their mRNA targets). To assess the role of differentially expressed miRNAs during the course of ep-ilepsy, that is, to infer their mRNA regulatory targets, we explored the potential regulatory relationship between miRNA and mRNA changes.
Figure 2. Study design and data preprocessing. A, Study design. B, Venn diagram showing miRNAs commonly expressed between
the three studies included in the meta-analysis. C, Statistical heterogeneity estimation. I2scores of commonly expressed miRNAs (n⫽
176) in epileptogenesis and in chronic stage. miRNAs are ordered based on the adjusted p value after meta-analysis. I2⬍ 0.3, low
heterogeneity; 0.3⬍ I2⬎ 0.7, moderate heterogeneity; I2 ⬎ 0.7, high heterogeneity. SRS, spontaneous recurrent seizures; pilo,
First, to predict miRNA target transcripts we used the miRWalk database (Dweep et al., 2011; Dweep et al., 2014), which combines information across six miRNA target prediction programs (miRMap, RNA22, miRanda, RNAhybrid, PITCAR2 and Targetscan). As expected, this analysis identified a very large number of predicted tar-gets but, obviously, the large majority of these may not be expressed in the DG or may not be expressed in a neg-atively correlated fashion relative to the miRNAs. There-fore, we asked whether the miRNAs that were identified by the meta-analysis as dysregulated in epileptogenesis and in the chronic stage were negatively correlated with changes in DG expression in their predicted mRNA tar-gets. To this end, we took advantage of publicly available gene expression data generated in three separate data-sets that investigated mRNA expression changes in the DG of rats from the epilepsy models used in our meta-analysis: pilocarpine (GEO accession: GSE47752; Dingledine et al., 2017), angular bundle stimulation (called SSSE in this database; GEO accession: GSE47752), and amygdala
stimulation (Bot et al., 2013; PMID: 24146813). Only the amygdala stimulation mRNA dataset (Bot et al., 2013) was obtained from the same animals employed for obtaining the miRNA dataset and included data on the chronic phase. The other datasets were generated by separate research groups on a separate group of animals, the experimental procedures were slightly different from those used in the corresponding miRNAs studies (Gorter et al., 2014;Roncon et al., 2015) and included mRNA data for these models related to the epileptogenesis phase only. In addition, Dingledine et al. (2017) also included datasets for another SE model (kainate) that we also considered in our analysis.
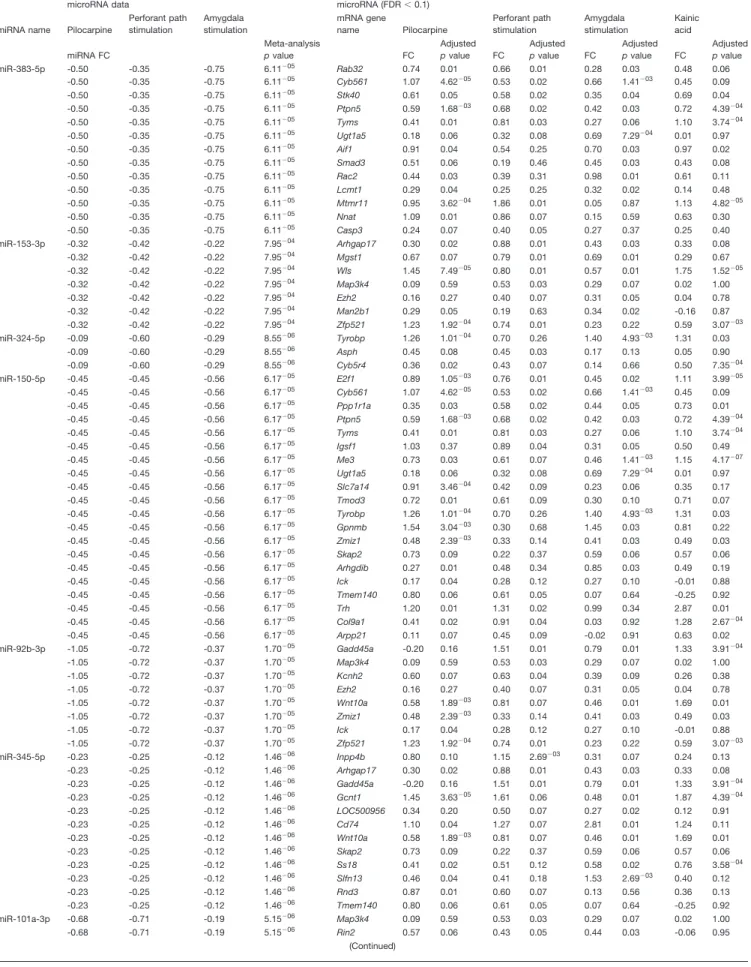
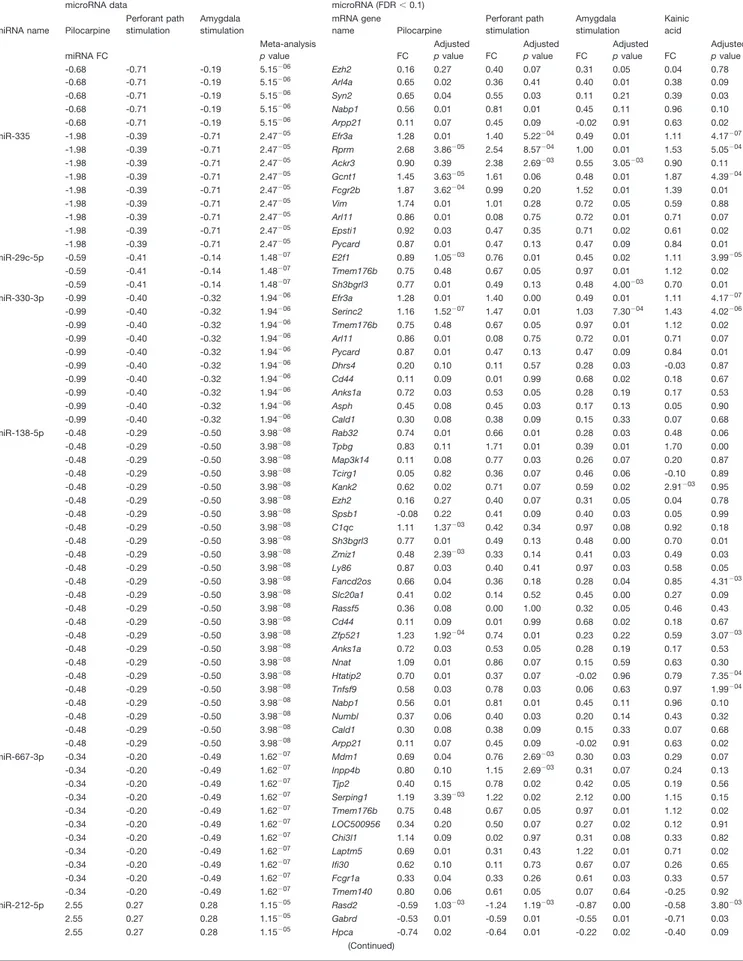
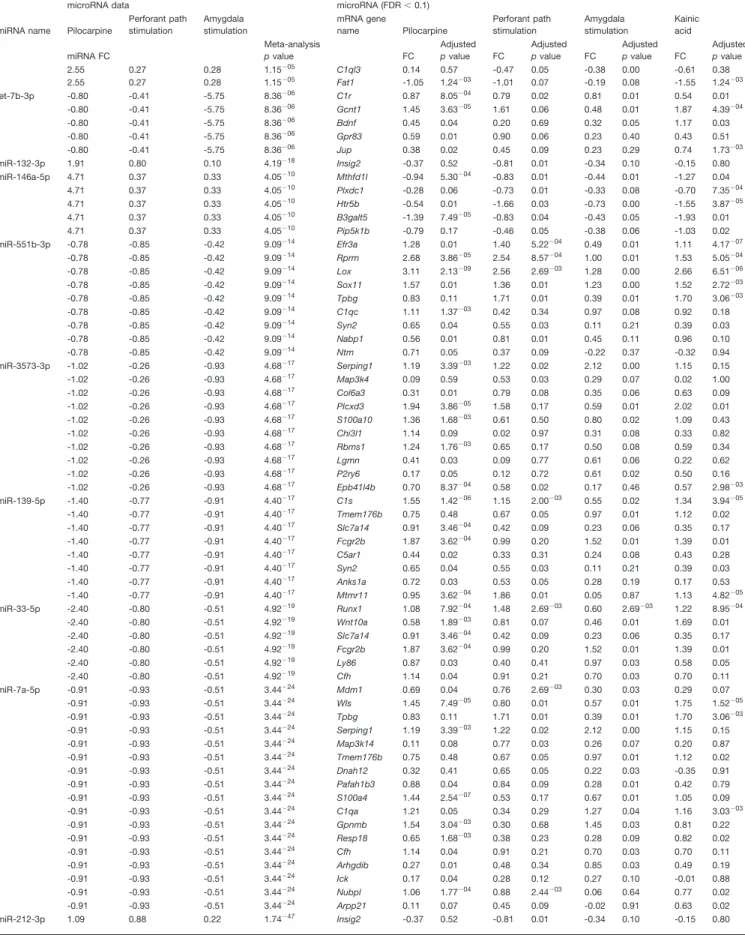
Analysis of the epileptogenesis data identified inverse relationship, based on significant fold changes (gene FDR⬍ 0.1), between 22 (of 26) miRNAs and 122 unique predicted gene targets in at least three of the four epilepsy models of the Dingledine dataset (Dingledine et al., 2017) that we considered in this study (Table 4). The mRNAs encoding the mitogen-activated protein kinase kinase
ki-Table 2. Differentially expressed microRNAs in the epileptogenesis period compared with controls
miRNA ES estimation Nominal p value Bonferroni adjusted
p value Q statistics I2statistics Tau2statistics
miR-212-3p 1.70 6.21⫺16 1.10⫺13 1.59 0.00 0.00 miR-7a-5p -1.60 9.26⫺12 1.64⫺09 0.82 0.00 0.00 miR-33-5p -1.57 9.90⫺12 1.75⫺09 0.22 0.00 0.00 miR-139-5p -1.53 8.34⫺11 1.48⫺08 0.29 0.00 0.00 miR-344b-2-3p 1.25 5.78⫺10 1.02⫺07 1.57 0.00 0.00 miR-3573-3p -1.53 1.32⫺09 2.33⫺07 1.38 0.00 0.00 miR-551b-3p -1.51 2.16⫺09 3.83⫺07 0.51 0.00 0.00 miR-146a-5p 1.75 3.00⫺09 5.31⫺07 2.66 0.25 0.25 miR-132-3p 1.85 1.46⫺08 2.58⫺06 5.28 0.62 0.24 let-7b-3p -1.34 2.46⫺07 4.36⫺05 7.40 0.73 0.42 miR-212-5p 1.36 4.58⫺07 8.11⫺05 0.36 0.00 0.00 let-7d-3p -1.42 9.57⫺07 0.0002 6.75 0.70 0.38 miR-667-3p -1.37 1.01⫺06 0.0002 1.87 0.00 0.00 miR-138-5p -1.40 1.34⫺06 0.0002 0.59 0.00 0.00 miR-330-3p -1.37 1.39⫺06 0.0002 0.17 0.00 0.00 miR-21-5p 1.85 2.65⫺06 0.0005 3.43 0.42 0.17 miR-29c-5p -1.65 5.76⫺06 0.0010 2.91 0.31 0.27 miR-335 -1.38 6.01⫺06 0.0010 1.41 0.00 0.00 miR-101a-3p -1.32 9.17⫺06 0.0016 0.64 0.00 0.00 miR-345-5p -1.29 2.12⫺05 0.0037 1.75 0.00 0.00 miR-92b-3p -1.31 3.12⫺05 0.0055 1.08 0.00 0.00 miR-150-5p -1.32 3.46⫺05 0.0061 1.94 0.00 0.00 miR-136-3p -1.22 3.56⫺05 0.0063 0.66 0.00 0.00 miR-324-5p -1.31 4.63⫺05 0.0082 2.05 0.02 0.08 miR-153-3p -1.23 6.92⫺05 0.0122 0.21 0.00 0.00 miR-383-5p -1.54 0.0002 0.0375 4.00 0.50 0.34
miRNAs in italics are upregulated and miRNAs highlighted in bold were not differentially expressed in individual studies. ES, effect size.
Table 3. Differentially expressed microRNAs in the chronic stage compared with controls
miRNA ES estimation
Nominal
p value
Bonferroni adjusted
p value Q statistics I2statistics
Tau2 statistics miR-652-3p -1.56 5.48⫺09 9.65⫺07 2.1 0.1 0.1 miR-551b-3p -1.52 3.20⫺06 0.0006 1.4 0.0 0.0 miR-324-3p -1.40 3.13⫺05 0.0055 0.9 0.0 0.0 miR-130a-3p -1.35 6.10⫺05 0.0107 0.8 0.0 0.0 miR-148b-3p -1.56 0.0002 0.0317 0.2 0.0 0.0
nase 4 (Map3k4) and the enhancer of zeste 2 polycomb repressive complex 2 subunit (Ezh2) were predicted tar-gets and had inverse expression relative to four miRNAs,
i.e., 92b-3p, 101a-3p, 153-3p, and 3575-3p for Map3k4 and 92b-3p, 101a-3p, miR-138-5p, and miR-153-3p for Ezh2; synapsin type 2 was
Figure 3. Forest plots of selected miRNA. Forest plots for miR-7a-5p, miR-92b-3p, miR-101a-3p, miR-138-5p, miR-150-3p,
153-3p, 335, 383-3p, and 3573-3p are shown for the phase of epileptogenesis, and 130a-3p and miR-148b-3p for the chronic stage. For each miRNA, the effect size of the individual studies is reported as MD and 95% CI. The % weight refers to random effects analysis. Individual effect sizes are represented by colored boxes (green for epileptogenesis and blue for the chronic period) and 95% CI are denoted by black lines. The combined effect sizes are represented by diamonds, where diamond width correspond to the 95% CI bounds; boxes and diamonds size is proportional to effect size estimation precision. For each miRNA, the weight of the dataset in the combined analysis has been reported in percentage.
Table 4. miRNA-mRNA fold changes inverse correlation in epileptogenesis
miRNA name
microRNA data
mRNA targets of respective microRNA (FDR⬍ 0.1) Pilocarpine Perforant path stimulation Amygdala stimulation mRNA gene name Pilocarpine Perforant path stimulation Amygdala stimulation Kainic acid miRNA FC Meta-analysis p value FC Adjusted p value FC Adjusted p value FC Adjusted p value FC Adjusted p value miR-383-5p -0.50 -0.35 -0.75 6.11⫺05 Rab32 0.74 0.01 0.66 0.01 0.28 0.03 0.48 0.06 -0.50 -0.35 -0.75 6.11⫺05 Cyb561 1.07 4.62⫺05 0.53 0.02 0.66 1.41⫺03 0.45 0.09 -0.50 -0.35 -0.75 6.11⫺05 Stk40 0.61 0.05 0.58 0.02 0.35 0.04 0.69 0.04 -0.50 -0.35 -0.75 6.11⫺05 Ptpn5 0.59 1.68⫺03 0.68 0.02 0.42 0.03 0.72 4.39⫺04 -0.50 -0.35 -0.75 6.11⫺05 Tyms 0.41 0.01 0.81 0.03 0.27 0.06 1.10 3.74⫺04 -0.50 -0.35 -0.75 6.11⫺05 Ugt1a5 0.18 0.06 0.32 0.08 0.69 7.29⫺04 0.01 0.97 -0.50 -0.35 -0.75 6.11⫺05 Aif1 0.91 0.04 0.54 0.25 0.70 0.03 0.97 0.02 -0.50 -0.35 -0.75 6.11⫺05 Smad3 0.51 0.06 0.19 0.46 0.45 0.03 0.43 0.08 -0.50 -0.35 -0.75 6.11⫺05 Rac2 0.44 0.03 0.39 0.31 0.98 0.01 0.61 0.11 -0.50 -0.35 -0.75 6.11⫺05 Lcmt1 0.29 0.04 0.25 0.25 0.32 0.02 0.14 0.48 -0.50 -0.35 -0.75 6.11⫺05 Mtmr11 0.95 3.62⫺04 1.86 0.01 0.05 0.87 1.13 4.82⫺05 -0.50 -0.35 -0.75 6.11⫺05 Nnat 1.09 0.01 0.86 0.07 0.15 0.59 0.63 0.30 -0.50 -0.35 -0.75 6.11⫺05 Casp3 0.24 0.07 0.40 0.05 0.27 0.37 0.25 0.40 miR-153-3p -0.32 -0.42 -0.22 7.95⫺04 Arhgap17 0.30 0.02 0.88 0.01 0.43 0.03 0.33 0.08 -0.32 -0.42 -0.22 7.95⫺04 Mgst1 0.67 0.07 0.79 0.01 0.69 0.01 0.29 0.67 -0.32 -0.42 -0.22 7.95⫺04 Wls 1.45 7.49⫺05 0.80 0.01 0.57 0.01 1.75 1.52⫺05 -0.32 -0.42 -0.22 7.95⫺04 Map3k4 0.09 0.59 0.53 0.03 0.29 0.07 0.02 1.00 -0.32 -0.42 -0.22 7.95⫺04 Ezh2 0.16 0.27 0.40 0.07 0.31 0.05 0.04 0.78 -0.32 -0.42 -0.22 7.95⫺04 Man2b1 0.29 0.05 0.19 0.63 0.34 0.02 -0.16 0.87 -0.32 -0.42 -0.22 7.95⫺04 Zfp521 1.23 1.92⫺04 0.74 0.01 0.23 0.22 0.59 3.07⫺03 miR-324-5p -0.09 -0.60 -0.29 8.55⫺06 Tyrobp 1.26 1.01⫺04 0.70 0.26 1.40 4.93⫺03 1.31 0.03 -0.09 -0.60 -0.29 8.55⫺06 Asph 0.45 0.08 0.45 0.03 0.17 0.13 0.05 0.90 -0.09 -0.60 -0.29 8.55⫺06 Cyb5r4 0.36 0.02 0.43 0.07 0.14 0.66 0.50 7.35⫺04 miR-150-5p -0.45 -0.45 -0.56 6.17⫺05 E2f1 0.89 1.05⫺03 0.76 0.01 0.45 0.02 1.11 3.99⫺05 -0.45 -0.45 -0.56 6.17⫺05 Cyb561 1.07 4.62⫺05 0.53 0.02 0.66 1.41⫺03 0.45 0.09 -0.45 -0.45 -0.56 6.17⫺05 Ppp1r1a 0.35 0.03 0.58 0.02 0.44 0.05 0.73 0.01 -0.45 -0.45 -0.56 6.17⫺05 Ptpn5 0.59 1.68⫺03 0.68 0.02 0.42 0.03 0.72 4.39⫺04 -0.45 -0.45 -0.56 6.17⫺05 Tyms 0.41 0.01 0.81 0.03 0.27 0.06 1.10 3.74⫺04 -0.45 -0.45 -0.56 6.17⫺05 Igsf1 1.03 0.37 0.89 0.04 0.31 0.05 0.50 0.49 -0.45 -0.45 -0.56 6.17⫺05 Me3 0.73 0.03 0.61 0.07 0.46 1.41⫺03 1.15 4.17⫺07 -0.45 -0.45 -0.56 6.17⫺05 Ugt1a5 0.18 0.06 0.32 0.08 0.69 7.29⫺04 0.01 0.97 -0.45 -0.45 -0.56 6.17⫺05 Slc7a14 0.91 3.46⫺04 0.42 0.09 0.23 0.06 0.35 0.17 -0.45 -0.45 -0.56 6.17⫺05 Tmod3 0.72 0.01 0.61 0.09 0.30 0.10 0.71 0.07 -0.45 -0.45 -0.56 6.17⫺05 Tyrobp 1.26 1.01⫺04 0.70 0.26 1.40 4.93⫺03 1.31 0.03 -0.45 -0.45 -0.56 6.17⫺05 Gpnmb 1.54 3.04⫺03 0.30 0.68 1.45 0.03 0.81 0.22 -0.45 -0.45 -0.56 6.17⫺05 Zmiz1 0.48 2.39⫺03 0.33 0.14 0.41 0.03 0.49 0.03 -0.45 -0.45 -0.56 6.17⫺05 Skap2 0.73 0.09 0.22 0.37 0.59 0.06 0.57 0.06 -0.45 -0.45 -0.56 6.17⫺05 Arhgdib 0.27 0.01 0.48 0.34 0.85 0.03 0.49 0.19 -0.45 -0.45 -0.56 6.17⫺05 Ick 0.17 0.04 0.28 0.12 0.27 0.10 -0.01 0.88 -0.45 -0.45 -0.56 6.17⫺05 Tmem140 0.80 0.06 0.61 0.05 0.07 0.64 -0.25 0.92 -0.45 -0.45 -0.56 6.17⫺05 Trh 1.20 0.01 1.31 0.02 0.99 0.34 2.87 0.01 -0.45 -0.45 -0.56 6.17⫺05 Col9a1 0.41 0.02 0.91 0.04 0.03 0.92 1.28 2.67⫺04 -0.45 -0.45 -0.56 6.17⫺05 Arpp21 0.11 0.07 0.45 0.09 -0.02 0.91 0.63 0.02 miR-92b-3p -1.05 -0.72 -0.37 1.70⫺05 Gadd45a -0.20 0.16 1.51 0.01 0.79 0.01 1.33 3.91⫺04 -1.05 -0.72 -0.37 1.70⫺05 Map3k4 0.09 0.59 0.53 0.03 0.29 0.07 0.02 1.00 -1.05 -0.72 -0.37 1.70⫺05 Kcnh2 0.60 0.07 0.63 0.04 0.39 0.09 0.26 0.38 -1.05 -0.72 -0.37 1.70⫺05 Ezh2 0.16 0.27 0.40 0.07 0.31 0.05 0.04 0.78 -1.05 -0.72 -0.37 1.70⫺05 Wnt10a 0.58 1.89⫺03 0.81 0.07 0.46 0.01 1.69 0.01 -1.05 -0.72 -0.37 1.70⫺05 Zmiz1 0.48 2.39⫺03 0.33 0.14 0.41 0.03 0.49 0.03 -1.05 -0.72 -0.37 1.70⫺05 Ick 0.17 0.04 0.28 0.12 0.27 0.10 -0.01 0.88 -1.05 -0.72 -0.37 1.70⫺05 Zfp521 1.23 1.92⫺04 0.74 0.01 0.23 0.22 0.59 3.07⫺03 miR-345-5p -0.23 -0.25 -0.12 1.46⫺06 Inpp4b 0.80 0.10 1.15 2.69⫺03 0.31 0.07 0.24 0.13 -0.23 -0.25 -0.12 1.46⫺06 Arhgap17 0.30 0.02 0.88 0.01 0.43 0.03 0.33 0.08 -0.23 -0.25 -0.12 1.46⫺06 Gadd45a -0.20 0.16 1.51 0.01 0.79 0.01 1.33 3.91⫺04 -0.23 -0.25 -0.12 1.46⫺06 Gcnt1 1.45 3.63⫺05 1.61 0.06 0.48 0.01 1.87 4.39⫺04 -0.23 -0.25 -0.12 1.46⫺06 LOC500956 0.34 0.20 0.50 0.07 0.27 0.02 0.12 0.91 -0.23 -0.25 -0.12 1.46⫺06 Cd74 1.10 0.04 1.27 0.07 2.81 0.01 1.24 0.11 -0.23 -0.25 -0.12 1.46⫺06 Wnt10a 0.58 1.89⫺03 0.81 0.07 0.46 0.01 1.69 0.01 -0.23 -0.25 -0.12 1.46⫺06 Skap2 0.73 0.09 0.22 0.37 0.59 0.06 0.57 0.06 -0.23 -0.25 -0.12 1.46⫺06 Ss18 0.41 0.02 0.51 0.12 0.58 0.02 0.76 3.58⫺04 -0.23 -0.25 -0.12 1.46⫺06 Slfn13 0.46 0.04 0.41 0.18 1.53 2.69⫺03 0.40 0.12 -0.23 -0.25 -0.12 1.46⫺06 Rnd3 0.87 0.01 0.60 0.07 0.13 0.56 0.36 0.13 -0.23 -0.25 -0.12 1.46⫺06 Tmem140 0.80 0.06 0.61 0.05 0.07 0.64 -0.25 0.92 miR-101a-3p -0.68 -0.71 -0.19 5.15⫺06 Map3k4 0.09 0.59 0.53 0.03 0.29 0.07 0.02 1.00 -0.68 -0.71 -0.19 5.15⫺06 Rin2 0.57 0.06 0.43 0.05 0.44 0.03 -0.06 0.95 (Continued)
Table 4. Continued
miRNA name
microRNA data
mRNA targets of respective microRNA (FDR⬍ 0.1) Pilocarpine Perforant path stimulation Amygdala stimulation mRNA gene name Pilocarpine Perforant path stimulation Amygdala stimulation Kainic acid miRNA FC Meta-analysis p value FC Adjusted p value FC Adjusted p value FC Adjusted p value FC Adjusted p value -0.68 -0.71 -0.19 5.15⫺06 Ezh2 0.16 0.27 0.40 0.07 0.31 0.05 0.04 0.78 -0.68 -0.71 -0.19 5.15⫺06 Arl4a 0.65 0.02 0.36 0.41 0.40 0.01 0.38 0.09 -0.68 -0.71 -0.19 5.15⫺06 Syn2 0.65 0.04 0.55 0.03 0.11 0.21 0.39 0.03 -0.68 -0.71 -0.19 5.15⫺06 Nabp1 0.56 0.01 0.81 0.01 0.45 0.11 0.96 0.10 -0.68 -0.71 -0.19 5.15⫺06 Arpp21 0.11 0.07 0.45 0.09 -0.02 0.91 0.63 0.02 miR-335 -1.98 -0.39 -0.71 2.47⫺05 Efr3a 1.28 0.01 1.40 5.22⫺04 0.49 0.01 1.11 4.17⫺07 -1.98 -0.39 -0.71 2.47⫺05 Rprm 2.68 3.86⫺05 2.54 8.57⫺04 1.00 0.01 1.53 5.05⫺04 -1.98 -0.39 -0.71 2.47⫺05 Ackr3 0.90 0.39 2.38 2.69⫺03 0.55 3.05⫺03 0.90 0.11 -1.98 -0.39 -0.71 2.47⫺05 Gcnt1 1.45 3.63⫺05 1.61 0.06 0.48 0.01 1.87 4.39⫺04 -1.98 -0.39 -0.71 2.47⫺05 Fcgr2b 1.87 3.62⫺04 0.99 0.20 1.52 0.01 1.39 0.01 -1.98 -0.39 -0.71 2.47⫺05 Vim 1.74 0.01 1.01 0.28 0.72 0.05 0.59 0.88 -1.98 -0.39 -0.71 2.47⫺05 Arl11 0.86 0.01 0.08 0.75 0.72 0.01 0.71 0.07 -1.98 -0.39 -0.71 2.47⫺05 Epsti1 0.92 0.03 0.47 0.35 0.71 0.02 0.61 0.02 -1.98 -0.39 -0.71 2.47⫺05 Pycard 0.87 0.01 0.47 0.13 0.47 0.09 0.84 0.01 miR-29c-5p -0.59 -0.41 -0.14 1.48⫺07 E2f1 0.89 1.05⫺03 0.76 0.01 0.45 0.02 1.11 3.99⫺05 -0.59 -0.41 -0.14 1.48⫺07 Tmem176b 0.75 0.48 0.67 0.05 0.97 0.01 1.12 0.02 -0.59 -0.41 -0.14 1.48⫺07 Sh3bgrl3 0.77 0.01 0.49 0.13 0.48 4.00⫺03 0.70 0.01 miR-330-3p -0.99 -0.40 -0.32 1.94⫺06 Efr3a 1.28 0.01 1.40 0.00 0.49 0.01 1.11 4.17⫺07 -0.99 -0.40 -0.32 1.94⫺06 Serinc2 1.16 1.52⫺07 1.47 0.01 1.03 7.30⫺04 1.43 4.02⫺06 -0.99 -0.40 -0.32 1.94⫺06 Tmem176b 0.75 0.48 0.67 0.05 0.97 0.01 1.12 0.02 -0.99 -0.40 -0.32 1.94⫺06 Arl11 0.86 0.01 0.08 0.75 0.72 0.01 0.71 0.07 -0.99 -0.40 -0.32 1.94⫺06 Pycard 0.87 0.01 0.47 0.13 0.47 0.09 0.84 0.01 -0.99 -0.40 -0.32 1.94⫺06 Dhrs4 0.20 0.10 0.11 0.57 0.28 0.03 -0.03 0.87 -0.99 -0.40 -0.32 1.94⫺06 Cd44 0.11 0.09 0.01 0.99 0.68 0.02 0.18 0.67 -0.99 -0.40 -0.32 1.94⫺06 Anks1a 0.72 0.03 0.53 0.05 0.28 0.19 0.17 0.53 -0.99 -0.40 -0.32 1.94⫺06 Asph 0.45 0.08 0.45 0.03 0.17 0.13 0.05 0.90 -0.99 -0.40 -0.32 1.94⫺06 Cald1 0.30 0.08 0.38 0.09 0.15 0.33 0.07 0.68 miR-138-5p -0.48 -0.29 -0.50 3.98⫺08 Rab32 0.74 0.01 0.66 0.01 0.28 0.03 0.48 0.06 -0.48 -0.29 -0.50 3.98⫺08 Tpbg 0.83 0.11 1.71 0.01 0.39 0.01 1.70 0.00 -0.48 -0.29 -0.50 3.98⫺08 Map3k14 0.11 0.08 0.77 0.03 0.26 0.07 0.20 0.87 -0.48 -0.29 -0.50 3.98⫺08 Tcirg1 0.05 0.82 0.36 0.07 0.46 0.06 -0.10 0.89 -0.48 -0.29 -0.50 3.98⫺08 Kank2 0.62 0.02 0.71 0.07 0.59 0.02 2.91⫺03 0.95 -0.48 -0.29 -0.50 3.98⫺08 Ezh2 0.16 0.27 0.40 0.07 0.31 0.05 0.04 0.78 -0.48 -0.29 -0.50 3.98⫺08 Spsb1 -0.08 0.22 0.41 0.09 0.40 0.03 0.05 0.99 -0.48 -0.29 -0.50 3.98⫺08 C1qc 1.11 1.37⫺03 0.42 0.34 0.97 0.08 0.92 0.18 -0.48 -0.29 -0.50 3.98⫺08 Sh3bgrl3 0.77 0.01 0.49 0.13 0.48 0.00 0.70 0.01 -0.48 -0.29 -0.50 3.98⫺08 Zmiz1 0.48 2.39⫺03 0.33 0.14 0.41 0.03 0.49 0.03 -0.48 -0.29 -0.50 3.98⫺08 Ly86 0.87 0.03 0.40 0.41 0.97 0.03 0.58 0.05 -0.48 -0.29 -0.50 3.98⫺08 Fancd2os 0.66 0.04 0.36 0.18 0.28 0.04 0.85 4.31⫺03 -0.48 -0.29 -0.50 3.98⫺08 Slc20a1 0.41 0.02 0.14 0.52 0.45 0.00 0.27 0.09 -0.48 -0.29 -0.50 3.98⫺08 Rassf5 0.36 0.08 0.00 1.00 0.32 0.05 0.46 0.43 -0.48 -0.29 -0.50 3.98⫺08 Cd44 0.11 0.09 0.01 0.99 0.68 0.02 0.18 0.67 -0.48 -0.29 -0.50 3.98⫺08 Zfp521 1.23 1.92⫺04 0.74 0.01 0.23 0.22 0.59 3.07⫺03 -0.48 -0.29 -0.50 3.98⫺08 Anks1a 0.72 0.03 0.53 0.05 0.28 0.19 0.17 0.53 -0.48 -0.29 -0.50 3.98⫺08 Nnat 1.09 0.01 0.86 0.07 0.15 0.59 0.63 0.30 -0.48 -0.29 -0.50 3.98⫺08 Htatip2 0.70 0.01 0.37 0.07 -0.02 0.96 0.79 7.35⫺04 -0.48 -0.29 -0.50 3.98⫺08 Tnfsf9 0.58 0.03 0.78 0.03 0.06 0.63 0.97 1.99⫺04 -0.48 -0.29 -0.50 3.98⫺08 Nabp1 0.56 0.01 0.81 0.01 0.45 0.11 0.96 0.10 -0.48 -0.29 -0.50 3.98⫺08 Numbl 0.37 0.06 0.40 0.03 0.20 0.14 0.43 0.32 -0.48 -0.29 -0.50 3.98⫺08 Cald1 0.30 0.08 0.38 0.09 0.15 0.33 0.07 0.68 -0.48 -0.29 -0.50 3.98⫺08 Arpp21 0.11 0.07 0.45 0.09 -0.02 0.91 0.63 0.02 miR-667-3p -0.34 -0.20 -0.49 1.62⫺07 Mdm1 0.69 0.04 0.76 2.69⫺03 0.30 0.03 0.29 0.07 -0.34 -0.20 -0.49 1.62⫺07 Inpp4b 0.80 0.10 1.15 2.69⫺03 0.31 0.07 0.24 0.13 -0.34 -0.20 -0.49 1.62⫺07 Tjp2 0.40 0.15 0.78 0.02 0.42 0.05 0.19 0.56 -0.34 -0.20 -0.49 1.62⫺07 Serping1 1.19 3.39⫺03 1.22 0.02 2.12 0.00 1.15 0.15 -0.34 -0.20 -0.49 1.62⫺07 Tmem176b 0.75 0.48 0.67 0.05 0.97 0.01 1.12 0.02 -0.34 -0.20 -0.49 1.62⫺07 LOC500956 0.34 0.20 0.50 0.07 0.27 0.02 0.12 0.91 -0.34 -0.20 -0.49 1.62⫺07 Chi3l1 1.14 0.09 0.02 0.97 0.31 0.08 0.33 0.82 -0.34 -0.20 -0.49 1.62⫺07 Laptm5 0.69 0.01 0.31 0.43 1.22 0.01 0.71 0.02 -0.34 -0.20 -0.49 1.62⫺07 Ifi30 0.62 0.10 0.11 0.73 0.67 0.07 0.26 0.65 -0.34 -0.20 -0.49 1.62⫺07 Fcgr1a 0.33 0.04 0.33 0.26 0.61 0.03 0.33 0.57 -0.34 -0.20 -0.49 1.62⫺07 Tmem140 0.80 0.06 0.61 0.05 0.07 0.64 -0.25 0.92 miR-212-5p 2.55 0.27 0.28 1.15⫺05 Rasd2 -0.59 1.03⫺03 -1.24 1.19⫺03 -0.87 0.00 -0.58 3.80⫺03 2.55 0.27 0.28 1.15⫺05 Gabrd -0.53 0.01 -0.59 0.01 -0.55 0.01 -0.71 0.03 2.55 0.27 0.28 1.15⫺05 Hpca -0.74 0.02 -0.64 0.01 -0.22 0.02 -0.40 0.09 (Continued)
Table 4. Continued
miRNA name
microRNA data
mRNA targets of respective microRNA (FDR⬍ 0.1) Pilocarpine Perforant path stimulation Amygdala stimulation mRNA gene name Pilocarpine Perforant path stimulation Amygdala stimulation Kainic acid miRNA FC Meta-analysis p value FC Adjusted p value FC Adjusted p value FC Adjusted p value FC Adjusted p value 2.55 0.27 0.28 1.15⫺05 C1ql3 0.14 0.57 -0.47 0.05 -0.38 0.00 -0.61 0.38 2.55 0.27 0.28 1.15⫺05 Fat1 -1.05 1.24⫺03 -1.01 0.07 -0.19 0.08 -1.55 1.24⫺03 let-7b-3p -0.80 -0.41 -5.75 8.36⫺06 C1r 0.87 8.05⫺04 0.79 0.02 0.81 0.01 0.54 0.01 -0.80 -0.41 -5.75 8.36⫺06 Gcnt1 1.45 3.63⫺05 1.61 0.06 0.48 0.01 1.87 4.39⫺04 -0.80 -0.41 -5.75 8.36⫺06 Bdnf 0.45 0.04 0.20 0.69 0.32 0.05 1.17 0.03 -0.80 -0.41 -5.75 8.36⫺06 Gpr83 0.59 0.01 0.90 0.06 0.23 0.40 0.43 0.51 -0.80 -0.41 -5.75 8.36⫺06 Jup 0.38 0.02 0.45 0.09 0.23 0.29 0.74 1.73⫺03 miR-132-3p 1.91 0.80 0.10 4.19⫺18 Insig2 -0.37 0.52 -0.81 0.01 -0.34 0.10 -0.15 0.80 miR-146a-5p 4.71 0.37 0.33 4.05⫺10 Mthfd1l -0.94 5.30⫺04 -0.83 0.01 -0.44 0.01 -1.27 0.04 4.71 0.37 0.33 4.05⫺10 Plxdc1 -0.28 0.06 -0.73 0.01 -0.33 0.08 -0.70 7.35⫺04 4.71 0.37 0.33 4.05⫺10 Htr5b -0.54 0.01 -1.66 0.03 -0.73 0.00 -1.55 3.87⫺05 4.71 0.37 0.33 4.05⫺10 B3galt5 -1.39 7.49⫺05 -0.83 0.04 -0.43 0.05 -1.93 0.01 4.71 0.37 0.33 4.05⫺10 Pip5k1b -0.79 0.17 -0.46 0.05 -0.38 0.06 -1.03 0.02 miR-551b-3p -0.78 -0.85 -0.42 9.09⫺14 Efr3a 1.28 0.01 1.40 5.22⫺04 0.49 0.01 1.11 4.17⫺07 -0.78 -0.85 -0.42 9.09⫺14 Rprm 2.68 3.86⫺05 2.54 8.57⫺04 1.00 0.01 1.53 5.05⫺04 -0.78 -0.85 -0.42 9.09⫺14 Lox 3.11 2.13⫺09 2.56 2.69⫺03 1.28 0.00 2.66 6.51⫺06 -0.78 -0.85 -0.42 9.09⫺14 Sox11 1.57 0.01 1.36 0.01 1.23 0.00 1.52 2.72⫺03 -0.78 -0.85 -0.42 9.09⫺14 Tpbg 0.83 0.11 1.71 0.01 0.39 0.01 1.70 3.06⫺03 -0.78 -0.85 -0.42 9.09⫺14 C1qc 1.11 1.37⫺03 0.42 0.34 0.97 0.08 0.92 0.18 -0.78 -0.85 -0.42 9.09⫺14 Syn2 0.65 0.04 0.55 0.03 0.11 0.21 0.39 0.03 -0.78 -0.85 -0.42 9.09⫺14 Nabp1 0.56 0.01 0.81 0.01 0.45 0.11 0.96 0.10 -0.78 -0.85 -0.42 9.09⫺14 Ntm 0.71 0.05 0.37 0.09 -0.22 0.37 -0.32 0.94 miR-3573-3p -1.02 -0.26 -0.93 4.68⫺17 Serping1 1.19 3.39⫺03 1.22 0.02 2.12 0.00 1.15 0.15 -1.02 -0.26 -0.93 4.68⫺17 Map3k4 0.09 0.59 0.53 0.03 0.29 0.07 0.02 1.00 -1.02 -0.26 -0.93 4.68⫺17 Col6a3 0.31 0.01 0.79 0.08 0.35 0.06 0.63 0.09 -1.02 -0.26 -0.93 4.68⫺17 Plcxd3 1.94 3.86⫺05 1.58 0.17 0.59 0.01 2.02 0.01 -1.02 -0.26 -0.93 4.68⫺17 S100a10 1.36 1.68⫺03 0.61 0.50 0.80 0.02 1.09 0.43 -1.02 -0.26 -0.93 4.68⫺17 Chi3l1 1.14 0.09 0.02 0.97 0.31 0.08 0.33 0.82 -1.02 -0.26 -0.93 4.68⫺17 Rbms1 1.24 1.76⫺03 0.65 0.17 0.50 0.08 0.59 0.34 -1.02 -0.26 -0.93 4.68⫺17 Lgmn 0.41 0.03 0.09 0.77 0.61 0.06 0.22 0.62 -1.02 -0.26 -0.93 4.68⫺17 P2ry6 0.17 0.05 0.12 0.72 0.61 0.02 0.50 0.16 -1.02 -0.26 -0.93 4.68⫺17 Epb41l4b 0.70 8.37⫺04 0.58 0.02 0.17 0.46 0.57 2.98⫺03 miR-139-5p -1.40 -0.77 -0.91 4.40⫺17 C1s 1.55 1.42⫺06 1.15 2.00⫺03 0.55 0.02 1.34 3.94⫺05 -1.40 -0.77 -0.91 4.40⫺17 Tmem176b 0.75 0.48 0.67 0.05 0.97 0.01 1.12 0.02 -1.40 -0.77 -0.91 4.40⫺17 Slc7a14 0.91 3.46⫺04 0.42 0.09 0.23 0.06 0.35 0.17 -1.40 -0.77 -0.91 4.40⫺17 Fcgr2b 1.87 3.62⫺04 0.99 0.20 1.52 0.01 1.39 0.01 -1.40 -0.77 -0.91 4.40⫺17 C5ar1 0.44 0.02 0.33 0.31 0.24 0.08 0.43 0.28 -1.40 -0.77 -0.91 4.40⫺17 Syn2 0.65 0.04 0.55 0.03 0.11 0.21 0.39 0.03 -1.40 -0.77 -0.91 4.40⫺17 Anks1a 0.72 0.03 0.53 0.05 0.28 0.19 0.17 0.53 -1.40 -0.77 -0.91 4.40⫺17 Mtmr11 0.95 3.62⫺04 1.86 0.01 0.05 0.87 1.13 4.82⫺05 miR-33-5p -2.40 -0.80 -0.51 4.92⫺19 Runx1 1.08 7.92⫺04 1.48 2.69⫺03 0.60 2.69⫺03 1.22 8.95⫺04 -2.40 -0.80 -0.51 4.92⫺19 Wnt10a 0.58 1.89⫺03 0.81 0.07 0.46 0.01 1.69 0.01 -2.40 -0.80 -0.51 4.92⫺19 Slc7a14 0.91 3.46⫺04 0.42 0.09 0.23 0.06 0.35 0.17 -2.40 -0.80 -0.51 4.92⫺19 Fcgr2b 1.87 3.62⫺04 0.99 0.20 1.52 0.01 1.39 0.01 -2.40 -0.80 -0.51 4.92⫺19 Ly86 0.87 0.03 0.40 0.41 0.97 0.03 0.58 0.05 -2.40 -0.80 -0.51 4.92⫺19 Cfh 1.14 0.04 0.91 0.21 0.70 0.03 0.70 0.11 miR-7a-5p -0.91 -0.93 -0.51 3.44⫺24 Mdm1 0.69 0.04 0.76 2.69⫺03 0.30 0.03 0.29 0.07 -0.91 -0.93 -0.51 3.44⫺24 Wls 1.45 7.49⫺05 0.80 0.01 0.57 0.01 1.75 1.52⫺05 -0.91 -0.93 -0.51 3.44⫺24 Tpbg 0.83 0.11 1.71 0.01 0.39 0.01 1.70 3.06⫺03 -0.91 -0.93 -0.51 3.44⫺24 Serping1 1.19 3.39⫺03 1.22 0.02 2.12 0.00 1.15 0.15 -0.91 -0.93 -0.51 3.44⫺24 Map3k14 0.11 0.08 0.77 0.03 0.26 0.07 0.20 0.87 -0.91 -0.93 -0.51 3.44⫺24 Tmem176b 0.75 0.48 0.67 0.05 0.97 0.01 1.12 0.02 -0.91 -0.93 -0.51 3.44⫺24 Dnah12 0.32 0.41 0.65 0.05 0.22 0.03 -0.35 0.91 -0.91 -0.93 -0.51 3.44⫺24 Pafah1b3 0.88 0.04 0.84 0.09 0.28 0.01 0.42 0.79 -0.91 -0.93 -0.51 3.44⫺24 S100a4 1.44 2.54⫺07 0.53 0.17 0.67 0.01 1.05 0.09 -0.91 -0.93 -0.51 3.44⫺24 C1qa 1.21 0.05 0.34 0.29 1.27 0.04 1.16 3.03⫺03 -0.91 -0.93 -0.51 3.44⫺24 Gpnmb 1.54 3.04⫺03 0.30 0.68 1.45 0.03 0.81 0.22 -0.91 -0.93 -0.51 3.44⫺24 Resp18 0.65 1.68⫺03 0.38 0.23 0.28 0.09 0.82 0.02 -0.91 -0.93 -0.51 3.44⫺24 Cfh 1.14 0.04 0.91 0.21 0.70 0.03 0.70 0.11 -0.91 -0.93 -0.51 3.44⫺24 Arhgdib 0.27 0.01 0.48 0.34 0.85 0.03 0.49 0.19 -0.91 -0.93 -0.51 3.44⫺24 Ick 0.17 0.04 0.28 0.12 0.27 0.10 -0.01 0.88 -0.91 -0.93 -0.51 3.44⫺24 Nubpl 1.06 1.77⫺04 0.88 2.44⫺03 0.06 0.64 0.77 0.02 -0.91 -0.93 -0.51 3.44⫺24 Arpp21 0.11 0.07 0.45 0.09 -0.02 0.91 0.63 0.02 miR-212-3p 1.09 0.88 0.22 1.74⫺47 Insig2 -0.37 0.52 -0.81 0.01 -0.34 0.10 -0.15 0.80
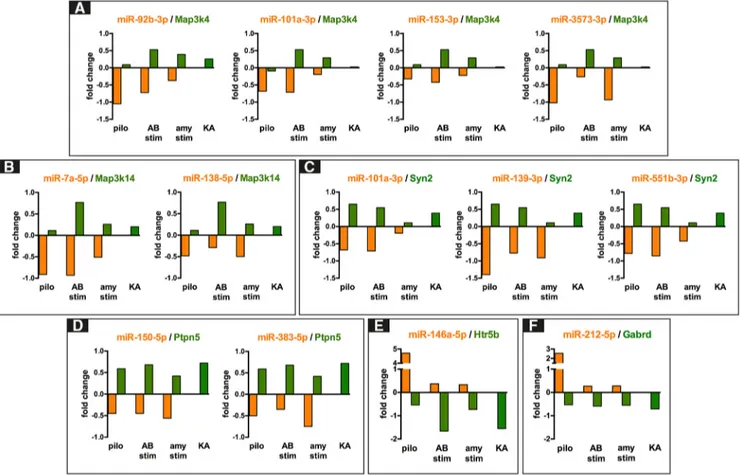
inversely correlated to three miRNAs (101a-3p, miR-139-5p, and miR-551b-3p); the mitogen-activated protein kinase kinase kinase 14 (Map3k14) and the protein tyrosine phosphatase, nonreceptor type 5 (Ptpn5) were inversely correlated with two miRNAs, i.e., 7a-5p and miR-138-5p for Map3k14; miR-150-5p and miR-383-5p for
Ptpn5. All the above transcripts were upregulated during
epileptogenesis and predicted targets of miRNAs that were downregulated. In contrast, miR-132-3p, miR-146a-5p, miR-212-3p, and miR-212-5p were upregulated during epi-leptogenesis. The 5-hydroxytryptamine receptor 5 (Htr5b) and the -1,3-galactosyltransferase 5 (B3galt5) were pre-dicted targets of miR-146a-5p and were downregulated. The ␥-aminobutiric acid receptor subunit ␦ (Gabrd) was a predicted target of and inversely correlated with miR-212-5p. Finally, we observed that miR-344b-2-3p, let-7d-3p, miR-21-5p, miR-29c-5p, and miR-324-5p were not anticor-related with any of their predicted mRNA targets. Represen-tative graphs for the anticorrelations between miRNAs and predicted mRNA targets are shown inFigure 4.
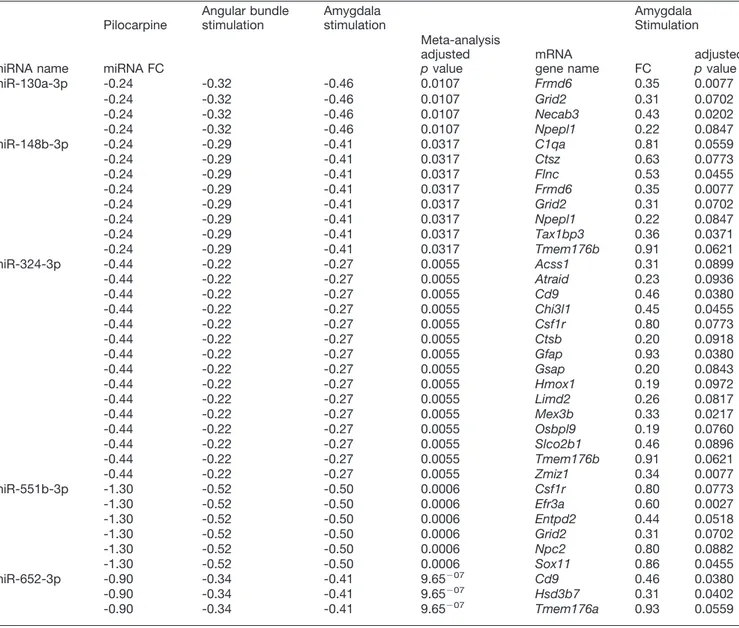
The relationship between the changes in expression of miRNAs and their mRNA targets in the chronic stage of epilepsy was analyzed using only the amygdala stimulation
dataset (Bot et al., 2013). We observed negative correlations (based on fold changes) between all five miRNAs that emerged as significantly downregulated from the meta-analysis and 29 unique predicted mRNA targets in the da-taset. Five of these 29 anticorrelated mRNAs were predicted targets and had inverse expression relative to two miRNAs and one, the glutamate ionotropic receptor␦-type subunit 2 (Grid2), was a predicted target and had inverse expression relative to three miRNAs, namely, miR-130a-3p, miR-148b-3p, and miR-551b-3p (Table 5). Furthermore, interestingly, three mRNA targets, the transmembrane protein 176B (Tmem176b), the EFR3 homolog A (Efr3a), and the zinc finger, MIZ-type containing 1 (Zmiz1) were downregulated in both epileptogenesis and the chronic stage.
Recent evidence supports the notion that miRNAs not only decrease levels of their mRNA targets (Guo et al., 2010), but additionally may have nuclear functions capa-ble of influencing gene expression, and which may be reflected by a correlation between a miRNA and its target gene mRNA levels (Catalanotto et al., 2016). Analysis of the epileptogenesis data revealed significant correlation (gene FDR ⬍ 0.1), for 21 (of 26) miRNAs and 77 unique predicted gene targets in at least three of the four epilepsy
Figure 4. Relationship between selected miRNA and their predicted targets in different model of TLE. All panels show selected
miRNAs-mRNA anticorrelation based on miRNAs and mRNAs fold changes in epileptogenesis. A, Inverse relationship between four downregulated miRNAs (miR-92b-3p, miR-101a-3p, miR-153-3p, and miR-3573-3p) and the commonly predicted target Map3k4. B, Inverse relationship between the downregulated miR-138-5p, miR-7a-5p, and the upregulated Map3k14. C, Inverse relationship between miR-101a-3p, miR-139-3p, miR-551b-3p, and Syn2. D, Inverse relationship between miR-150-5p, miR-383-5p, and Ptpn.
E, F, Examples of the opposite anticorrelation, the upregulated miR-146a-5p with the downregulated Htr5b transcript, and the
models of the Dingledine dataset (Dingledine et al., 2017;
Table 6). In addition, we found positive correlations be-tween five of the five miRNAs that were downregulated in the chronic period and 39 predicted mRNA targets in the amygdala stimulation dataset (Bot et al., 2013;Table 7). Interestingly, 29 of the mRNAs identified as potential tar-gets in epileptogenesis were inversely correlated to some miRNAs and directly correlated to others (e.g., map3k14 is inversely correlated to miR-7a-5p and miR-138-5p and directly correlated to miR-212-5p, while bdnf is inversely correlated to let-7b-3p and directly correlated to miR-212-5p). This observation prompts the hypothesis that some mRNAs may be subject to a dual control by different miRNAs at cytosolic and nuclear level. This hypothesis should be challenged and investigated.
Genes that are anticorrelated with miRNAs are enriched for “epileptogenic” ontology categories
To further investigate the functional role of miRNAs significantly differentially expressed and anticorrelated
with their predicted mRNA targets, we examined the func-tional enrichment of the mRNA targets identified in epi-leptogenesis and chronic phases of epilepsy.
Target genes that inversely correlated with differentially expressed miRNAs during the epileptogenesis period were enriched for GO terms related to synaptic function [like “response to stimulus” (p⫽ 0.0013), “signaling” (p ⫽ 2.68⫺05), “signal transduction” (p⫽ 0.0047), and others] and immunity [like “humoral immune response” (p ⫽ 0.0009), “regulation of immune system process” (p ⫽ 0.0013), and others]. In addition, terms related to comple-ment activation [like “complecomple-ment activation” (p⫽ 0.0002) and “complement activation, classical pathway” (p ⫽ 0.0009)] are in prominent position (Fig. 5A;Table 8). Proteins of the classical complement pathway not only play a role in the innate immune system, but have been also shown to be released from neurons, and serve as a new class of synaptic organizers (Yuzaki, 2017). These GO terms are potentially relevant to changes occurring at the level of the DG in epileptogenesis (Dudek and Sutula, 2007;Vezzani Table 5. miRNA-mRNA fold changes inverse correlation at the chronic stage
miRNA name Pilocarpine Angular bundle stimulation Amygdala stimulation mRNA gene name Amygdala Stimulation miRNA FC Meta-analysis adjusted p value FC adjusted p value miR-130a-3p -0.24 -0.32 -0.46 0.0107 Frmd6 0.35 0.0077 -0.24 -0.32 -0.46 0.0107 Grid2 0.31 0.0702 -0.24 -0.32 -0.46 0.0107 Necab3 0.43 0.0202 -0.24 -0.32 -0.46 0.0107 Npepl1 0.22 0.0847 miR-148b-3p -0.24 -0.29 -0.41 0.0317 C1qa 0.81 0.0559 -0.24 -0.29 -0.41 0.0317 Ctsz 0.63 0.0773 -0.24 -0.29 -0.41 0.0317 Flnc 0.53 0.0455 -0.24 -0.29 -0.41 0.0317 Frmd6 0.35 0.0077 -0.24 -0.29 -0.41 0.0317 Grid2 0.31 0.0702 -0.24 -0.29 -0.41 0.0317 Npepl1 0.22 0.0847 -0.24 -0.29 -0.41 0.0317 Tax1bp3 0.36 0.0371 -0.24 -0.29 -0.41 0.0317 Tmem176b 0.91 0.0621 miR-324-3p -0.44 -0.22 -0.27 0.0055 Acss1 0.31 0.0899 -0.44 -0.22 -0.27 0.0055 Atraid 0.23 0.0936 -0.44 -0.22 -0.27 0.0055 Cd9 0.46 0.0380 -0.44 -0.22 -0.27 0.0055 Chi3l1 0.45 0.0455 -0.44 -0.22 -0.27 0.0055 Csf1r 0.80 0.0773 -0.44 -0.22 -0.27 0.0055 Ctsb 0.20 0.0918 -0.44 -0.22 -0.27 0.0055 Gfap 0.93 0.0380 -0.44 -0.22 -0.27 0.0055 Gsap 0.20 0.0843 -0.44 -0.22 -0.27 0.0055 Hmox1 0.19 0.0972 -0.44 -0.22 -0.27 0.0055 Limd2 0.26 0.0817 -0.44 -0.22 -0.27 0.0055 Mex3b 0.33 0.0217 -0.44 -0.22 -0.27 0.0055 Osbpl9 0.19 0.0760 -0.44 -0.22 -0.27 0.0055 Slco2b1 0.46 0.0896 -0.44 -0.22 -0.27 0.0055 Tmem176b 0.91 0.0621 -0.44 -0.22 -0.27 0.0055 Zmiz1 0.34 0.0077 miR-551b-3p -1.30 -0.52 -0.50 0.0006 Csf1r 0.80 0.0773 -1.30 -0.52 -0.50 0.0006 Efr3a 0.60 0.0027 -1.30 -0.52 -0.50 0.0006 Entpd2 0.44 0.0518 -1.30 -0.52 -0.50 0.0006 Grid2 0.31 0.0702 -1.30 -0.52 -0.50 0.0006 Npc2 0.80 0.0882 -1.30 -0.52 -0.50 0.0006 Sox11 0.86 0.0455 miR-652-3p -0.90 -0.34 -0.41 9.65⫺07 Cd9 0.46 0.0380 -0.90 -0.34 -0.41 9.65⫺07 Hsd3b7 0.31 0.0402 -0.90 -0.34 -0.41 9.65⫺07 Tmem176a 0.93 0.0559
Table 6. miRNA-mRNA fold changes positive correlation in epileptogenesis
miRNA Name
microRNA data
mRNA targets of respective microRNA (FDR⬍ 0.1) Pilocarpine Perforant path stimulation Amygdala stimulation mRNA gene names Pilocarpine Perforant path stimulation Amygdala stimulation Kainic acid miRNA FC Meta-analysis p value FC Adjusted p value FC Adjusted p value FC Adjusted p value FC Adjusted p value miR-383-5p -0.50 -0.35 -0.75 6.11⫺05 Rasd2 -0.58 0.0038 -1.24 0.0012 -0.59 0.0010 -0.87 0.0034 Sec14l1 -0.59 0.0061 -0.50 0.0425 -0.39 0.0053 -0.20 0.0726 Mpp6 -0.59 0.0295 -0.54 0.0517 -0.39 0.4123 -0.78 0.0510 miR-153-3p -0.32 -0.42 -0.22 0.0008 Mthfd1l -1.27 0.0398 -0.83 0.0102 -0.94 0.0005 -0.44 0.0093 Gdf10 -2.91 8.62⫺06 -1.46 0.0306 -1.86 2.27⫺07 -1.02 0.0014 Nr4a3 0.12 0.9726 -1.65 0.0721 -1.64 0.0574 -0.65 0.0042 Mettl7a -0.74 0.0066 -0.72 0.0861 -0.87 0.0750 -0.19 0.0500 Ablim2 -0.05 0.9953 -0.78 0.0964 -0.35 0.7323 -0.29 0.0667 miR-324-5p -0.09 -0.60 -0.29 8.552⫺06 Ryr1 -1.52 0.0022 -1.39 0.0196 -1.86 2.53⫺08 -0.68 0.0014 miR-150-5p -0.45 -0.45 -0.56 6.168⫺05 Ddit4l -2.38 0.0063 -1.89 0.0098 -2.00 6.09⫺06 -1.09 0.0007 Htr5b -1.55 3.87⫺05 -1.66 0.0263 -0.54 0.0096 -0.73 0.0016 Fkbp4 -0.21 0.7718 -0.55 0.0464 -0.45 0.0737 -0.26 0.0775 Pip5k1b -1.03 0.0228 -0.46 0.0492 -0.79 0.1731 -0.38 0.0619 Calml4 -0.60 0.3155 -0.44 0.0839 -0.48 0.1135 -0.38 0.0139 miR-92b-3p -1.05 -0.72 -0.37 1.695⫺05 Per2 -0.59 0.8691 -0.46 0.0717 -0.56 0.0253 -0.37 0.0918 miR-345-5p -0.23 -0.25 -0.12 1.464⫺06 Rasd2 -0.58 0.0038 -1.24 0.0012 -0.59 0.0010 -0.87 0.0034 Ryr1 -1.52 0.0022 -1.39 0.0196 -1.86 2.53⫺08 -0.68 0.0014 Klhl14 -2.36 2.39⫺06 -1.66 0.0204 -0.84 0.0006 -0.44 0.0077 B3galt5 -1.93 0.0118 -0.83 0.0442 -1.39 7.49⫺05 -0.43 0.0471 Pip5k1b -1.03 0.0228 -0.46 0.0492 -0.79 0.1731 -0.38 0.0619 Rspo3 -0.41 0.5671 -0.41 0.0626 -0.11 0.1711 -0.55 0.0259 Fat1 -1.55 0.0012 -1.01 0.0717 -1.05 0.0012 -0.19 0.0792 miR-101a-3p -0.68 -0.71 -0.19 5.148⫺06 Rasd2 -0.58 0.0038 -1.24 0.0012 -0.59 0.0010 -0.87 0.0034 Ddit4l -2.38 0.0063 -1.89 0.0098 -2.00 6.09⫺06 -1.09 0.0007 Gdf10 -2.91 8.62⫺06 -1.46 0.0306 -1.86 2.27⫺07 -1.02 0.0014 Plk5 -2.15 0.0033 -0.59 0.0311 -1.46 0.0013 -1.00 0.0303 Plag1 -0.58 0.0528 -0.45 0.0425 0.06 0.5075 -0.59 0.0453 miR-29c-5p -0.59 -0.41 -0.14 1.477⫺07 Crim1 -1.07 0.0084 -0.59 0.0173 -0.87 9.88⫺06 -0.31 0.0323 Dnah12 -0.35 0.9054 0.65 0.0492 0.32 0.4073 0.22 0.0340 C5ar1 0.43 0.2817 0.33 0.3103 0.44 0.0181 0.24 0.0841 Slc20a1 0.27 0.0883 0.14 0.5191 0.41 0.0227 0.45 0.0042 miR-330-3p -0.99 -0.40 -0.32 1.935⫺06 Gabrd -0.71 0.0282 -0.59 0.0067 -0.53 0.0053 -0.55 0.0070 Ets2 -0.44 0.3991 -0.66 0.0249 -0.44 0.0641 -0.31 0.0095 Gpc3 -1.92 0.0026 -0.85 0.0492 -0.89 0.0006 -1.29 0.0054 miR-138-5p -0.48 -0.29 -0.50 3.983⫺08 Rasd2 -0.58 0.0038 -1.24 0.0012 -0.59 0.0010 -0.87 0.0034 Nr4a1 0.24 0.7205 -0.88 0.0125 -0.56 0.4123 -0.32 0.0719 Crim1 -1.07 0.0084 -0.59 0.0173 -0.87 9.88⫺06 -0.31 0.0323 Nhlh1 -1.67 0.0023 -1.12 0.0337 -0.63 0.0295 -0.84 0.0097 Nr4a3 0.12 0.9726 -1.65 0.0721 -1.64 0.0574 -0.65 0.0042 miR-667-3p -0.34 -0.20 -0.49 1.62⫺07 Rasd2 -0.58 0.0038 -1.24 0.0012 -0.59 0.0010 -0.87 0.0034 Etv5 -0.08 0.9646 -0.63 0.0423 -0.47 0.2965 -0.49 0.0044 miR-212-5p 2.55 0.27 0.28 1.152⫺05 Sox11 1.52 0.0027 1.36 0.0092 1.57 0.0063 1.23 0.0011 Serping1 1.15 0.1500 1.22 0.0204 1.19 0.0034 2.12 0.0009 Map3k14 0.20 0.8682 0.77 0.0263 0.11 0.0834 0.26 0.0653 Ptprn 0.83 0.0001 0.56 0.0613 0.38 0.0034 0.33 0.0648 Kank2 0.00 0.9473 0.71 0.0673 0.62 0.0153 0.59 0.0241 Acan 0.30 0.0723 0.37 0.0799 0.17 0.2577 0.37 0.0436 Slc7a14 0.35 0.1717 0.42 0.0877 0.91 0.0003 0.23 0.0568 C1qc 0.92 0.1759 0.42 0.3397 1.11 0.0014 0.97 0.0816 Ly86 0.58 0.0494 0.40 0.4124 0.87 0.0299 0.97 0.0299 Slc20a1 0.27 0.0883 0.14 0.5191 0.41 0.0227 0.45 0.0042 Blnk 0.70 0.0039 0.43 0.1925 0.71 0.0377 0.78 0.0158 Bdnf 1.17 0.0297 0.20 0.6933 0.45 0.0352 0.32 0.0487 Pdlim4 0.19 0.7034 0.15 0.5799 0.15 0.0771 0.46 0.0721 Syn2 0.39 0.0258 0.55 0.0299 0.65 0.0399 0.11 0.2134 Epb41l4b 0.57 0.0030 0.58 0.0237 0.70 0.0008 0.17 0.4555 Nnat 0.63 0.2970 0.86 0.0717 1.09 0.0083 0.15 0.5894 Htatip2 0.79 0.0007 0.37 0.0669 0.70 0.0119 -0.02 0.9557 Trh 2.87 0.0096 1.31 0.0246 1.20 0.0145 0.99 0.3361 Asph 0.05 0.9026 0.45 0.0254 0.45 0.0832 0.17 0.1308 let-7b-3p -0.80 -0.41 -5.75 8.364⫺06 Rspo3 -0.41 0.5671 -0.41 0.0626 -0.11 0.1711 -0.55 0.0259 (Continued)
et al., 2015). In addition, at the level of cell signaling pathways, analysis of KEGG pathways enriched among the mRNA targets suggested a key role for the MAPK cascade (p⫽ 0.354;Fig. 5B;Table 8). Notably, changes in the activation state of kinase pathways and altered kinase expression patterns have been reported in the hippocam-pus by previous studies (Xi et al., 2009). In the chronic period, the predicted and anticorrelated mRNA targets revealed enrichment in biological processes that have been previously implicated in chronic epilepsy (Ludewig et al., 2016;Robel and Sontheimer, 2016) such as “reg-ulation of dendritic cell differentiation” (p⫽ 4.8 ⫻ 10⫺6), “glial cell development” (p⫽ 4.0 ⫻ 10⫺4), “proliferation” (p ⫽ 6.0 ⫻ 10⫺4), and “cell proliferation” (p⫽ 4.0 ⫻ 10⫺4; Fig. 5C; Table 9). Notably, we performed a permutation test to check for false positive enrichment in GO term and
KEGG pathway analysis, but this did not change any of the results.
Target genes that directly correlated with differentially expressed miRNAs during the epileptogenesis period were enriched for GO terms related to glia proliferation [“regulation of glial cell proliferation” (p⫽ 0.0001) and “glial cell proliferation” (p⫽ 0.0001)]. In addition, and as in the inverse correlation analysis, terms related to complement activation [like “complement activation, classical pathway” (p ⫽ 0.0004)] were significantly enriched. In the chronic period, the positively correlated mRNA targets revealed sig-nificant (p ⬍ 0.00001) enrichment in GO terms related to receptor function like “receptor activity,” “signaling receptor activity,” “G protein-coupled receptor activity,” “signal trans-ducer activity,” “molecular transtrans-ducer activity,” and “trans-membrane signaling receptor activity.”
Table 6. Continued
miRNA Name
microRNA data
mRNA targets of respective microRNA (FDR⬍ 0.1) Pilocarpine Perforant path stimulation Amygdala stimulation mRNA gene names Pilocarpine Perforant path stimulation Amygdala stimulation Kainic acid miRNA FC Meta-analysis p value FC Adjusted p value FC Adjusted p value FC Adjusted p value FC Adjusted p value miR-132-3p 1.91 0.80 0.10 4.195⫺18 Efr3a 1.11 4.17⫺07 1.40 0.0005 1.28 0.0096 0.49 0.0070 Sox11 1.52 0.0027 1.36 0.0092 1.57 0.0063 1.23 0.0011 Wls 1.75 1.52⫺05 0.80 0.0108 1.45 7.49⫺05 0.57 0.0051 Rin2 -0.06 0.9546 0.43 0.0517 0.57 0.0638 0.44 0.0303 Gpnmb 0.81 0.2150 0.30 0.6840 1.54 0.0030 1.45 0.0259 Zfp521 0.59 0.0031 0.74 0.0052 1.23 0.0002 0.23 0.2169 Asph 0.05 0.9026 0.45 0.0254 0.45 0.0832 0.17 0.1308 miR-146a-5p 4.71 0.37 0.33 4.047⫺10 Mdm1 0.29 0.0680 0.76 0.0027 0.69 0.0360 0.30 0.0322 Inpp4b 0.24 0.1291 1.15 0.0027 0.80 0.1003 0.31 0.0735 Arhgap17 0.33 0.0762 0.88 0.0080 0.30 0.0183 0.43 0.0259 Igsf1 0.50 0.4934 0.89 0.0425 1.03 0.3719 0.31 0.0510 Gpat3 0.44 0.4497 0.40 0.0864 -0.04 0.2317 0.16 0.0923 Sowahc 0.53 0.0683 0.45 0.3070 1.09 0.0006 0.28 0.0873 Fcer1g 1.09 0.0112 0.51 0.1380 1.14 0.0002 1.37 0.0059 Slfn13 0.40 0.1166 0.41 0.1757 0.46 0.0429 1.53 0.0027 Zfp521 0.59 0.0031 0.74 0.0052 1.23 0.0002 0.23 0.2169 Anks1a 0.17 0.5280 0.53 0.0492 0.72 0.0323 0.28 0.1948 Trh 2.87 0.0096 1.31 0.0246 1.20 0.0145 0.99 0.3361 Ntm -0.32 0.9428 0.37 0.0861 0.71 0.0527 -0.22 0.3746 Col9a1 1.28 0.0003 0.91 0.0425 0.41 0.0208 0.03 0.9192 miR-551b-3p -0.78 -0.85 -0.42 9.092⫺14 Plxdc1 -0.70 0.0007 -0.73 0.0127 -0.28 0.0555 -0.33 0.0823 Ogfrl1 -0.23 0.1736 -0.52 0.0135 -0.55 0.0293 -0.30 0.0563 Htr5b -1.55 3.87⫺05 -1.66 0.0263 -0.54 0.0096 -0.73 0.0016 Diaph1 -0.27 0.2293 -0.30 0.0492 0.07 0.3960 -0.23 0.0530 miR-344b-2-3p 3.74 0.11 0.29 5.432⫺14 Runx1 1.22 0.0009 1.48 0.0027 1.08 0.0008 0.60 0.0027 Il18 0.31 0.3608 0.52 0.0669 0.38 0.1009 0.51 0.0955 Chi3l1 0.33 0.8228 0.02 0.9731 1.14 0.0881 0.31 0.0785 Fancd2os 0.85 0.0043 0.36 0.1786 0.66 0.0353 0.28 0.0372 P2ry6 0.50 0.1614 0.12 0.7169 0.17 0.0499 0.61 0.0231 Asph 0.05 0.9026 0.45 0.0254 0.45 0.0832 0.17 0.1308 miR-139-5p -1.40 -0.77 -0.91 4.4⫺17 Gabrd -0.71 0.0282 -0.59 0.0067 -0.53 0.0053 -0.55 0.0070 Gdf10 -2.91 8.62⫺06 -1.46 0.0306 -1.86 2.27⫺07 -1.02 0.0014 Rspo3 -0.41 0.5671 -0.41 0.0626 -0.11 0.1711 -0.55 0.0259 miR-33-5p -2.40 -0.80 -0.51 4.916⫺19 Smarca2 -0.60 0.2192 -1.53 0.0186 -0.35 0.0904 -0.27 0.0340 Fxyd7 -1.49 7.16⫺05 -1.65 0.0186 -0.98 0.0052 -0.30 0.0142 Arg1 -1.24 0.0324 -0.49 0.0984 -0.37 0.0679 -0.50 0.0344 miR-7a-5p -0.91 -0.93 -0.51 3.436⫺24 Hpca -0.40 0.0880 -0.64 0.0090 -0.74 0.0220 -0.22 0.0244 miR-212-3p 1.09 0.88 0.22 1.744⫺47 Efr3a 1.11 4.17⫺07 1.40 0.0005 1.28 0.0096 0.49 0.0070 Sox11 1.52 0.0027 1.36 0.0092 1.57 0.0063 1.23 0.0011 Wls 1.75 1.52⫺05 0.80 0.0108 1.45 7.49⫺05 0.57 0.0051 Rin2 -0.06 0.9546 0.43 0.0517 0.57 0.0638 0.44 0.0303 Gpnmb 0.81 0.2150 0.30 0.6840 1.54 0.0030 1.45 0.0259 Zfp521 0.59 0.0031 0.74 0.0052 1.23 0.0002 0.23 0.2169 Asph 0.05 0.9026 0.45 0.0254 0.45 0.0832 0.17 0.1308
To infer the functional relationships between miRNAs identified as differentially expressed in the meta-analysis, we created a network of miRNAs based on their predicted anticorrelated target pathways (Fig. 5). These results high-light that several distinct miRNAs may contribute to the regulation of functionally related processes and pathways, and so prioritizing individual miRNAs as potential therapeu-tic targets will require downstream experimental analysis.
Discussion
Main findingsThe present meta-analysis provides a miRNA differen-tial expression signature in the DG of rats during
epilep-togenesis and in the chronic phase of epilepsy. We identified 26 miRNAs significantly differentially expressed during epileptogenesis, and five miRNAs significantly dif-ferentially expressed in the chronic phase of epilepsy. We also identified 11 miRNAs in epileptogenesis and two in chronic epilepsy that were identified as significantly dif-ferentially expressed by the meta-analysis but not in any of the individual studies. Further, we explored the nega-tive correlation between the significantly differentially ex-pressed miRNAs and their predicted mRNA targets in the same models of epilepsy. We identified 122 predicted mRNAs targets with an anticorrelated expression relation-ship to 22 of the 26 miRNAs significantly differentially
Table 7. miRNA-mRNA fold changes positive correlation in the chronic period
miRNA name
microRNA data
mRNA targets of respective microRNA (FDR⬍ 0.1) Pilocarpine Perforant path stimulation Amygdala stimulation mRNA gene names Amygdala stimulation Amygdala stimulation FC Meta-analysis p value FC Adjusted p value miR-652-3p -0.90 -0.34 -0.41 9.65⫺07 Ano2 -0.39 0.0077 Ece2 -0.22 0.0395 Optn -0.26 0.0825 miR-551b-3p -1.30 -0.52 -0.50 0.0006 Clmp -0.36 0.0325 Socs5 -0.36 0.0619 Asic2 -0.26 0.0731 miR-324-3p -0.44 -0.22 -0.27 0.0055 Gdf10 -0.94 0.0083 Gpr176 -0.43 0.0116 Etv5 -0.58 0.0202 Elfn2 -0.25 0.0225 Tcerg1l -0.42 0.0311 Sstr3 -0.33 0.0371 Nr4a3 -0.50 0.0372 Veph1 -0.27 0.0380 Cyp26b1 -0.35 0.0380 Itgb4 -0.50 0.0394 Nefm -0.31 0.0394 Alcam -0.29 0.0547 Grik1 -0.30 0.0555 Clmn -0.30 0.0619 Arg1 -0.30 0.0697 Grik3 -0.72 0.0702 Asic2 -0.26 0.0731 Boc -0.33 0.0772 Ubash3b -0.24 0.0773 Cbarp -0.18 0.0817 miR-148b-3p -0.24 -0.29 -0.41 0.0317 Pip5k1b -0.50 0.0077 Gpr176 -0.43 0.0116 Slit2 -0.39 0.0219 Camk1g -0.43 0.0234 Gpr165 -0.48 0.0326 Hcrtr2 -0.28 0.0371 Htra4 -1.37 0.0380 Vstm2b -0.40 0.0504 Alcam -0.29 0.0547 Ankrd34c -0.44 0.0568 Ppara -0.25 0.0773 Hnrnpm -0.22 0.0988 miR-130a-3p -0.24 -0.32 -0.46 0.0107 Eloc -0.33 0.0380 Htra4 -1.37 0.0380 Trhr -0.75 0.0380 Mthfd1l -0.39 0.0505 Rasd2 -0.47 0.0560
expressed in epileptogenesis. Below, we discuss these findings and their possible implications in the develop-ment and maintenance of epilepsy. Together, we also discuss the intrinsic limitations of this study that must be taken into account.
Epileptogenesis
Functional annotations of the target genes of miRNAs significantly differentially expressed during the latent interval between brain injury and the development of spontaneous seizures (epilepsy) support a relationship
between dysregulated miRNAs and molecular and cellular reorganizations that are known to occur during epilepto-genesis. First, the GO enrichment analysis identifies many terms that suggest a role for modulation of synaptic trans-mission during epileptogenesis. This is not surprising, given the critical role of the DG in the temporal lobe seizure network (Krook-Magnuson et al., 2015) and pre-vious experimental evidence for changes in synaptic effi-cacy and connections during epileptogenesis (Dudek and Sutula, 2007). Another set of terms broadly refers to immunity and inflammation, events that are deeply
asso-Figure 5. Functional enrichment of dysregulated miRNA-mRNAs targets modules. A, Horizontal bar plots (on the left) show the GO
enrichment status (top 20 terms) for 112 predicted mRNAs targets that anticorrelate with 22 miRNAs expression level in epilepto-genesis (FDR⬍ 5%, hypergeometric test). The miRNA-mRNA module is represented by a network graph (on the right) showing the connections between miRNAs based on the function of their mRNAs predictive targets revealed by the GO enrichment. B, Horizontal bar plots (on the left) show KEGG enrichment analysis for predicted mRNAs targets that anticorrelate with miRNAs expression level in epileptogenesis (FDR⬍ 5%, hypergeometric test). miRNA-mRNA modules are represented with network plot (on the right) showing the connection between miRNAs based on the pathways in which are involved their predicted targets revealed by KEGG analysis. C,
D, GO and KEGG enrichment status for 29 predicted miRNA targets that anticorrelate with five miRNAs differentially expressed in the