Positron emission tomography in the
diagnostic work-up of screening-detected
lung nodules
Giulia Veronesi
1,
7, Laura L. Travaini
2,7, Patrick Maisonneuve
3,
Cristiano Rampinelli
4, Raffaella Bertolotti
1, Lorenzo Spaggiari
1,5,
Massimo Bellomi
4,5and Giovanni Paganelli
2,6Affiliations:
1Division of Thoracic Surgery, European Institute of Oncology, Milan, Italy. 2Division of Nuclear Medicine, European Institute of Oncology, Milan, Italy.
3Division of Epidemiology and Biostatistics, European Institute of Oncology, Milan, Italy.
4Dept of Radiological Science and Radiation Therapy, European Institute of Oncology, Milan, Italy. 5Dept of Health Sciences, University of Milan, Milan, Italy.
6Istituto Scientifico Romagnolo per lo Studio e la Cura dei Tumori, Meldola, Italy. 7Both authors contributed equally.
Correspondence:
Giulia Veronesi, European Institute of Oncology, Via Ripamonti 435, I-20141 Milan, Italy. E-mail: [email protected]
ABSTRACT Low-dose computed tomography (CT) screening for lung cancer can reduce lung cancer mortality, but overdiagnosis, false positives and invasive procedures for benign nodules are worrying. We evaluated the utility of positron emission tomography (PET)-CT in characterising indeterminate screening-detected lung nodules.
383 nodules, examined by PET-CT over the first 6 years of the COSMOS (Continuous Observation of Smoking Subjects) study to diagnose primary lung cancer, were reviewed and compared with pathological findings (surgically-treated patients) or follow-up (negative CT for ⩾2 years, considered negative); 196 nodules were malignant.
The sensitivity, specificity and accuracy of PET-CT for differentially diagnosing malignant nodules were, respectively, 64%, 89% and 76% overall, and 82%, 92% and 88% for baseline-detected nodules. Performance was lower for nodules found at repeat annual scans, with sensitivity ranging from 22% for nonsolid to 79% for solid nodules ( p=0.0001). Sensitivity (87%) and specificity (73%) were high for nodules⩾15 mm, better (sensitivity 98%) for solid nodules ⩾15 mm.
PET-CT was highly sensitive for the differential diagnosis of indeterminate nodules detected at baseline, nodules⩾15 mm and solid nodules. Sensitivity was low for sub-solid nodules and nodules discovered after baseline for which other methods, e.g. volume doubling time, should be used.
@ERSpublications
PET-CT is good at differentially diagnosing large, solid and baseline-detected lung nodules in the screening settinghttp://ow.ly/A1amh
Copyright ©ERS 2015
For editorial comments see Eur Respir J 2015; 45: 314–316 [DOI: 10.1183/0903193600192714]. This article has supplementary material available from erj.ersjournals.com
Received: April 07 2014 | Accepted after revision: July 24 2014 | First published online: Sept 26 2014 Conflict of interest: None declared.
Introduction
Computed tomography (CT) screening for lung cancer remains controversial [1–4]. Although the National Lung Screening Trial (NLST) found that low-dose CT (LDCT) reduced lung cancer mortality by about 20% [5], the high rate of indeterminate and false-positive nodules was worrying [6].
The diagnostic work-up of CT nodules considers size (diameter or volume), characteristics (density, morphology, homogeneity) and volume doubling time (VDT) [7–13]. Several studies have investigated the ability of positron emission tomography (PET) to characterise lung nodules [14–18]. However, its role in diagnostic algorithms for screening-detected nodules has not been defined. In a previous study on PET-CT at baseline screening, we found an overall sensitivity of 88% for diagnosing malignancy, while for solid nodules >10 mm, sensitivity was 100%, suggesting PET-CT as an alternative to invasive procedures in the screening setting [19]. The study also indicated that the maximum standardised uptake value corrected for body weight (SUVbw,max) positivity threshold could be lowered from 2.0 to 1.5 for nodules <10 mm. A Danish study reported similar findings and concluded that the best malignancy predictor was combined VDT and PET-CT [20]. In the current study, we retrospectively assessed the ability of PET-CT to diagnose indeterminate nodules detected during the first 6 years of the COSMOS (Continuous Observation of Smoking Subjects) study [7].
Materials and methods
Patients
In 2004 and 2005 we enrolled asymptomatic volunteers, aged⩾50 years, current or former smokers (⩾20 pack-years), in the nonrandomised, single-centre screening study, COSMOS [17]. Ex-smokers had stopped ⩽10 years previously. Those with previous (within 5 years) malignant disease (except treated nonmelanoma skin cancer) were excluded. The study was approved by the ethics committee of the European Institute of Oncology, Milan, Italy. Those recruited gave written consent to receive annual LDCT for 10 consecutive years.
Diagnostic protocol
Noncalcified nodules⩽5 mm underwent repeat LDCT 1 year later. Noncalcified nodules between 5.1 and 8 mm underwent repeat LDCT 3 months later. Solid or partially solid nodules >8 mm underwent PET-CT, unless they appeared clearly benign (axial longest diameter more than twice minimum diameter, thickening of fissures, liquid density, inside apical scar), and were reinvestigated by LDCT 1 year later. Baseline nonsolid nodules between 5.1 and 8 mm underwent repeat LDCT 6 months later; those >8 mm also underwent repeat LDCT; if any were progressive in diameter or density, PET-CT was scheduled. After 2006, lesions >8 mm thought to be due to infection were treated with oral antibiotics for 7 days and LDCT repeated 1 month later before scheduling PET-CT.
Growing or PET-positive nodules suspicious for malignancy underwent minimally invasive surgical biopsy and additional interventions. Highly suspicious nodules not amenable to biopsy were usually investigated by CT-guided fine-needle aspiration.
Resectable cases underwent standard anatomical resection plus radical lymph node dissection via lateral muscle-sparing thoracotomy or, after 2007, by robot-assisted videothoracoscopy.
LDCT
The multidetector (8- or 16-slice) CT scanner was a High/Light Speed Advantage (General Electric, Milwaukee, WI, USA). Scans were taken without contrast in a single breath with the machine set at 120 kVp, 30 mA, 1.75:1 pitch ratio and 2.5 mm slice thickness. Images were retro-reconstructed using standard and lung algorithms at 1.25 mm. The dose equivalent per patient was estimated at 0.81 mSv.
An experienced team of radiologists read the images (Advantage Windows 4.2 workstation; General Electric) using lung parenchyma windows (WW 1300, WL 480) with maximum intensity projection reconstruction, and mediastinum windows (WW 300, WL 35). Maximum axial diameter was measured by electronic calipers. Lesions >5 mm were evaluated at multidisciplinary meetings involving at least two radiologists. Nodules were classified as solid (lung parenchyma within completely obscured), partially solid (containing areas that completely obscured the lung parenchyma) or nonsolid (none of the parenchyma within nodule obscured).
PET-CT
PET acquisition using 18F-fluorodeoxyglucose is described elsewhere [7]. Briefly an in-line Discovery LS (GE Medical Systems, part of General Electric) was used, consisting of an Advance NXi PET scanner and an 8-slice Light Speed Plus CT scanner (2D modality, matrix size of 128 × 128). Patients were fasted for 6 h prior to radiotracer injection. Glucose levels were checked and were always <200 mg·dL−1(the cut-off was recently changed from <150 mg· dL−1to 200 mg· dL−1). The time between injection and acquisition was
∼50 min. While waiting, patients were required to drink two or three glasses of water and empty the bladder. The CT of PET-CT was performed without breath-holding, so some nodules ( particularly small sub-solid nodules in inferior lobes) were not well visualised. In such cases, the nuclear medicine physician identified the nodule on axial LDCT images, defining a circular region of interest, copied this and pasted it onto the corresponding axial PET image, and onto four superior and four inferior axial PET images (in relation to axial reference CT image), to reduce the possibility of uptake underestimation due to respiratory motion. Uptake was assessed visually as negative or positive and semi-quantitatively (SUVbw,max) on black-and-white scale PET images, not on fusion PET-CT images.
Solid nodules with SUVbw,max>2.0 and nonsolid nodules with SUVbw,max>1.5 were considered malignant. The PET findings were assessed by a single nuclear medicine physician but were discussed at multidisciplinary meetings.
Pathology and treatment
The nature of indeterminate nodules was determined by cytological/histological examination if biopsied/ removed, or by follow-up of ⩾2 years. For diagnostic wedge resection, a videothorascopic approach was preferred whenever lesion site and size allowed; otherwise, lateral muscle-sparing thoracotomy was employed. Wedges underwent intraoperative frozen section examination. If malignant, anatomic resection with curative intent was performed immediately.
Statistical analysis
Reference findings were pathological status of resected tissue or⩾24 months of follow-up. We calculated the sensitivity and specificity of PET-CT, with 95% confidence intervals for the whole group, and by sex, age (<60 or ⩾60 years), nodule type and nodule size; by visual evaluation, and also according to three SUVbw,maxcut-offs (1.5, 2.0 and 2.5). We also calculated the sensitivity, specificity, positive and negative predictive values (PPV and NPV, respectively) and accuracy of PET-CT, with 95% confidence intervals, for detecting specific lung cancer subtypes.
We used receiver operating characteristic (ROC) curve analysis to assess the diagnostic value of nodule size and SUVbw,max, calculating area under the curve (AUC) as a measure of diagnostic efficiency.
SUV distributions in subgroups are presented in box and whisker plots. Differences in median SUV between subgroups were assessed by nonparametric two-sample median test. Analyses were performed with SAS version 8.2 (SAS Institute Inc., Cary, NC, USA). The p-values are two-sided.
Results
From October 2004 to October 2005, 5203 volunteers, mean±SD age 57.7±5.6 years, entered the study [7].
Over the first 6 years, 443 PET-CT examinations were performed. 60 were excluded from this analysis, 49 because they were performed for collateral findings, three because patients had previous lung cancer and eight because patients were not followed-up long enough to ascertain whether they were cancer-free. The analysis is based on the remaining 383 examinations to diagnose suspected primary lung cancer in 351 volunteers. 241 suspicious nodules underwent CT-guided biopsy or surgery: cytology or histology revealed 196 malignant nodules and 45 benign nodules. 142 nodules were followed-up by LDCT and defined benign after⩾24 months. 10 patients had multiple PET scans for various reasons.
Table 1 shows the characteristics of the patients and their PET-investigated nodules. 70% of investigated nodules were in males; 60% were in volunteers aged ⩾60 years. 149 indeterminate nodules were investigated by PET as a work-up of baseline LDCT. Fewer were investigated at subsequent rounds, but the number remained fairly constant over the next 5 years (58, 63, 45, 47 and 21 each year). The size distribution was: 147 measuring <10 mm, 106 between 10 and 15 mm, and 118 measuring⩾15 mm. Most (69.2%) nodules were solid, 17.8% were sub-solid and 12.5% were nonsolid.
187 nodules were benign (45 by cytology/histology and 142 by follow-up), 196 were malignant, 185 diagnosed within a year, 127 (69%) at stage I. Nodule size ( p=0.005) and type ( p=0.02) were significantly associated with cancer (Table 1). A higher proportion of nodules investigated at follow-up rounds were cancer than those investigated at baseline ( p<0.0001).
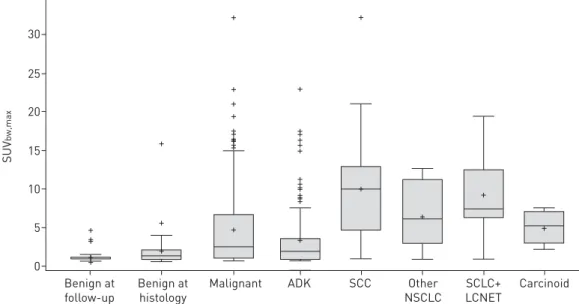
SUVbw,max
The mean±SDSUVbw,max measurements were 1.19±0.56 for the 142 benign lung nodules not investigated by cytology/histology, 2.06±2.36 for the 45 benign lung nodules biopsied/removed surgically and 4.76±5.13 for the 196 malignant nodules. For the 234 nodules considered negative by visually assessed PET-CT, the SUVbw,maxwas 1.09±0.25, compared with 6.46±5.24 for the 144 nodules considered positive (fig. 1).
Diagnostic performance of PET-CT
Overall sensitivity, specificity and accuracy (95% CI) of visually evaluated PET-CT in distinguishing malignant from benign nodules were 64% (56–70%), 89% (83–93%) and 76% (71–80%), respectively. Corresponding figures were 82% (69–90%), 92% (84–96%) and 88% (81–92%) for baseline nodules, and 87% (77–93%), 73% (57–85%) and 82% (74–88%) for nodules ⩾15 mm. Performance was significantly lower for nodules on annual repeat scans than baseline (sensitivity range 30–71% versus sensitivity 82%; p<0.0001), and for nonsolid compared with solid nodules (sensitivity 22% (10–40%) versus 79% (71–86%); p<0.0001) (table 2). Accuracy was greater for males than females (79% (73–83%) versus 69% (60–77%); p=0.05) and greater for those aged⩾60 years than those aged <60 years (80% (74–85%) versus 69% (61–77%); p=0.02). Performance was similar for nodules in upper versus lower lobes and right versus left lung.
Considering size and density together, PET-CT sensitivity (95% CI) was poor for sub-solid nodules <15 mm (21% (11–36%)), intermediate for sub-solid nodules ⩾15 mm (64% (43–81%)) and solid nodules <15 mm (65% (53–76%)), and high for solid nodules ⩾15 mm (98% (88–100%)). For sub-solid nodules, sensitivity increased with size to reach 64% (43–81%) for nodules ⩾15 mm. For sub-solid nodules <10 mm, sensitivity was particularly poor (17% (6–40%)) but there were no false positives. In general, a negative PET in a sub-solid nodule did not exclude cancer, but cancer was present in 86% (67–95%) of these nodules (the PPV). For solid nodules <10 mm, sensitivity was 51% (36–66%), but false positives were rare and PPV was 85% (64–95%). For solid nodules ⩾15 mm, sensitivity was excellent (98% (88–100%)),
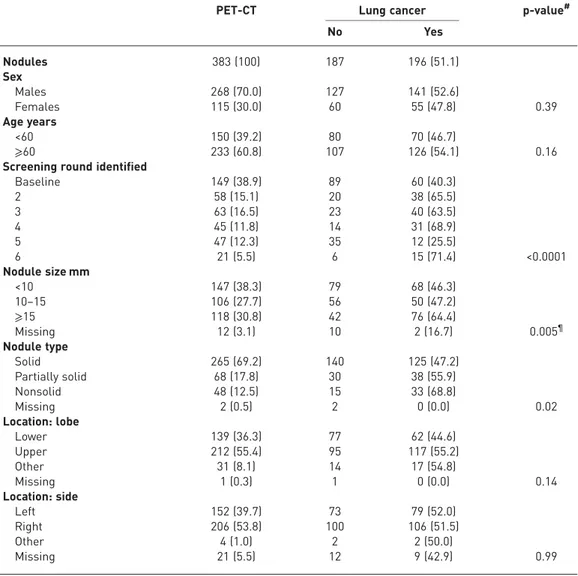
TABLE 1Characteristics of 383 nodules in 351 patients investigated by positron emission tomography/computed tomography (PET-CT)
PET-CT Lung cancer p-value#
No Yes Nodules 383 (100) 187 196 (51.1) Sex Males 268 (70.0) 127 141 (52.6) Females 115 (30.0) 60 55 (47.8) 0.39 Age years <60 150 (39.2) 80 70 (46.7) ⩾60 233 (60.8) 107 126 (54.1) 0.16
Screening round identified
Baseline 149 (38.9) 89 60 (40.3) 2 58 (15.1) 20 38 (65.5) 3 63 (16.5) 23 40 (63.5) 4 45 (11.8) 14 31 (68.9) 5 47 (12.3) 35 12 (25.5) 6 21 (5.5) 6 15 (71.4) <0.0001 Nodule size mm <10 147 (38.3) 79 68 (46.3) 10–15 106 (27.7) 56 50 (47.2) ⩾15 118 (30.8) 42 76 (64.4) Missing 12 (3.1) 10 2 (16.7) 0.005¶ Nodule type Solid 265 (69.2) 140 125 (47.2) Partially solid 68 (17.8) 30 38 (55.9) Nonsolid 48 (12.5) 15 33 (68.8) Missing 2 (0.5) 2 0 (0.0) 0.02 Location: lobe Lower 139 (36.3) 77 62 (44.6) Upper 212 (55.4) 95 117 (55.2) Other 31 (8.1) 14 17 (54.8) Missing 1 (0.3) 1 0 (0.0) 0.14 Location: side Left 152 (39.7) 73 79 (52.0) Right 206 (53.8) 100 106 (51.5) Other 4 (1.0) 2 2 (50.0) Missing 21 (5.5) 12 9 (42.9) 0.99
Data are presented as n (%) or n, unless otherwise stated.#: Fisher’s exact test; ¶: p-value for trend, Mantel–Haenszel test.
implying that PET-negative nodules were rarely cancer and invasive diagnostic procedures could be avoided.
Figure 2 shows a 10-mm solid nodule with irregular margin appearing at second screening. Unexpectedly, it was PET-negative; needle biopsy was also negative and surgical biopsy was not performed. The nodule was stable 5 years later.
For solid nodules ⩾15 mm, the only false-negative PET was a pT1N0M0 adenocarcinoma diagnosed at screening 1 year later. However, PPV was suboptimal at 85% (73–92%), with nine out of 59 PET-positives shown to be false positives and PET positivity responsible for surgical biopsy of the nodule in six of these. Four out of the six surgically biopsied cases occurred during the first 2 years of screening, before a second LDCT 1 month later was introduced for nodules >8 mm thought to be due to infection. From rounds 3 to 6, 64 cases underwent second LDCT after antibiotics: in 54 of these the nodule shrank, in the remaining 10 it remained unchanged or increased in size.
Figure 3 illustrates a PET-positive nodule that was benign after resection. Resection could have probably been avoided if, instead of PET-CT, antibiotics had been administered followed by repeat LDCT. Figure 4 shows a new solid suspicious nodule that was smaller at second LDCT 1 month later, after antibiotics. The analyses using three different SUVbw,maxthresholds (online supplementary tables S1a–c) produced results consonant with visual assessment. For the 1.5, 2.0 and 2.5 thresholds, sensitivity was 67% (60–73%), 60% (53– 67%) and 51% (44–59%), respectively; specificity was 80% (73–85%), 88% (82–92%) and 91% (86–95%), respectively; and accuracy was 73% (63–77%), 74% (69–78%) and 71% (66–76%), respectively.
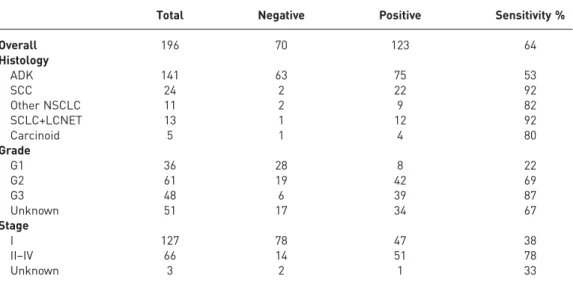
Table 3 shows visually assessed PET-CT sensitivity according to cancer subtype. Sensitivity (95% CI) was 64% (56–70%) overall, but lowest for adenocarcinoma (53% (46–63%)). Sensitivity was highest for poorly differentiated (87% (72–94%)) and stage II–IV (78% (66–87%)) disease, and lowest for well-differentiated (22% (11–40%)) and stage I (38% (29–47%)) disease. Similar results were found using the three SUV thresholds (online supplementary table S2).
The AUC (ROC) to assess the discriminative ability of SUV in identifying lung cancer versus non lung cancer was 0.78 for all nodules, 0.86 for solid nodules, but only 0.65 for sub-solid nodules (online supplementary fig. S1).
Discussion
It is essential to limit harm to screened individuals, so invasive procedures such as fine-needle aspiration biopsy and surgery must be avoided whenever possible. We included PET-CT in the COSMOS work-up
25 30 20 15 10 5 0 SUV bw,max Carcinoid SCC ADK Malignant Benign at follow-up Benign at histology Other NSCLC SCLC+ LCNET + + + + + + + + + + + + + + + + + + + ++++++ + + + + + + + + + + + + + + +
FIGURE 1Box and whisker plots of maximum standardised uptake value corrected for body weight (SUVbw,max) for nodules according to benign versus malignant status and according to histology for malignant nodules. The horizontal line inside each box is the median. The cross inside each box is the mean. The upper side of each box is the third quartile plus 1.5 × interquartile range (IQR). The lower side of each box is the first quartile minus 1.5 × IQR. Observations outside the boxes are indicated by crosses. ADK: adenocarcinoma; SCC: squamous cell carcinoma; NSCLC: nonsmall cell lung cancer; SCLC: small cell lung cancer; LCNET: large cell neuroendocrine tumour.
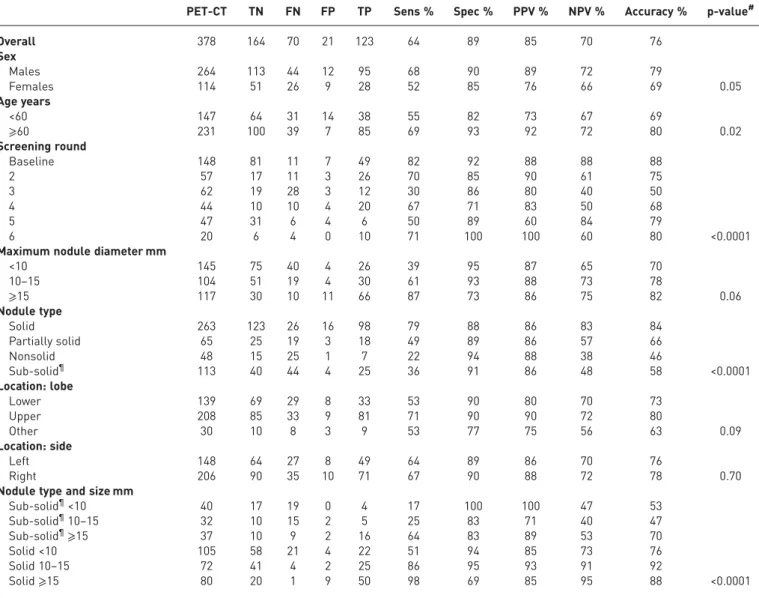
TABLE 2Results of visual evaluation of nodules found on positron emission tomography/computed tomography (PET-CT), according to nodule and subject characteristics
PET-CT TN FN FP TP Sens % Spec % PPV % NPV % Accuracy % p-value#
Overall 378 164 70 21 123 64 89 85 70 76 Sex Males 264 113 44 12 95 68 90 89 72 79 Females 114 51 26 9 28 52 85 76 66 69 0.05 Age years <60 147 64 31 14 38 55 82 73 67 69 ⩾60 231 100 39 7 85 69 93 92 72 80 0.02 Screening round Baseline 148 81 11 7 49 82 92 88 88 88 2 57 17 11 3 26 70 85 90 61 75 3 62 19 28 3 12 30 86 80 40 50 4 44 10 10 4 20 67 71 83 50 68 5 47 31 6 4 6 50 89 60 84 79 6 20 6 4 0 10 71 100 100 60 80 <0.0001
Maximum nodule diameter mm
<10 145 75 40 4 26 39 95 87 65 70 10–15 104 51 19 4 30 61 93 88 73 78 ⩾15 117 30 10 11 66 87 73 86 75 82 0.06 Nodule type Solid 263 123 26 16 98 79 88 86 83 84 Partially solid 65 25 19 3 18 49 89 86 57 66 Nonsolid 48 15 25 1 7 22 94 88 38 46 Sub-solid¶ 113 40 44 4 25 36 91 86 48 58 <0.0001 Location: lobe Lower 139 69 29 8 33 53 90 80 70 73 Upper 208 85 33 9 81 71 90 90 72 80 Other 30 10 8 3 9 53 77 75 56 63 0.09 Location: side Left 148 64 27 8 49 64 89 86 70 76 Right 206 90 35 10 71 67 90 88 72 78 0.70
Nodule type and size mm
Sub-solid¶<10 40 17 19 0 4 17 100 100 47 53 Sub-solid¶10–15 32 10 15 2 5 25 83 71 40 47 Sub-solid¶⩾15 37 10 9 2 16 64 83 89 53 70 Solid <10 105 58 21 4 22 51 94 85 73 76 Solid 10–15 72 41 4 2 25 86 95 93 91 92 Solid⩾15 80 20 1 9 50 98 69 85 95 88 <0.0001
Data are presented as n, unless otherwise stated. TN: true negative (negative PET for benign nodule); FN: false negative (negative PET for malignant nodule); FP: false positive (positive PET for benign nodule); TP: true positive (positive PET for malignant nodule); Sens: sensitivity; Spec: specificity; PPV: positive predictive value; NPV: negative predictive value.#: accuracy difference, Chi-squared test;¶: nonsolid+partially solid.
a) b) c)
FIGURE 2Low-dose computed tomography of a) a new suspicious nodule that appeared at the second screening round in a 60-year-old female smoker in 2007. Positron emission tomography/computed tomography was negative so, notwithstanding suspicious morphology, the nodule was left and re-examined at b) the third screening round in 2008. c) The nodule was still stable 5 years later in 2013. Arrows indicate the nodule.
for indeterminate screening-detected nodules, with the aim of reducing the use of more invasive procedures [19]. Our indications for PET-CT were nodule size >8 mm, or a growing nodule on repeat LDCT, sometimes <8 mm.
For the 383 PET-CT examinations, the sensitivity, specificity and accuracy of visually evaluated PET-CT, in differentially diagnosing malignant nodules, were 64%, 89% and 76%, respectively. PET performance varied with nodule diameter: accuracy increased from 70% for nodules <10 mm to 82% for nodules⩾15 mm ( p=0.06), in line with previous experience [7]. Nodule type had a strong influence ( p<0.0001) on accuracy, which ranged from 84% for solid nodules to 46% for nonsolid nodules. Sensitivity for solid nodules varied with size: high (98%) for nodules⩾15 mm, but only 51% for nodules <10 mm.
The findings most relevant to PET-CT use in screening are nodule size and type. For solid nodules⩾15 mm (21% of our series), sensitivity was high (98%), so a positive finding is almost always cancer. The NPV was also high (95%), indicating that invasive procedures can be avoided when PET is negative, with low risk of delayed diagnosis. In fact, we had only one false-negative PET is this group, which was still stage I when it was diagnosed at screening 1 year later.
For solid nodules <10 mm (30% of total) and sub-solid nodules of any size (28% of total), NPV was low, as expected [21], so a negative PET is unreliable and other methods like VDT or detailed nodule characteristics are required to provide an indication of malignancy before scheduling surgical biopsy. Conversely, for sub-solid nodules <10 mm (11% of total), PPV was high, so PET positivity was a strong predictor of malignancy, indicating that these cases should proceed to surgery. For sub-solid nodules⩾10 mm, a few false positives greatly reduced PPV.
As noted, after round 2, lesions >8 mm suspicious for infection received antibiotics and repeat LDCT 1 month later. PET-CT was performed only if the lesion was unresponsive to antibiotics. This innovation avoided numerous useless and potentially harmful (because of inflammation) PET-CT examinations. A Danish retrospective study evaluated visually assessed PET and VDT in screening: the combination predicted malignancy with high (90%) sensitivity and good (82%) specificity [20]. The overall sensitivity of PET-CT alone in our study (64%) was somewhat lower than the 71% of the Danish study, where 8 (40%) out of the overall 20
a) b) c)
FIGURE 3a) A spiculated nodule (arrow) was detected at baseline low-dose computed tomography in the left upper lobe. b) Positron emission tomography (PET) and c) combined PET and computed tomography images showed a weak uptake of18F-fluorodeoxyglucose at the level of the nodule (arrows). The nodule was resected and the definitive diagnosis was fibrosis.
a) b) c)
FIGURE 4a) Low-dose computed tomography (LDCT) of a suspicious nodule (arrow) in a patient’s left lobe at the second screening round. b) The nodule
malignancies were identified at baseline, compared with 60 (30%) out of 196 in our experience. Baseline cancers are usually more often PET-positive since they are more often large and dense [22].
The significantly better PET-CT accuracy we found in older (⩾60 years of age) than younger individuals could be due to the higher proportion of aggressive cancers found in older high-risk individuals [23]. As regards the significantly better diagnostic performance of PET-CT at baseline than subsequently (table 2), this is probably due to the lower frequency of nonsolid cancers at baseline compared with later [22]. In a previous study, we found that 18F-fluorodeoxyglucose uptake by nodules furnished important prognostic information [24]. Stage I PET-positive cancers had significantly worse survival than stage I PET-negative cancers. PET-CT may also guide extent of surgical resection and lymph node dissection. Our previous study on lymph node dissection [25] and the recent study by OKADAet al. [26] both suggested sub-lobar resection as an alternative to lobectomy in PET-negative cancers. This option is being investigated in randomised trials [27].
We do not use fine-needle aspiration biopsy routinely in our screening protocol. Typically, we proceed to surgery when nodule characteristics, including VDT [7, 18], often backed up by PET-CT, indicate malignancy. The disadvantage is that a pre-operative pathological diagnosis is not available and a wedge resection with frozen section examination is required before radical surgery. This procedure employs more materials and takes about 45 min longer than standard lobectomy, and also requires a pathologist in attendance. However, it is well accepted by patients, who rarely insist on a pre-operative pathological diagnosis.
Nevertheless, this policy goes against the International Association for the Study of Lung Cancer (IASLC) Screening Workshop Guidelines [4], which recommend CT-guided biopsy for suspicious nodules, not least because it often facilitates surgical decision-making. The New York Early Lung Cancer Action Project (ELCAP) group [11] reported good diagnostic performance for CT-guided biopsy (overall 82% sensitivity and 88% accuracy), although the results were less good for nodules <8 mm. However, CT-guided biopsy is highly operator dependent and sensitivity can be very low [28].
Nodules on PET-CT are commonly evaluated by semi-quantitative SUVbw,max, which is operator independent, as well as by visual assessment of uptake by the nuclear medicine physician, whose experience can markedly influence the result. In the present study, we evaluated both methods and found visual assessment afforded higher accuracy (76%) than any SUV threshold (online supplementary tables S1a–c and S2), with a good compromise between sensitivity (64%) and specificity (89%); increasing the SUV threshold from 1.5 to 2.5 decreased sensitivity (67% to 51%) and increased specificity (80% to 91%).
TABLE 3Sensitivity of visual evaluation of positron emission tomography/computed tomography (PET-CT) for detecting lung cancer, according to histological subtype, tumour grade and tumour stage
Total Negative Positive Sensitivity %
Overall 196 70 123 64 Histology ADK 141 63 75 53 SCC 24 2 22 92 Other NSCLC 11 2 9 82 SCLC+LCNET 13 1 12 92 Carcinoid 5 1 4 80 Grade G1 36 28 8 22 G2 61 19 42 69 G3 48 6 39 87 Unknown 51 17 34 67 Stage I 127 78 47 38 II–IV 66 14 51 78 Unknown 3 2 1 33
Data are presented as n, unless otherwise stated. Visual examination results were unavailable for three nodules examined by PET-CT, and histological subtype was not available for all nodules. ADK: adenocarcinoma; SCC: squamous cell carcinoma; NSCLC: nonsmall cell lung cancer; SCLC: small cell lung cancer; LCNET: large cell neuroendocrine tumour.
An important consequence of our use of visually assessed PET-CT (in combination with repeat LDCT 1 month later for suspected inflammatory nodules) was that only 14% of benign cases underwent surgical biopsy [24]. This is less than in the NLST, where 25% (90 out of 360) of suspicious cases underwent invasive procedures for benign nodules [29], and less than in the NELSON study (Dutch–Belgian randomised lung cancer screening trial), where 27% underwent surgery for benign disease at baseline and 21% in subsequent rounds [12]. By contrast, ASHRAFet al. [20] reported that only two (10%) benign cases
underwent surgery using a protocol that combined PET-CT with VDT.
As regards the cost of PET-CT and its use as a second-line modality, this can be approached by evaluating malignancy rate: 51% of our PET-CT cases had lung cancer, whereas 37% (20 out of 54) had lung cancer in the study by ASHRAF et al. [20]. ASHRAF et al. [20] scheduled solid nodules 5–15 mm and nonsolid
nodules⩽20 mm not considered definitely benign, for PET-CT. We selected noncalcified nodules >8 mm and nodules >5 mm growing in diameter or density at repeat LDCT.
A strength of the current study is that, to our knowledge, it presents the largest series of screened patients undergoing PET-CT as part of a diagnostic algorithm; almost all cases received PET-CT before surgical resection, most at the European Institute of Oncology, Milan. A limitation is that we do not have VDTs of all benign nodules and cannot compare VDT with PET, or assess the two tests combined. In addition, our results may not be applicable to populations with higher rates of endemic inflammatory lung conditions than the Italian population.
Some data indicate that, although widely accepted, 2-year stability is not a good indicator of nodule benignity [30, 31]. For example, YANKELEVITZ et al. [30] found that 2-year stability on CT had low
sensitivity (40%) and moderate accuracy (60%) when used define a nodule as benign. Thus, some of the nodules considered benign by the 2-year criterion may prove to be malignant. Follow-up continues for these nodules with long doubling time and those that eventually turn out to be malignant tend have good prognoses.
To conclude, our PET-CT findings are encouraging overall and suggest the technique has a role in the diagnostic work-up of indeterminate nodules identified on LDCT screening. It is more useful for nodules detected at baseline, while sensitivity is low for sub-solid nodules and nodules discovered after baseline. For these, other diagnostic modalities, particularly VDT, are more useful.
Acknowledgements
The authors thank Don Ward for help with the English.
References
1 Fontana RS, Sanderson DR, Woolner LB, et al. Screening for lung cancer. A critique of the Mayo Lung Project. Cancer 1991; 67 Suppl. 4:1155–1164.
2 International Early Lung Cancer Action Program Investigators, Henschke CI, Yankelevitz DF, et al. Survival of patients with stage I lung cancer detected on CT screening. N Engl J Med 2006; 355: 1763–1771.
3 Bach PB, Jett JR, Pastorino U, et al. Computed tomography screening and lung cancer outcomes. JAMA 2007; 297: 953–961.
4 Field JK, Smith RA, Aberle DR, et al. International Association for the Study of Lung Cancer Computed Tomography Screening Workshop 2011 report. J Thorac Oncol 2012; 7: 10–19.
5 National Lung Screening Trial Research Team, Aberle DR, Adams AM, et al. Reduced lung-cancer mortality with low-dose computed tomographic screening. N Engl J Med 2011; 365: 395–409.
6 Shlomi D, Ben-Avi R, Balmor GR, et al. Screening for lung cancer: time for large-scale screening by chest computed tomography. Eur Respir J 2014; 44: 217–238.
7 Veronesi G, Bellomi M, Mulshine JL, et al. Lung cancer screening with low-dose computed tomography: a non-invasive diagnostic protocol for baseline lung nodules. Lung Cancer 2008; 61: 340–349.
8 Henschke CI, Yankelevitz DF, Naidich DP, et al. CT screening for lung cancer: suspiciousness of nodules according to size on baseline scans. Radiology 2004; 231: 164–168.
9 MacMahon H, Austin JH, Gamsu G, et al. Guidelines for management of small pulmonary nodules detected on CT scans: a statement from the Fleischner Society. Radiology 2005; 237: 395–400.
10 Bellomi M, Veronesi G, Rampinelli C, et al. Evolution of lung nodules < or=5 mm detected with low-dose CT in asymptomatic smokers. Br J Radiol 2007; 80: 708–712.
11 New York Early Lung Cancer Action Project Investigators. CT screening for lung cancer: diagnoses resulting from the New York Early Lung Cancer Action Project. Radiology 2007; 243: 239–249.
12 van Klaveren RJ, Oudkerk M, Prokop M, et al. Management of lung nodules detected by volume CT scanning. N Engl J Med 2009; 361: 2221–2229.
13 Horeweg N, van der Aalst CM, Vliegenthart R, et al. Volumetric computed tomography screening for lung cancer: three rounds of the NELSON trial. Eur Respir J 2013; 42: 1659–1667.
14 Gould MK, Maclean CC, Kuschner WG, et al. Accuracy of positron emission tomography for diagnosis of pulmonary nodules and mass lesions: a meta-analysis. JAMA 2001; 285: 914–924.
15 Sasaki R, Komaki R, Macapinlac H, et al. 18F-fluorodeoxyglucose uptake by positron emission tomography
predicts outcome of non-small-cell lung cancer. J Clin Oncol 2005; 23: 1136–1143.
16 Uehara H, Tsutani Y, Okumura S, et al. Prognostic role of positron emission tomography and high-resolution computed tomography in clinical stage IA lung adenocarcinoma. Ann Thorac Surg 2013; 96: 1958–1965.
17 Fischer B, Lassen U, Mortensen J, et al. Preoperative staging of lung cancer with combined PET-CT. N Engl J Med 2009; 361: 32–39.
18 Lindell RM, Hartman TE, Swensen SJ, et al. Lung cancer screening experience: a retrospective review of PET in 22 non-small cell lung carcinomas detected on screening chest CT in a high-risk population. AJR Am J Roentgenol 2005; 185: 126–131.
19 Veronesi G, Bellomi M, Veronesi U, et al. Role of positron emission tomography scanning in the management of lung nodules detected at baseline computed tomography screening. Ann Thorac Surg 2007; 84: 959–965.
20 Ashraf H, Dirksen A, Loft A, et al. Combined use of positron emission tomography and volume doubling time in lung cancer screening with low-dose CT scanning. Thorax 2011; 66: 315–319.
21 Kim TJ, Park CM, Goo JM, et al. Is there a role for FDG PET in the management of lung cancer manifesting predominantly as ground-glass opacity?. AJR Am J Roentgenol 2012; 198: 83–88.
22 Veronesi G, Maisonneuve P, Spaggiari L, et al. Diagnostic performance of low-dose computed tomography screening for lung cancer over five years. J Thorac Oncol 2014; 9: 935–939.
23 Maisonneuve P, Bagnardi V, Bellomi M, et al. Lung cancer risk prediction to select smokers for screening CT– a model based on the Italian COSMOS trial. Cancer Prev Res 2011; 4: 1778–1789.
24 Veronesi G, Maisonneuve P, Bellomi M, et al. Estimating overdiagnosis in low-dose computed tomography screening for lung cancer: a cohort study. Ann Intern Med 2012; 157: 776–784.
25 Veronesi G, Maisonneuve P, Pelosi G, et al. Screening-detected lung cancers: is systematic nodal dissection always essential?. J Thorac Oncol 2011; 6: 525–530.
26 Okada M, Nakayama H, Okumura S, et al. Multicenter analysis of high-resolution computed tomography and positron emission tomography/computed tomography findings to choose therapeutic strategies for clinical stage IA lung adenocarcinoma. J Thorac Cardiovasc Surg 2011; 141: 1384–1391.
27 Comparison of Different Types of Surgery in Treating Patients With Stage IA Non-Small Cell Lung Cancer. Protocol ID CDR0000555324. www.cancer.gov/clinicaltrials/search/view?cdrid=555324&version=HealthProfessional Date last updated: October 17, 2013.
28 Rizzo S, Preda L, Raimondi S, et al. Risk factors for complications of CT-guided lung biopsies. Radiol Med 2011; 116: 548–563.
29 Aberle DR, DeMello S, Berg CD, et al. Results of the two incidence screenings in the National Lung Screening Trial. N Engl J Med 2013; 369: 920–931.
30 Yankelevitz DF, Henschke CI. Does 2-year stability imply that pulmonary nodules are benign?. AJR Am J Roentgenol 1997; 168: 325–328.
31 Geddes DM. The natural history of lung cancer: a review based on rates of tumour growth. Br J Dis Chest 1979; 73: 1–17.