UNIVERSITA´ POLITECNICA DELLE MARCHE
DOCTORAL THESIS
Sulfur Metabolism in
Microalgae
Department of Life and Environmental Sciences - Di.S.V.A.
Ancona, 2018
PhD Candidate:
Hongmin LIN
Tutor:
Prof. Mario Giordano
Co-tutors:
To my study life.
Past present and
future……
Abstract
Sulfur is a fundamental element for all living organisms. It is
acquired as sulfate, which is also the most abundant S form in
the ocean, and is assimilated as sulfide, which is fixed in the
S-amino acid cysteine. Sulfate assimilation thus requires its
reduction to sulfide. For sulfate to be reduced, it needs to be
activated to Adenosine PhosphoSulfate (APS). This reaction is
catalyzed by ATP-Sulfurylase, which in eukaryotic algae and
oceanic cyanobacteria, differently from all other organisms are
subject to redox regulation. The other steps of the sulfate
assimilation pathways are believed not to differ in algae, as
compared to embryophytes. The only other step on which the
lack of information leaves crucial open questions is the
synthesis of cysteine. Cysteine synthesis is catalyzed by two
enzymes, Serine Acetyl Transferase (SAT) and O-Acetyl Serine
(Thiol) Lyase (OAS-TL), which in embryophytes form a
complex, the Cysteine Synthase Complex (CSC). My thesis will
focus on these two steps, with special attention to cysteine
synthesis.
regulation is mediated by the redox state of the plastoquinon
pool of thylakoids. My results suggest that this is not the case.
The in vivo blockage of PQ reduction through the use of DCMU,
a specific inhibitor of electron transfer from QA to QB, did not
affect ATP-S activity.
As for the enzymes of cysteine synthesis, my bioinformatic
analysis showed that the phylogeny of SAT and OAS-TL are
probably difficult to reconstruct due to the shuffling of these
genes across groups with the possible contribution of horizontal
gene transfer. By analyzing the protein sequences, I determined
that the C-terminal domain of algal SAT, which is believed to be
responsible for the interaction with OAS-TL, is very similar to
that of embryophytes. This suggests that the interaction of SAT
and OAS-TL occurs in algae as in embryophytes. However, the
N-terminus of algal SAT, which is believed to be involved in the
SAT/SAT interaction, is not equally conserved; therefore,
differences in the assemblage of the CSC in algae are possible.
In order to clarify this point, I purified OAS-TL from the
freshwater cyanobacterium Synechocystis sp. PCC 6803, the
green marine algae Tetraselmis suecica and Dunaliella
tertiolecta, the green freshwater algae Chlamydomonas
reinhardtii, the marine diatoms Thalassiosira pseudonana and
Phaeodactylum tricornutum, and from the marine dinoflagellate
Amphidinium klebsii. These purified proteins showed some
differences in mass, which was however always within the
35-44 kDa range. All the purified proteins were active, although
specific activity differed among species. Interestingly, the
activity, in most cases, was higher when the enzyme was more
diluted; the enzyme is more active, as it also happens in
embryophytes. For embryophytes, this has been interpreted as
an indication that OAS-TL activity is modulated through
protein-protein interaction. To verify the hypothesis that algae
have CSC like embryophytes, I studied the ability of algae
OAS-TL to form a complex with Arabidopsis thaliana SAT
(overexpressed in E. coli). In all cases, a complex was formed,
although the strength of the interaction between SAT and
OAS-TL appeared to be different for different algal species. The
presence of OAS-TL and SAT in the purified native complexes
was confirmed by immunodetection of both proteins. The
cysteine synthase complexes that were formed in these
experiments were appreciably larger (approximately 600 kDa vs
320 kDa) than those of embryophytes. Further experiments will
be required to ascertain the actual stoichiometry and structure of
the algal CSC. However, based on the above observation, I
propose that algal CSC is composed by two SAT trimers, with
an OAS-TL dimer bound to each SAT monomer. This
configuration would give a mass of about 600 kDa, compatible
with the results obtained in our CSCS purification experiments.
It is also noteworthy that the strength of the binding of algal
OAS-TL to AtSAT5 was greater in green algae than in algae of
the red lineage. This may be an indication of the fact that a
greater proportion of OAS-TL is in the free form, in red-lineage
algae, leading to a higher flux of S into cysteines. At this stage,
this is only a hypothesis that requires further confirmation.
Keywords:
Sulfate, Cysteine, O-Acetyl Serine (Thiol) Lyase (OAS-TL),
Cysteine Synthase Complex (CSC)
CONTENT
Abstract ... III Keywords: ... VI LIST OF FIGURES ... XI LIST OF TABLES ... XV 1. Introduction ... 21.1. Impact of sulfur availability on algae ecology, evolution and radiation ... 2
1.2. Sulfur metabolism ... 3
1.2.1. Sulfate acquisition ... 3
1.2.2. Sulfate reduction ... 4
1.2.3. Cysteine synthesis ... 5
2. Hypotheses ... 11
3. Materials and methods ... 14
3.1. Bioinformatic methods ... 14
3.1.1. Protein sequences and phylogenetic trees ... 14
3.1.2. Predictions on the location of SAT and OAS-TL proteins ... 14
3.1.3. Analysis of SAT and OAS-TL algae sequences ... 15
3.2 Experimental organisms ... 16 3.2.1. Synechocystis sp. PCC 6803... 16 3.2.2. Chlamydomonas reinhardtii ... 16 3.2.3. Dunaliella tertiolecta ... 17 3.2.4. Tetraselmis suecica ... 18 3.2. 5. Thalassiosira pseudonana ... 18 3.2.6. Phaeodactylum tricornutum ... 19 3.2.7. Amphidinium klebsii ... 20 3.3. Cultures ... 20 3.3.1. Culture conditions ... 20 3.3.1.1. Synechocystis sp. PCC 6803... 21 3.3.1.2. Eukaryotic algae ... 21 3.3.2. Growth media. ... 21 3.3.2.1. BG-11 medium ... 21
3.3.2.2. TAP and TP medium ... 22
3.3.2.3. Artificial Multipurpose Complement for the Nutrition of Algae (AMCONA) ... 22
3.3.3. Determination of cell concentration ... 23
3.3.4. Growth rate determination ... 24
3.3.5. Biomass harvesting ... 25
3.4. Overexpression of AtSAT5 ... 25
3.4.1. Primer design ... 25
3.4.2. AtSAT5 Colony transformation assessment in E. coli... 26
3.4.3. Colony PCR ... 29
3.4.4. AtSAT5 overexpression ... 30
3.4.6. OAS-TL purification ... 32
3.4.7. Algal OAS-TL extraction ... 34
3.4.8. Determination of protein content ... 35
3.4.9. SDS-Polyacrylamide Gel Electrophoresis (SDS-PAGE) ... 36
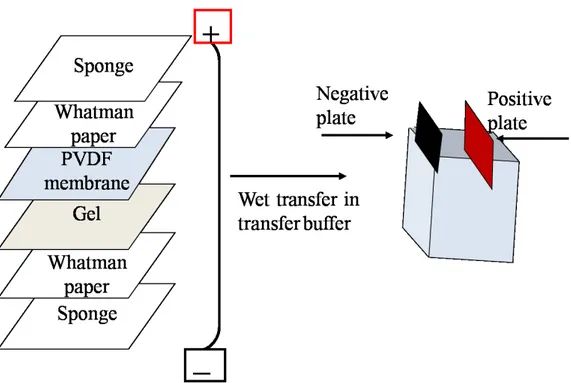
3.4.10. Western Blots ... 39
3.5. OAS-TL activity measurements ... 41
3.6. Cysteine Synthase Complex purification ... 42
3.7. Determination of the impact of the plastoquinone redox state on ATPS activity ... 46
4. Results ... 51
4.1. Bioinformatics ... 51
4.1.1. Phylogeny of Serine Acetyltransferase... 51
4.1.2. Phylogeny of O-Acetylserine (thiol) lyase ... 54
4.1.3. Observations on SAT and OAS-TL protein sequences ... 57
4.1.3.1. Number of cysteine residues in algae SAT sequences ... 57
4.1.3.2. Predicted location of SAT proteins ... 57
4.1.3.3. Number of cysteine residues in algal OAS-TL sequences ... 61
4.1.3.4. Predicted OAS-TL location ... 61
4.1.4. Comparison of SAT and OAS-TL sequences among algae and with A. thaliana sequences ... 66
4.1.4.1. Alignment of the SAT sequences of Cyanobacteria with A. thaliana SAT isoforms ... 66
4.1.4.2. Alignment of the SAT sequences of green algae with A. thaliana SAT isoforms ... 67
4.1.4.3. Alignment of the SAT sequences of red algae and red-lineage algae with A. thaliana SAT isoforms ... 68
4.1.4.4. Alignment of the OAS-TL sequence of Cyanobacteria with OAS-TL isoforms of A. thaliana ... 71
4.1.4.5. Alignment of the OAS-TL sequence of green algae with OAS-TL isoforms of A. thaliana... 71
4.1.4.6. Alignment of the OAS-TL sequence of red algae and red-lineage algae with OAS-TL isoforms of A. thaliana ... 72
4.1.5. Main motives of SAT and OAS-TL algal sequences ... 76
4.1.5.1. SAT sequences main motives in algae... 76
4.1.5.2. Main motives in algal OAS-TL sequences ... 81
4.2. OAS-TL from algae ... 90
4.2.1. OAS-TL purification ... 90
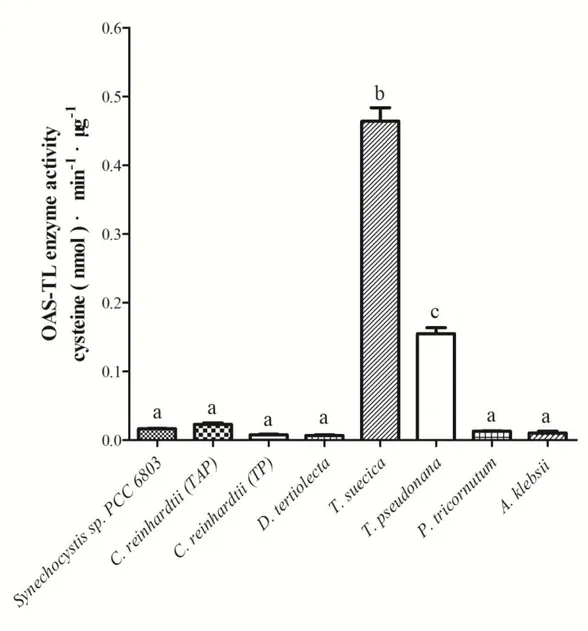
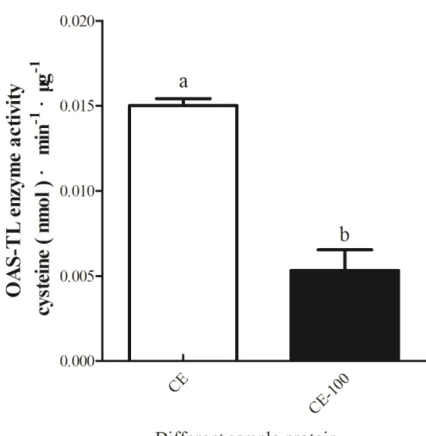
4.2.2. OAS-TL enzyme activity in crude extract ... 97
4.2.3. OAS-TL specific activityin different microalgae ... 107
4.2.4. Cysteine Synthase Complex (CSC) ... 108
4.3. In vivo redox regulation of ATP-S activity ... 115
5. Discussion ... 121
5.1. SAT and OAS-TL in algae ... 121
5.2. Cysteine Synthase Complex in algae ... 123
6. References ... 129
7. Supplemental material... 144
7.1. Growth curves ... 144
7.2. Correlation between relative mobility of protein with protein size ... 148
7.3. Comparision of algae SAT and OAS-TL with A. thaliana sequences ... 152
7.3.1. Alignment of the SAT sequences of Cyanobacteria with A. thaliana SAT isoforms ... 152
7.3.2. Alignment of the SAT sequences of green algae with A. thaliana SAT isoforms 155 7.3.3. Alignment of the SAT sequences of red algae and red-lineage algae with A. thaliana SAT isoforms ... 161
7.3.4. Alignment of the OAS-TL sequence of Cyanobacteria with A. thaliana OAS-TL isoforms ... 167
7.3.5. Alignment of the OAS-TL sequence of green algae with A. thaliana OAS-TL isoforms ... 172
7.3.6. Alignment of the OAS-TL sequence of red and red-lineage algae with A. thaliana OAS-TL isoforms ... 181
7.4. The amino acid code ... 193
LIST OF FIGURES
Fig. 1-1. Sulphate metabolism in algal cells.. ... 8
Fig. 3-1. Synechocystis sp. PCC 6803. ... 16
Fig. 3-2. Chlamydomonas reinhardtii. ... 17
Fig. 3-3. Dunaliella tertiolecta... 18
Fig. 3-4. Tetraselmis suecica. ... 18
Fig. 3-5. Thalassiosira pseudonana. ... 19
Fig. 3-6. Phaeodactylum tricornutum. ... 19
Fig. 3-7. Amphidinum klebsii ... 20
Fig. 3-8. AtSAT5-pET28a construct map. ... 27
Fig. 3-9. Protein loading onto the affinity chromatography column. ... 33
Fig. 3-10. Procedure followed for affinity chromatography... 34
Fig. 3-11. Assembly of a western blot sandwich. ... 39
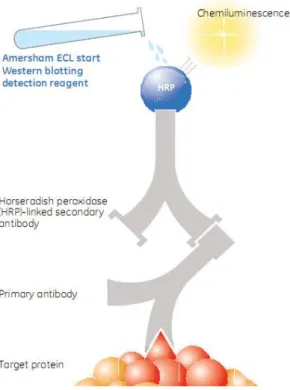
Fig. 3-12. Principle of operation of the Amersham ECL Western blotting detection reagent. 40 Fig. 3-13. Basic principles of size exclusion chromagraphy. ... 43
Fig. 3-14. Fast Protein Liquid Chromatography (FPLC). ... 44
Fig. 3-15. FPLC Protein standards for column calibration. ... 45
Fig. 3-16. FPLC column calibration curve. ... 45
Fig. 3-17. DCMU blocks the electron transfer from QA to QB... 47
Fig. 4-1. Serine Acetyltransferase phylogenetic tree. ... 53
Fig. 4-2. The O-Acetylserine (thiol) lyase phylogenetic tree. ... 56
Fig. 4-3. Alignment of the SAT protein of the freshwater cyanobacterium Synechocystis sp. PCC 6803 and the SAT protein of A. thaliana. ... 67
Fig. 4-4. Alignment of SAT protein of algae and A. thaliana. ... 80
Fig. 4-5. Alignment of OAS-TL of algae and A. thaliana. ... 87
Fig. 4-6. Elution pattern of OAS-TL protein from different algal species. ... 94
Fig. 4-7. Immunodetection of OAS-TL purified from Synechocystis sp. PCC 6803. ... 95
Fig. 4-8. Immunodetection of OAS-TL purified from Chlamydomonas reinhardtii grown in TAP medium. ... 95
Fig. 4-9. Immunodetection of OAS-TL purified from Chlamydomonas reinhardtii grown in TP medium. ... 95
Fig. 4-10. Immunodetection of OAS-TL purified from Dunaliella tertiolecta. ... 96
Fig. 4-11. Immunodetection of OAS-TL purified from Tetraselmis suecica. ... 96
Fig. 4-12. Immunodetection of OAS-TL purified from Thalassiosira pseudonana. ... 96
Fig. 4-13. Immunodetection of OAS-TL purified from Phaeodactylum tricornutum... 96
Fig. 4-14. Immunodetection of OAS-TL purified from Amphidinium klebsii. ... 97
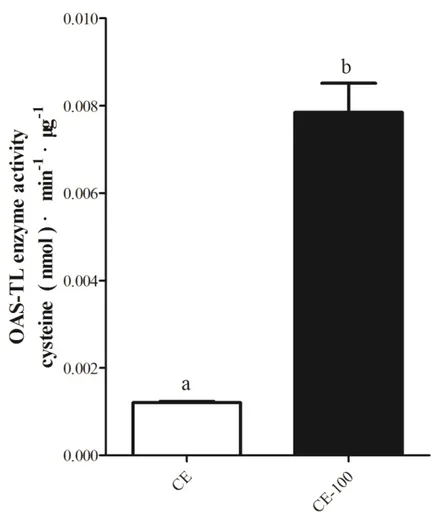
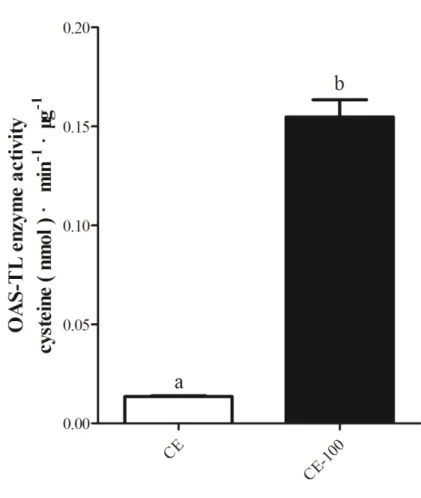
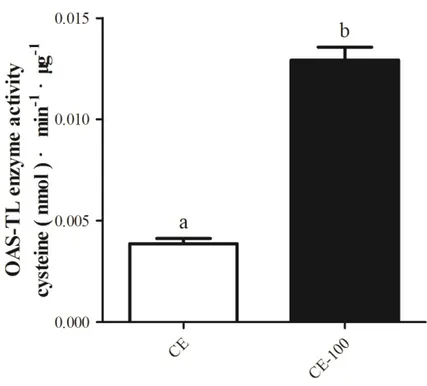
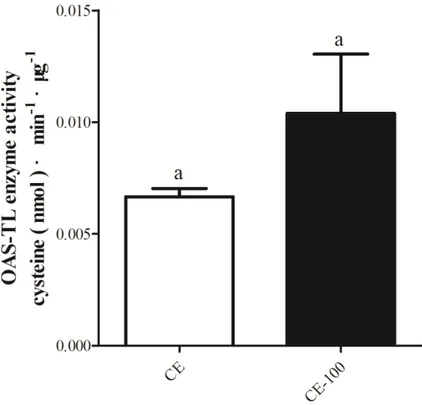
Fig. 4-15. OAS-TL enzyme activity in crude extracts of different algae. ... 98
Fig. 4-16. OAS-TL activity per unit of protein in crude and diluted extracts of Synechocystis sp. PCC 6803... 99
Fig. 4-17. OAS-TL activity per unit of protein in crude and diluted extracts of Chlamydomonas reinhardtii cultured in TAP medium. ... 100
Fig. 4-18. OAS-TL activity per unit of protein in crude and diluted extracts of
Chlamydomonas reinhardtii cultured in TP medium. ... 101
Fig. 4-19. OAS-TL activity per unit of protein in crude and diluted extracts of Dunaliella
tertiolecta. ... 102
Fig. 4-20. OAS-TL activity per unit of protein in crude and diluted extracts of Tetraselmis
suecica. ... 103
Fig. 4-21. OAS-TL activity per unit of protein in crude and diluted extracts of Thalassiosira
pseudonana. ... 104
Fig. 4-22. OAS-TL activity per unit of protein in crude and diluted extracts of
Phaeodactylum tricornutum. ... 105
Fig. 4-23. OAS-TL activity per unit of protein in crude and diluted extracts of Amphidinium
klebsii. ... 106
Fig. 4-24. OAS-TL enzyme activity. ... 108 Fig. 4-25. FPLC chromatogram for OAS-TL from different algae complexed with SAT-5 from A. thaliana. ... 109 Fig. 4-26. Immunodetection of OAS-TL from Synechocystis sp. PCC 6803 after elution of the CSC with SAT-5 by FPLC. ... 110 Fig. 4-27. Immunodetection of OAS-TL from Chlamydomonas reinhardtii in TAP medium after elution of the CSC with SAT-5 by FPLC. ... 110 Fig. 4-28. Immunodetection of OAS-TL from Dunaliella tertiolecta after elution of the CSC with SAT-5 by FPLC. ... 111 Fig. 4-29. Immunodetection of OAS-TL from Tetraselmis suecice after elution of the CSC with SAT-5 by FPLC. ... 111 Fig. 4-30. Immunodetection of OAS-TL from Thalassiosira pseudonana after elution of the CSC with SAT-5 by FPLC. ... 112 Fig. 4-31. Immunodetection of OAS-TL from Phaeodactylum tricornutum after elution of the CSC with SAT-5 by FPLC. ... 112 Fig. 4-32. Immunodetection of OAS-TL from Amphidinium klebsii after elution of the CSC with SAT-5 by FPLC. ... 113 Fig. 4-33. Western blot using antibodies raised against SAT-5 from A. thaliana. ... 114 Fig. 4-34. Fv/Fm of Thalassiosira pseudonana incubated in the presence of 5 and 10 µM DCMU, for 0, 1, 3 and 6 hours... 115 Fig. 4-35. Thalassiosira pseudonana cell number during incubation with 10 μM DCMU. . 116 Fig. 4-36. Thalassiosira pseudonana cell volume during incubation with 10 μM DCMU. .. 116 Fig. 4-37. Comparison of ATPS assay blanks obtained with different procedures. The error bars show the standard deviations (n = 3). ... 117 Fig. 4-38. Comparison of ATPS activity in the presence and absence of DMSO. ... 118 Fig. 4-39. Thalassiosira pseudonana ATP-S activity in the presence or absence of 10 μM DCMU over a period of 6 hours. The error bars show the standard deviations (n = 3). ... 119 Fig. 5-1. Proposed structure of Algae Cysteine Synthase Complex. ... 126 Fig. 7-1. Synechocystis sp. PCC 6803 growth curve. ... 144 Fig. 7-2. Calibration curve to convert the OD of Synechocystis sp. PCC 6803 cultures to cell numbers. ... 144
Fig. 7-3. Growth curve of Chlamydomonas reinhardtii cultured in TAP medium ... 145
Fig. 7-4. Growth curve of Chlamydomonas reinhardtii cultured in TP medium ... 145
Fig. 7-5. Dunaliella tertiolecta growth curve ... 146
Fig. 7-6. Tetraselmis suecica growth curve. ... 146
Fig. 7-7. Thalassiosira pseudonana growth curve. ... 147
Fig. 7-8. Phaeodactylum tricornutum growth curve. ... 147
Fig. 7-9. Amphinidium klebsii growth curve. ... 148
Fig. 7-10. Standard curve for the determination of protein size from the relative protein mobility in binding affinity test chromatography for Synechocystis sp.PCC 6803. ... 148
Fig. 7-11. Standard curve for the determination of protein size from relative protein mobility in binding affinity test chromatography for Chlamydomonas reinhardtiiwith TAP medium culture extract. ... 149
Fig. 7-12. Standard curve for the determination of protein size from the relative protein mobility in binding affinity test chromatography for Chlamydomonas reinhardtii with TP medium culture extract. ... 149
Fig. 7-13. Standard curve for the determination of protein size from the relative protein mobility in binding affinity test chromatography for Tetraselmis suecica extract. ... 150
Fig. 7-14. Standard curve for the determination of protein size from the relative protein mobility in binding affinity test chromatography for Dunaelilla tertiolecta extract. .... 150
Fig. 7-15. Standard curve for the determination of protein size from the relative protein mobility in binding affinity test chromatography for Thalassiosira psedonana extract. ... 151
Fig. 7-16. Standard curve for the determination of protein size the relative protein mobility in binding affinity test chromatography for Phaedactylum tricornum extract. ... 151
Fig. 7-17. Standard curve for the determination of protein size from the relative protein mobility in binding affinity test chromatography for Amphidinium klebsii extract. ... 152
Fig. 7-18. Alignment of Synechocystis sp. PCC 6803 SAT amino acid sequences with A. thaliana. ... 153
Fig. 7-19. Alignment of Synechococcus sp. WH 7803 SAT amino acid sequences with A. thaliana. ... 154
Fig. 7-20. Alignment of 1-C. reinhardtii SAT amino acid sequence with A. thaliana isoforms. ... 156
Fig. 7-21. Alignment of 2-C. reinhardtii SAT amino acid sequence with A. thaliana isoforms. ... 157
Fig. 7-22. Alignment of 1-T. suecica SAT amino acid sequence with A. thaliana isoforms. 158 Fig. 7-23. Alignment of 2-T. suecica SAT amino acid sequence with A. thaliana isoforms. 159 Fig. 7-24. Alignment of 3-T. suecica SAT amino acid sequence with A. thaliana isoforms. 160 Fig. 7-25. Alignment of 1-C. merolae SAT amino acid sequence with A. thaliana isoforms. ... 162
Fig. 7-26. Alignment of 2-C. merolae SAT amino acid sequence with A. thaliana isoforms. ... 163
Fig. 7-27. Alignment of T. pseudonana SAT amino acid sequence with A. thaliana isoforms. ... 164 Fig. 7-28. Alignment of P. tricornutum SAT amino acid sequence with A. thaliana isoforms.
... 165
Fig. 7-29. Alignment of E. huxleyi SAT amino acid sequence with A. thaliana isoforms. ... 166
Fig. 7-30. Alignment of 1-Synechocystis sp. PCC 6803 OAS-TL amino acid with A. thaliana isoforms. ... 168
Fig. 7-31. Alignment of 2-Synechocystis sp. PCC 6803 OAS-TL amino acid with A. thaliana isoforms. ... 169
Fig. 7-32. Alignment of 1-Synechococcus sp. WH 7803 OAS-TL amino acid with A. thaliana isoforms. ... 170
Fig. 7-33. Alignment of 2-Synechococcus sp. WH 7803 OAS-TL amino acid with A. thaliana isoforms. ... 171
Fig. 7-34. Alignment of 1-C. reinhardtii OAS-TL amino acid with A. thaliana isoforms. ... 173
Fig. 7-35. Alignment of 2-C. reinhardtii OAS-TL amino acid with A. thaliana isoforms. ... 174
Fig. 7-36. Alignment of 3-C. reinhardtii OAS-TL amino acid with A. thaliana isoforms. ... 175
Fig. 7-37. Alignment of 4-C. reinhardtii OAS-TL amino acid with A. thaliana isoforms. ... 176
Fig. 7-38. Alignment of 1-T. suecica OAS-TL amino acid with A. thaliana isoforms. ... 177
Fig. 7-39. Alignment of 2-T. suecica OAS-TL amino acid with A. thaliana isoforms. ... 178
Fig. 7-40. Alignment of 3-T. suecica OAS-TL amino acid with A. thaliana isoforms. ... 179
Fig. 7-41. Alignment of 4-T. suecica OAS-TL amino acid with A. thaliana isoforms. ... 180
Fig. 7-42. Alignment of 1-C. merolae OAS-TL amino acid with A. thaliana isoforms. ... 182
Fig. 7-43. Alignment of 2-C. merolae OAS-TL amino acid with A. thaliana isoforms. ... 183
Fig. 7-44. Alignment of 1-T. pseudonana OAS-TL amino acid with A. thaliana isoforms. . 184
Fig. 7-45. Alignment of 2-T. pseudonana OAS-TL amino acid with A. thaliana isoforms. . 185
Fig. 7-46. Alignment of 1-P. tricornutum OAS-TL amino acid with A. thaliana isoforms. . 186
Fig. 7- 47. Alignment of 2-P. tricornutum OAS-TL amino acid with A. thaliana isoforms. 187 Fig. 7-48. Alignment of E. huxleyi OAS-TL amino acid with A. thaliana isoforms. ... 188
Fig. 7-49. Alignment of 1-A. klebsii OAS-TL amino acid with A. thaliana isoforms... 189
Fig. 7-50. Alignment of 2-A. klebsii OAS-TL amino acid with A. thaliana isoforms... 190
Fig. 7-51. Alignment of 3-A. klebsii OAS-TL amino acid with A. thaliana isoforms... 191
Fig. 7-52. Alignment of 4-A. klebsii OAS-TL amino acid with A. thaliana isoforms... 192
LIST OF TABLES
Table. 3-1. Primer for AtSAT5 amplification ... 26
Table. 3-2. Reagents for Peterson‟s protein assay ... 36
Table. 3-3. Recipe for the SDS-PAGE resolving gel buffer ... 38
Table. 3-4. Recipe for the SDS-PAGE Stacking gel buffer ... 38
Table. 3-5. Resolving gel (for 2 gels in the Protean minigel system)... 38
Table. 3-6. Stacking gel (for 2 gels in the Protean minigel system). ... 38
Table. 3-7. Coomassie Staining solution ... 38
Table. 3-8. Coomassie Destaining solution ... 38
Table. 4-1. Number of Cysteines residues, sequence length and location of algae serine acetyltransferase (SAT) ... 59
Table. 4-2. O-acetylserine (thiol) lyase (OAS-TL) of algae with different taxonomy, ecology, and the location prediction ... 62
Table. 4-3. Comparasion of N‟-terminus and C‟-terminus sequences of algal SAT the corresponding regions as A. thaliana SAT isoforms ... 69
Table. 4-4. Identity and similarity of algal SAT protein sequence with A. Thaliana isoforms 70 Table. 4-5. Alignment of N‟-terminus and C‟-terminus sequences of algal OAS-TL corresponding regions in A. thaliana OAS-TL isoforms ... 74
Table. 4-6. Identity and Similarity of algae OAS-TL with reference species of A. thaliana isoforms ... 75
Table. 4-7. Main binding motives in OAS-TL sequences ... 88
Table. 4-8. Features of purified algae OAS-TL... 91
Table. 4-9. Summary of OAS-TL activity in 100-fold diluted and undiluted crude extracts. ... 106
1. Introduction
1.1. Impact of sulfur availability on algae ecology, evolution
and radiation
Photosynthetic organisms acquire the macronutrient sulfur (S) as sulfate (SO42−), with
the highest oxidation number of +6. Sulfur, however, is assimilated into organic matter (in cysteine) as sulfide (S-2). Consequently, a conspicuous amount of reducing power is needed to support S assimilation. In embryophytes, this reducing power can derive from linear electron transport, from the pentose phosphate shunt or from the mitochondrial electron transfer chain (Schmidt, 1979). Sulfur assimilation in algae is believed to be more strictly dependent on photosynthesis (Schmidt, 1979).
On average, S is typically below 1 mM (sometimes, much below this value) in freshwater, but it is very abundant in the ocean (about 29 mmol L−1). This makes S never limited in the ocean, although in oligotrophic freshwaters, there are indications that S-limitation may be possible (Giordano, 2005).
The concentration of S in the oceans has not always been so high (Ratti et al., 2011). Sulfate concentration was probably around 200 μmol L−1 when the first cyanobacteria
appeared (Habicht et al., 2002), and raised to less than 5 mM in the Proterozoic Era and to 10-15 mM in the late Palaeozoic Era (Shen et al., 2002; Canfield, 2004; Kah et al., 2004). At the beginning of the Mesozoic, sulfate concentration increased stepwise to a concentration of 13-27 mM (Giordano & Prioretti, 2016.) In concomitance with the Mesozoic increase of oceanic S, phytoplankton composition changed and a domination shift from green algae to the red-lineage algae occurred (Giordano, 2005; Ratti et al., 2011; Knoll et al., 2017). It has been proposed that this shift in dominance was favored, although not fully determined, by the sulfate increase (Sulfate
Facilitation Hypothesis, Ratti et al., 2011; Prioretti et al., 2014).
It is still not clear if the influence of S on phytoplankton radiation was associated with differences in the S metabolism of red-lineage algae compared to green algae or if the increased S availability exerted an indirect effect on the success of some clades (Giordano & Prioretti, 2016); the indirect effect of S may have been associated to the higher S quotas of red lineage algae, which allocate a large portion of S to dimethylsulfoniopropionate (DMSP) (Ratti et al., 2011; Norici et al., 2005). The synthesis of DMSP may have been a response to ocean oxygenation, which led to a decrease of N availability: DMSP, under these circumstances, would have been a cheaper osmolyte than the N-containing glycine betaine (Andreae, 1986; Dacey et al., 1987; Turner & Beidel, 1988; Gröne & Kirst, 1992; Andreae & Meinrat, 1990; Liss et al., 1997; McNeil et al., 1999). DMSP, when a cell is lysed due to predation or other causes, is degraded by bacterial lyases (de Souza & Yoch, 1995a, b; Yoch et al., 1997) and marine algae DMSP lyases (Steinke et al., 1996; Steinke & Kirst, 1996; Stefels, 2000); the products of such degradation are DMS and acrylate, both capable of anti-grazing activity (Steinke et al., 2002a; Steinke et al., 2002b).
Thus, the increased grazing pressures exerted by some micrograzers (especially copepods) at the beginning of the Mesozoic era (see Giordano et al., 2018 for a discussion on this event) may have exerted a selective pressure in favor of those phytoplankton clades more capable of responding to the challenge, among these those groups with a higher S cell quota and thus a higher DMSP content (Prioretti & Giordano, 2016).
1.2. Sulfur metabolism
1.2.1. Sulfate acquisition
Three main types of sulfate transporters have been identified in algae. As described in Fig. 1-1. In the plasmalemma of eukaryotic algae, H+/SO42− (SULTR) and Na+ /SO42−
(SLT) co-transporters have been identified; the expression of both types of transporters is induced by low sulfate availability. The proton gradients across the plasmalemma possibly energize, more or less directly, these transporters. In Cyanobacteria, sulfate transport is carried out by an ATP-binding-cassette (ABC) transporter, with a transmembrane channel constituted by the SulP and SulP2 proteins (SULP stands for sulfate permeases). A sulfate binding protein (Sbp) is linked to the Sup and SulP2 proteins, on the side of the protein emerging on the extracellular face of plasmalemma; ATP-binding proteins (Sabc) are instead present on the cytosolic portion of Sulp and Sulp2; the Sabc catalyzes the hydrolysis of ATP, which energizes the transport of sulfate (Melis & Chen, 2005). Interesting, a similar type of transporter is present on the inner chloroplast membrane of Chlamydomonas reinhardtii (Lindberg & Melis, 2008).
1.2.2. Sulfate reduction
In photosynthetic organisms, sulfate reduction occurs in the chloroplast. The only known exception is Euglena gracilis, which reduces sulfate in the mitochondrion (Takahashi et al., 2011). Sulfate reduction is a rather complicated process, due to the fact that the redox potential of the sulfate/sulfite pair is too negative (E0‟ = -0.454) for
the cell electron donors to provide the energy for this chemical transformation. For sulfate to be reduced to sulfite, it needs to be activated to adenosine 5ˊ-phosphosulfate (APS. E0‟ = -0.060) (Schmidt & Jager, 1992). This sulfate adenylation was catalyzed
by the enzyme ATP sulfurylase (ATPS; EC 2.7.7.4). Algal ATPS differ from those of vascular plants (Prioretti et al., 2014). Among the most typical features of algal ATPS is the high number of cysteine residues. It has been shown that, in oceanic cyanobacteria and in eukaryotic algae, some of these cysteine residues are involved in
the redox regulation of ATPS (Giordano & Prioretti, 2016; Prioretti et al., 2016). The ATPS of dinoflagellates and freshwater and coastal cyanobacteria, instead, appears not to be subject to redox regulation (Giordano & Prioretti, 2016; Prioretti et al., 2016).
The APS generated in the reaction of ATPS is then reduced to sulfite with the intervention of APS reductase (APR; EC 1.8.4.9). In vascular plants, glutathione is used as the donor of reducing power in this reaction; no direct evidence on whether this is the case in algae exists. The sulfite generated in the reaction catalyzed by APR is further reduced to sulfide by a ferredoxin-dependent sulfite reductase (EC 1.8.7.1); 6 electrons are required for this reduction.
Instead of being used for the production of reduced S, APS can also initiate the sulfation pathway. In this case, APS is probably produced by different isoforms of ATPS from those used in the plastid for sulfate reduction, mostly located in the cytosol; unfortunately, not much is known on sulfation in algae and thus I can only provide limited and anecdotical information on this pathway. Sulfation, in vascular plants, requires that APS is further phosphorylated by APS kinase (APK; EC 2.7.1.25); 3ˊ-phosphoadenosine 5ˊ-phosphosulfate is thus produced PAPS; (Takahashi et al., 2011). PAPS is used by sulfotransferases (EC 2.8.2.24) to donate sulfate groups to all sorts of different molecules (Giordano & Prioretti, 2016). This is mostly done to increase the polar character of molecules and make them more soluble (Dahl et al., 2008).
1.2.3. Cysteine synthesis
Once sulfide is produced, it is assimilated into organic matter by the production of the S-amino acid cysteine. Cysteine synthesis requires two reactions. The first reaction is catalyzed by the enzyme serine acetyltransferase (SAT; EC 2.3.1.30), which produces
O-acetylserine (OAS) from serine and acetyl-CoA (Fig. 1-1,). O-acetylserine, together with sulfide, then acts as the substrate of OAS-(thiol) lyase (OAS-TL; EC 4.2.99.8), which catalyzes the synthesis of cysteine (Leustek et al., 2000; Kopriva, 2006). SAT and OAS-TL are regulated through the assemblage and disassemblage of a complex, the so called Cysteine Synthase Complex (CSC) (Bogdanova & Hell, 1997). The complex does not facilitate the reaction by substrate channeling, because the OAS-TL is not functional when complexed with SAT; the synthesis of cysteine is only accomplished by free OAS-TL (Droux et al., 1998; Wirtz et al., 2001).
In vascular plants, SAT is a hexamer of 29 kDa subunits. It is a member of the hexapeptide acyltransferase enzyme family (Olsen et al., 2004). The functional analysis of SAT domains, using the yeast two-hybrid system, showed that the N-terminal α-helical domain of SAT is involved in SAT/SAT interaction; the C-terminal domain, instead appears to be responsible for both enzymatic activity and SAT/OAS-TL interaction (Bogdanova & Hell, 1997). The idea of a bifunctional C-terminal SAT domain was further strengthened by the modelling of the C-terminus of plant SAT using bacterial acyltransferase structures as templates (Hell & Wirtz, 2008). The location of SAT is already known in different higher plants: Arabidopsis SAT isoform located in mitochondria (Roberts & Wray, 1996; Noji et al., 1998; Wirtz et al., 2001; Krueger et al., 2009), Arabidopsis SAT located in the plastid (Murillo et al., 1997; Noji et al., 1998; Krueger et al., 2009), Arabidopsis SAT located in the cytosol (Howarth et al., 1997; Noji et al., 1998; Howarth et al., 2003), Citrullus
vulgaris (watermelon) SAT2 (Saito et al., 1995), spinach SATase Allium tuberosum
ASAT5 (Urano et al., 2000), Glycine max cytosolic isoform SATase1 (Chronis & Krishnan, 2004), through the domain analised of O. parapolymorpha SAT (OpSat1p) and other fungal SATs the new research data revealed a mitochondrial targeting sequence (MTS) at the N-terminus and an α/ hydrolase one domain at the C-terminal region possessed in the fungal (Yeon et al., 2018).
O-acetylserine (thiol) lyase (EC 4.2.99.8) (OAS-TL) is also known as O-acetylserine sulfhydrylase or cysteine synthase (CSase) belongs to the family of -replacement enzymes (Kopriva et al., 2008). OAS-TL, in embryophytes, is a homodimer with 35
kDa subunits (León et al., 1987). In higher plants and algae, isoforms of OAS-TL are located in the cytosol (Álvarez et al., 2010), mitochondria (Álvarez et al., 2012), and plastids (Heeg et al., 2008).
The structure of the first plant OAS-TL was recently resolved, demonstrating a high degree of conformational similarities between plant and enterobacterial OAS-TL (Bonner et al., 2005); such similarities allow plant and bacteria OAS-TL to form stable homodimers, with a molecular weight from 68 to 75 kDa. Crystallization of OAS-TL from bacteria showed that each OAS-TL subunit carries a tightly bound pyridoxal 5′-phosphate at the catalytic site (Hatzfeld et al., 2000). The conservation of the active site residues strongly supports the idea that the same prokaryotic and eukaryotic OAS-TLs share the same kinetic mechanism.
SAT and OAS-TL of bacteria and embryophytes form CSC of similar size (Becker et al., 1968; Kredich et al., 1969). By using size-exclusion chromatography, a total molecular weight of 309 kDa for the hetero-oligomeric CSC was determined from
Salmonella typhimurium (Kredich et al., 1969); 160 kDa were attributed to two SAT
trimer and 68 kDa were due to a OAS-TL dimer (Kredich & Becker, 1969). In
Arabidopsis thaliana, the Cysteine Synthase Complex is formed when an excess of
sulfide is present and is disassembled when OAS accumulates in the cell (Droux et al., 1998; Hell & Wirtz, 2011).
Fig. 1-1. Sulphate metabolism in algal cells.
An overall view of sulphur assimilation and of sulphation is depicted here (Giordano & Prioretti, 2016): the enzymes are indicated in red, metabolites in blue and transporters in black. The light blue lines indicate the reactions of the reductive sulphate assimilation pathway; the dark purple lines indicate reactions of the sulphation pathway; dashed lines indicate putative pathways for metabolite transport that are not been incon- trovertibly demonstrated. ABC ATP-binding cassette SO42−transporter, APK APS kinase, APR APS reductase, APS adenosine 5′-phosphosulphate, ATPS ATP sulphurylase, CBL cystathionine -lyase,
CGS cystathionine -synthase, CLT thiol transporter (chloroquine resistance transporter-like transporter, Cys cysteine, Cyst cystathionine, -ECS -glutamylcysteine synthetase, GGT -glutamyltransferase, Glu glutamate, -Glu-Cys -glutamylcysteine, GSH glutathione, GSHS glutathione synthetase,
GST glutathione-S- transferase, GS-X glutathione conjugate, Hcy homocysteine, Met methionine, MRP multidrug resistance-associated protein, MS methio- nine synthase, OAS O-acetylserine, OAS-TL OAS (thiol) lyase, OPH O-phosphohomoserine, PAPS 3′-phosphoadenosine 5′-phosphosulphate, R-OH hydroxylated precursor, SAM S-adenosylmethionine, SAT serine acetyltrans- ferase, Ser serine, SiR sulphite reductase, SLT Na+/SO42− transporter, SOT
2. Hypotheses
In this thesis, I focused on the first and on the last step of the S assimilation pathway.
The first step, the one catalyzed by ATPS, still requires to be elucidated with respect to the invivo mechanisms for redox regulation. By similarity with other enzymes (e.g. nitrate reductase; Giordano et al., 2005), I hypothesize that:
Hp 1: the perception of the availability of redox power for the initiation of sulfate assimilation is constituted by the redox state of the plastoquinone pool of the electron transfer chain in the chloroplast.
The reduction state of the plastoquinone pool is the indicator of the rate of electron transport and of the level of reduction of ferredoxin, which possibly is the main donor of electrons for sulfate assimilation. It would, therefore, be a good sensor for the overall availability of electrons available for the reduction of sulfate to sulfide. If such a regulation mechanisms exists, this would represent a major difference with respect to embryophytes: in embryophytes, the main control step of sulfate reduction is at APR reduction (Takahashi et al. 2011); if ATPS activity is finely regulated in
vivo via the redox state of the plastoquinone pool, this would move the first control
step of the pathway already at sulfate activation. This is intriguing because it would suggest that a greater control on energy investment exists on S assimilation in algae, which would not commit to the use of ATP for sulfate activation, unless sufficient redox power for the completion of the pathway is available.
data on SAT and OAS-TL from algae, it is not possible to generalize the regulatory mechanism proposed for embryophytes to all photosynthetic organisms. I thus intended to verify whether a CSC is involved in cysteine synthesis in algae and test the following hypothesis:
3. Materials and methods
3.1. Bioinformatic methods
3.1.1. Protein sequences and phylogenetic trees
All protein sequences were obtained from the NCBI Protein Database (http://www.ncbi.nlm.nih.gov/protein/), both by looking for the SAT and OAS-TL sequences of specific organisms and by using BLASTP (protein-Basic Local Alignment Search Tool) (Altschul et al., 1990; Goujon et al., 2010; Sievers et al., 2011). The phylogenetic analysis was conducted using the MEGA 5.0 software (Tamura et al., 2011). The Maximum Likely hood method was used for the construction of phylogenetic trees (Saitou & Nei, 1987; Sanderson & Driskell, 2003). The bootstrap values (Fron et al., 1996) shown on the tree branches represented the confidence level of clades, i.e. the number of reiterations (out of 100) of data analysis that gives the same branch (Karlin & Altschul, 1990). The evolutionary distance between branches (corresponding to the branch length) was computed using the Poisson correction method (Zuckerkandl & Pauling, 1965) and expressed in terms of the number of amino acid substitutions per site. All positions containing gaps and missing data were eliminated.
3.1.2. Predictions on the location of SAT and OAS-TL
proteins
online software (http://www.cbs.dtu.dk/services/TargetP/), as described in Emanuelsson and coauthors, 2007. Also, the on line software identified the sequences signal peptides and prediction of their cleavage sites (Nielsen et al., 1997).
The http://mobyle.pasteur.fr/cgi-bin/portal.py#jobs::boxshade online software was used to acquire the bioinformatic about the proteins and then to identify protein homogeneity predicting evolutionary relationship among different species (Koonin & Galperin, 2003).
3.1.3. Analysis of SAT and OAS-TL algae sequences
Fig. 4-4 and Fig. 4-5 showed the degree of SAT and OAS-TL conserved area in different species, respectively. Multiple sequence alignment was done with the T-Coffee on line software (http://tcoffee.crg.cat/apps/tcoffee/do:regular) (Notredame et al., 2000; Felix et al., 2005; Moretti et al., 2011; Weimbs & Santa, 2012). Representation of the alignment was done using the Boxshade program (http://www.ch.embnet.org/software/BOX_form.html). In the Boxshade figures, for clarity, only some species were shown for each algal clade.
Pairwise Sequence Alignment through the on line software (https://www.ebi.ac.uk/Tools/psa/emboss_matcher/) EMBOSS Matcher identifies local similarities between two sequences using a rigorous algorithm based on the LALIGN application (Koonin, & Galperin, 2003; Kleckner et al., 2016).
3.2 Experimental organisms
3.2.1. Synechocystis sp. PCC 6803
Fig. 3-1. Synechocystis sp. PCC 6803.
The cyanobacterium Synechocystis (phylum Cyanobacteria, order Chroococcales) (Fig. 3-1) (Selim et al., 2018) is a freshwater organism with cells of about 2 µm in diameter, and coccoid in shape. The cells blue-green color is mainly due to phycocyanin, abundant in the antenna complex of photosystem II (PSII). In this thesis I used strain PCC 6803, which is the first photoautotrophic organism whose genome was fully sequenced (Nakamura et al., 1998); the size of Synechocystis PCC 6803 genome is 3.57 Mbp. The ease with which this organism can be cultivated and genetically manipulated (Kufryk et al., 2002) made it a model for the study of physiology and genetics of photosynthetic organisms.
3.2.2. Chlamydomonas reinhardtii
The Chlamydomonas reinhardtii (phylum Chlorophyta, class Chlorophyceae, order
Volvocales) (Fig. 3-2) is a ubiquitous freshwater green algae, with ovoid, biflagellate
Trans & Land, 1988; Rochaix, 1995), plastidial (203.4 Kbps; Maul et al., 2002) and nuclear (121 Mbps; Merchant et al., 2010) genomes have been sequenced and a large collection of mutants is available.
Fig. 3-2. Chlamydomonas reinhardtii.
3.2.3. Dunaliella tertiolecta
Unicellular green algae Dunaliella belong to the Chlorophytes (Oren-shamir et al., 1990; Oren, 2005). The algae were first described (Dunal, 1838), but it was not until 1905 that the name Dunaliella was given by Teodoresco (1905). Dunaliella tertiolecta (phylum Chlorophyta, class Chlorophyceae, order Volvocales) (Fig. 3-3) (Mesquita et al., 2013) is a marine green flagellate with a cell size of 10−12 µm. This genus is characterized by the absence of a rigid polysaccharide wall (Gibbs & Duffus, 1976), instead, cells are covered by the amorphous mucilaginous layer of variable thickness called a glycocalyx. Dunaliella cells are motile with two equally long flagella. In 2017 (Yao et al., 2017), RNA-Seq technology data were de novo assembled and annotated, 17,845 protein-coding transcripts resulted in Dunaliella tertiolecta (~95% completeness).
Fig. 3-3. Dunaliella tertiolecta.
3.2.4. Tetraselmis suecica
Tetraselmis suecica Strain 1878 (phylum Chlorophyta, class Chlorodendrophyceae,
order Chlorodendrales) (Fig. 3-4) (Mesquita et al., 2013) is a green marine flagellate alga. It is often classified in the informal group of Chlorella pyrenoidosa prasinophytes, some members of which belong to the basal Chlorophyta. A transcriptome was produced by M. Giordano and C. Delwiche (unpublished).
Fig. 3-4. Tetraselmis suecica.
(Photo by David Patterson and Bob Andersen via Encyclopedia of Life).
3.2. 5. Thalassiosira pseudonana
Coscinodiscusphyceae, order Thalassiosirales) (Fig. 3-5). Thalassiosira pseudonana is a small centric diatom with an average cell diameter of 2-15 μm. This diatom is found both as a single cell or chain colony of up to 6 cells. It is especially abundant in coastal waters. Its genome has been sequenced (Armbrust et al., 2004).
Fig. 3-5. Thalassiosira pseudonana.
(SEM Photo by N. Kröger, Alfred Wegener Institute, Germany).
3.2.6. Phaeodactylum tricornutum
Phaeodactylum tricornutum Bohlin 1897 (phylum Heterokonta, class Bacillariophyceae, order Naviculales) (Fig. 3-6) (Miyahara et al., 2014) is a pennate marine diatom, with little silicified cells (Lewin et al., 1958), and four morphotypes: oval, fusiform, triradiate and cruciform, the latter being rarely reported (He et al., 2014). P. tricornutum genome has been sequenced (Daboussi et al., 2014).
3.2.7. Amphidinium klebsii
The dinoflagellate group encompasses a variety of morphologically very dissimilar organisms. It includes marine and freshwater species; autotrophic, mixotrophic, and heterotrophic modes of nutrition; pelagic and benthic forms. Amphidinium klebsii (phylum Miozoa, Class Dinoflagellata, order Gymnodiniaceae) (Fig. 3-7) is a common dinoflagellate in temperate and tropical marine waters. The cell diameter is around 10-15 μm. A transcriptome was produced by M. Giordano and C. Delwiche (unpublished).
Fig. 3-7. Amphidinum klebsii. (photo by Jacob Larsen).
3.3. Cultures
3.3.1. Culture conditions
culture conditions for at least 4 generations.
3.3.1.1. Synechocystis sp. PCC 6803
Synechocystis sp. PCC 6803 was cultured in batch, in 250 mL Erlenmeyer flasks
containing 150 mL of algal suspension. Only for protein purification, for all species, larger (4 L) vessels were used. The growth temperature was 20 ± 0.5 ℃. Cultures were illuminated continuously with PAR (340-700 nm) light at an irradiance of 50 µmol photons m-2 s-1. The irradiance was measured with a quantometer (LI-250 Light Meter; LI-COR, Inc.). Cultures were bubbled with filter-sterilized air. As for all species, experiments were conducted on exponentially growing cells.
3.3.1.2. Eukaryotic algae
All eukaryotic species were cultured in the same conditions used for Synechocystis, except for the irradiance, which was 120 µmol photons m-2 s-1 (PAR).
3.3.2. Growth media.
3.3.2.1. BG-11 medium
For Synechocystis PCC 6803, BG-11 medium (Stanier et al., 1971) was used. BG-11 medium contained: NaNO3 (17.65 mmol L-1), K2HPO4 (0.23 mmol L-1),
MgSO4•7H2O (0.304 mmol L-1), CaCl2 (0.245 mmol L-1), citric acid (0.031 mmol L-1),
(0.0189 mmol L-1), and trace metals. The trace metal solution had the following composition: H3BO3 (0.0463 mmol L-1), MnCl2•4H2O (0.0091 mmol L-1),
ZnSO4•7H2O (0.00077 mmol L-1), Na2MoO4•2H2O (0.0016 mmol L-1), CuSO4•5H2O
(0.00032 mmol L-1), Co(Cl)2•6H2O (0.000172 mmol L-1), Tris-HCl pH 7.6 (10 mmol
L-1); 0.5 ml of this trace metal solution was used in 1 L of BG-11.
3.3.2.2. TAP and TP medium
Chlamydomonas reinhardtii was cultured in either Tris-Acetate-Phosphate (TAP)
medium or Tris-Phosphate (TP) minimal medium (Gorman & Levine, 1965). TAP medium contained: Trizma base (17.67 mmol L-1), NH4Cl (7.48 mmol L-1), CaCl2
(0.45 mmol L-1), MgSO4•7H2O (0.41 mmol L-1), Na2EDTA (0.13 mmol L-1),
FeSO4•7H2O (0.018 mmol L-1), ZnSO4•7H2O (0.077 mmol L-1), H3BO3 (0.18 mmol
L-1), MnCl2•4H2O (0.026 mmol L-1), MnCl2•4H2O (8.04 mmol L-1), CuSO4•5H2O
(0.0064 mmol L-1), Na2MoO4•2H2O (0.0032 mmol L-1), CoCl•6H2O (0.012 mmol
L-1), potassium phosphate buffer (1 mmol L-1), pH 7.2; 0.1% (v/v) glacial acetic acid was added to the medium to adjust the pH to 7.2, after the medium was autoclaved. TP medium had the same composition as TAP, with the exception of the acetic acid, which was omitted; the pH of TP medium was adjusted with HCl, after the medium was autoclaved, to obtain a final pH of 7.2.
3.3.2.3. Artificial Multipurpose Complement for the Nutrition of
Algae (AMCONA)
All other species were cultured in AMCONA medium (Fanesi et al., 2014). The composition of this medium was as follows: NaCl (363 mmol L-1), Na2SO4 (8.04
mmol L-1), KCl (8.04 mmol L-1), NaHCO3 (2.07 mmol L-1), KBr (725 µmol L-1),
H3BO3 (372 µmol L-1), NaF (65.7 µmol L-1), MgCl2•6H2O (41.2 mmol L-1),
CaCl2•2H2O (9.14 mmol L-1), SrCl2•6H2O (82 µmol L-1), NaNO3 (549 µmol L-1),
NaH2PO4•H2O (21 µmol L-1), NaSiO3•9H2O (205 µmol L-1), CuSO4•5H2O (40 nmol
L-1), Tris-HCl, Ph 8.0 (10 mmol L-1), FeCl3•6H2O (6.56 mmol L-1), Na2EDTA•2H2O
(6.56 mmol L-1), ZnSO4•7H2O (254 µmol L-1), CoSO4•7H2O (5.69 µmol L-1),
MnSO4•4H2O (6.1 µmol L-1), Na2MoO4•2H2O (6.1 µmol L-1), Na2SeO3 (1 µmol L-1),
NiCl2•6H2O (6.3 µmol L-1), Na2EDTA•2H2O (8.29 mmol L-1), Thiamine-HCl (297
µmol L-1), Biotin (4.09 µmol L-1), B12 (1.47 µmol L-1).
3.3.3. Determination of cell concentration
Since the cyanobacteria Synechocystis sp. PCC 6803 cell size is too small to be easily counted with an optical microscope and also counts with an automatic cell counter are not fully reliable, because cells are undistinguishable from debris and occasional bacteria, cell concentration of Synechocystis was routinely measured as optical density at 750 nm with a Beckman DU 640 Spectrophotometer (Beckman Coulter) (Zerulla & Ludt, 2016). At 750 nm, photosynthetic pigments do not significantly absorb light (Rabinowitch & Govindjee, 1969; Govindjee, 2004). In order to convert optical density to cell number, a calibration curve was made with samples containing serially diluted subsamples of a concentrated culture of Synechocystis sp. PCC 6803 of known cell concentration. The cell concentration of the reference Synechocystis sp PCC 6803 culture was determined by counts under a microscope (Zeiss Axioskop, Germany) applying the following equation:
Cell concentration (cell ml-1) = [N×S1/ S2]/ V1
Where S1 is the slide area (mm2); V1 is the sample volume (ml); S2 is 5 times the field area at a 400x magnification (mm2); N is the total cell number counted in 5 field areas.
Freshly made, 0.2 µm filtered cell free BG-11 medium was used as the blank. Slide area (mm2) was 24×40, the field area was 400 mm2.
To determine cell concentration of all the others experimental algae, cells were counted with an automatic cell counter CASY TT (Roche Innovatis, Mannheim, Germany). An aliquot of 100 µl of culture was diluted in 10 ml of CASYton, an electrolyte solution specifically developed by the counter manufacturer. The sample was sucked into the counter through a measuring capillary (60 µm pore size), at a constant flow rate. Then a pulsed low voltage (1 MHz) was applied between two platinum electrodes; the electrolyte provided the background electrical resistance. When a cell intersected the electric field in the capillary, the cell acted as an insulator and increased resistance between the electrodes. The number of cells was determined from the number of events of current disturbance. The duration of this change in conductivity is proportional to the size of cells (corresponding to the volume of electrolytes displaced by cells). This allowed the determination of a cell volume. Since dead cells are partially empty, they exert a lower resistance to the current and can therefore be discriminated from live cells. Cell concentration was determined twice or thrice per day and used to construct growth curved.
3.3.4. Growth rate determination
The specific growth rate, μ, was calculated from the equation below (Maqsood, 1974):
μ = lnX1t(day)− LnX2
Where X1 is the cell number at time 1 and X2 is cell number at time 2. Both time
points were chosen to be in the exponential growth phase; t is the time expressed in days.
3.3.5. Biomass harvesting
For all measurements/experiments, algae acclimated to the growth conditions were collected by centrifugation using are refrigerated centrifuge (Beckman, California, USA) equipped with a JA-10 rotor (Beckman, California, USA). The algal suspension was centrifuged at 5000 g, for 10 min, at 4 ℃. The pellet was collected and frozen -80 ℃ until used.
3.4. Overexpression of AtSAT5
In order to purify OAS-TL, Arabidopsis thaliana SAT5 (AtSAT5 or SAT-5) was used as the ligand in the affinity column. This protein was modified by a histidine tag, in view of its utilization as a ligand in affinity chromatography. It was then overexpressed in E. coli, after transfection of the bacterium with the plasmid pET28a, into which the AtSAT5 gene had been inserted (Fig. 3-8). The plasmid containing the His-Tagged AtSAT5 was kindly donated by Prof. Ruediger Hell, Heidelberg University.
The amount of plasmid was determined by reading the DNA concentration in MilliQ water using a NANODROP 1000 spectrophotometer V3.8 (Thermofisher, Massachusetts, USA). The concentration used for the transformation was 20 ng/μl.
In order to verify that the gene of interest was in the plasmid and then in the transformed cells, primers specific for AtSAT5 (Gene ID: 835778, SAT 5: AT5G56760) (Tabata et al., 2000) were designed with the Prim Primer, 5.0 software. Their sequences were shown in Table. 3-1. the gene regions that these primers amplified were located at the beginning, middle and end of the AtSAT5 DNA sequence.
Table. 3-1. Primer for AtSAT5 amplification
Gene Name Length Primer sequence
AtSAT5-1 187 bp FW: AAACAGCGGTGATTGGGAAC; RV: ATCAGCACAACAGAACCAGC
AtSAT5-2 307 bp FW: CAGAAGCAGCGTCAGC; RV: TCACGAACACGAGCAG
AtSAT5-3 285 bp FW: TCCGATGAAGCAGAAG; RV: GGTGGCGTTACGAAGAG
AtSAT5-4 322 bp FW: ACAATCACGGAAGCCATTAGCAT; RV: GTCAATCAGCACAACAGAACCAG
Vector FW: (T7) TAATACGACTCACTATAG; RV: (T7 terminator) GCTAGTTATTGCTCAGCGG
FW = forward primer, RV = reverse primer. T7 = T7 RNA Polymerase.
3.4.2. AtSAT5 Colony transformation assessment in E. coli
The pET28a plasmid (Wirtz, 2004) (Fig. 3-8) was used for the insertion of the AtSAT5 gene into E. coli. This plasmid was donated by Prof. Ruediger Hell, Heidelberg University.
Fig. 3-8. AtSAT5-pET28a construct map.
Cloning was conducted using E.coli DH10 competent cells, according to the protocol shown below:
Subsequently, 950 μl of Super Optimal Broth with Catabolite (SOC) medium
Incubation
• 40 μl E.coli DH10 competent cells were mixed with 1 μl of plasmid solution (20 ng/ mL) and put on ice for
30 minutes
Heat shock
• this mix was then heated to 42 ℃ for 30 seconds
Recovery
(Sambrook & Russell, 2001) were added to the E. coli/plasmid mix and incubated at 37℃, for 1 hour, in an incubator (SSI5 SHEL LAB Floor Model Shaking Incubator, 5 Cu.Ft.), under continuous shaking at 250 rpm. The SOC medium included the following components: 2% Tryptone, 0.5% Yeast extract, 10 mM NaCl, 2.5 mM KCl, 20 mM MgSO4, 10 mM MgCl, 20 mM glucose.
After incubation, 50 μl of transformed E. coli were loaded onto a Lysogeny Broch (LB) agar plate, which contained the antibiotic kanamycin. Additional 250 μl of E.
coli culture were loaded on another LB agar plate with kanamycin. The LB plates
contained 1% Tryptone, 0.5% Yeast extract, 1% NaCl, 1.5% agar. The plates were incubated overnight at 37 ℃. The following day, if colonies appeared, they were transferred with a sterilized toothpick into a 2 ml sterile Eppendorf tube containing 1ml of 2×TY (1.6% Tryptone, 1% Yeast extract, 0.5% NaCl) medium with Kanamycin. The Eppendorf tube was whirly mixed for 10 minutes; then the toothpick was removed. The Eppendorf tube was put in an incubator (SSI5 SHEL LAB Floor Model Shaking Incubator, 5 Cu.Ft.) at 37 ℃, under shaking at 700 rpm, for 3 hours. The E.coli DH10 transformed culture was then resuspended 1:1 in a 40% Glycerol solution. This “cloning stock” was stored at -80 ℃.
3.4.3. Colony PCR
Polymerase Chain Reaction (PCR) was carried out using the InvitrogenTMPlatinumTMSuperFiTM PCR Master Mix Kit (Invitrogen, Massachusetts, USA). This kit was designed to work at room temperature. It was a hot-start kit and it was suited for cloning.
The reaction mix had this composition: 3 μl of nuclease-free water
12.5 μl of 2×PlatinumTMSuperFiTM PCR Master Mix 1.25 μl of 10 μM forward primer
1.25 μl of 10 μM reverse primer 2 μl of Template DNA
5 μl of 5×SuperFiTM
GC Enhancer
The following PCR protocol was applied:
Agarose gels (2%) were used to assess the size of the PCR products. The DNA Ladder with a range 200-300 bp was produced. The gels were run at 100 V for 30
minutes. Then a picture was taken with a Bio-Rad Gel System (Biorad, California, USA).
3.4.4. AtSAT5 overexpression
As expression vector, E.coli BL-21(DE3) plysS was used. These cells were kindly provided by Dr. Tiziana Cacciamani, MaSByc, DISVA, Università Politecnica delle Marche. BL-21(DE3) pLysS is a chemically competent E. coli strain. The BL-21(DE3) pLysS strain allowed inducible protein expression from the gene of interest, under the control of the lac UV5 promoter, via the T7 RNA polymerase. The pLysS plasmid also contained the T7 lysozyme gene (lysozyme had the function of repressing low-level transcription prior to induction), a chloramphenicol resistance gene and a p15A replication origin which was compatible with those found in pBR322 and pUC derived plasmids.
This competent strain could be made permeable to exogenous DNA through the following procedure:
Incubation
• 20 μl of E.coli BL-21(DE3) PlySs competent cell were mixed with 1μl of the plasmid mix and incubated on ice for 30 minutes
Heat shock
• the mix was put at 42 ℃ for 45 seconds
Recovery
Subsequently, 90 μl of SOC medium was added to the mix. This suspension was incubated for 1 hour at 37 ℃, under continuous shaking at 600 rpm. Then, 600 μl of 2×TY medium containing kanamycin and chloramphenicol, were added. A further incubation at 37 ℃ and 400 rpm was conducted overnight. The next morning, 40 μl of the culture incubated overnight was added to an Eppendorf tube containing 2×TY medium and kanamycin and chloramphenicol. These cultures were allowed to grow to an optical density (600 nm) of 1. At that point, 100 μl of 100 mM isopropyl-1-thio- -D-galactopyranoside (IPTG) was added to induce the expression of AtSAT5 protein. The incubation at 37 ℃ and 400 rpm was continued for 4 hours. The suspension was then centrifuged at 4500 g, 4 ℃, for 10 min; the pellet, containing the E. coli cells overexpressing AtSAT5, was collected and stored at -80 °C.
The production of the AtSAT5 containing E. coli was scaled up by New Brunswick™ Innova® 44/44R Shaker, setting the shaking speed at 250 RPM and a temperature of 37°C. When the OD600 reached 0.6-0.8, 250 μl of 1 M IPTG were added into the
culture (250 ml) for inducing the protein SAT5 expression. The incubation at 37 ℃ and 400 rpm was continued for 4 hours. The suspension was then centrifuged at 4500 g, 4 ℃, for 10 min; the pellet, containing the E. coli cells overexpressing AtSAT5, was collected and stored at -80 °C, these pellets were used for the followed purification experiment.
3.4.5. Extraction of AtSAT5 protein from E. coli
The E. coli cells were resuspended in 10 ml of binding buffer (buffer B: 20 mM Imidazole, 50 mM Tris (pH 8.0) and 250 mM NaCl), then used for the affinity (binding) chromatography. To protect the proteins, buffer B was added containing 10
μl of 500 mM phenylmethylsulfonyl fluoride (PMSF) protease inhibitor (VWR, USA). The PMSF stock solution was prepared in ethanol, filtered through 0.2 μm filter (sterilized, USA) and kept at -20 °C till used. Cells in buffer B were sonicated on ice using a SONICS Vibra-Cell™ (SONICS & MATERIALS INC, Newton, CT, USA), with an energy of 60% amplitude for 5 minutes, with 5 seconds bursts and 10 seconds intervals. The slurry was spun down at 12000 g, for 10 min, at 4 °C, in a J2-MC Beckman centrifuge equipped with a JA-20 rotor (Beckman, California, USA). The supernatant was filtrated through a 0.45 μm membrane filter (VWR, Pennylvania, USA), and then again through a 0.2 μm filter (VWR, Pennsylvania, USA) (Fig. 3-9). Then, 10 μl of 500 mM PMSF was added to the filtered crude extract and the samples were stored at -20 °C, until they were used.
3.4.6. OAS-TL purification
The purification of OAS-TL was carried out by affinity chromatography, using the protein overexpressed in E. coli as the ligand. A 1 ml HiTrapTM Chelating Column (GE Healthcare, Buckinghamshire, UK) was used (Fig. 3-9). Prior to its utilization, the column was washed with MilliQ water for 5 min, at a flow rate of 1 ml/min (which was maintained for all the following steps). The column was then loaded with 50 mM NiCl2, for 5 min. Subsequently, the column was equilibrated with the binding
buffer (buffer B: 20 mM Imidazole, 50 mM Tris (pH 8.0), and 250 mM NaCl), for 10 min.
Fig. 3-9. Protein loading onto the affinity chromatography column.
The His-tagged AtSAT5 was then loaded onto the column. The loading lasted 1.5 hour. The column was conditioned with washing buffer (Washing buffer: 80 mM Imidazol, 50 mM Tris (pH 8.0), and 250 mM NaCl). Subsequently, the column was washed for 5 minutes with the same buffer (Washing buffer) used for conditioning. Finally, a volume of 5 ml washing buffer containing 10 mM O-Acetylserine was added; this step was applied to remove any residual bacterial OAS-TL. The column was finally washed for 5 minutes with the same washing buffer and the algal extract was loaded.
Fig. 3-10. Procedure followed for affinity chromatography.
3.4.7. Algal OAS-TL extraction
Algae in mid-exponential growth phase were used for the extraction of OAS-TL. Cells were harvested by centrifugation in a J2-MC Beckman centrifuge with a JA-10 rotor (Beckman, California, USA), at 5000 g, 4 °C, for 10 minutes. The pellet was stored at -80 °C until it could be processed further.
When needed, the pellets were resuspended in 10 ml of buffer B additioned with 50 mM PMSF, 0.001 mM MgCl2, 0.1% Triton-100 (v/v), and 1% Glycerol (v/v) and
subject to sonication, centrifugation, and filtration as described above for the extraction of AtSAT5 from E. coli.
About 10 ml of crude extract were then loaded onto the column, with a flow rate of 1ml/min. The extract was allowed to circulate through the columns for 1.5 hours (Fig. 3-10). The column was then washed for 10 minutes with 10 mL buffer W, which contained 80 mM Imidazole, 50 mM Tris (pH 8.0), and 250 mM NaCl; this was done to wash out unbound proteins. The column was then washed for 5 min with 5 ml of
Buffer W added with 10 mM OAS; this step was necessary to displace the protein OAS-TL bound to the affinity ligand. The eluted solution was collected in 10 fractions of 500 µl each. A further 5 min wash with Buffer W followed. Finally, the His-tagged AtSAT5 protein was eluted with 5 ml Buffer E, which contained 400 mM Imidazole, 50 mM Tris (pH 8.0), and 250 mM NaCl.
3.4.8. Determination of protein content
Proteins were determined according to the method by Peterson (1977), a modification of Lowry‟s method (Lowry et al., 1951). The denaturing power of SDS in combination with NaOH allowed the complete disruption of membranes. To 480 μl of a solution containing 1% SDS and 0.1 M NaOH, a volume of 20 μl of sample was added, followed by 500 µl of reagent A (Table. 3-2); the solution was let sit for 10 min. Reagent A was a mixture of copper and Na-K tartrate: the former specifically binds to proteins in an alkaline environment; the tartrate was used to stabilize the Cu ions (Lowry et al., 1951). Subsequently, 250 µl of solution B (Table. 3-2) were added. Solution B contained the Folin & Ciocalteu‟s phenol reagent (Sigma-Aldrich) and carried out the oxidation of the Cu-protein complexes; this gave, almost instantaneously, a blue color to the protein solution (Lowry et al., 1951). The samples were incubated for about 30 minutes at room temperature to allow a complete development of the blue color. Finally, the absorbance was measured at 750 nm in a Beckman DU 640 Spectrophotometer (Beckman Coulter, California, USA).
Protein concentration was calculated by interpolating the samples‟ absorbances into a calibration curve constructed with known quantities of bovine serum albumin (BSA). The BSA standards were prepared as the samples. Standard curves were made for all the buffers employed in the various purification steps, to take into account possible interferences by all buffer components.
Table. 3-2. Reagents for Peterson‟s protein assay
Reagents Stock solution
Solubilizing solution 1% SDS, 0.1 M NaOH
Reagent A (v/v) (a: b: c: d = 1: 1: 1: 1) a: CTC (CopperTartrate/Carbonate) 0.1% CuSO4 5 H2O 0.2% NaKTartrate 4 H2O 10% Na2CO3 b: 10% SDS c: 0.8 M NaOH d: MilliQH2O
Reagent B (v/v) (d: e = 5: 1) e: Folin-Ciocalteu reagent (1 Folin-Ciocalteu :5 MilliQ H2O)
3.4.9. SDS-Polyacrylamide Gel Electrophoresis (SDS-PAGE)
OAS-TL purity was assessed through SDS-Polyacrylamide Gel Electrophoresis (SDS-PAGE). Proteins were denatured by mixing the samples with 4 volumes of 5X Laemmli Sample Buffer containing 10% (w/v) SDS, 20% (v/v) Glycerol, 100 mM Tris pH 7, 0.1% (w/v) Bromophenol blue, 25% (v/v) -Mercaptoethanol (Laemmli, 1970). The mixture was quickly whirly mixed for 1 min, then incubated for 10 minutes at 95.5 °C, transferred on ice for 2 minutes and finally centrifuged at 12,000 g at room temperature. Samples were then loaded on a 12% polyacrylamide gel. Resolving gel and stacking gel buffers were prepared as described in Table. 3-3 and 3-4. First, an appropriate volume (Table. 3-5) of resolving gel was loaded into the electrophoresis sandwich; a thin layer of isopropanol was deposited on its surface to ensure that the surface was flat and horizontal. After the gel polymerized, isopropanol was removed with the syringe. The stacking gel was then added (Table. 3-6). After polymerization, the gel sandwich was placed in an electrophoresis chamber (Bio-Rad Laboratories Inc., California, USA). The running buffer contained 25 mM Tris-HCl pH 8.3, 192 mM glycine and 0.1% (W/V) SDS. The electrophoresis was performed at 80 V for 30 min (or until samples ran through the stacking gel) and at 120 V for
additional 120 min or until bromophenol blue ran out of the gel. Protein pre-stained molecular weight markers (10-180 kDa, Abcam, Cambridge, UK) were used to identify the mass of the proteins in the samples.
Protein bands were visualized by Coomassie Staining (Table. 3-7). The Coomassie Staining was stopped when the first protein bands became visible, by washing the gel three times with tap water. The Coomassie destaining solution was then added to the stained gel (Table. 3-8).