Study of 367 Hematological Neoplasms
Jose I. Martin-Subero1,2.*, Ole Ammerpohl1., Marina Bibikova3, Eliza Wickham-Garcia3, Xabier Agirre4, Sara Alvarez5, Monika Bru¨ ggemann6
, Stefanie Bug1, Maria J. Calasanz7, Martina Deckert8, Martin Dreyling9, Ming Q. Du10, Jan Du¨rig11, Martin J. S. Dyer12, Jian-Bing Fan3, Stefan Gesk1, Martin-Leo Hansmann13, Lana Harder1, Sylvia Hartmann13, Wolfram Klapper14, Ralf Ku¨ppers15, Manuel Montesinos-Rongen8, Inga Nagel1, Christiane Pott6, Julia Richter1, Jose´ Roma´n-Go´mez16, Marc Seifert15,
Harald Stein17, Javier Suela5, Lorenz Tru¨mper18, Inga Vater1, Felipe Prosper4, Claudia Haferlach19, Juan Cruz Cigudosa5, Reiner Siebert1*
1 Institute of Human Genetics, Christian-Albrechts University, Kiel, Germany, 2 Cancer Epigenetics and Biology Program, Bellvitge Institute for Biomedical Research-Catalan Institute of Oncology, Barcelona, Spain,3 Illumina, Inc., San Diego, California, United States of America, 4 Division of Cancer and Area of Cell Therapy and Hematology Service, Universidad de Navarra, Pamplona, Spain,5 Molecular Cytogenetics Group, Centro Nacional Investigaciones Oncologicas, Madrid, Spain, 6 Second Medical Department, Christian-Albrechts University, Kiel, Germany,7 Department of Genetics, University of Navarra, Pamplona, Spain, 8 Department of Neuropathology, University Hospital of Cologne, Cologne, Germany,9 Department of Medicine III, University Hospital Grosshadern, Munich, Germany, 10 Department of Pathology, University of Cambridge, Cambridge, United Kingdom,11 Department of Hematology, University of Duisburg-Essen, Essen, Germany, 12 Toxicology Unit, University of Leicester, Leicester, United Kingdom,13 Institute of Pathology, University Hospital of Frankfurt, Frankfurt, Germany, 14 Institute of Pathology, Christian-Albrechts University, Kiel, Germany,15 Institute of Cell Biology, University of Duisburg-Essen, Essen, Germany, 16 Reina Sofia Hospital, Instituto Maimonides de Investigacio´n Biome´dica de Co´rdoba, Cordoba, Spain,17 Institute of Pathology, Campus Benjamin Franklin, Berlin, Germany, 18 Department of Hematology and Oncology, Georg-August University of Go¨ttingen, Go¨ttingen, Germany,19 Munich Leukemia Laboratory (MLL), Munich, Germany
Abstract
Background:Alterations in the DNA methylation pattern are a hallmark of leukemias and lymphomas. However, most epigenetic studies in hematologic neoplasms (HNs) have focused either on the analysis of few candidate genes or many genes and few HN entities, and comprehensive studies are required.
Methodology/Principal Findings:Here, we report for the first time a microarray-based DNA methylation study of 767 genes in 367 HNs diagnosed with 16 of the most representative B-cell (n = 203), T-cell (n = 30), and myeloid (n = 134) neoplasias, as well as 37 samples from different cell types of the hematopoietic system. Using appropriate controls of B-, T-, or myeloid cellular origin, we identified a total of 220 genes hypermethylated in at least one HN entity. In general, promoter hypermethylation was more frequent in lymphoid malignancies than in myeloid malignancies, being germinal center mature B-cell lymphomas as well as B and T precursor lymphoid neoplasias those entities with highest frequency of gene-associated DNA hypermethylation. We also observed a significant correlation between the number of hypermethylated and hypomethylated genes in several mature B-cell neoplasias, but not in precursor B- and T-cell leukemias. Most of the genes becoming hypermethylated contained promoters with high CpG content, and a significant fraction of them are targets of the polycomb repressor complex. Interestingly, T-cell prolymphocytic leukemias show low levels of DNA hypermethylation and a comparatively large number of hypomethylated genes, many of them showing an increased gene expression. Conclusions/Significance:We have characterized the DNA methylation profile of a wide range of different HNs entities. As well as identifying genes showing aberrant DNA methylation in certain HN subtypes, we also detected six genes—DBC1, DIO3, FZD9, HS3ST2, MOS, and MYOD1—that were significantly hypermethylated in B-cell, T-cell, and myeloid malignancies. These might therefore play an important role in the development of different HNs.
Citation: Martin-Subero JI, Ammerpohl O, Bibikova M, Wickham-Garcia E, Agirre X, et al. (2009) A Comprehensive Microarray-Based DNA Methylation Study of 367 Hematological Neoplasms. PLoS ONE 4(9): e6986. doi:10.1371/journal.pone.0006986
Editor: Syed A. Aziz, Health Canada, Canada
Received July 23, 2009; Accepted August 12, 2009; Published September 11, 2009
Copyright: ß 2009 Martin-Subero et al. This is an open-access article distributed under the terms of the Creative Commons Attribution License, which permits unrestricted use, distribution, and reproduction in any medium, provided the original author and source are credited.
Funding: The study was supported by the Deutsche Krebshilfe (Bonn, Germany; www.krebshilfe.de; grant 70-3173-Tr3; JIMS, MLH, WK, RK, CP, HS, LT, and RS), the KinderKrebsInitiative Buchholz/Holm-Seppensen (www.kki-buchholz.de; RS and WK), the Wilhelm Sander-Stiftung (http://www.sanst.de; RS and RK), the Jose Carreras Foundation (http://www.carrerasfoundation.org; RS and WK), the Fondo de Investigaciones Sanitarias (http://www.isciii.es/htdocs/investigacion/ Fondo_lineas.jsp; grant 06/0003; JRG), and the Junta de Andalucia (http://www.juntadeandalucia.es; grant 2007/0004; JRG). On the basis of a scientific collaboration, Illumina, Inc. (San Diego, USA) processed 247 samples and provided the raw data to the authors. Neither Illumina, Inc., nor any funding agency, had a role in study design, data analysis, decision to publish, or preparation of the manuscript.
Competing Interests: MB, EWG and JBF are (or were at the time of the research) employees and stockholders of Illumina Inc. JIMS and OA have received an honorarium for speaking in a meeting organized by Illumina.
* E-mail: [email protected] (JIMS); [email protected] (RS) .These authors contributed equally to this work.
Introduction
Hematological neoplasms (HNs) comprise a highly heteroge-neous group of diseases showing different genetic, transcriptional, phenotypical and clinical features [1]. It is widely accepted that the acquisition of genetic changes taking place at different stages of maturation of the hematopoietic lineages plays an essential role in the development of HNs [2,3]. These alterations include irreversible changes in the DNA sequence, like mutations, translocations, deletions, amplifications, etc. that result in gene activation or inactivation. Epigenetic changes, which represent reversible modifications that affect gene expression without altering the DNA sequence itself, are also a hallmark of cancer [4,5]. The best studied epigenetic change is the hypermethylation of tumor suppressor genes which is reported to be associated with gene inactivation [6]. DNA methylation changes have been frequently described in various subtypes of HNs [7,8,9]. Most epigenetic studies in HNs have focused on the analysis of few tumor suppressor genes and several recent publications have characterized the DNA methylome of HNs by microarray-based approaches [10,11,12,13,14,15,16,17,18,19,20] These reports focused only on one or few HN subtypes. Therefore, the aim of our study was to provide a comparative overview of the DNA methylome of a wide range of HNs, including tumors of B-cell, T-cell and myeloid origin.
Materials and Methods Patient samples and controls
A total of 367 samples from patients affected with HNs were analyzed in the present study, covering 16 different entities of B-cell, T-cell and myeloid origin. These included 9 B-cell neoplasms: diffuse large B-cell lymphoma (DLBCL, n = 54), molecular Burkitt lympho-ma (mBL, n = 18), intermediate lympholympho-ma (INT, n = 16) with a gene expression profile between mBL and non-mBL (i.e. DLBCL) [16], follicular lymphoma (FL, n = 14), mantle cell lymphoma (MCL, n = 10), multiple myeloma (MM, n = 14), B-cell chronic lymphocytic leukemia (B-CLL, n = 25), mucosa-associated lymphoid tissue (MALT) lymphoma (n = 10) and precursor B-cell acute lymphoblastic leukemia (B-ALL, n = 42). Four T-cell neoplasia entities were included: precursor T-cell acute lymphoblastic leukemia (T-ALL, n = 18), sorted CD3-positive cells of T-cell prolymphocytic leukemia (T-PLL, n = 4), anaplastic large cell lymphoma (ALCL, n = 3) and peripheral T-cell lymphoma (PTCL, n = 5). Finally, three myeloid leukemia subtypes were also included in the analysis: acute myeloid leukemia (AML, n = 116), myelodysplastic syndrome/myeloprolifer-ative syndrome (MDS/MPS, n = 13) and chronic myelogenous leukemia (CML, n = 5). Some of the above listed entities comprise several sub-entities based on genetic, transcriptional or morphological analyses. However, as the goal of this study is to provide a global overview of DNA methylation changes in HNs, these sub-entities were not considered in detail for the present analysis. Three separate publications published or in preparation which will rely partly on the same dataset provide a detailed analysis of different subtypes of mature aggressive B-cell lymphomas (i.e. DLBCL, mBL and INT) [16], B- and T-ALL (Agirre et al., in preparation), and AML (Alvarez et al., in preparation).
As control samples, we used eight tissues or cell types from the hematopoietic system. These included whole peripheral blood (WPB, n = 4), whole bone marrow (WBM, n = 4), peripheral blood lymphocytes (PBL, n = 7), CD34-positive cells from BM (n = 4), CD3-positive T-cells from PB (n = 5), CD19-positive B-cells from PB (n = 5), germinal center B-cells (GCB, n = 2) as well as B-cell lymphoblastoid cell lines (LBL, n = 6) [16].
DNA methylation profiling using universal BeadArrays Microarray-based DNA methylation profiling was performed on all 367 hematological neoplasms and the 37 control samples with the GoldenGate Methylation Cancer Panel I (Illumina, Inc.). 247 samples were processed at the Illumina Headquarters (San Diego, CA) and 157 at the Spanish National Cancer Center (CNIO, Madrid, Spain). The panel is developed to assay 1505 CpG sites selected from 807 genes, which include oncogenes and tumor suppressor genes, previously reported differentially meth-ylated or differentially expressed genes, imprinted genes, genes involved in various signaling pathways, and genes responsible for DNA repair, cell cycle control, metastasis, differentiation and apoptosis.
Methylation assay was performed as described previously [21]. Briefly, for each CpG site, four probes were designed: two allele-specific oligos (ASO) and two locus-allele-specific oligos (LSO). Each ASO-LSO oligo pair corresponded to either the methylated or unmethylated state of the CpG site. Bisulfite conversion of DNA samples was done using the EZ DNA methylation kit (Zymo Research, Orange, CA). After bisulfite treatment, the remaining assay steps were identical to the GoldenGate genotyping assay [22] using Illumina-supplied reagents and conditions. The array hybridization was conducted under a temperature gradient program, and arrays were imaged using a BeadArray Reader (Illumina Inc.). Image processing and intensity data extraction software were performed as described previously [23,24]. Each methylation data point is represented by fluorescent signals from the M (methylated) and U (unmethylated) alleles. Background intensity computed from a set of negative controls was subtracted from each analytical data point. The ratio of fluorescent signals was then computed from the two alleles according to the following formula:
Beta~ Max M,0ð Þ
Max U ,0ð ÞzMax M,0ð Þz100 ð1:1Þ
The beta value is a quantitative measure of DNA methylation levels of specific CpGs, and ranges from 0 for completely unmethylated to 1 for completely methylated.
The high reproducibility of the GoldenGate Methylation Cancer Panel I (mean coefficient of determination (R2) = 0.99) has been demonstrated previously [16].
Before analyzing the methylation data, we excluded possible sources of biological and technical biases that could alter the results. A known biological factor is that one copy of chromosome X is methylated in women and therefore, to avoid a gender-specific bias, all 84 CpGs on chromosome X were excluded from further analyses. Additionally, as the microarray experiments were run in two different labs using different BeadArray versions of the GoldenGate Methylation Cancer Panel I, we performed a differential methylation analysis to identify possible technical biases. We identified a total of 11 CpGs differentially methylated between the laboratories/ platforms (p-value ,0.01 and difference between mean beta values .0.2). After excluding 84 gender-specific CpGs and 11 CpGs showing interlab (i.e. interarray version) differential methylation, a total of 1410 CpGs from 767 genes entered further statistical analyses.
All DNA methylation data are available as Table S1, Table S2, and Table S3). All data is MIAME compliant as detailed on the MGED Society website http://www.mged.org/Workgroups/ MIAME/miame.html.
Hierarchical cluster analysis and differential methylation analysis
Hierarchical clustering was performed on all 367 cases and 30 controls using the Cluster Analysis tool of the BeadStudio software (version 3). Since PBLs contain a mixture of B and T cells, they were not used as control samples either for B cell or for T cell neoplasms.
Differential methylation analysis (DMA) was performed using the BeadStudio software (version 3). Different subtypes of B-cell, T-cell and myeloid tumors were compared with appropriate control samples (outlined in the results section). Two criteria were used to detect significantly differentially methylated CpGs. First, a false discovery rate (FDR) below 0.01 (Mann-Whitney U test) and a mean DNA methylation (Beta) values between tumors and controls showing a difference of at least 0.3. The statistical power of the Mann-Whitney U test was low for some comparisons due to small sample sizes. Therefore, a second criterion was used in which clear differential methylation was defined as a mean Beta values between tumors and controls showing a difference of at least 0.5. A CpG was then classified as differentially methylated if any, or both, criteria were met.
Venn diagrams
To compare lists of genes differentially methylated in B-cell, T-cell and myeloid tumors, Venn diagrams were performed using the GeneVenn software developed at the University of Southern Mississippi (http://mcbc.usm.edu/genevenn/) [25].
Correlation between DNA hypermethylation and hypomethylation
Pearson correlation coefficients and scatter plots were used to study the association between de novo gain and loss of gene-associated DNA methylation in different subtypes of hematological tumors (SPSS, version 15.0).
Association between DNA hypomethylation and gene expression in T-PLL
Gene expression values of 66 tags from 39 hypomethylated genes in CD3-positive cells from five T-PLL cases (including two T-PLLs studied herein) were compared with eight normal CD3-positive samples from peripheral blood using data generated with the Affymetrix U133A array [26] (raw expression data has been deposited in a MIAME compliant format in the GEO database, accession number GSE5788). A fold change (in log2 scale) was calculated between the mean of gene expression data per tag in T-PLLs and T-cell controls.
Enrichment for polycomb repressor complex 2 (PRC2) marks and promoter classes in differentially methylated genes
Proportions of PRC2 target genes and promoter classes in genes differentially methylated in various HNs (only those with at least eight differentially methylated genes were included) and all genes analyzed with the Illumina BeadArray were compared using the Fisher’s exact test (SPSS, version 15.0). A genome-wide mapping of PRC2 genes in embryonic stem cells was available as supplemental material of the study by Lee et al. [27]. To analyze whether promoter regions of differentially methylated genes showed different CpG compositions, we used a recently described classification into promoters with high (HCP), intermediate (ICP) and low (LCP) CpG content [28].
Results
DNA methylation profiling of different control samples from the hematopoietic system
As DNA methylation patterns are tissue and cell type specific [29], the application of proper control samples is a main issue to detect de novo DNA methylation changes in tumor samples. To identify suitable controls for HNs of B-cell, T-cell and myeloid origin, we generated DNA methylation profiles of eight tissues or cell types from the hematopoietic system. As mentioned in the materials section, these included 37 samples from eight tissues or cell types of the hematopoietic system: WPB (n = 4), WBM (n = 4), PBL (n = 7), CD34-positive cells (n = 4), CD3-positive T-cells (n = 5), CD19-positive B-cells (n = 5), GCB cells, (n = 2) and LBL cell lines (n = 6).
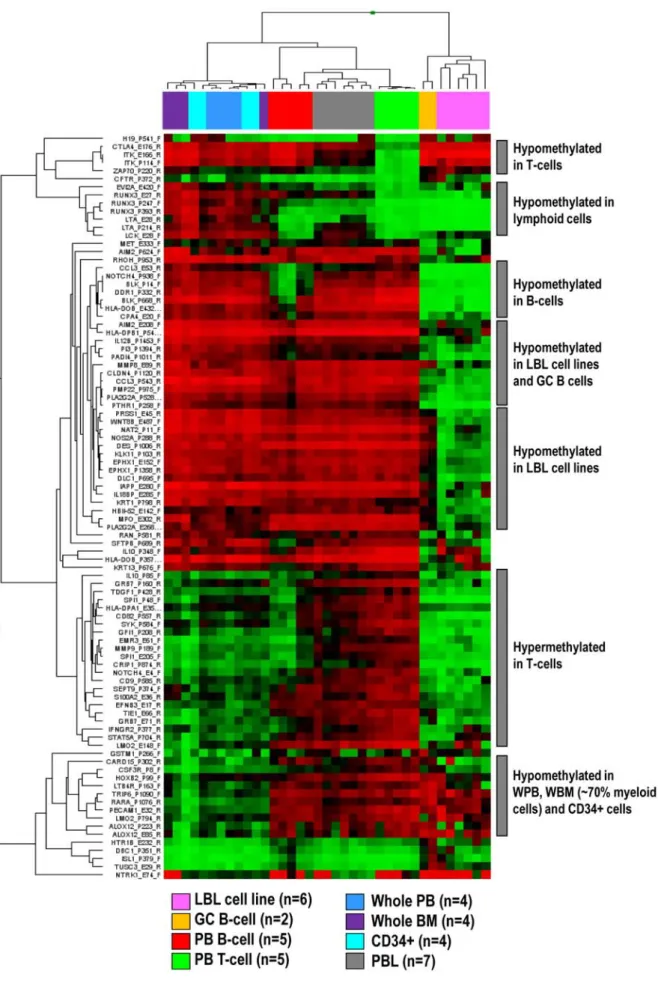
A hierarchical cluster analysis of 1410 CpGs (from 767 genes) entering the statistical analyses showed that different control samples display differential DNA methylation patterns. We then compared the mean per CpG in each group with the mean per CpG in each of the other groups and identified genes showing differential methyl-ation (defined as a difference of mean Beta values above 0.5) (Figure 1). No significant differences were detected between whole PB, whole BM and CD34-positive cells, which clustered together. Interestingly, these three controls showed hypermethylation of genes like RUNX3 whereas in lymphoid cells, RUNX3 was unmethylated. Lymphoid cells derived from PB, like B-cells, T-cells and PBLs clustered together. T-cells showed a homogeneous epigenetic pattern with hypomethylation of genes expressed in T-cells like ITK, CTLA4 or ZAP70. DNA methylation profiles of B-cells like CD19-positive PB cells, GC B-cells and LBL cell lines were heterogeneous. B-cell specific genes like BLK were hypomethylated in all three control types, but a higher number of hypomethylated genes were detected only in GC B-cells and/or LBL cell lines. Expectedly, as PBLs mostly contain a mixture of B- and T-cells, their methylation profile was in between that obtained for B- and T-cells.
According to these results, WPB, WBM and CD34-positive cells were used as controls for myeloid neoplasms and CD3-positive T-cells as controls for T-cell neoplasms. Considering the heteroge-neous nature of the nine subtypes of B-cell neoplasms analyzed herein, we decided to group CD19-positive cells, GCB cells and LBL cell lines as controls. As PBLs contain a mixture of B and T cells, they were not used as control samples either for B cell or for T cell neoplasms.
Global DNA methylation profiles in different subtypes of hematopoietic neoplasms
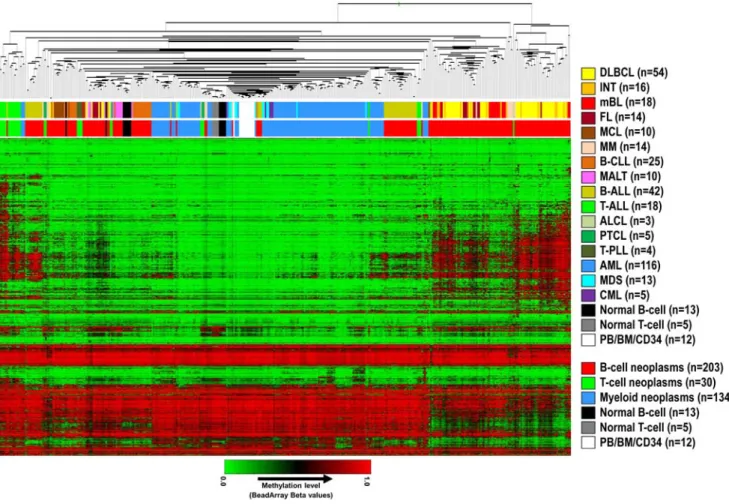
A hierarchical cluster analysis of methylation values of 1410 CpGs in 367 hematological malignancies and 30 control samples (excluding PBL samples, which are composed of both B- and T-cells) is shown in Figure 2. Lymphoid malignancies were generally associated with higher levels of de novo DNA methylation than myeloid malignancies, which were mostly unmethylated and clustered together with normal control samples (Figure 2 and Figure 3A). Interestingly, high levels of de novo DNA methylation seemed to be prevalent especially in germinal center B-cell derived lymphomas like DLBCL, INT, mBL and FL, and lymphoid precursor cell derived tumors like B-lineage ALL (B-ALL) and T-lineage ALL (T-ALL).
The hierarchical cluster analysis in Figure 2 indicates that although some entities tend to cluster together (e.g. myeloid tumors or T-PLL), DNA methylation is heterogeneous within HN subtypes, especially in lymphoid tumors.
Separate cluster analyses of B-cell, T-cell and myeloid neoplasms with their respective controls are shown in Figure S1, Figure S2, and Figure S3.
Figure 1. Hierarchical cluster analysis of CpGs differentially methylated in distinct non-malignant hematopoietic cell types. doi:10.1371/journal.pone.0006986.g001
Detection of genes acquiring de novo DNA methylation in different subtypes of hematological neoplasms
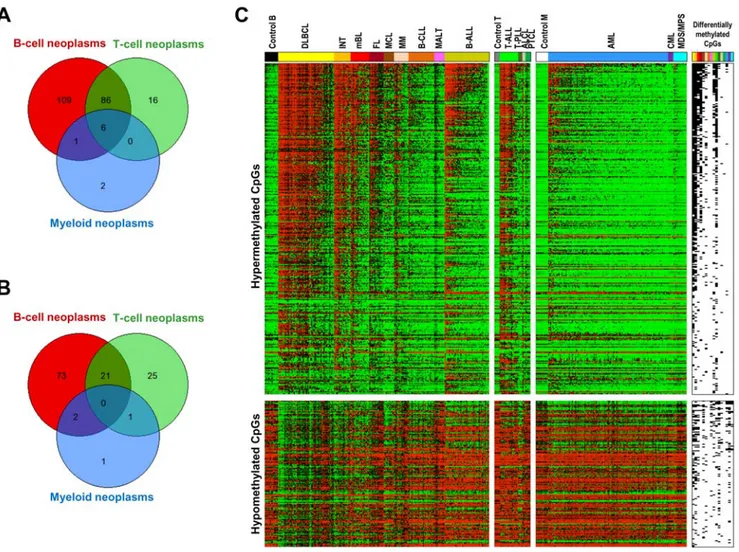
To identify genes de novo methylated in hematological neoplasms, differential methylation analysis (DMA) was performed comparing each tumor entity with the appropriate control samples. A summary of the results of the DMA is shown in Figure 3A and Figure 4A. A total of 354 CpGs (belonging to 220 genes) were shown to be hypermethylated in at least one entity. The heatmap on Figure 4C shows differentially methylated CpGs arranged according to the frequency of appearance in one or more HNs. The analyses shown in Figure 4 indicate that most of the hypermethylated genes are present in one or few malignancies and that a small number of genes are hypermethylated across HNs.
A list of de novo methylated genes in each tumor entity is shown in Table S4.
B-cell neoplasms. The DMA analyses in B-cell tumors showed that 326 CpGs (belonging to 202 genes) were statistically significantly hypermethylated in at least one subtype (Figure 3A, Figure 4A). Fifty-eight genes were shown to be de novo methylated in precursor B-ALLs. In mature B-cell tumors, a highly heterogeneous picture of DNA hypermethylation was obtained. Some entities like DLBCLs, INTs, mBLs and FLs were characterized by a high number of de novo methylated genes, which ranged from 87 in mBL to 251 in DLBCL.
Other mature B-cell tumors like MCL or MM displayed an intermediate degree of de novo DNA methylation, showing 32 and 42 hypermethylated genes, respectively. Finally, B-CLLs and MALT lymphomas showed low levels of de novo DNA methylation, with only three genes being significantly methylated in each entity.
T-cell neoplasms. DMA comparing cell tumors versus T-cell control samples showed that 164 CpGs (108 genes) were hypermethylated in at least one T-cell neoplasm. The great majority of these genes were associated with T-ALL, in which 156 CpGs belonging to 103 genes were hypermethylated (Figure 3A). In contrast, the mature T-cell tumors studied displayed low levels of de novo DNA methylation, being one gene hypermethylated in PTCL, five in ALCL and six in T-PLL.
Myeloid neoplasms. A DMA in myeloid tumors showed that these entities were globally characterized by low levels of de novo DNA methylation (Figure 3A). In AML, a total of 11 CpGs (belonging to 9 genes) were shown to be hypermethylated. In MDS/MPS and CML, DMA did not detect any hypermethylated gene using the applied criteria.
Commonly hypermethylated genes. Of the 767 genes analyzed only six genes (0.8%) were commonly hypermethylated in HNs (Figure 4A), namely DBC1, DIO3, FZD9, HS3ST2, MOS and MYOD1. In contrast, the vast majority of the genes being
Figure 2. Hierarchical cluster analysis of DNA methylation data obtained from 367 HNs and 30 control samples. The upper bar below the dendrogram points to the specific HN subtype whereas the lower bar points to a classification of HNs according to the cell of origin (i.e. B-cell, T-cell, or myeloid cell). DLBCL: diffuse large B-cell lymphoma, INT: intermediate lymphoma, mBL: molecular Burkitt lymphoma, FL: follicular lymphoma, MCL: mantle cell lymphoma, MM: multiple myeloma, B-CLL: B-cell chronic lymphocytic leukemia, MALT: mucosa-associated lymphoid tissue lymphoma, B-ALL: precursor B-cell acute lymphoblastic leukemia, T-ALL: precursor T-cell acute lymphoblastic leukemia, ALCL: anaplastic large cell lymphoma, PTCL: peripheral T-cell lymphoma, T-PLL: T-cell prolymphocytic leukemia, AML: acute myeloid leukemia, MDS: myelodysplastic syndrome, CML: chronic myelogenous leukemia, PB: peripheral blood, BM: bone marrow, CD34: CD34-positive cells.
hypermethylated in T-cell lymphomas were also found becoming hypermethylated in B-cell lymphomas (92 genes corresponding to 85% of all hypermethylated genes).
Loss of gene-specific DNA methylation in hematological malignancies
DMA to detect genes suffering de novo loss of DNA methylation was performed comparing B-cell, T-cell and myeloid tumors with their respective control samples. These analyses indicate that gene-specific DNA hypomethylation, although less frequent than DNA hypermethylation, is also a common finding in hematological tumors (Figure 3A), at least for the 767 genes under analysis. The highest number of hypomethylated genes was found in B-cell neoplasms (96 genes), followed by T-cell (47 genes) and myeloid neoplasms (4 genes). However, none of these genes analyzed became hypomethylated in all entities (Figure 4B). A list of hypomethylated genes in each tumor entity is shown in Table S5. Correlation between de novo loss and gain of gene-specific DNA methylation in hematological malignancies
Figure 3 and Figure 4 suggest that some tumors with a large number of hypermethylated genes were accompanied by increased levels of hypomethylated genes. To investigate whether gene-specific DNA hypermethylation was associated with DNA hypomethylation, we calculated Pearson correlation coefficients and plotted the average methylation values per case for all hyper-and hypomethylated genes in HNs with at least 10 hypermethy-lated genes. The results indicate that DNA hypermethylation significantly correlates with DNA hypomethylation in most mature B-cell tumors, i.e. cases with higher levels of hypermethylation also show higher levels of hypomethylation. In contrast, B- and T-ALL,
although they are heavily methylated, they do not show a concurrent de novo loss of DNA methylation (Figure 5). Association between PRC2 targets in stem cells and genes differentially methylated in hematological malignancies
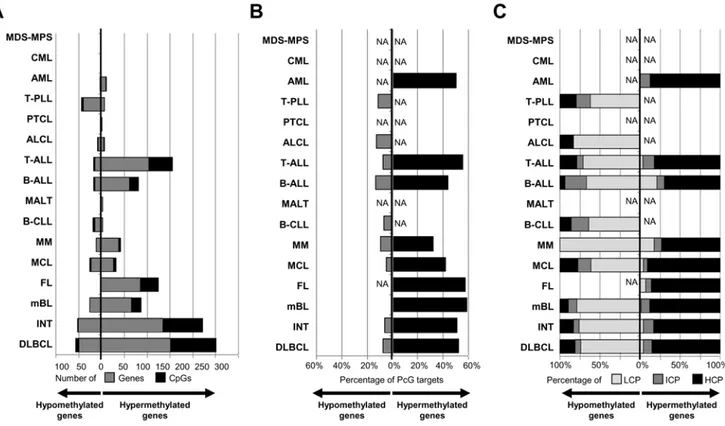
We investigated whether genes showing significant differential methylation in HNs were among those repressed by the PRC2 in embryonic stem cells [27]. As shown in Figure 3B, between 32% and 59% of the genes suffering de novo methylation in HNs are PRC2 targets in embryonic stem cells. As compared with the 21% of PRC2 targets in all the genes studied with the array, this enrichment was statistically significant in all HNs studied but MM and AML (Table S6). In contrast, only 5 to 13% of the hypomethylated genes were PRC2 targets in embryonic stem cells. These findings indicate that, regardless of the cellular nature of the HN entity, de novo DNA methylation of a large proportion of genes seems to be mediated by members of the polycomb complex. The promoter regions of genes losing or acquiring DNA methylation show different CpG content
To investigate whether the promoter regions of the genes differentially methylated in different hematological tumors showed a specific CpG composition, we classified them into high (HCP), intermediate (ICP) and low (LCP) CpG content using a recent classification system [28]. In line with previous reports [16], our analysis demonstrated that genes acquiring de novo methylation in tumors are mostly characterized by promoters with high CpG content (Figure 3C). In contrast, the proportion of CpGs in gene promoters showing de novo loss of DNA methylation in hematological tumors is usually low (Figure 3C).
Figure 3. Bar plot of the different HNs under study showing for each entity. (A) The number of genes/CpGs hypermethylated or hypomethylated, (B) the percentage of differentially methylated genes marked by the PRC2 in ESCs, and (C) the percentage of differentially methylated genes showing distinct promoter subtypes according to their CpG content. LCP: low CpG content, ICP: intermediate CpG content, HCP: high CpG content.
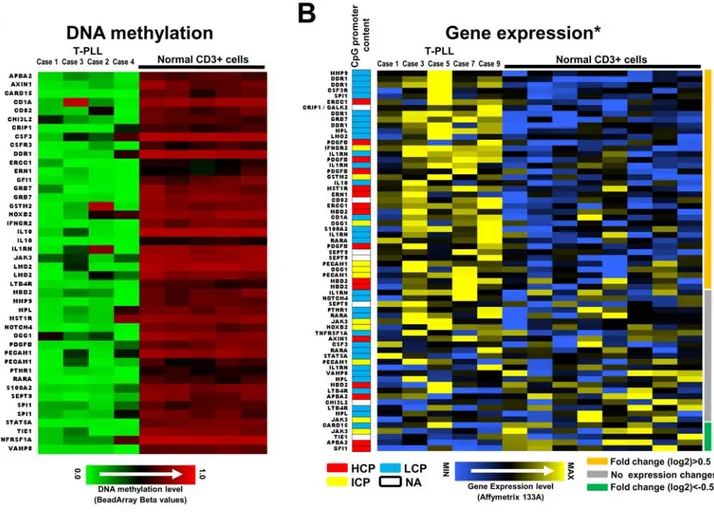
Loss of gene-specific DNA methylation is more frequent than hypermethylation in T-PLL and correlates with increased gene expression
DNA hypermethylation is clearly more frequent than hypomethylation in HNs (Figure 3A). However T-PLL repre-sents a striking exception to that observation. The four CD3+ tumor cells of the T-PLLs studied show a homogeneous DNA methylation profile characterized by multiple genes suffering de novo loss of DNA methylation (n = 44) and few hypermethy-lated genes (n = 6). Comparing microarray-based gene expres-sion of hypomethylated genes in the CD3+ T-PLLs cells to CD3+ T-cell controls, we detected a total of 38 tags showing at least a 0.5 fold (in log2 scale) increase in gene expression in T-PLL vs T-cell controls. These include PDGFB, MMP3, DDR1, IL1RN, IL10, CSF3R or SEPT9, which predominantly contained promoters with low CpG content (LCP) (Figure 6B). In contrast, only 5 tags showed log2 fold change values below 20.5. The remaining 23 tags showed fold changes between 20.5 and 0.5. These results indicate that gene promoter hypomethylation is frequently associated with increased gene expression in T-PLL (Figure 6).
Discussion
The main goal of this study was to provide a general overview of DNA methylation changes associated with the most common subtypes of HNs. These HNs were derived from different cell lineages of the hematological system, i.e. B-cells, T-cells and myeloid cells at different stages of differentiation. As DNA methylation profiles are tissue and cell type-specific [29], we initially analyzed methylation profiles of various cell types and tissues of the hematopoietic system to identify appropriate control samples for the different HNs under study. In this way, we eliminated cell lineage-specific biases and were able to detect tumor-specific DNA methylation changes.
Statistical analyses of the microarray data identified the presence of DNA methylation changes associated with the 16 different subtypes of HNs under study. Our data clearly indicate that DNA hypermethylation patterns are not homogenous across different HNs. At the global level, we could observe that lymphoid neoplasms generally showed a higher number of de novo methylated genes than myeloid neoplasms. Interestingly, most myeloid neoplasms only showed low levels of aberrant DNA methylation and clustered together with the normal control samples (Figure 2).
Figure 4. Venn diagrams showing the overlap of genes. (A) Hypermethylated or (B) hypomethylated in B-cell, T-cell and myeloid neoplasms. Only six genes were significantly hypermethylated in neoplasms of B-cell, T-cell and myeloid origin. We did not detect any gene hypomethylated in tumors of all three cellular origins. (C) Heatmap containing all the CpGs hypermethylated (above) or hypomethylated (below) in at least one HN subtype. CpGs are arranged in decreasing order of hypermethylation frequency. The presence of hypermethylated or hypomethylated CpGs in a given HN subtype is shown on the right of the heatmap (black: differentially methylated).
Using the defined statistical criteria (see methods section), we detected DNA methylation changes characteristic for the HN entities under study (Table S4 and Table S5). Overall, we have identified 343 genes differentially methylated in at least one entity. Of these genes 220 become hypermethylated while 123 become hypomethylated. In line with previous reports in solid tumors [30,31,32,33] and mature aggressive B-cell lymphomas [16], a high proportion of genes de novo methylated in various HN subtypes were repressed by PRC2 in embryonic stem cells.
As well as genes predominantly methylated in certain HN subtypes, we also identified six genes, i.e. DBC1, DIO3, FZD9, HS3ST2, MOS and MYOD1, that were significantly hypermethy-lated in B-cell, T-cell and myeloid malignancies. Hypermethylation of DBC1, HS3ST2 and MYOD1 has been reported before not only in HNs [12,18,34,35,36,37] but also in solid tumors [38,39,40]. Therefore, silencing of these genes by hypermethylation seems to be a frequent pathomechanism associated with most human cancers.
FZD9 (Frizzled homolog 9) is a receptor for WNT2 in the WNT pathway, from which several members have been shown to be epigenetically deregulated in HNs [41]. De novo methylation of FZD9 has been recently reported to be a frequent event in AML samples and an independent predictor of prognosis for patients with MDS/AML [12]. In our series, FZD9 was shown to be significatively methylated in AML, but not in MDS or CML (Table S4).
The MOS (V-mos Moloney murine sarcoma viral oncogene homolog) gene has been previously identified as hypermethylated in ALL but not in AML [17]. In our series, although MOS is more frequently hypermethylated in ALL (mean beta value = 0.64) than in AML (mean beta value = 0.48), it also shows significant hypermethylation in AML. Another recent study shows that MOS is hypermethylated in AMLs with silenced CEPBA [18], suggesting that MOS is hypermethylated only in some AML subtypes.
DIO3 (Deiodinase, iodothyronine, type III) is located in the imprinted region in chromosome band 14q32 and plays an essential
role for regulation of thyroid hormone inactivation during embryo-logical development. Recent data have shown that this gene is not expressed or expressed at low levels in hematological cells [42]. In spite of this lack of expression, our data indicate that the hypermethylated DIO3 CpG site in HNs is unmethylated in controls. Recently, DIO3 was found to be methylated in AMLs with CEBPA silencing [18].
Remarkably, we observed that precursor B- and T-cell neoplasms, i.e. precursor B-ALL and T-ALL, as well as mature B-cell neoplasms with features of germinal center like DLBCL, INT, mBL and FL are characterized by a large number of hypermethylated genes. In contrast, other lymphoid malignancies like MCL, MM, B-CLL, MALT, ALCL and T-PLL show intermediate to low DNA hypermethylation. These data suggest that lymphoid tumors arising from precursor cells and germinal center cells tend to acquire higher levels of de novo DNA methylation. Specific physiological rearrangements of immuno-globulin (IG) and T-cell receptor (TCR) genes differentiate these two stages of lymphocyte development from other maturation stages. VDJ rearrangements of IGH and TCR genes take place in precursor B-cell and T cells in the bone marrow, respectively, whereas class switch recombination of the IGH locus takes place in germinal centers of secondary lymphoid organs like lymph nodes. A possible link between physiological genetic rearrangements, lymphoid developmental stages and DNA methylation is derived from reports indicating that the polycomb protein EZH2 is involved in B-cell development and VDJ recombination [43], and that EZH2 is able to lead to DNA methylation through recruitment of DNA methyltransferases (DNMTs) [44]. Further-more, immunohistochemical studies have revealed that EZH2 levels are higher in precursor T-cells than in resting mature T-cells [45], and that in the germinal center, proliferating centroblasts express EZH2 whereas non-proliferating centrocytes and naı¨ve B cells do not [46]. In this scenario, we hypothesize that the features of the cell that initiates development of lymphoid neoplasms or the
Figure 5. Scatter plots of mean methylation values of hypermethylated genes (Y axis) and hypomethylated genes (X axis) in HNs with more than 10 hypermethylated genes. This figure shows that there is a significant correlation between the level of DNA hypermethylation (increasing beta values) and DNA hypomethylation (decreasing beta values) in cases diagnosed with DLBCL, INT, FL, MCL and MM. In contrast, such phenomenon is not observed in mBL and precursor lymphoid leukemias like B-ALL and T-ALL.
stage at which the tumor is frozen might shape the acquisition of DNA methylation changes. We postulate that germinal center lymphomas like DLBCL, INT, mBL and FL and precursor lymphoid neoplasms like pre B-ALL and T-ALL are initiated or frozen in developmental stages with proliferating cells and high EZH2 expression. Thus, eventual recruitment of DNMTs by EZH2 can then lead to a high level of aberrant DNA methylation in precursor and germinal center lymphoid neoplasms. The fact that neoplasms derived from myeloid cells, that do not suffer such physiological rearrangements, display low levels of aberrant DNA hypermethylation might support our hypothesis.
Another interesting finding derived from our data is that DNA hypermethylation is accompanied in mature B-cell lymphomas (with the exception of mBL) by gene-specific DNA hypomethyla-tion (Figure 3, Figure 4, and Figure 5). In fact, cases with a large number of hypermethylated genes concurrently show large numbers of hypomethylated genes. In contrast, this effect is not observed in precursor lymphoid neoplasms like T-ALL or B-ALL (Figure 5). It has been widely reported in the literature that tumors show global hypomethylation of DNA repeats and local hyper-methylation of gene promoters [4]. However, gene
hypomethyla-tion has received less attenhypomethyla-tion [47,48], although our data indicate that it is also a frequent phenomenon in cancer, at least in HNs. To our knowledge, correlation between levels of gene hyper- and hypomethylation has not been reported before.
In general, DNA hypermethylation is more frequent than DNA hypomethylation in HNs (Figure 3A). However, T-PLL, a rare mature T-cell neoplasm, represents an exception to this general rule. This neoplasm is characterized by a large number of hypomethylated genes and few hypermethylation events. DNA hypomethylation in T-PLL, and HNs in general, frequently targets promoters with low CpG content (Figure 3C), whose methylation has been reported to be independent from gene expression [28]. In the T-PLLs described here, however, most hypomethylated genes were associated with increased gene expression as compared to normal T cells (Figure 6) [26]. Some of these genes have been shown to be involved in tumorigenesis. For instance, interleukin 10 (IL10) acts as a negative regulator in numerous immunmodulatory processes [49]. Furthermore, IL10 expression has been correlated with tumor progression being of prognostic value in distinct entities [50,51,52]. Additionally, we here could show that both the DNA methylation and gene expression profile of another key
Figure 6. Most genes showing hypomethylation of promoter regions in T-PLL are associated with increased gene expression. (A) Genes hypomethylated in PLL as compared with CD3+ normal T cells. Genes are arranged alphabetically. (B) Gene expression of hypomethylated genes in T-PLL cases as compared to CD3+ normal T cells. Genes are arranged according to their differential expression in T-T-PLL vs. normal controls (most upregulated genes on the top). Genes showing at least a 0.5 fold increase (in log2 scale), no expression changes or a 0.5 fold decrease are marked with orange, grey or green lines, respectively, on the right of the heatmap. The CpG content of the promoter sequences of the genes presented is depicted as color code in a separate column (low CpG content (LCP) = blue, intermediate CpG content (ICP) = yellow, high CpG content (HCP) = red, white = data not available). Two of the T-PLL cases (case 1 and case 3) have been studied both by DNA methylation and gene expression profiling. The normal CD3+ T cells used for DNA methylation and gene expression profiling were different. * Gene expression data have been published before by Du¨rig et al. [26] doi:10.1371/journal.pone.0006986.g006
player of the interleukin signaling pathway, interleukin 1 receptor antagonist (IL1RN), is altered in T-PLL. IL1RN has also been shown to be involved in tumorigenesis in numerous tumor entities [53,54,55,56].
DDR1 belongs to the family of tyrosine kinases with high impact on cell transformation in distinct solid tumors [57,58,59]. Since DDR1 inhibition significantly increases chemosensitivity, this protein has been suggested to be a promising therapeutic target [60].
The platelet-derived growth factor (PDGFB) which becomes also hypomethylated and differentially expressed in T-PLL is involved in mitogenesis of mesenchymal cells and a known oncogene [61,62,63].
Our findings not only provide new insights into the biology of HNs but have potential therapeutic implications. DNA methylation inhibitors like Decitabine and 5-Azacitidine are currently used in clinical studies to treat patients with MDS and AML [64]. For instance, results from a phase III study have indicated that treatment of patients with higher risk MDS with 5-azacitidine results in significant improvement in overall survival [65]. However, consid-ering that MDS and AML are among those HNs with less number of genes suffering de novo DNA methylation, we wonder whether part of the therapeutic effect of DNMT inhibitors is not due to demethylation of hypermethylated genes but rather a different mechanism, e.g. a cytotoxic effect. In any case, if DNMT inhibitors do base their therapeutic effect on demethylation of hypermethylated genes, then HNs with higher levels of DNA hypermethylation, like germinal center B-cell lymphomas and precursor lymphoid neo-plasms, might theoretically be better targets for such drugs. DNA methylation profiling could be then a useful approach to monitor the association between epigenetic response and clinical response and to stratify patients for treatment with demethylating agents.
Supporting Information
Figure S1 Hierarchical cluster analysis of DNA methylation data obtained from B-cell neoplasms. Hierarchical cluster analysis of DNA methylation data obtained from 203 B-cell neoplasms and 13 control samples. The bar below the dendrogram points to the specific subtype. DLBCL: diffuse large B-cell lymphoma, INT: intermediate lymphoma, mBL: molecular Burkitt lymphoma, FL: follicular lymphoma, MCL: mantle cell lymphoma, MM: multiple myeloma, B-CLL: B-cell chronic lymphocytic leukemia, MALT: mucosa-associated lymphoid tissue lymphoma, B-ALL: precursor B-cell acute lymphoblastic leukemia, LBL: lymphoblastoid cell line, GCB: germinal center B-cells, PB-B: peripheral blood B-cells. Found at: doi:10.1371/journal.pone.0006986.s001 (2.76 MB TIF) Figure S2 Hierarchical cluster analysis of DNA methylation data obtained from T-cell neoplasms. Hierarchical cluster analysis of DNA methylation data obtained from 30 T-cell neoplasms and 5 control samples. The bar below the dendrogram points to the specific subtype. T-ALL: precursor T-cell acute lymphoblastic
leukemia, ALCL: anaplastic large cell lymphoma, PTCL: periph-eral T-cell lymphoma, T-PLL: T-cell prolymphocytic leukemia. Found at: doi:10.1371/journal.pone.0006986.s002 (0.94 MB TIF) Figure S3 Hierarchical cluster analysis of DNA methylation data obtained from myeloid neoplasms. Hierarchical cluster analysis of DNA methylation data obtained from 134 myeloid neoplasms and 12 control samples. The bar below the dendrogram points to the specific subtype. AML: acute myeloid leukemia, MDS: myelodysplastic syndrome, CML: chronic myelogenous leukemia, PB: peripheral blood, BM: bone marrow, CD34: CD34-positive cells.
Found at: doi:10.1371/journal.pone.0006986.s003 (1.52 MB TIF) Table S1 Raw data: methylation values.
Found at: doi:10.1371/journal.pone.0006986.s004 (5.96 MB TXT)
Table S2 Raw data: Cy3-intensity.
Found at: doi:10.1371/journal.pone.0006986.s005 (5.13 MB TXT)
Table S3 Raw data: Cy5-intensity.
Found at: doi:10.1371/journal.pone.0006986.s006 (5.13 MB TXT)
Table S4 Hypermethylated genes per entity. This table summarizes genes becoming hypermethylated in hematological neoplasms.
Found at: doi:10.1371/journal.pone.0006986.s007 (0.06 MB XLS)
Table S5 Hypomethylated genes per entity. This table summa-rizes genes becoming hypomethylated in hematological neoplasms. Found at: doi:10.1371/journal.pone.0006986.s008 (0.04 MB XLS)
Table S6 Percentage of hypermethylated genes targeted by the PRC2 in ESCs. This table presents the percentage of hyper-methylated genes which become targeted by the polycomb repressor complex 2 (PRC2) in embryonal stem cells (ESCs) in distinct lymphoma entities.
Found at: doi:10.1371/journal.pone.0006986.s009 (0.03 MB DOC)
Acknowledgments
The authors would like to thank the network project of the Deutsche Krebshilfe ‘‘Molecular Mechanisms in Malignant Lymphoma.’’ Author Contributions
Conceived and designed the experiments: JIMS RS. Performed the experiments: JIMS OA XA SA SB JBF SG LH IN JR JS IV JCC. Analyzed the data: JIMS OA MB EWG RS. Contributed reagents/ materials/analysis tools: MB MC MD MD MQD JD MJD MLH SH WK RK MMR CP JRG MS HS LT FP CH. Wrote the paper: JIMS OA RS. References
1. Swerdlow SH, Campo E, Harris NL, Jaffe ES, Pileri SA, et al. (2008) World Health Organization Classification of Tumours of Haematopoietic and Lymphoid Tissues. Lyon: IARC Press.
2. Rowley JD (1999) The role of chromosome translocations in leukemogenesis. Semin Hematol 36: 59–72.
3. Willis TG, Dyer MJ (2000) The role of immunoglobulin translocations in the pathogenesis of B-cell malignancies. Blood 96: 808–822.
4. Esteller M (2008) Epigenetics in cancer. N Engl J Med 358: 1148–1159. 5. Jones PA, Baylin SB (2007) The epigenomics of cancer. Cell 128: 683–692. 6. Bernstein BE, Meissner A, Lander ES (2007) The mammalian epigenome. Cell
128: 669–681.
7. Boultwood J, Wainscoat JS (2007) Gene silencing by DNA methylation in haematological malignancies. Br J Haematol 138: 3–11.
8. Galm O, Herman JG, Baylin SB (2006) The fundamental role of epigenetics in hematopoietic malignancies. Blood Rev 20: 1–13.
9. Lehmann U, Brakensiek K, Kreipe H (2004) Role of epigenetic changes in hematological malignancies. Ann Hematol 83: 137–152.
10. Pike BL, Greiner TC, Wang X, Weisenburger DD, Hsu YH, et al. (2008) DNA methylation profiles in diffuse large B-cell lymphoma and their relationship to gene expression status. Leukemia 22: 1035–1043.
11. Killian JK, Bilke S, Davis S, Walker RL, Killian MS, et al. (2009) Large-scale profiling of archival lymph nodes reveals pervasive remodeling of the follicular lymphoma methylome. Cancer Res 69: 758–764.
12. Jiang Y, Dunbar A, Gondek LP, Mohan S, Rataul M, et al. (2009) Aberrant DNA methylation is a dominant mechanism in MDS progression to AML. Blood 113: 1315–1325.
13. Figueroa ME, Reimers M, Thompson RF, Ye K, Li Y, et al. (2008) An integrative genomic and epigenomic approach for the study of transcriptional regulation. PLoS ONE 3: e1882. doi:10.1371/journal.pone.0001882. 14. Gebhard C, Schwarzfischer L, Pham TH, Schilling E, Klug M, et al. (2006)
Genome-wide profiling of CpG methylation identifies novel targets of aberrant hypermethylation in myeloid leukemia. Cancer Res 66: 6118–6128. 15. Rahmatpanah FB, Carstens S, Guo J, Sjahputera O, Taylor KH, et al. (2006)
Differential DNA methylation patterns of small B-cell lymphoma subclasses with different clinical behavior. Leukemia 20: 1855–1862.
16. Martin-Subero JI, Kreuz M, Bibikova M, Bentink S, Ammerpohl O, et al. (2009) New insights into the biology and origin of mature aggressive B-cell lymphomas by combined epigenomic, genomic and transcriptional profiling. Blood 113: 2488–2497.
17. Scholz C, Nimmrich I, Burger M, Becker E, Dorken B, et al. (2005) Distinction of acute lymphoblastic leukemia from acute myeloid leukemia through microarray-based DNA methylation analysis. Ann Hematol 84: 236–244. 18. Figueroa ME, Wouters BJ, Skrabanek L, Glass J, Li Y, et al. (2009)
Genome-wide epigenetic analysis delineates a biologically distinct immature acute leukemia with myeloid/T-lymphoid features. Blood 113: 2795–2804. 19. Bennett LB, Schnabel JL, Kelchen JM, Taylor KH, Guo J, et al. (2009) DNA
hypermethylation accompanied by transcriptional repression in follicular lymphoma. Genes Chromosomes Cancer 48: 828–841.
20. O’Riain C, O’Shea DM, Yang Y, Le Dieu R, Gribben JG, et al. (2009) Array-based DNA methylation profiling in follicular lymphoma. Leukemia. 21. Bibikova M, Lin Z, Zhou L, Chudin E, Garcia EW, et al. (2006)
High-throughput DNA methylation profiling using universal bead arrays. Genome Res 16: 383–393.
22. Fan JB, Oliphant A, Shen R, Kermani BG, Garcia F, et al. (2003) Highly parallel SNP genotyping. Cold Spring Harb Symp Quant Biol 68: 69–78. 23. Galinsky VL (2003) Automatic registration of microarray images. I. Rectangular
grid. Bioinformatics 19: 1824–1831.
24. Galinsky VL (2003) Automatic registration of microarray images. II. Hexagonal grid. Bioinformatics 19: 1832–1836.
25. Pirooznia M, Nagarajan V, Deng Y (2007) GeneVenn - A web application for comparing gene lists using Venn diagrams. Bioinformation 1: 420–422. 26. Durig J, Bug S, Klein-Hitpass L, Boes T, Jons T, et al. (2007) Combined single
nucleotide polymorphism-based genomic mapping and global gene expression profiling identifies novel chromosomal imbalances, mechanisms and candidate genes important in the pathogenesis of T-cell prolymphocytic leukemia with inv(14)(q11q32). Leukemia 21: 2153–2163.
27. Lee TI, Jenner RG, Boyer LA, Guenther MG, Levine SS, et al. (2006) Control of developmental regulators by Polycomb in human embryonic stem cells. Cell 125: 301–313.
28. Weber M, Hellmann I, Stadler MB, Ramos L, Paabo S, et al. (2007) Distribution, silencing potential and evolutionary impact of promoter DNA methylation in the human genome. Nat Genet 39: 457–466.
29. Eckhardt F, Lewin J, Cortese R, Rakyan VK, Attwood J, et al. (2006) DNA methylation profiling of human chromosomes 6, 20 and 22. Nat Genet 38: 1378–1385.
30. Ehrich M, Turner J, Gibbs P, Lipton L, Giovanneti M, et al. (2008) Cytosine methylation profiling of cancer cell lines. Proc Natl Acad Sci U S A 105: 4844–4849.
31. Ohm JE, McGarvey KM, Yu X, Cheng L, Schuebel KE, et al. (2007) A stem cell-like chromatin pattern may predispose tumor suppressor genes to DNA hypermethylation and heritable silencing. Nat Genet 39: 237–242.
32. Schlesinger Y, Straussman R, Keshet I, Farkash S, Hecht M, et al. (2007) Polycomb-mediated methylation on Lys27 of histone H3 pre-marks genes for de novo methylation in cancer. Nat Genet 39: 232–236.
33. Widschwendter M, Fiegl H, Egle D, Mueller-Holzner E, Spizzo G, et al. (2007) Epigenetic stem cell signature in cancer. Nat Genet 39: 157–158.
34. Taylor JM, Kay PH, Spagnolo DV (2001) The diagnositc significance of Myf-3 hypermethylation in malignant lymphoproliferative disorders. Leukemia 15: 583–589.
35. Toyota M, Kopecky KJ, Toyota MO, Jair KW, Willman CL, et al. (2001) Methylation profiling in acute myeloid leukemia. Blood 97: 2823–2829. 36. Gronbaek K, Ralfkiaer U, Dahl C, Hother C, Burns JS, et al. (2008) Frequent
hypermethylation of DBC1 in malignant lymphoproliferative neoplasms. Mod Pathol 21: 632–638.
37. San Jose-Eneriz E, Agirre X, Roman-Gomez J, Cordeu L, Garate L, et al. (2006) Downregulation of DBC1 expression in acute lymphoblastic leukaemia is mediated by aberrant methylation of its promoter. Br J Haematol 134: 137–144. 38. Miyamoto K, Asada K, Fukutomi T, Okochi E, Yagi Y, et al. (2003) Methylation-associated silencing of heparan sulfate D-glucosaminyl 3-O-sulfotransferase-2 (3-OST-2) in human breast, colon, lung and pancreatic cancers. Oncogene 22: 274–280.
39. Xu XL, Yu J, Zhang HY, Sun MH, Gu J, et al. (2004) Methylation profile of the promoter CpG islands of 31 genes that may contribute to colorectal carcinogenesis. World J Gastroenterol 10: 3441–3454.
40. Izumi H, Inoue J, Yokoi S, Hosoda H, Shibata T, et al. (2005) Frequent silencing of DBC1 is by genetic or epigenetic mechanisms in non-small cell lung cancers. Hum Mol Genet 14: 997–1007.
41. Roman-Gomez J, Cordeu L, Agirre X, Jimenez-Velasco A, San Jose-Eneriz E, et al. (2007) Epigenetic regulation of Wnt-signaling pathway in acute lymphoblastic leukemia. Blood 109: 3462–3469.
42. Kagami M, Sekita Y, Nishimura G, Irie M, Kato F, et al. (2008) Deletions and epimutations affecting the human 14q32.2 imprinted region in individuals with paternal and maternal upd(14)-like phenotypes. Nat Genet 40: 237–242. 43. Su IH, Basavaraj A, Krutchinsky AN, Hobert O, Ullrich A, et al. (2003) Ezh2
controls B cell development through histone H3 methylation and Igh rearrangement. Nat Immunol 4: 124–131.
44. Vire E, Brenner C, Deplus R, Blanchon L, Fraga M, et al. (2006) The Polycomb group protein EZH2 directly controls DNA methylation. Nature 439: 871–874. 45. Raaphorst FM, Otte AP, van Kemenade FJ, Blokzijl T, Fieret E, et al. (2001) Distinct BMI-1 and EZH2 expression patterns in thymocytes and mature T cells suggest a role for Polycomb genes in human T cell differentiation. J Immunol 166: 5925–5934.
46. van Galen JC, Dukers DF, Giroth C, Sewalt RG, Otte AP, et al. (2004) Distinct expression patterns of polycomb oncoproteins and their binding partners during the germinal center reaction. Eur J Immunol 34: 1870–1881.
47. Ehrlich M (2002) DNA methylation in cancer: too much, but also too little. Oncogene 21: 5400–5413.
48. Sato N, Maitra A, Fukushima N, van Heek NT, Matsubayashi H, et al. (2003) Frequent hypomethylation of multiple genes overexpressed in pancreatic ductal adenocarcinoma. Cancer Res 63: 4158–4166.
49. Baiocchi OC (2008) Hodgkin lymphoma and interleukin-10: shall we go down from the tip of the iceberg? Leuk Lymphoma 49: 2031–2032.
50. Bermudez-Morales VH, Gutierrez LX, Alcocer-Gonzalez JM, Burguete A, Madrid-Marina V (2008) Correlation between IL-10 gene expression and HPV infection in cervical cancer: a mechanism for immune response escape. Cancer Invest 26: 1037–1043.
51. Mustea A, Braicu EI, Koensgen D, Yuan S, Sun PM, et al. (2009) Monitoring of IL-10 in the serum of patients with advanced ovarian cancer: results from a prospective pilot-study. Cytokine 45: 8–11.
52. Vairaktaris E, Yapijakis C, Serefoglou Z, Avgoustidis D, Critselis E, et al. (2008) Gene expression polymorphisms of interleukins-1 beta, -4, -6, -8, -10, and tumor necrosis factors-alpha, -beta: regression analysis of their effect upon oral squamous cell carcinoma. J Cancer Res Clin Oncol 134: 821–832.
53. Al-Moundhri MS, Alkindy M, Al-Nabhani M, Al-Bahrani B, Burney IA, et al. (2009) Combined polymorphism analysis of glutathione S-transferase M1/G1 and interleukin-1B (IL-1B)/interleukin 1-receptor antagonist (IL-1RN) and gastric cancer risk in an Omani Arab Population. J Clin Gastroenterol 43: 152–156.
54. Feng Y, Zhang J, Dai L, Zhang J, Wang P, et al. (2008) Inflammatory cytokine gene polymorphisms in gastric cancer cases’ and controls’ family members from Chinese areas at high cancer prevalence. Cancer Lett 270: 250–259. 55. Lind H, Zienolddiny S, Ryberg D, Skaug V, Phillips DH, et al. (2005)
Interleukin 1 receptor antagonist gene polymorphism and risk of lung cancer: a possible interaction with polymorphisms in the interleukin 1 beta gene. Lung Cancer 50: 285–290.
56. Lurje G, Hendifar AE, Schultheis AM, Pohl A, Husain H, et al. (2009) Polymorphisms in interleukin 1 beta and interleukin 1 receptor antagonist associated with tumor recurrence in stage II colon cancer. Pharmacogenet Genomics 19: 95–102.
57. Ford CE, Lau SK, Zhu CQ, Andersson T, Tsao MS, et al. (2007) Expression and mutation analysis of the discoidin domain receptors 1 and 2 in non-small cell lung carcinoma. Br J Cancer 96: 808–814.
58. Heinzelmann-Schwarz VA, Gardiner-Garden M, Henshall SM, Scurry J, Scolyer RA, et al. (2004) Overexpression of the cell adhesion molecules DDR1, Claudin 3, and Ep-CAM in metaplastic ovarian epithelium and ovarian cancer. Clin Cancer Res 10: 4427–4436.
59. Shimada K, Nakamura M, Ishida E, Higuchi T, Yamamoto H, et al. (2008) Prostate cancer antigen-1 contributes to cell survival and invasion though discoidin receptor 1 in human prostate cancer. Cancer Sci 99: 39–45. 60. Das S, Ongusaha PP, Yang YS, Park JM, Aaronson SA, et al. (2006) Discoidin
domain receptor 1 receptor tyrosine kinase induces cyclooxygenase-2 and promotes chemoresistance through nuclear factor-kappaB pathway activation. Cancer Res 66: 8123–8130.
61. Dolloff NG, Shulby SS, Nelson AV, Stearns ME, Johannes GJ, et al. (2005) Bone-metastatic potential of human prostate cancer cells correlates with Akt/ PKB activation by alpha platelet-derived growth factor receptor. Oncogene 24: 6848–6854.
62. Wehler TC, Frerichs K, Graf C, Drescher D, Schimanski K, et al. (2008) PDGFRalpha/beta expression correlates with the metastatic behavior of human colorectal cancer: a possible rationale for a molecular targeting strategy. Oncol Rep 19: 697–704.
63. Wilczynski SP, Chen YY, Chen W, Howell SB, Shively JE, et al. (2005) Expression and mutational analysis of tyrosine kinase receptors c-kit, PDGFRalpha, and PDGFRbeta in ovarian cancers. Hum Pathol 36: 242–249. 64. Garcia-Manero G (2008) Demethylating agents in myeloid malignancies. Curr
Opin Oncol 20: 705–710.
65. Fenaux P, Mufti GJ, Hellstrom-Lindberg E, Santini V, Finelli C, et al. (2009) Efficacy of azacitidine compared with that of conventional care regimens in the treatment of higher-risk myelodysplastic syndromes: a randomised, open-label, phase III study. Lancet Oncol 10: 223–232.