La presente tesi è stata prodotta nell’ambito della scuola di dottorato “International PhD School in Biomolecular and Biotechnological Sciences” dell’Università degli Studi di
UNIVERSITÀ
DEGLI
STUDI
DI
SASSARI
I n t e r n a t i o n a l P h D S c h o o l i n B i o m o l e c u l a r
a n d B i o t e c h n o l o g i c a l S c i e n c e s
Curriculum: Biochemistry and Molecular Biology Coordinator: Prof. Leonardo Antonio Sechi
XXVII Ciclo
Identification and characterization of
biomarkers in atherosclerosis and diabetes
Coordinator: Prof. Leonardo Antonio Sechi Tutor: Prof.ssa Marilena Formato
Co-tutor: Dott. Antonio Junior Lepedda, PhD
T A B L E O F C O N T E N T S
ABSTRACT 1
INTRODUCTION 2
CHAPTER 1: Development of a method for urine bikunin/urinary trypsin inhibitor (UTI) quantitation and structural characterization: Application to type 1 and type 2 diabetes
1. INTRODUCTION 3
1.1. DIABETES 3
1.2. BIKUNIN 7
2. AIM OF THE STUDY 11
3. MATERIALS AND METHODS 12
3.1. SAMPLE COLLECTION 12
3.2. ANION EXCHANGE CHROMATOGRAPHY 12
3.3. CELLULOSE ACETATE ELECTROPHORESIS 13
3.4. GAG DEPOLYMERISATION 14 3.5. SDS-PAGE 14 3.6. ASSAY CALIBRATION 15 3.7. FLUOROTAGGING WITH 2-AMINOACRIDONE 16 3.8. FLUOROPHORE ASSISTED CARBOHYDRATE ELECTROPHORESIS 16 3.9. STATISTICAL ANALYSIS 17
3.10. UTI IDENTIFICATION BY MS ANALYSIS 18
CHAPTER 2: Proteomic analysis of plasma-purified VLDL, LDL, and HDL fractions from atherosclerotic patients undergoing carotid endarterectomy: identification of serum amyloid A as a potential marker
1. INTRODUCTION 31
1.1. ATHEROSCLEROSIS 31
1.2. LIPOPROTEINS 34
1.3. APOLIPOPROTEINS 37
2. AIM OF THE STUDY 38
3. MATERIALS AND METHODS 39
3.1. SAMPLE COLLECTION 39
3.2. LIPOPROTEIN PURIFICATION 40
3.3. 2-DE ANALYSIS 41
3.4. IN-GEL DIGESTION AND MALDI-TOF MS
ANALYSIS 42
3.5. WESTERN BLOTTING ANALYSIS 43
3.6. STATISTICAL ANALYSIS 44
4. RESULTS 45
5. DISCUSSION 49
REFERENCES 52
COLLABORATION TO OTHER RESEARCH
ABSTRACT
Diabetes and atherosclerosis are two chronic pathologies which prevalence is constantly growing worldwide, leading to disability and life-threatening complications. Since their consequences represent major causes of mortality and morbidity in developed countries, the identification and characterisation of new potential biomarkers may contribute to revealing the underlying mechanisms of pathology onset and progression, and to improving the diagnostic methodologies and the therapeutic approaches used for the treatment of these pathological conditions.
A method recently developed was applied to urine from type 1 and type 2 diabetes patients and healthy controls for quantitation and structural characterisation of Urinary Trypsin Inhibitor (UTI), evidencing higher levels of this proteoglycan in both classes of patients with respect to controls. Furthermore, mass spectrometry (MS) analysis revealed oxidative post-translational modifications, which may affect UTI localization, function and pathophysiological activity
Lipoproteomics of purified plasma VLDL, LDL and HDL fractions from both patients undergoing carotid endarterectomy and healthy controls was performed by 2-DE coupled with MS, allowing the identification of Acute Phase-SAA as a potential biomarker of advanced atherosclerotic lesions. A role of LDL as Acute Phase-SAA carrier into the subendothelial space of arteries was also suggested.
INTRODUCTION
Diabetes and atherosclerosis are two chronic pathologies that are strongly correlated with higher rates of morbidity and mortality in Western countries, with a prevalence that is constantly growing worldwide, even in low- and middle-income countries.
Since the consequences of these diseases can lead to disabling and life-threatening complications, it might be of great interest to identify and characterize potential biomarkers, which may be useful to monitor these pathological conditions, as well as may contribute to revealing the underlying mechanisms of pathology onset and progression, helping in the improvement of the diagnostic methodologies and the therapeutic approaches used for the treatment of these pathological conditions.
CHAPTER 1:
Development of a method for urine
bikunin/urinary trypsin inhibitor (UTI) quantitation
and structural characterization: Application to type 1
and type 2 diabetes
1. INTRODUCTION 1.1. DIABETES
Diabetes is a chronic disease, consisting either in a lack of insulin synthesis or in insulin resistance by target cells, which leads to persistent high blood concentration of glucose. Insulin is a hormone, produced by β-cells in the islets of Langerhans of pancreas, which main function is the regulation of glucose uptake from blood, allowing cells to store it or to convert it into energy. Insulin is synthetized as a precursor of 110 amino acids called preproinsulin, encoded by a single gene located on the distal end of the short arm of chromosome 11 [1], and its 24 amino acids signal peptide is cleaved thus forming the 86 amino acid long peptide called proinsulin. The mature hormone consists in two polypeptide chains, the A- and B- chains of 21 and 30 amino acid respectively, linked together by two disulphide bonds and is stored as Zn2+-stabilized hexamers into secretory granules [2].
Insulin is fundamental in the regulation of anabolism, inducing the uptake of glucose, amino acids and fatty acids into cells, promoting the synthesis of glycogen, lipids and proteins, and inhibiting their degradation and release into the circulation [3].
The metabolic diseases resulting from the defect in insulin secretion or action, determine chronic hyperglycemia which early symptoms are polyuria, polydipsia, weight loss, sometimes with polyphagia, and blurred vision [4].
It is possible to distinguish three main types of diabetes according to the mechanisms underlying the dysfunction in carbohydrate metabolism. Type 1 diabetes, also known as immune-mediated diabetes, is triggered by an autoimmune destruction of insulin-producing pancreatic β-cells which leads to insufficient production of insulin. The etiology is not completely known yet, as diabetic disease is in relation with several genetic and environmental factors that are poorly defined so far [4]. The onset is typically associated with childhood or adolescence but it can affect people of any age, usually leading to compulsory insulin treatment to prevent the development of ketoacidosis, as in most cases insulin shortage is absolute for type 1 diabetic patients [5]. Type 1 diabetes frequency in Italy accounts for 3 to 6% of all diabetic diseases, except for Sardinia, in which type 1 diabetes frequency is more than three times greater with respect to the mean incidence in the rest of the country and the second highest in the world after Finland (up to 45 cases a year / 100,000) [6].
Conversely, insulin resistance or its hyposecretion can lead to type 2 diabetes syndrome, an adult-onset dysfunction which often does not require insulin treatment. Obesity, poor diet, physical inactivity and family history of diabetes are some of the risk factors related with this metabolic disorder although the specific etiology is not known yet. Frequently this condition remains undisclosed for years, as hyperglycemia develops gradually and it is often difficult to perceive the classical symptoms of diabetes [4]. Type 2 diabetes prevalence is greater with respect to type 1, as it represents nearly 90% of all cases of diabetes in the world. It is particularly worrying that the incidence of type 2
diabetes in youth, as well as the obesity rates in adolescence, is rapidly increasing [7].
When insulin resistance occurs during pregnancy, usually around the 24th week, subsequent high blood glucose levels lead to a condition known as gestational diabetes, that habitually resolves with delivery [4, 8]. Women affected by this disorder normally need to follow a dietary plan and to do physical exercise to control their blood glucose levels, in order to avoid consequences for both the mother and her baby. In some cases insulin or medical treatment are necessary for managing gestational diabetes and to prevent pathologies as macrosomia or preeclampsia, hazardous dysfunctions for both new-born and pregnant [8].
In both type 1 and type 2 diabetes, the resulting hyperglycemia can lead to severe long-term damage of different organs, particularly eyes, kidneys, nerves and blood vessels. More in detail, complications of diabetes include damages to retina with potential loss of vision, nephropathy leading to renal failure, peripheral neuropathy with prospective foot ulcers, non-traumatic lower limb amputations, autonomic neuropathy causing gastrointestinal, genitourinary and sexual dysfunction [4].
Nonetheless, persistent elevated blood glucose levels are associated with a two or three-fold increase risk of cardiovascular disease that represents the major cause of mortality in patients with diabetes [9, 10]. Moreover diabetic patients are more prone to angina, myocardial infarction, stroke, peripheral artery disease, and congestive heart failure, as well as to increased risk of cardiovascular complications [8, 10]. Actually, long-term patients affected by insulin-related dysfunctions are more predisposed to cardiovascular diseases, as well as hypertension and
abnormalities of lipoprotein metabolism [4]. Additionally, it has been reported an association between diabetes and accelerated atherosclerosis macrovascular disease regarding blood vessels that supply the heart, brain and lower extremities that can lead diabetic patients to higher risk of myocardial infarction, stroke and limb amputation [11].
The mechanisms underlying these alterations are related with superoxide overproduction by the mitochondrial electron-transport chain, which results in greater oxidative stress and higher levels of reactive oxygen species (ROS) [12]. ROS production is stimulated by intermittent hyperglycemia rather than permanent hyperglycemia [9], as supported by in vitro [13, 14], in vivo [15] and clinical studies [16], through four main pathways: increased polyol pathway flux, increased advanced glycation end-product (AGE) formation, activation of protein kinase C (PKC) isoforms, and increased hexosamine pathway flux [11].
Other mechanisms contributing to vascular damage and higher cardiovascular disease risk in patients affected by both type 1 and type 2 diabetes are dyslipidemia [17], hyperglycemia-related glycated albumin, which has been suggested to promote atherosclerosis by impairing albumin anti-oxidant activity [18, 19], and hypoglycemia that may induce regulatory responses as inflammation, blood coagulation abnormality, sympathoadrenal response and endothelial dysfunction or increased risk of arrhythmia [20-23].
Diabetes is a huge and growing problem all over the world, affecting about 382 million people in the world, 80% of which living in low- and middle-incoming countries. Despite all healthcare policies conducted by all countries in the world during the last years, estimates indicate that the number of diabetic patients will significantly increase in the next 20 years [8, 24].
Beyond its negative effects on people health, diabetes represents a noteworthy threat to global development, as it costs 548 billion dollars in health spending [25, 26].
1.2. BIKUNIN
Bikunin is a small plasma proteoglycan with Serine Protease inhibitory activity. It is composed of a protein moiety as well as two carbohydrate chains. The polypeptide portion consists of 147 amino acid residues folded in two Kunitz-type domains (7 kDa each) containing three disulphide bonds, a connecting peptide as well as an N- and a C-terminal moieties of 10-25 amino acid residues [27]. Bikunin is synthetized as a 352 amino acid residues long precursor protein called α1
-microglobulin/bikunin precursor (AMBP) that, in the secretory vesicles, is proteolytically cleaved into the mature form of bikunin and α1
-microglobulin [27, 28], a 25 kDa plasma protein with unclear physiological function [29]. A low-sulphated chondroitin sulphate (CS) chain, O-linked to the Serine 10, and an oligosaccharide, N-linked to the Asparagine 45, are bound to the protein moiety. CS chain is composed by 12-18 disaccharide repeating units consisting of N-acetyl galactosamine (GalNAc), which may be sulphated either in position C4 or in C6, and glucuronic acid. The linkage region that connects CS to bikunin is composed, as in other types of glycosaminoglycans (GAG), by Xyl-Gal-Gal-GlcA. In turn, the N-linked oligosaccharide has a biantennary structure typical of glycoproteins [30].
Bikunin is synthesized mainly by hepatocytes, even though small quantities of coding RNA have been found in stomach, kidney, pancreas and intestine too [27]. After being synthesized it is secreted in plasma, where about 90-98% occur as a subunit of Inter-alpha-Inhibitor (IαI) family molecules, linked via an ester bond between C6 of a
non-sulphated GalNAc residue of the CS chain and the α-carbon of the C-terminal amino acid residue of one or two polypeptides [31], called the heavy chains, to form IαI and Pre-alpha-Inhibitor (PαI) respectively [32]. Due to its inhibitory activity, free bikunin has a half-life of 4-30 minutes [27], and it is then rapidly excreted in urine as Urinary Trypsin Inhibitor (UTI) [32], which can inhibit various Serine Proteases such as trypsin, chymotrypsin, elastase, granzyme K, cathepsin G, acrosin and plasmin [27, 33, 34] through its two Kunitz-type domains.
Despite several studies on bikunin/UTI structure and levels have been performed since 1950s, understanding the biological function of bikunin deserve further studies [34].
The molecular mass of the whole bikunin is about 25-26 kDa, being the protein core, the CS and the oligosaccharide chains 16 kDa, 7 kDa and 2 kDa respectively, as reported by various studies and confirmed by ultracentrifugation methods [27, 34]. However, because of chondroitin sulphate chain extended conformation, bikunin behaves like a globular protein of about 67 kDa by gel filtration and has an apparent molecular mass of 35-45 kDa by SDS/PAGE [35].
Bikunin main function is inhibition of proteinases, although many studies provided evidences on its activity in stimulating the growth of fibroblasts [36], in regulating calcium intracellular levels [37], in supporting the formation of the hyaluronan-containing extracellular matrix [38] and in inhibiting the formation of kidney stone [39]. When associated with IαI bikunin lacks some of its activities, therefore the proteolytic cleavage may function as a regulatory mechanism. In fact, several research findings indicate that the free proteoglycan is part of the inflammatory process as immediate extracellular degradation of IαI
occurs during inflammation, releasing bikunin [32]. Following an inflammatory stimulus, IαI molecules are recruited from circulation to the extravascular sites, where the heavy chains are transferred from CS chain to the locally synthesized hyaluronic acid (HA) to form the serum-derived hyaluronan-associated-protein- (SHAP-) HA complex, which supports the formation of extracellular matrix and its stabilization [40]. Because of its proteinase inhibitory activity, free bikunin is rapidly cleared from circulation (approximately 7 minutes) to prevent a shutdown of repair and healing processes, by both tissue uptake and renal excretion and it is found in urine as Urinary Trypsin Inhibitor (UTI) [34, 41].
In human, total plasma concentration of bikunin is 4-7 μM, of which only 2-10% is in free form, while in urine UTI levels are about 0.03-0.05 μM, most of which is in free form [27]. UTI levels are usually low in healthy individuals but they can increase up to 10 fold in both acute and chronic inflammatory diseases [42], bladder carcinoma [43], brain contusion [44], disseminated cancers [45], acute hepatitis [46], Fabry's disease [47], Crohn’s disease, arthritis, pericarditis, deep vein thrombosis, fibromyalgia, asthmatiform bronchitis [48], neoplasia and kidney diseases [27].
Actually, UTI can be considered a positive acute phase protein useful as a marker to easily and rapidly monitor an inflammatory condition [32, 48].
To date, UTI quantification in urine is performed mainly by means of either enzyme inhibition or immunological detection [28]. In general, all UTI forms are measured together [32], either directly or indirectly. Unfortunately, these approaches may be affected by either low specificity or sensibility.
More in detail, enzyme inhibition methods rely on the addition of both known amounts of trypsin and a substrate to the specimen, to measure the degree of trypsin inhibition. When the substrate is cleaved by trypsin it yields to detectable products [48]; if UTI or other trypsin inhibitors are present in the sample, some of the available substrate is not cleaved by trypsin and the response is then reduced [32]. Dipstick methods, based on enzyme inhibition, are available for the rapid detection and quantitation of urinary trypsin inhibitors [49, 50]. Besides allowing easy and rapid UTI quantification resulting in colour shift, these methods have a detection limit of about 6.25 mg/L, resulting in low sensitivity [28]. Furthermore, methods based on enzyme inhibition do not take into account normalization for creatinine levels.
On the other hand, ELISA or western blotting, which both rely on either mono- or polyclonal antibodies, are affected by degree and specificity of the immunological reaction. More in detail, while ELISA tests do not discriminate among free UTI, UTI containing complexes (AMBP, PαI, IαI) or UTI fragments [28, 32], absolute and reproducible protein quantitation is not possible by means of western blotting analysis.
Since no existing methods for UTI quantitation contemplate normalization for creatinine levels, we decided to set up a sensitive method for UTI quantitation and its structural characterization, starting from low quantities of specimen. Merging classical chromatographic methods, already applied by our research group for GAG and proteoglycan purification [47, 51-54], with image analysis of SDS-PAGE profiles, effective for the quantification of micro quantities of proteins [55], we were able to directly measure UTI levels and to perform its structural characterization by means of mass spectrometry (MS).
2. AIM OF THE STUDY
The identification of new biomarkers of diabetes may have a huge impact on the great number of people affected by these metabolic syndromes. Estimates indicate that in Sardinia about 50,000 people have either type 1 or 2 diabetes, making this island the region with the highest prevalence in Italy and one of the highest worldwide, together with Finland [6]. Taking into account patients along with their families, in Sardinia the number of people involved in the diabetic burden raise up to 250,000 – 300,000, nearly 20% of the entire Sardinian population.
The aim of this study was the development of an innovative method for direct UTI quantitation and structural characterisation in patients affected by both type 1 and type 2 diabetes, in relation to kidney function and glycemic control.
To achieve this goal we set up a method consisting in UTI purification by anion exchange chromatography followed by SDS-PAGE, quantitation by image analysis on SDS-PAGE profiles, and structural characterization by both FACE and MS analyses. The MS approach may lead to the detection of post translational modifications (PTMs) that might affect UTI localization, function and pathophysiological activity.
3. MATERIALS AND METHODS 3.1. SAMPLE COLLECTION
All experiments were carried out on first morning urine samples from 29 patients affected by type 1 diabetes (31.76 ± 10.95), 22 patients having type 2 diabetes (age 64.05 ± 7.40) and 42 healthy controls (age 38.00 ± 21.14) matched for age and sex with patients. Urine were collected, immediately centrifuged at 5,000 x g for 15 minutes and then stored at -20 °C until analysis. Each sample was assessed for creatinine content by means of the Jaffè method (Sentinel Diagnostic). Twenty-four hours albumin excretion rate (AER) was evaluated by an immunoturbidimetric method (Roche Diagnostics).
UTI purification and quantitation were performed according to a method recently developed by our research group [56] with slight modifications.
3.2. ANION EXCHANGE CHROMATOGRAPHY
UTI was purified starting from a volume of urine corresponding to 5 mg of creatinine. Urine samples were loaded onto chromatography columns (Econo-Column Chromatography Columns, 0.5 x 20 cm, Bio-Rad laboratories) packed with 1 mL of DEAE-Sephacel (GE Healthcare Life Sciences), an anion exchange resin, previously equilibrated with a buffer containing 0.02 M Tris and 0.15 M NaCl, pH 8.6. The same equilibrating buffer was also used to wash away all the by-products and impurities contained in urine samples from the column, until absorbance at 280 nm was less than 0.05.
Two gravity feed elution steps were performed, recovering 6 mL each, (I step: 0.02 M Tris and 0.45 M LiCl, pH 8.6; II step: 0.02 M Tris and 2 M LiCl, pH 8.6) to elute separately CS-containing UTI fraction (I step) or free CS in urine (II step) [53]. Concentration and dialysis of the eluted
fractions were performed by means of Amicon Ultra-0.5 Centrifugal Filter Units (Millipore), according to manufacturer’s instructions.
3.3. CELLULOSE ACETATE ELECTROPHORESIS
GAG composition was determined by discontinuous electrophoresis according to Cappelletti et al. [57]. This method, combined with the differential susceptibility of GAGs to precipitation by organic solvents, allows optimal and rapid separation of intact GAGs with high resolution and sensitivity (10 ng detection limit). GAGs were separated in 0.25 M barium acetate buffer, pH 5.0, by three steps. Firstly, Titan III-H zone cellulose acetate plate (6.0 x 7.5 cm, Helena BioSciences) was dipped in distilled H2O for about 1.5 cm; the plate was immediately blotted
between filter papers. The opposite end was then immersed in 0.1 M barium acetate, pH 5.0, for 5.5 cm, leaving a narrow band (2 – 4 mm large) apparently dry between H2O and buffer. The plate was blotted
again between filter papers, and 5 µl of sample were applied in the narrow dry band. The loaded plate was subjected to 5 mA constant current for about 6 minutes and then soaked in 0.1 M barium acetate, pH 5.0, for 2 minutes. In the following step, a 15 mA constant current was applied for 14 minutes. The plate was removed once more from the chamber and immersed for 2 minutes in 0.1 M barium acetate buffer, pH 5.0, containing 15% ethanol (v/v). The last electrophoretic step was carried out at 12 mA constant current for 17 minutes. Following electrophoresis, the plate was stained in 0.1% Blue Alcian (w/v) solution for 10 minutes, and destained in 1% acetic acid (v/v).
Standard GAGs were loaded together with our samples, and their different electrophoretic mobility was compared. UTI identification was performed by comparing untreated and Chondroitin ABC lyase (Chase-ABC) treated sample, as further described below.
UTI and the different GAG species were expressed as relative percentages by densitometric analysis of Alcian blue-stained cellulose plates quantitated using Quantity One software, v 4.6.3 (Bio-Rad laboratories).
3.4. GAG DEPOLYMERISATION
The samples were diluted with a 5X buffer, containing 0.5 M ammonium acetate, pH 8.0, and then incubated overnight at 37 °C with 0.025 U of Chase-ABC (Sigma Aldrich), to completely depolymerize the GAG chain into unsaturated disaccharide units.
Preliminary tests showed that such a quantity of enzyme was effective for the complete CS digestion of up to 90 µg of UTI.
3.5. SDS-PAGE
Chase-treated samples were resolved by means of SDS-PAGE, a technique widely used to separate proteins according to their electrophoretic mobility. SDS is an anionic detergent that binds to polypeptides, giving them identical charge per unit mass, resulting in a separation based on protein molecular mass. Furthermore, the presence of a reducing agent allows complete proteins linearization by breaking disulphide bonds.
Samples were diluted with 4X Laemmli buffer, containing 250 mM Tris, pH 6.8, 8% SDS (w/v), 8% dithiothreitol (DTT) (w/v), 40% glycerol (v/v), 0.0008% bromophenol blue, and then subjected to 5 minutes boiling step. Protein separation was carried out into 1 mm-thick Tris-glycine polyacrylamide running gel (15% T, 3% C), using a Mini Protean II cell vertical slab electrophoresis apparatus (Bio-Rad laboratories). Electrophoresis was performed at 50 V for 15 minutes and subsequently at 150 V until the bromophenol blue dye reached the lower
limit of the gel. Then gels were fixed in 30% ethanol (v/v), 2% phosphoric acid (v/v) for 1 hour, washed twice in 2% phosphoric acid (v/v) for 10 minutes, and then equilibrated in 18% ethanol (v/v), 2% phosphoric acid (v/v), 15% ammonium sulphate (w/v) for 30 minutes. The staining solution, containing 2% Coomassie Brilliant Blue (CBB) G-250 (w/v), was then added to the solution (0.02% final concentration). After 48 hours gels were acquired by means of GS-800 calibrated densitometer (Bio-Rad laboratories) at 63 µm resolution, and then analysed using Quantity One software, v 4.6.3 (Bio-Rad laboratories) [55].
3.6. ASSAY CALIBRATION
To assess UTI levels in the samples, we set up a calibration curve, using a highly purified UTI fraction. This fraction was obtained from 80 mL of a pooled urine sample using a chromatographic column packed with 10 mL of DEAE-Sephacel resin. 30 mL of eluate were concentrated and dialysed with an Amicon Ultra-15 Centrifugal Filter Unit (Millipore). Chase ABC treatment and SDS-PAGE were carried out as described above. UTI bands were cut from several SDS-PAGE gel lanes, destained and dehydrated as reported for MS analysis. UTI was extracted by incubating gel pieces in 5 mL of a buffer containing 0.05 M Tris and 2% SDS (pH 6.8) for 24 hours at 60 °C. The solution was then concentrated using an Amicon Ultra-0.5 Centrifugal Filter Unit (Millipore) and finally UTI concentration was determined by means of DC Protein Assay Kit (Bio-Rad laboratories), using bovine serum albumin (BSA) as a standard. A calibration curve was set up for protein quantitation, by resolving different quantities of this highly purified UTI sample (from 0.25 to 4 µg) by SDS-PAGE.
Binding capacity of DEAE-Sephacel resin, both intra- and inter- assay Coefficient of Variability (CV), percentage of UTI recovery, method sensitivity and test reproducibility were assessed.
3.7. FLUOROTAGGING WITH 2-AMINOACRIDONE Depolymerised GAG free reducing ends can be derivatized with 2-aminoacridone (AMAC) by reductive amination in the presence of sodium cyanoborohydride (NaBH3CN) as described by Calabro et al.
[58]. Briefly, 40 µL of 12.5 mM AMAC solution in glacial acetic acid/DMSO (3:17 v/v) were added to Chase ABC-treated sample, followed by 15 minutes incubation at room temperature. 40 µL of 1.25 M NaBH3CN were then added to each sample and mixtures were
incubated at 37 °C overnight. After derivatization, 20 µL of glycerol (20% final concentration) were added to each sample prior to electrophoresis.
3.8. FLUOROPHORE ASSISTED CARBOHYDRATE
ELECTROPHORESIS
Fluorophore assisted carbohydrate electrophoresis (FACE) allows resolving different fluoro-tagged disaccharides species obtained by GAGs depolymerisation with specific lyases. It was performed as previously described by Karousou et al. [59] in a MiniProtean II cell vertical slab gel electrophoresis apparatus (Bio-Rad laboratories). Electrophoresis was conducted into 25% T and 7.5% C polyacrylamide running gels, previously prepared in 187.5 mM Tris-borate and 187.5 mM Tris-HCl buffer, pH 8.8. Stacking gels were 5% T and 15% C in 0.36 M Tris-HCl buffer, pH 8.8. 5 µL of each sample were loaded in each well; a sample of bromophenol blue dye was run in a lane alone to
monitor the electrophoresis. Electrophoresis was performed in 0.15 M Tris-borate buffer, pH 8.8, at 400 V and 4 °C until the dye was 1.2 mm from the bottom of the gel.
Gels were then acquired by a UV-light box using a CCD camera (Gel Doc XR System) and analysed with Quantity One 4.6.3 (Bio-Rad laboratories). Identification of sample bands was achieved by comparing their electrophoretic mobility with standard ∆-disaccharides, run in the same gel. Following Quantity One image analysis, relative percentages of different ∆-disaccharide species were calculated.
To quantify ∆-disaccharides in each sample, a calibration curve was set up, loading known quantities ranging from 25 to 800 ng of AMAC-derivatised ∆-disaccharides obtained by depolymerisation of a highly purified UTI sample assayed for hexuronate content, using glucuronic acid as a standard, according to the carbazole method by Bitter and Muir [60].
3.9. STATISTICAL ANALYSIS
Statistical analyses were performed by using Sigma Stat 3 software package (Systat software).
UTI concentration values were reported as median and interquartile range, as normality test failed. Mann-Whitney rank sum test was performed to evaluate differences among different groups, while correlations between UTI levels and age, UTI levels and glycated haemoglobin, and UTI levels and micro albuminuria, were assessed by Spearman’s correlation.
3.10. UTI IDENTIFICATION BY MS ANALYSIS
After SDS-PAGE separation of pooled urine samples from controls, bands corresponding to UTI were excised from gels, finely minced and destained with 5 mL solution containing 2.5 mM NH4HCO3, 50%
acetonitrile (ACN) (v/v), at 60 °C for 2 hours, changing destaining solution three times. Gel fragments were dehydrated with 5 mL of pure ACN for 15 minutes and dried at room temperature. After reduction with 10 mM DTT, at 56 °C for 45 minutes, alkylation with 55 mM iodoacetamide, at room temperature for 30 minutes, and treatment with 5 ng/mL trypsin (Promega), obtained peptides were recovered using 50% ACN/0.5% formic acid (v/v). 50 µL of the solution containing peptides were filtered through 0.22 µm filter, resolved by means of nanoflow RP LC and then analysed by a Triple TOF 5600 System (AB SCIEX) operating in IDA (information-dependent acquisition) mode.
Obtained data were processed through MASCOT algorithm (v 2.1.04), incorporated in ProteinPilot software (v 4.0.8085; AB SCIEX), against the Swiss Prot 2012 human protein database. Variable modifications such as methionine oxidation, asparagine and glutamine de-amidation, and lysine acetylation were selected. The tolerance for precursor ion and MS/MS fragment mass values were set at 25 ppm and 0.3 Da, respectively. Trypsin digestion and two possible missed cleavages were set up. Only the two top ranked peptide matches were taken into consideration for protein identification.
4. RESULTS
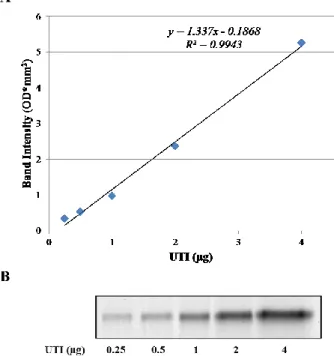
In order to perform an accurate quantitation, a calibration curve was set up (y = 1.337x – 0.1868, R2 = 0.9943), by loading known quantities of
highly purified UTI fraction ranging from 0.25 to 4 µg of protein, having a linear response between band intensity, expressed as optical density, and UTI quantity in the range considered (Figure 1).
Figure 1: (A) Calibration curve obtained by image analysis of SDS-PAGE profiles of increasing quantities (ranging from 0.25 to 4 µg of protein) of purified UTI. (B) UTI bands obtained by SDS-PAGE. OD: optical density.
DEAE-Sephacel binding capacity (about 75 µg / mL of resin), intra- and inter-assay CVs (4.93% and 10.63% respectively) and percentage of UTI recovery, evaluated at two different concentrations (88.2% and 97.0%), as well as method sensitivity (0.5 µg UTI / mg Creatinine) were assessed as reported previously [56].
UTI identity was confirmed by means of Nano-LC-MS/MS analysis, followed by MASCOT search that allowed identification of AMBP (UniProtKB/Swiss-Prot: P02760.1), with sequence coverage of 51% and a high protein score, as shown in Table 1. This precursor of 352 amino acid residues is processed into mature Bikunin and α-1-microglobulin by proteolytic cleavage.
Besides confirming bikunin identity, MS analysis allowed the detection of post-translational modifications that may represent a potential marker of oxidative stress in both type 1 and type 2 diabetic patients. In fact, a Proline residue was found to be oxidised in both classes of patients, in addition to a dioxidation of a Phenylalanine residue that was detected in type 1 diabetes patients (Table 1).
Table 1: MS/MS data, reporting bikunin identification and post-translational oxidative modifications.
The two chromatographic fractions (I and II elution), containing either UTI or free CS isomers, were analysed for GAG/PG content, UTI levels/structure, and chondroitin sulphate structure.
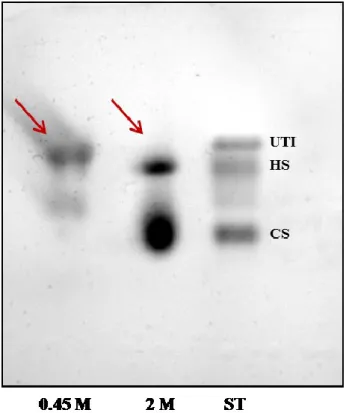
GAG composition in purified samples was determined by means of cellulose acetate electrophoresis, conducted according to Cappelletti et al.[57]. To identify GAGs in both 0.45 M and 2 M LiCl eluate fractions, sample treatments with specific lyases were performed. Furthermore standard GAGs were run in a separate lane.
As indicated in Figure 2, 0.45 M and 2 M LiCl fractions significantly differ in GAG composition: in the first eluate, in fact, only UTI is present, while free CS, together with Heparan Sulphate, are detectable in the 2 M LiCl fraction.
Figure 2: Cellulose acetate electrophoresis. Lane 1 and 2 report the electrophoretic profile of 0.45 M and 2 M eluate fraction, respectively. UTI, Heparan Sulphate and Chondroitin Sulphate standards were loaded in lane 3.
Differential elution of CS-containing UTI and free CS in urine was confirmed by means of SDS-PAGE analysis, as reported by Figure 3. In
the first two lanes, in fact, a well-defined band focuses at about 25 kDa corresponding to Chase ABC-treated UTI of a 0.45 M LiCl eluate fraction, whereas a smeared UTI band, due to the structural heterogeneity of the CS chain, is present at about 37 kDa of the second two lanes, corresponding to an untreated UTI fraction eluted with 0.45 M LiCl buffer. In the third and fourth couples of lanes either Chase-ABC treated or untreated 2 M eluted fraction, with no UTI are reported.
Figure 3: SDS-PAGE electrophoretic profile evidencing differential elution patterns between 0.45 M and 2 M fractions. A well-defined band of Chase ABC-treated UTI focuses at about 25 kDa, while a smeared UTI band corresponding to the whole proteoglycan focuses at 37 kDa in the 0.45 M eluate fraction. No detectable bands of either intact or CS-depolymerised UTI are present in the 2 M eluate.
A further validation of differential elution was carried out by FACE analysis of Chase-ABC treated fractions. As shown in Figure 4, the 0.45 M fraction contains a low-sulphated CS, with a sulphation degree
ranging from 35 to 55 %, typical of UTI, whereas in the 2 M fraction a highly sulphated CS is present.
Figure 4: FACE representative profiles of CS ∆-disaccharides derivatised with AMAC from 0.45 M (lanes 1-4) and 2 M (lanes 5-8) eluates.
The method for UTI quantitation and structural characterization was applied to 29 patients affected by type 1 diabetes (age 31.76 ± 10.95), 22 patients having type 2 diabetes (age 64.05 ± 7.40) and 42 healthy controls (age 38.00 ± 21.14), matched for age and sex with patients, evidencing higher levels of UTI in either type 1 or type 2 diabetic patients analysed. No differences between the two groups of patients were evidenced (P = 0.309) (Table 2)
Table 2: UTI levels (µg of UTI / mg creatinine), levels (µg UA / mg creatinine) and sulphation degree of UTI-bound chondroitin sulphate (expressed as percentage of ∆di-mono 4S / ∆di-mono 4S+∆di-non SCS) in controls, type 1 and type 2 diabetic patients.
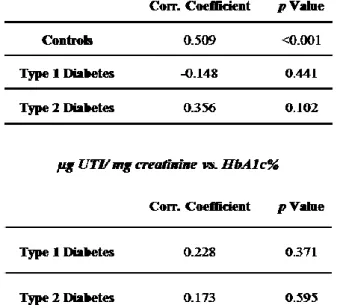
All diabetic patients were normoalbuminuric with an albumin excretion rate (AER) lower than 30 mg / 24 h except for 4 patients with type 2 diabetes presenting with microalbuminuria (AER 52.2 mg / 24 h, 13.68 µg UTI / mg creatinine; AER 81.9 mg / 24 h, 27.44 µg UTI / mg creatinine; AER 129.4 mg / 24 h, 22.71 µg UTI / mg creatinine; AER 170 mg / 24 h, 22.94 µg UTI / mg creatinine). Differences between the group of patients with type 2 diabetes and controls still persisted even when microalbuminuric patients were not taken into account (P = 0.019) Spearman’s correlation tests between UTI levels and age, UTI levels and glycated haemoglobin, as well as UTI levels and microalbuminuria, were performed to rule out the possibility of an association between these parameters, evidencing no correlation (Table 3).
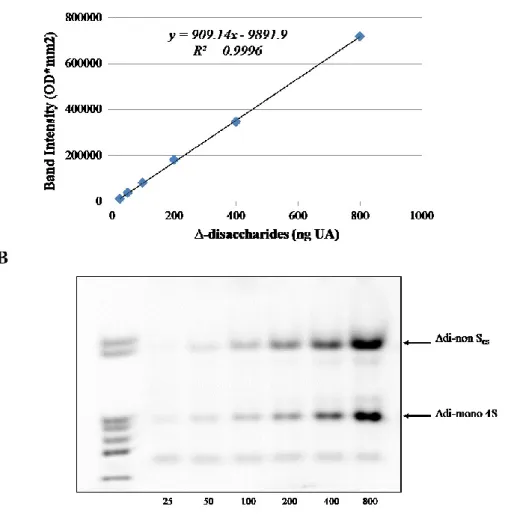
UTI CS chains, from both diabetic patients and healthy controls, were quantified and structurally characterised by means of FACE analysis. More in detail, in order to quantify the different disaccharide species in the samples, a calibration curve was set up (y = 909.14x – 9891.9, R2 = 0.9996) by resolving known quantities of ∆-disaccharides, ranging from
25 to 800 ng as uronic acid (UA), as reported in Figure 5. ∆-disaccharides were obtained from the depolymerisation of a purified UTI fraction.
Table 3: Spearman’s correlation tests between UTI levels and age, UTI levels and glycated haemoglobin, as well as UTI levels and microalbuminuria.
Figure 5: (A) Calibration curve obtained by image analysis of FACE profiles of increasing quantities (ranging from 25 to 800 ng of UA) of purified Chase-ABC treated UTI.
(B) ∆-disaccharides bands obtained by FACE analysis. Lane 1: mixture of commercial standard ∆-disaccharides (Δdi-nonSHA, Δdi-nonSCS, Δdi-mono 6S,
Δdi-mono 4S, Δdi-mono 2S, Δdi-di (4,6)S, Δdi-di (2,4)S. OD: optical density.
Levels and sulphation degree of CS chains were assessed by image analysis using Quantity One software (Bio-Rad laboratories). Total CS levels are significantly higher in type 1 and type 2 diabetes patients with respect to controls, being about 1.65 times greater (P = 0.037), but no
significant differences occur between type 2 diabetes patients and controls or between the two groups of patients (P = 0.087 and P = 0.791 respectively). Moreover, sulphation degree of CS chains was lower in both classes of patients with respect to controls (P = 0.002 and P = 0.018, respectively), as percentages of ∆di-mono 4S / ∆di-mono 4S+∆di-non SCS were 37.709, 42.024 and 56.124, in type 1, type 2 diabetes
5. DISCUSSION
This study reports the structural characterization of both protein and chondroitin sulfate moieties of UTI in type 1 and type 2 diabetic patients as well as in healthy controls. UTI purification was performed by anion exchange chromatography starting from a volume of urine corresponding to 5 mg of creatinine and 0.45 M LiCl eluate fraction was splitted in two aliquots for structural and quantitative analyses. The first aliquot was subjected to Chase ABC treatment and the obtained disaccharide units were analysed by Fluorophore-Assisted Carbohydrate Electrophoresis following derivatization with 2-aminoacridone. The second one was resolved by SDS-PAGE. A calibration curve for protein quantitation was set up by using a highly purified UTI fraction.
Furthermore, UTI band from several samples was subjected to trypsin digestion and structural characterization by Nano-LC-MS/MS analysis, allowing the identification of AMBP, which is a precursor proteolytically cleaved into the mature form of bikunin and α-1-microglobulin, with a high score and sequence coverage of 51%.
The method was applied to urine samples from 29 patients with type 1 diabetes, 22 patients with type 2 diabetes and 42 healthy controls, matched for age and sex with patients, evidencing higher UTI levels in both groups of patients (2.5 and 1.8 fold increase, respectively) with respect to controls (P < 0.0001 and P < 0.05, respectively).
Analysis on GAG portion showed that total CS levels are significantly higher in type 1 diabetes patients with respect to controls, being about 1.65 times greater (P = 0.037), whereas no significant differences occur between type 2 diabetes patients and controls or between the two groups of patients (P = 0.087 and P = 0.791 respectively).
Sulphation degree of CS chains was lower in both groups of patients with respect to controls (P = 0.002 and P = 0.018, respectively), as
percentages of ∆di-mono 4S / ∆di-mono 4S+∆di-non SCS were 37.7%,
42.0% and 56.1%, in type 1, type 2 diabetes patients and controls, respectively.
Furthermore, the length of CS chain was evaluated as ratio between the moles of disaccharides and the moles of UTI (UTI molecular weight of 15,974 Da, calculated by means of ExPASy Compute pI/Mw tool
(http://www.expasy.org) according to the sequence reported by Xu et al.
[61]). In this respect, no significant differences among the three classes of subjects considered were observed.
Besides allowing UTI identification with a high score and good sequence coverage, MS analysis indicated the presence of several sites prone to oxidative modifications. Interestingly, one of them (residues 107-121) may represent a potential marker of oxidation in both type 1 and type 2 diabetic patients. Preliminary results suggest that both UTI levels and structure could be modified, thus representing a useful marker of chronic inflammatory condition in type 1 and 2 diabetes. The effects of such quantitative and structural alterations on UTI localization, function and pathophysiological activities deserve further studies.
CHAPTER 2:
Proteomic analysis of plasma-purified
VLDL, LDL, and HDL fractions from atherosclerotic
patients
undergoing
carotid
endarterectomy:
identification of serum amyloid A as a potential marker
1. INTRODUCTION
1.1. ATHEROSCLEROSIS
Cardiovascular disease (CVD) can affect heart or blood vessels, leading to coronary artery disease (angina and heart attack), heart failure, congenital heart disease, stroke, heart valve disease and cardiomyopathy. The most common risk factors for CVD are hypertension and atherosclerosis, this latter representing the leading cause of morbidity and mortality in industrialized countries, being related with about 50% of all deaths [62-64]. It is a chronic inflammation characterized by the accumulation of lipids and fibrous elements in medium and large arteries [65]. Several epidemiological studies over the past 50 years evidenced that atherosclerosis is related with both genetic and environmental risk factors. Genetic risk factors are principally hypertension, diabetes, obesity, elevated plasma levels of Low Density Lipoproteins (LDL) and Very-low Density Lipoproteins (VLDL), reduced levels of High Density Lipoproteins (HDL) and high levels of Lipoprotein (a), while environmental risk factors are mainly a high-fat diet, smoking, low antioxidant levels, lack of exercise and infectious agents [65, 66]. Furthermore, studies on mouse models revealed that there are dozens of genetic loci able to influence lipoprotein levels, body fat and other risk factors, and it is thought that over 4000 genes are implicated in the
pathogenesis of atherosclerosis, making this pathology a very complex phenomenon [63, 67].
The most relevant clinical complications of atherosclerosis are ascribed either to altered blood flow or to acute arterial occlusion, due to the formation of a thrombus or blood clot, which may occur as a consequence of plaque erosion or rupture and may result in myocardial infarction or stroke [65, 66].
According to the thesis formulated by Williams and Tabs in 1995, “The retention hypothesis”, the selective retention of apolipoprotein B-100 containing lipoproteins by means of specific interactions with some extra cellular matrix components followed by oxidative modifications, represents the leading event in the development of atherosclerotic lesions [68].
Blood vessels sites that are more prone to develop an atheroma are regions of arterial branching or curvature, where flow is irregular and where endothelial cells are polygonal and with no particular orientation, contrary to tubular region where the blood flow is uniform and laminar and cells are ellipsoid and aligned with the flow [69].
LDL are entrapped into the extracellular matrix, where they are oxidized and become pro-inflammatory, triggering some significant consequences such as inhibition of nitric oxide (NO) production leading to vasodilation and subsequent diffusion of other LDL, that may result in the onset of an acute inflammatory state. Diabetic pathology may foster this inflammatory condition through the production of AGEs that interact with specific receptors on endothelial cells, resulting in decreased synthesis of NO and higher production and release of vasoconstrictor factors [70].
Consequently to oxidized-LDL stimulus, endothelial cells synthetize pro-inflammatory molecules, cellular adhesion complexes (VCAM-1,
ICAM-1, P- and E-selectins), growth factors (macrophage-colony stimulating factor or M-CSF), pro-inflammatory cytokines and chemokines. In response to the secretion of these molecules, circulating monocytes and lymphocytes are attracted by chemotaxis to the inflammation site. As soon as monocytes differentiate into macrophages, together with endothelial cells (EC), produce reactive oxygen species (ROS), the enzymes sphingomyelinase (SMase), secretory phospholipase 2 (sPLA2), myeloperoxidase (MPO) and other lipases that have an effect on oxidized LDL, which aggregate and become highly oxidized [65]. Aggregates of highly oxidized LDL are taken up by macrophages via scavenger receptor SR-A and CD36, whose expression is promoted by peroxisome proliferator-activated receptor-γ, a transcription factor whose ligands include oxidized fatty acids, or by cytokines such as tumour necrosis factor-α (TNF-α) and interferon-γ (IFN-γ). The accumulation of aggregates of highly oxidized LDL into the cytoplasm of macrophages leads to the formation of foam-cells [71], which cumulus in the sub-endothelial space forms the earliest recognizable lesion, the fatty streak
[72]. Cholesterol efflux promoted by macrophage-secreted
apolipoprotein E, may inhibit the transformation of macrophages into foam cells, as demonstrated by studies on apo E-null mice [73].
Cytokines as Monocyte Chemoattractant Protein-1 (MCP-1), Interleuchin-8 (IL-8) and Interferon-γ (IFN-γ) as well as growth factors, stimulate Smooth Muscle Cells (SMCs) proliferation and migration from the tunica media into the intima, where produce and stimulate the synthesis of new extracellular matrix to form a collagenous fibrous cap, as a response to the inflammatory condition [74].
Dead macrophages, foam cells, extracellular debris and lipids accumulate in the necrotic core site and are enclosed by the fibrous cap leading to the
formation of the atheroma, the typical lesion of atherosclerosis. In case of persistent inflammatory stimulus, the response processes may continue, leading either to narrowing arterial lumen or to plaque erosion or rupture and subsequently to acute thrombotic vascular events such as myocardial infarction and stroke. The imbalance between synthesis of new extracellular matrix and proteolytic processes may lead to a friable and prone-to-rupture thin fibrous cap, which outcome is usually the formation of a thrombus that may occlude the blood vessel persistently [74, 75].
1.2. LIPOPROTEINS
Lipoproteins are supramolecular complexes, consisting of a hydrophobic core composed by triacylglycerols and cholesteryl esters and an amphipathic monolayer of phospholipids, cholesterol and proteins referred to as apolipoproteins. The latter can be either structural or exchangeable among different lipoprotein classes. Apolipoproteins and lipids combine together, resulting in three main classes of lipoprotein particles of different density and size. Actually, lipoproteins can be classified according to their density, from the lowest to the highest density, in chylomicrons (CM), very low density lipoproteins (VLDL), low density lipoproteins (LDL) and high density lipoproteins (HDL) [76]. Besides the stabilization of lipoprotein complexes, apolipoproteins also regulate lipoprotein interactions with cellular receptors and are involved in inflammatory and immune processes as well as in lipid metabolism by modulating enzymes implicated in these metabolic pathways [77].
CM are the biggest and least dense lipoproteins (d < 0.95 g/ml; diameter > 100 nm); they are synthesized by intestine and are absent in fasting subjects. CM core is principally composed by triacylglycerols,
containing some cholesteryl esters and minor fat-soluble substances like vitamins and carotenoids, and is stabilized with a surface monolayer of amphipathic molecules such as phospholipids, unesterified cholesterol and proteins. Apo B-48 is the main apolipoprotein of CM, however, as soon as they are secreted from enterocytes into plasma, they interact with other molecules and acquire other apolipoproteins, especially apo C-II, apo C-III and apo E. CM main function is to carry lipids of exogenous origin in several districts, such as liver, adipose tissue and skeletal muscle, where they are metabolized [78]. Apo C-II included in CM promotes the interaction between circulating CM and the enzyme lipoprotein lipase (LPL) anchored to the luminal side of the endothelial cells of extra-hepatic capillaries. LPL function is to hydrolyse the triacylglycerol core of CM, so that released non-esterified fatty acids can be either used as energy source or taken up by adipocytes and stored as triglycerides [79]. Remaining components of the chylomicron surface then dissociate and are acquired by other lipoproteins. The resulting particle, called chylomicron remnant, is removed from plasma by liver uptake through the interaction between apo E and lipoprotein receptor-related protein (LRP) on the membrane of hepatocytes [78].
VLDL (d < 1.006 g/ml; 30 nm < diameter < 90 nm), triacylglycerol-rich lipoproteins, are the main neo-synthesized lipids transporters, from the liver to various tissues, mainly muscles and adipose tissues. In addition to triacylglycerols, VLDL contain free cholesterol and cholesterol esters. An additional class of lipoproteins, called intermediate density lipoprotein (IDL) (d = 1.006 – 1.019 g/ml), can be included between VLDL and LDL. IDL can be considered the resulting particles following VLDL disassembling [80] and their removal from the circulation is due to the interaction with LDL receptor (LDLR) located on hepatocytes. The remaining IDL portion is transformed into a LDL particle
consequently to a further reduction of the triacylglycerol component by hepatic lipase [81].
LDL particles (d = 1.019 – 1.063 g/ml; diameter ≈ 20 nm) are the end product of VLDL catabolism and represent the principal plasma carriers of cholesterol. Apo B-100 is the most abundant apolipoprotein in LDL, playing an important role in both lipoprotein structural stabilization and their removal from circulation [82]. Since LDL-receptor recognizes regions on apo B-100 as well as homologous regions on apo E, the receptor is also known as B/E receptor, and its mutations may cause impaired LDL uptake and subsequent elevation of their plasma levels, resulting in hypercholesterolemia [83]. Liver is the major site of plasma LDL uptake through B/E receptor, although LDL-receptor is expressed on the surface of most cells, as LDL represent the principal way to acquire cholesterol[76].
HDL, which are the smallest and the most dense lipoproteins (d = 1.063-1.21 g/ml; diameter 10 nm), are responsible for the reverse transport of cholesterol in excess from different tissues to the liver and steroidogenic tissues for metabolic needs and excretion. Apo A-I, which accounts for nearly 90% of total protein content, takes part in HDL maturation, a process that involves the secretion of lipid-poor particles and extracellular lipid acquisition, mainly cholesterol and phospholipids [84]. LDL and HDL are the main plasma carriers of cholesterol, as they provide its mobilization from and to the liver.
They play a key role in the development and in the progression of atherosclerotic lesions, as several studies reported that high levels of LDL and low levels of HDL strongly associate with the early events of atheroma development. More in detail, Apo B-100 is considered a strong predictor of cardiovascular risk, while Apo A-I is probably a protective factor [85].
Lipoprotein (a) (Lp(a)) is another class of lipoproteins, with densities ranging between 1.05 and 1.09 g/ml, which strongly associate with higher cardiovascular risk, although the molecular mechanisms are still largely undetermined [86]. In Lp(a) a single disulphide bond between a heavily glycosylated multi-kringle protein called apolipoprotein(a) and an Apo B-100 of an LDL particle occurs [87].
1.3. APOLIPOPROTEINS
The protein moiety of plasma lipoprotein consists of several apolipoproteins. Their main functions, besides supporting lipoprotein assembly and stabilizing their micellar structure, are the regulation of lipoprotein metabolism and the control of lipid transport and redistribution in various tissues. Moreover, lipoprotein particles maintenance and both recognition and interaction with cell surface lipoprotein receptors are determined by apolipoproteins [88].
The major apolipoproteins that constitute circulating lipoproteins can be classified either into exchangeable or non-exchangeable among different classes of lipoproteins. The non-exchangeable, called structural apolipoproteins, are mainly apo A-I and apo B-100, which account for nearly 90% of HDL and VLDL/LDL, respectively, while apo B-48 is the principal protein component of CM. Since their synthesis, these three apolipoproteins are assembled with lipids and they circulate bound to the same particle until they are removed from plasma. On the contrary, other apolipoproteins can move and exchange between lipoprotein particles and can bind other lipids in circulation [89].
2. AIM OF THE STUDY
Lipoproteins are known to be implicated in both development and progression of atherosclerotic lesions. In fact, high levels of LDL concurrent with low HDL levels are strongly associated with an increased risk of atheroma formation. Several studies indicate that the protein moiety of lipoproteins may play a key role in the early events of atherosclerosis, because of their interaction with specific extracellular matrix components of medium and large arteries. Therefore, the characterization of apolipoproteins obtained by plasma lipoproteins isolated from atherosclerotic patients may be helpful in elucidating their roles in atherogenesis and in detecting plasma biomarkers that may be used as diagnostic for atherosclerosis, and may indicate the presence and stability of atheroma. Additionally, the identification of new biomarkers could contribute significantly to improve the therapeutic approaches used for the treatment of lipoprotein-associated disorders.
The aim of this study was, hence, the characterization of apolipoprotein component of plasma lipoproteins isolated from patients undergoing carotid endarterectomy and the identification of differentially expressed apolipoproteins between patients and controls. To reach this objective, we analysed apolipoproteins from VLDL, LDL and HDL by means of two-dimensional electrophoresis (2-DE).
3. MATERIALS AND METHODS 3.1. SAMPLE COLLECTION
Plasma samples from both atherosclerotic patients and healthy controls were analysed for the characterization of apolipoproteins profiles in VLDL, LDL and HDL classes.
Fasting blood samples were collected from 79 patients undergoing carotid endarterectomy and 57 healthy normolipemic controls in EDTA-containing Vacutainer tubes and centrifuged at 2,000 x g for 10 minutes; obtained plasma was stored at -80 °C until analysis. Analyses were performed following random combination of equal amounts of plasma samples, leading to 4 homogeneous pools from patients and 4 from controls.
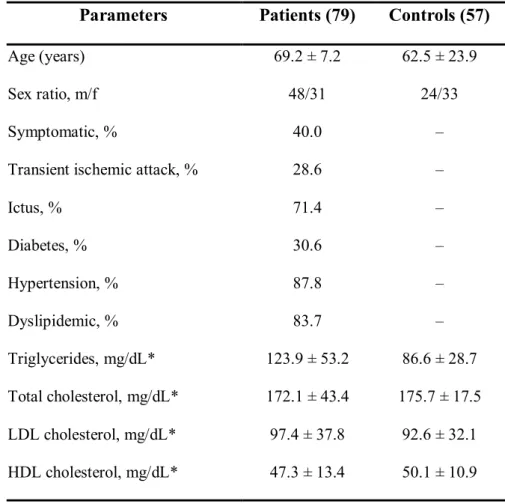
All patients included in this study presented either a stenosis grade higher than 70% or a medium grade ulcerated lesion, as evidenced by echo-Doppler analysis, and were under pharmacological treatment for hypertension, dyslipidemia and/or diabetes. The main clinical parameters of both patients and controls are reported in Table 4.
Table 4: Clinical characteristics and lipid levels of patients and controls
Parameters Patients (79) Controls (57)
Age (years) 69.2 ± 7.2 62.5 ± 23.9
Sex ratio, m/f 48/31 24/33
Symptomatic, % 40.0 –
Transient ischemic attack, % 28.6 –
Ictus, % 71.4 – Diabetes, % 30.6 – Hypertension, % 87.8 – Dyslipidemic, % 83.7 – Triglycerides, mg/dL* 123.9 ± 53.2 86.6 ± 28.7 Total cholesterol, mg/dL* 172.1 ± 43.4 175.7 ± 17.5 LDL cholesterol, mg/dL* 97.4 ± 37.8 92.6 ± 32.1 HDL cholesterol, mg/dL* 47.3 ± 13.4 50.1 ± 10.9 *Values are mean ± SD
3.2. LIPOPROTEIN PURIFICATION
Lipoproteins were purified by isopycnic ultracentrifugation according to the methods described by Himber et al. [90] and McDowell et al. [91] , with slight modifications. Briefly, 3.9 mL of pooled plasma samples were added with 472.2 mg NaBr to d = 1.3 g/mL, put in centrifuge tubes (Beckman Coulter, Thin Wall Ultra-Clear, 14 mL, 14 x 95 mm) and overlaid with 8.1 mL of a 0.6% NaCl solution (d = 1.006 g/mL). The ultracentrifugation was carried out at 285,000 x g for 48 hours at 4 °C in an Optima L90 series ultracentrifuge equipped with a SW40 Ti rotor (Beckman Coulter). To avoid contamination, obtained lipoprotein fractions were further purified by a second ultracentrifugation step,
consisting of floating VLDL, LDL and HDL fractions in saline solutions at density 1.006, 1.063 and 1.21 g/mL respectively, under the same conditions as described above, for 24 hours.
Following lipoprotein fractions recovery, desalting (final salt concentration < 5 mM) and concentration procedures were performed by means of Amicon Ultra-0.5 Centrifugal Filter Unit (10 KDa Molecular Weight Cut-Off, Millipore). Protein concentration was determined using DC Protein Assay Kit (Bio-Rad laboratories), according to the manufacturer’s instructions, using BSA as a standard.
Aliquots of 500 μg (as protein) of LDL and 300 μg (as protein) of VLDL
were delipidated by adding ice-cold
tri-n-butylphosphate:acetone:methanol (1:12:1), as reported by Mastro and Hall [92]. Precipitates were then subjected to repeated boiling and sonication passages in a buffer containing 10 mM TRIS, 4% CHAPS w/v, 1% DTT w/v, cooled to room temperature, and added with a solution containing 8M UREA, 4% CHAPS w/v, 1% DTT w/v, 0.4% carrier ampholytes v/v. 50 μg of non-delipidated HDL were treated as LDL and VLDL precipitates. After complete solubilisation, two-dimensional electrophoresis analysis was carried out.
3.3. 2-DE ANALYSIS
Two-dimensional electrophoresis allows resolving proteins according to their isoelectric point (1st dimension) and, orthogonally, to their molecular weight (2nd dimension).
Samples were applied to 70 mm IPG strips (pH 4–7, Bio-Rad laboratories), by overnight rehydration loading at 20°C, and, subsequently, isoelectrofocused at 50 μA/IPG strip for 22 kVh at 20°C. After focusing, proteins were in-gel reduced by incubating IPG strips with a 50 mM Tris buffer containing 6 M Urea, 30% glycerol v/v, 3%
SDS w/v, and 1% DTT w/v, followed by in-gel alkylation with the same solution containing 2.5% iodoacetamide w/v, in place of DTT, under continuous shaking for 15 minutes, prior to the second dimension. IPG strips were then sealed with 0.5% low melting point agarose w/v, in SDS running buffer, at the top of second dimension gels (8 cm x 7 cm x 0.1 cm). SDS–PAGE was carried out, using 15% T, 3% C polyacrylamide gels, at 50V for 15 minutes and subsequently at 150V for about 90 minutes.
Gels were fixed in 30% ethanol v/v, 2% phosphoric acid v/v for 1hour, washed twice in 2% phosphoric acid v/v for 10 minutes, and then equilibrated in 18% ethanol v/v, 2% phosphoric acid v/v, 15% ammonium sulphate w/v for 30 minutes. The staining solution, containing 2% CBB G-250 (w/v), was then added to the same solution (final CBB concentration 0.02%). After 48 hours, gels were acquired by means of GS-800 calibrated densitometer (Bio-Rad laboratories) at 36.3 µm resolution, and then analysed using PD-Quest 2-D analysis software, v 8.0.1 (Bio-Rad laboratories). Each spot was assigned a relative value corresponding to the single spot volume compared to the volume of all spots in gel, following background subtraction and normalization between gels. More in detail, in the normalization method adopted, the raw quantity of each spot in a member gel was divided by the total quantity of all spots in the gels included in the Master.
3.4. IN-GEL DIGESTION AND MALDI-TOF MS ANALYSIS
Spots of interest were excised from gels, minced and destained with a solution containing 2.5 mM NH4HCO3, 50% ACN (v/v) at 60 °C for 2
hours, changing destaining solution three times. Gel fragments were dehydrated with pure ACN for 15 minutes, dried at room temperature
and then swollen with 5 mM NH4HCO3 solution, containing 10 ng/μl of
trypsin, for 30 minutes on ice. Tryptic digestion was conducted overnight at 37°C. The resulting peptides were mixed with an equal volume of α-cyano-4-hydroxycinnamic acid saturated solution (40% acetonitrile (v/v), 0.1% trifluoroacetic acid (v/v)) and applied as a microcrystalline thin film onto a 96-spot MALDI target. Mass analyses were performed using a MALDI micro MX-Mass Spectrometer (Waters) according to the tuning procedures suggested by the manufacturer. Peak lists were generated using Protein Lynx Global Server v 2.2.5 (Waters) and searched against the Swiss-Prot human database (version 57.4) using Mascot (http://www.matrixscience.com). Research parameters included taxa (Homo sapiens), trypsin digestion, monoisotopic peptide masses, iodoacetamide modifications, one missed cleavage by trypsin, and a mass deviation of 50 ppm. Only protein identifications with significant Mascot scores (P < 0.05) were taken into consideration.
3.5. WESTERN BLOTTING ANALYSIS
Western blotting analyses on proteins resolved by SDS-PAGE were performed to compare the expression of exchangeable apolipoproteins between patients and controls. Following mono- or bi-dimensional electrophoresis, protein spots were electroblotted at 350 mA for 1 hour and 30 minutes onto PVDF membranes (GE Healthcare, UK). Then, membranes were incubated under continuous shaking with blocking solution (PBS-Tween-20 (0.1% Tween-20 in PBS) containing 3% non-fat dry milk) for 1 hour at room temperature and then with the primary antibodies, diluted in the same blocking buffer, overnight at 4 °C. The primary antibodies used were the following: goat polyclonal anti-apo AI antibody (Millipore, AB740) diluted 1 : 8000, and mouse monoclonal
anti-SAA antibody (Abcam, Ab81483) diluted 1 : 1000 with blocking solution.
After 30 minutes washing (PBS, 0.1% Tween-20), membranes were incubated for 1 hour at room temperature with (horseradish peroxidase) HRP-conjugated secondary antibodies diluted 1:5000 in blocking buffer solution (goat anti-mouse-HRP conjugate, Bio-Rad laboratories; rabbit anti-goat-HRP conjugate, Millipore). Following further membrane washing with PBS, 0.1% Tween-20 solution, proteins were revealed by enhanced chemiluminescence using Amersham ECL Prime Western Blotting Detection Reagent (GE Healthcare), by means of ChemiDoc XRS System (Bio-Rad laboratories). Densitometric analysis was performed using Quantity One 4.6.3 software (Bio-Rad laboratories).
3.6. STATISTICAL ANALYSIS
The comparison of exchangeable apolipoproteins expression in each purified lipoprotein fraction among atherosclerotic patients and healthy controls was performed by Student’s t-test for unpaired samples. The software package Sigma Stat 3 (Systat Software) was used for statistical analysis and significance was set at P < 0.05.
4. RESULTS
2-DE coupled with MS was applied to plasma VLDL, LDL and HDL apolipoproteins obtained from both patients undergoing carotid endarterectomy and healthy normolipemic subjects. Patients included in the present study were selected for surgery having either a high-grade stenosis (> 70%) or an ulcerated lesion, as diagnosed by means of echo-Doppler analysis.
As apo B-100 accounts for about 95% of the total protein moiety of VLDL and LDL, large amounts of these lipoproteins were processed in order to allow the detection and identification of less abundant apolipoproteins. Furthermore, due to the high lipid/protein ratio in both VLDL and LDL, a delipidation step was mandatory.
Through the adopted fractionation procedure, consisting in an isopycnic gradient ultracentrifugation followed by an additional washing step, we were able to obtain highly purified lipoprotein fractions. No albumin or other plasma proteins were in fact detected in CBB G-250 stained 2-DE gels. Moreover, western blotting analysis on HDL fraction did not reveal any apo B-100 contamination.
By means of this approach combined with peptide mass fingerprinting, we were able to identify 2 isoforms of apo J, 2 isoforms of apo A-IV, 5 isoforms of apo E, 6 isoforms of apo A-I, 3 isoforms of apo D, 2 isoforms of acute phase serum amyloid A protein (AP-SAA), 1 isoform of apo C-II and 2 isoforms of apo C-III, in both VLDL and LDL fractions. Apo B-100 was not detectable in any VLDL or LDL 2-DE maps because of its high molecular weight and hydrophobicity.
3 isoforms of apo E, 6 of apo A-I, 3 of apo D, 2 of AP-SAA, 1 of apo C-II, and 2 of apo C-III were identified in HDL fraction