Journal of Physics: Conference Series
PAPER • OPEN ACCESS
K-means clustering approach for damage evolution monitoring in RCF
tests
To cite this article: M. Bini Chiesa et al 2018 J. Phys.: Conf. Ser. 1065 102018
View the article online for updates and enhancements.
XXII World Congress of the International Measurement Confederation (IMEKO 2018) IOP Conf. Series: Journal of Physics: Conf. Series 1065 (2018) 102018
IOP Publishing doi:10.1088/1742-6596/1065/10/102018
K-means clustering approach for damage evolution
monitoring in RCF tests
M. Bini Chiesa1, I. Bodini1, C. Petrogalli1, L. Provezza1, M. Faccoli1, A. Mazzù1,
L. Solazzi1, G. Sansoni1, M. Lancini1
1Department of Mechanical and Industrial Engineering,
University of Brescia, Italy E-mail: [email protected]
Abstract. A machine learning technique was used to monitor the state of damage of steel
specimens subjected to cyclic contact fatigue tests and to make a continuous measurement without coming into contact with the specimens examined. Six different sets of specimens were considered and the torque and vibration data obtained from their respective tests were analyzed. Different statistical and spectral characteristics were obtained from each dataset, to represent their information content. The correlation existing between the characteristics was studied to select only the essential ones. The global data volume was reduced by a principal component analysis. The data thus obtained were subsequently processed, and classified, developing a K-means algorithm. The results were formulated in probabilistic terms with the aid of membership charts, confusion matrices and probability curves. The results obtained from this first analysis are highly encouraging. The algorithm is able to assess the damage status of the specimens, as well as detect the operating conditions of the machine. A substantial advantage of this method is the ability to estimate quantitatively the damage by calculating the distance of the current data from specific references. The performances of this approach were numerically estimated in terms of sensitivity, specificity and accuracy.
1. Introduction
This study is intended as a contribution to the tools and technologies available to study and to model the wear and fatigue damage, involved in wheel-rail contact. It has been shown that at least 10% of derailments over the years are caused by problems related to the rolling contact fatigue (RCF) phenomenon. According to Eurostat, only in the European Union in 2014, more than 2200 accidents were recorded [1], a great part of which are caused by damage to railway components. Persons affected by such disasters, persons on trial, costs of maintenance, train set up and train paths replacement costs are just a few consequences of this problem. For this reason, from both a safety and an economic point of view, it is crucial to know and prevent damage mechanism.
Using a twin-disk test bench it is possible to test wheel and rail steel specimens, simulating the real operating conditions of wheels and rails, with controlled operating conditions: rotation speed, slip ratio and load [2]. Accurate modelling of the components has been studied: some studies have focused on the mechanical and metallurgical characterization of different steels for wheels and rails, to identify the types of damage to which they are subjected [3, 4]; while other researches have focused on the development of analytical models [5-8].
XXII World Congress of the International Measurement Confederation (IMEKO 2018) IOP Conf. Series: Journal of Physics: Conf. Series 1065 (2018) 102018
IOP Publishing doi:10.1088/1742-6596/1065/10/102018
2
A typical test procedure [5] is to stop the machine at various numbers of predefined cycles, remove the samples from the test bench, clean them in an ultrasonic alcohol bath, perform the weighing and the Barkhausen noise measurement and acquire the surface state with a dedicated vision system [9]; then resume the test on the test bench. Destructive measurements are performed at the end of the test, to identify the damage evolution and measure the cracks, where present.
The objective of the proposed study is to quantitatively estimate the damage status of the specimens using a continuous contact measurement system. This activity is based on the use of a non-supervised Machine Learning technique [10-14], called K-means clustering, applied to different vibration and torque datasets. Similar techniques have already been used to identify possible variations in the frequency responses of a particular mechanical model of the samples [15], but that approach required extensive post-processing of all tests data and operator-based manual tuning, while the proposed method is fully automated.
2. Analysis method
Six different sets of railway-wheel samples supplied by Lucchini RS were analysed to determine the robustness of the method. All these test specimens, obtained directly from the real components produced in the steelworks, were tested on the twin-disk test bench of the University of Brescia. Table 1 describes the considered specimens. The rolling contact tests were carried out under the same maximum contact pressure (P = 1100 MPa), rolling speed (500 r.p.m.) and sliding/rolling ratio (s = 1%). The test duration was 130,000 cycles. During the test the discs were periodically dismounted (10,000, 20,000, 50,000 and 70,000 cycles), ultrasonically cleaned and weighed to evaluate their weight loss.
Table 1. Considered specimens
Test number Rail-specimen material Wheel-specimen material
1 350HT ER8 2 350HT ER8 3 350HT SANDLOS® S 4 350HT SANDLOS® S 5 350HT CLASS C 6 350HT SANDLOS® H 2.1 Data preparation
The analogue signals of the torque and vibration of the spindles are acquired at a frequency of 5 kHz. Acquired data are recorded in packets of 0.2 s called records and each record will therefore consist of 1000 samples per channel. Packages of 1000 records form, in turn, a binary file that is saved continuously from start to end of test. The six sets of binary files from the six tests are the starting point for the data processing process.
The second step in the preparation of the data is the features extraction. A feature is a numerical or descriptive parameter that represents the phenomenon under consideration, making it measurable and comparable in a synthetic way. For all three signals (two vibration signals and one torque) acquired in each record, a number of features have been extracted in order to obtain a detailed representation of the phenomenon every 0.2 s. The features extracted can be classified to differentiate the statistic ones from the spectral ones; another distinction can be made between the single and combined features: the first category includes all the features that are extracted from a single signal, while the second one includes the features that are extracted from multiple combined signals. The features extracted are: mean, standard deviation, variance, RMS, percentiles, centroid of the Power Spectrum Density, the maximum value of the cross-correlation and its time delay, the centroid of the Frequency Response Function and frequency quartiles.
XXII World Congress of the International Measurement Confederation (IMEKO 2018) IOP Conf. Series: Journal of Physics: Conf. Series 1065 (2018) 102018
IOP Publishing doi:10.1088/1742-6596/1065/10/102018
A criterion was used to consider only the essential features: for each pair of features the coefficient of determination R2 has been calculated. It measures the variable's fraction of variance as explained by
the linear regression model. After this operation the number of features reduces to 44.
As a subsequent step, the features have been normalized with Z-Score method, to compare different features with different units of measurement: every feature has been normalized by subtracting the average of its values and dividing by the standard deviation of the same. Then the number of features has been significantly reduced through a Principal Component Analysis (PCA). Only the first PCs, that are able to describe at least 90% of the variance explained, are kept. Then the dataset described in the PCs space is processed by the K-means algorithm.
2.2 Data elaboration
Figure 1. Example of the algorithm results: state guess during test #4
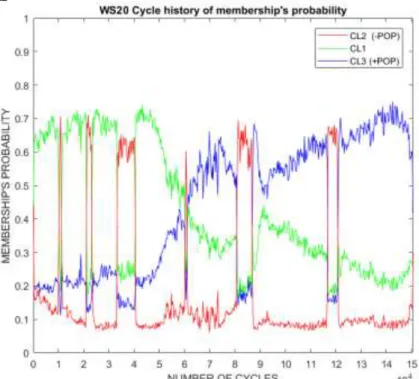
Figure 2 shows the probabilistic results deriving from the elaboration of a dataset carried out with K-means: for each cycle, the probability of belonging to a particular cluster was calculated; the CL1 cluster is the most populated and dominates the initial phase of the 0-40 kcycles test; after this point the probability of CL1 decreases and the probability of CL3 increases, the point of intersection between the two curves is at 60 kcycles. The least populated cluster, the CL2, is the one that identifies the intervals of downtime at 10k, 20k, 33k, 60k, 80k, 116k and 150k cycles.
2.3 Algorithm cross-validation
To demonstrate that the developed method is reliable during the clustering elaboration, a K-fold cross-validation was used. The datasets of two tests were divided in five parts and each part was used as ground-truth to validate the other parts. The fold used as groundtruth is the part used for the training and the other parts are used for the validation. The results of this cross-validation are positive, with values of sensitivity, specificity and accuracy in a range of 98% - 100%.
To demonstrate that the developed method is robust and not subjected to overfitting, an exhaustive cross-validation was used, taking into account all the tests under examination. In this cross-validation each test was used validated against each other, using as ground-truth the dataset used to train the system, obtaining the results shown in Table 2. The reliability of the algorithm in classifying states
XXII World Congress of the International Measurement Confederation (IMEKO 2018) IOP Conf. Series: Journal of Physics: Conf. Series 1065 (2018) 102018
IOP Publishing doi:10.1088/1742-6596/1065/10/102018
4
based on extracted features is good, in terms of sensitivity (min.19% - max.100%), specificity (min.25% – max.99%) and accuracy (min.59% – max.98%).
Table 2. Exhaustive cross-validation results
Status Pristine / undamaged Bench halted Damaged
Specimen 1 2 3 4 5 6 1 2 3 4 5 6 1 2 3 4 5 6
Sensitivity [%] 19 55 25 53 61 79 36 72 97 69 85 54 100 99 90 98 85 95 Specificity [%] 99 98 98 96 87 93 99 99 94 99 98 98 25 62 49 62 65 83
Accuracy [%] 64 83 85 80 76 86 92 97 94 94 98 97 59 83 79 80 76 88
3. Conclusions
The basic approach used for data processing is a partition clustering method called K-means algorithm. This method, applied to the tests performed, leads to several advantages:
- The possibility to make a continuous measurement, without any contact with the examined specimen, without intermediate stops and without destroying the sample for testing.
- The ability to quantitatively estimate damage by calculating the current data distance relative to specific references, called cluster-centers, even if this quantity has yet to be correlated with the traditional damage state used for RCF studies (wear, cracks…).
- The ability to carry out a quick analysis of how the single test is performing in real time
- The ability to automatically detect the test bench working conditions, and to detect abnormalities, asymmetries or data structures that a traditional test could miss.
This work lays the ground for a more detailed study on the application of machine learning techniques in material characterization tests. The correlation of the presented results with traditional damage progression assessment (wear, cracks etc..) is not yet proven, although validation tests are currently under evaluation and preliminary results are positive.
References
[1] Eurostat, 2018, Annual number of accidents by type of accident, http://ec.europa.eu/eurostat [2] W J Wang, R Lewis, B Yang, L C Guo, Q Y Liu M H Zhu, 2016, Wear, 322-323, 146
[3] A Mazzù, C Petrogalli, M Lancini, A Ghidini, M Faccoli, 2018, J. Mater. Eng. Perform., 27, 630 [4] I Bodini, et al 2018, Wear, 400–401, 156
[5] A Mazzù, L Solazzi, M Lancini, C Petrogalli, A Ghidini, M Faccoli, 2015, Wear, 342–343, 22 [6] G Donzella, A Mazzù, C Petrogalli, 2015, Procedia Eng., 109, 181
[7] G Donzella, M Faccoli, A Mazzù, C Petrogalli, R Roberti, 2011, Wear, 271(1–2), 408 [8] G Donzella, M Faccoli, A Ghidini, A Mazzù, R. Roberti, 2005, Eng. Fract. Mech., 72(2), 287 [9] I Bodini, G Sansoni, M Lancini, S Pasinetti, F Docchio, 2016, Rev. Sci. Instrum., 400-401, 156 [10] P Alencar, D Cowan, 2018, Expert Syst. Appl., 97, 205
[11] A K Jain, R P W Duin, J Mao, 2000, IEEE Trans. Pattern Anal. Mach. Intell., 22(1), 4 [12] A K Jain, M N Murty, P J Flynn, 1999, ACM Comput. Surv., 31(3), 264
[13] T Kanungo et al. , 2002, IEEE Trans. Pattern Anal. Mach. Intell., 24(7), 881 [14] C Boutsidis, M Magdon-ismail, 2013, IEEE Trans. Inf. Theory, 59(9), 6099