Muscle expression of SOD1G93A triggers the dismantlement of neuromuscular junction via PKC-theta.
Gabriella Dobrowolny1,2,#, Martina Martini1,2,#, Bianca Maria Scicchitano3, Vanina Romanello4, Simona Boncompagni5, Carmine Nicoletti6, Laura Pietrangelo5, Simone De Panfilis2, Angela Catizone6, Marina Bouchè6, Marco Sandri4, Rüdiger Rudolf7,8,9, Feliciano Protasi5, Antonio Musarò1,2,*
1
Center for Life Nano Science at Sapienza, Istituto Italiano di Tecnologia, Rome, Italy; 00161;
2
DAHFMO-Unit of Histology and Medical Embryology, Sapienza University of Rome, Laboratory affiliated to Istituto Pasteur Italia – Fondazione Cenci Bolognetti, Italy; 00161 3
Institute of Histology and Embryology, School of Medicine, Catholic University of the Sacred Heart, Rome, Italy; 00168
4
Department of Biomedical Science University of Padova, Italy;35121. 5
CeSI-Met - Center for Research on Ageing and Translational Medicine & DNICS - Dept. of Neuroscience, Imaging and Clinical Sciences; University G. d' Annunzio of Chieti, Italy,66100.
6
DAHFMO-Unit of Histology and Medical Embryology, Sapienza University of Rome, Rome, Italy, 00161
7
Institute of Toxicology and Genetics, Karlsruhe Institute of Technology, Eggenstein-Leopoldshafen, Germany, 76344.
8
Institute of Molecular and Cell Biology, Mannheim University of Applied Sciences, Mannheim, Germany, D-68163. 5 6 7 8 9 10 11 12 13 14 15 16 17 18 19 20 21 22 23 24 25 26 27 28 29 30 31 32 33 34 35 36 37 38 39 40 41 42 43 44 45 46 47 48 49 50 51 52 53 54 55 56
D-69120.
Running head: PKCθθθθ impinges NMJ stability in MLC/SOD1G93A mice
#equal contribution
*Correspondence: Antonio Musarò DAHFMO-Unit of Histology and Medical Embryology, Sapienza University of Rome , Via Scarpa 16 00161 Roma. Telephone: +390649766956. Fax number +39064462854. E-mail: [email protected]
Keywords: NMJ, PKC, ALS, aging, oxidative damage, mitochondrial defects.
Word count: 4966. Reference number: 53. Color illustration: 4. Greyscale illustration: 1
5 6 7 8 9 10 11 12 13 14 15 16 17 18 19 20 21 22 23 24 25 26 27 28 29 30 31 32 33 34 35 36 37 38 39 40 41 42 43 44 45 46 47 48 49 50 51 52 53 54 55 56 57
Aim
Neuromuscular junction (NMJ) represents the morpho-functional interface between muscle and nerve. Several chronic pathologies such as aging and neurodegenerative diseases, including muscular dystrophy and Amyotrophic Lateral Sclerosis (ALS), display altered NMJ and functional denervation. However, the triggers and the molecular mechanisms underlying the dismantlement of NMJ remain unclear.
Results
Here we provide evidence that perturbation in redox signaling cascades, induced by muscle-specific accumulation of mutant SOD1G93A in transgenic MLC/SOD1G93A mice, is causally linked to morphological alterations of the neuromuscular presynaptic terminals, high turnover rate of Acetylcholine Receptor (AChR), and NMJ dismantlement. The analysis of potential molecular mechanisms that mediate the toxic activity of SOD1G93A revealed a causal link between Protein Kinase Cθ (PKCθ) activation and NMJ disintegration.
Innovation
The study discloses the molecular mechanism that triggers functional denervation associated with the toxic activity of muscle SOD1G93A expression and suggests the possibility of developing a new strategy to counteract age- and pathology-associated denervation based on pharmacological inhibition of PKCθ activity.
Conclusions
Collectively, these data indicate that muscle specific accumulation of oxidative damage can affect neuromuscular communication and inducing NMJ dismantlement through a PKCθ-dependent mechanism. 5 6 7 8 9 10 11 12 13 14 15 16 17 18 19 20 21 22 23 24 25 26 27 28 29 30 31 32 33 34 35 36 37 38 39 40 41 42 43 44 45 46 47 48 49 50 51 52 53 54 55 56
The neuromuscular system is functionally organized into the motor units, each consisting of a lower motor neuron and all the muscle fibers that it exclusively innervates. Nerve activity is important not only for muscle contraction but it also plays critical role in generating fiber type diversity (6, 22). Thus, in the absence of functional innervation skeletal muscle loses its plasticity, which is also associated with reduced muscle size and strength (sarcopenia). On the other hand, development in the absence of skeletal muscle results in the sequential ablation of motor neurons from the spinal cord to the brain (15), suggesting that nervous development is intimately coupled to skeletal myogenesis. Adult muscle fibers are also a source of signals that influence neuron survival, axonal growth and maintenance of synaptic connections. In this context, the neuromuscular junctions (NMJ) represent the morpho-functional bridge that guarantee this important interplay between nerve and muscle. Aging-sarcopenia and several neuromuscular diseases, including Amyotrophic Lateral Sclerosis (ALS), are characterized by alteration in the functional connection between nerve and muscle, creating a sort of short-circuit that impinges the proper function between the two systems.
Current pathophysiologic hypotheses in muscle aging-sarcopenia and ALS include increased oxidative stress. Normal levels of Reactive Oxygen Species (ROS) play a crucial role in a variety of cellular processes (32). To keep ROS at physiological levels, cells have evolved sophisticated scavenging machineries. Among these, the antioxidant enzyme Superoxide Dismutase 1 (SOD1) is dedicated to cell scavenging from anion superoxide. Thus, ablation or mutation in the SOD1 gene induces chronic oxidative stress, accelerating age-associated muscle atrophy (14), or promoting motor neuron degeneration, muscle atrophy, and alteration in muscle homeostasis (7, 28, 31). 5 6 7 8 9 10 11 12 13 14 15 16 17 18 19 20 21 22 23 24 25 26 27 28 29 30 31 32 33 34 35 36 37 38 39 40 41 42 43 44 45 46 47 48 49 50 51 52 53 54 55 56 57
of skeletal muscle fibers and that axon and synapses are cellular sites of degeneration in ALS disease, controversy exists on whether pathological events initially beginning at the skeletal muscle may contribute to loss of NMJ and motor neuron degeneration in a sort of a dying back phenomenon (6, 22, 35). Moreover, the precise molecular mechanisms of age-pathology-associated deterioration in the neuromuscular system have remained elusive. It was previously reported that muscle specific expression of mutant SOD1 gene (MLC/SOD1G93A) induces muscle atrophy, significant reduction in muscle strength, mitochondrial dysfunction, microgliosis (7) and neuron degeneration (50), suggesting that retrograde signals from muscle to nerve may contribute to synapse and axon damage. However, the molecular mechanisms by which a primary defect in skeletal muscle has an impact on NMJ complexity and maintenance remain unknown.
We found that muscle expression of toxic SOD1G93A gene induces the re-activation of PKCθ, a member of the protein kinase C family developmentally regulated (11, 12), which plays an important role in NMJ formation and elimination during the first 2–3 weeks postnatal period (18).
The causal link between PKCθ activation and functional denervation in adult MLC/SOD1G93A mice was demonstrated by pharmacological inhibition of PKCθ, which was sufficient to reduce PKCθ - AChR co-localization, to restore mitochondrial functionality, to rescue the morphological complexity of NMJ, and to stabilize AChR turnover.
These results indicate that primary muscle defects, induced by localized expression of SOD1G93A, impact the functional connection between muscle and nerve at the level of NMJ and that up-regulation of PKCθ is causally linked to NMJ dismantlement. This might represent an early pathogenic signature of sarcopenia and neuromuscular diseases.
5 6 7 8 9 10 11 12 13 14 15 16 17 18 19 20 21 22 23 24 25 26 27 28 29 30 31 32 33 34 35 36 37 38 39 40 41 42 43 44 45 46 47 48 49 50 51 52 53 54 55 56
Muscle-specific expression of SOD1G93A induces mitochondrial alterations.
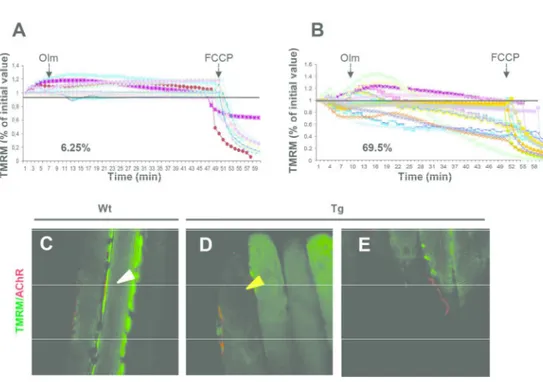
Muscle expression of SOD1G93A was associated with elevated levels, in the sarcolemma of transgenic fibers, of Malondialdehyde (MDA), a marker of lipid oxidative damage, and with altered activity of antioxidant pathway (7). Moreover, one of the severe pathologic features associated with muscle expression of mutant toxic SOD1 protein was the alteration in distribution and morphology of mitochondria, which displayed abnormal shape, localization, size, and disorganized internal cristae in the muscle of MLC/SOD1G93A mice compared to wild type littermates (7). To address whether the observed modifications of mitochondrial morphology impinge the activity of these organelles, we evaluated the capability of both wild type and MLC/SOD1G93A muscle to maintain a normal mitochondrial membrane potential (∆Ψm). We used the TMRM probe, a voltage-sensitive fluorescent indicator, for the evaluation of mitochondrial transmembrane potential in isolated adult fibers of wild type and MLC/SOD1G93A muscles. We found a significant reduced stability of ∆Ψm in mitochondria of MLC/SOD1G93A muscles (Fig. 1B) compared to that of wild type mice (Fig. 1A). Notably, in vivo imaging revealed reduced integrity, compared to wild type littermates, of mitochondrial network and membrane potential in the region of the NMJ (Fig. 1C-E), suggesting that mitochondrial alterations negatively impact on NMJ stability.
MLC/SOD1G93A transgene affects the complexity of AChR clustering and stability in NMJ.
Histological examination revealed marked alterations in the NMJ of MLC/SOD1G93A mice, compared to NMJ of age-matched wild type mice. In particular, while wild type endplates displayed the classical pretzel-like shape, MLC/SOD1G93A endplates were dispersed and 5 6 7 8 9 10 11 12 13 14 15 16 17 18 19 20 21 22 23 24 25 26 27 28 29 30 31 32 33 34 35 36 37 38 39 40 41 42 43 44 45 46 47 48 49 50 51 52 53 54 55 56 57
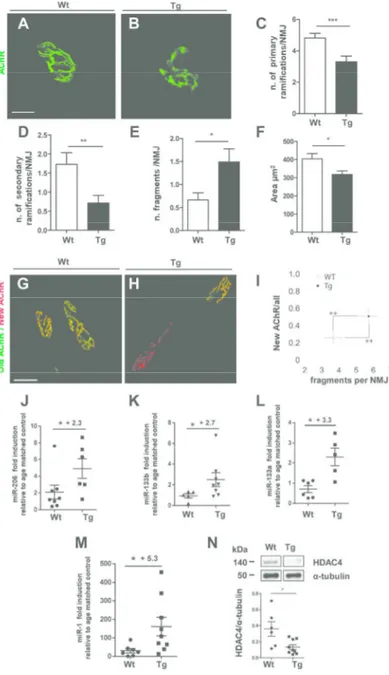
projections of NMJ revealed that the postsynaptic primary gutters in MLC/SOD1G93A were less ramified with significant reduction of the number of primary and secondary ramifications as compared to wild type muscles (Fig. 2C,D). This resulted in more fragmented (Fig. 2E) and smaller NMJ (Fig. 2F) compared to wild type muscle.
To address possible causes underlying the alterations in NMJ morphology in MLC/SOD1G93A mice, we performed a pulse chase experiment to gain insight into the turnover of AChR. Two pools of AChR were labeled at different time points with the AChR marker, α-bungarotoxin (BGT). Pools one and two of AChRs were marked with infrared fluorescent (BGT-AF647) and red fluorescent (BGT-AF555) BGT, respectively, at a temporal distance of ten days. Subsequently, the ratio of BGT-AF555 label to the total BGT label was determined by in vivo imaging as previously described (36). In the course of these experiments morphometric analysis was also performed: Figure 2 clearly shows a higher turnover and fragmentation of AChR in MLC/SOD1G93A muscles, compared to that of wild type littermates (Fig. 2G-I). A key regulator of the bidirectional signaling between motor neurons and skeletal muscle fibers at neuromuscular synapses is miR-206, a skeletal muscle–specific microRNA that is dramatically induced in a mouse model of ALS and in denervated muscle, and functions to promote maintenance and repair of the NMJ (45, 48). Real time PCR analysis revealed a significant up-regulation of miR-206 in the MLC/SOD1G93A skeletal muscle compared to wild type littermates (Fig. 2J). We also evaluated the expression of other relevant muscle-specific miRNAs, such as miR-133b, miR-133a and miR-1. MiR-133b, generated from a bicistronic transcript that also encodes miR-206 and concentrated near NMJ, miR-133a and miR-1 were up-regulated in MLC/SOD1G93A muscle compared to wild type littermates (Fig. 2K-M). In contrast, other miRNAs such as miR-222, miR-223, miR-16, involved in muscle 5 6 7 8 9 10 11 12 13 14 15 16 17 18 19 20 21 22 23 24 25 26 27 28 29 30 31 32 33 34 35 36 37 38 39 40 41 42 43 44 45 46 47 48 49 50 51 52 53 54 55 56
show any significant modulation in the muscle of MLC/SOD1G93A mice compared to that of wild type littermates (data not shown), supporting previous study demonstrating that localized expression of SOD1G93A induces muscle atrophy without any sign of muscle inflammation and/or fibrosis (7).
Histone deacetylase 4 (HDAC4) mRNA is one of the strongest targets of miR-206 (3, 19) and of miR-1 in vitro (3). HDAC4 has been also implicated in the control of neuromuscular gene expression and is a key signaling component that relays neural activity to the muscle transcriptional machinery (4, 44).
HDAC4 protein expression was reduced in skeletal muscle of MLC/SOD1G93A mice as compared with that of wild type littermates (Fig. 2N and Supplementary Fig. S1). These findings suggest that muscle expression of SOD1G93A induces NMJ instability and activates a defective circuit that is not able to maintain/restore the appropriate muscle-nerve functional interplay. 5 6 7 8 9 10 11 12 13 14 15 16 17 18 19 20 21 22 23 24 25 26 27 28 29 30 31 32 33 34 35 36 37 38 39 40 41 42 43 44 45 46 47 48 49 50 51 52 53 54 55 56 57
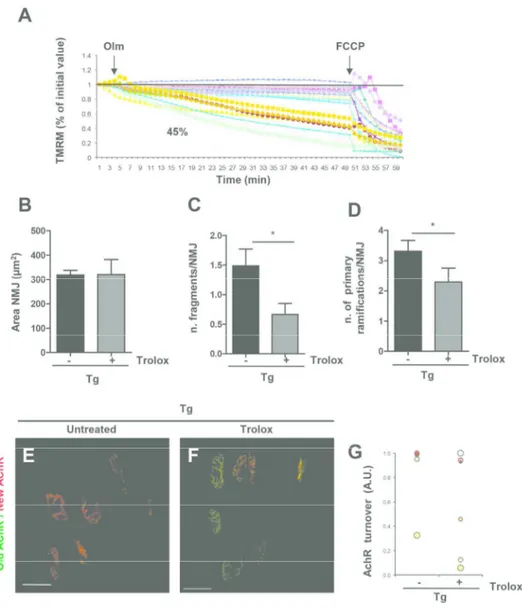
To prove that pro-oxidant conditions in skeletal muscle are causally linked to mitochondrial alteration and NMJ instability, we inhibited ROS by treating MLC/SOD1G93A mice with Trolox, a cell-permeable water-soluble derivative of vitamin E with potent antioxidant properties (40, 51). Trolox supplementation resulted in the rescue of mitochondria function (Fig. 3A), in the maintenance of NMJ phenotype and complexity (Fig. 3B-D), and in the stabilization of AChR turnover (Fig. 3E-G).
We next performed a detailed qualitative and quantitative analysis of mitochondria in EDL fibers from 4-month-old wild type and MLC/SOD1G93A mice either untreated or treated for 2 weeks with Trolox. In EDL fibers of wild type mice, mitochondria were fairly dark (enlarged inset), and specifically placed at the I band in proximity of Z lines (pointed by black arrowheads in 4A Wt panel). In fibers from MLC/SOD1G93A muscle (Fig. 4A Tg panel), on the other hand, unusually large mitochondria and/or presenting severe structural damage were more frequent (white arrowheads and enlarged detail in the inset). On occasion, mitochondria were disposed longitudinally next to the A band (arrow in Fig. 4A Tg panel). Striking the recovery obtained by treating the mice with Trolox: greatly improved internal organization of fibers to wild type-standards (Fig. 4A Tg + Trolox panel) and remarkable was also the rescue of mitochondrial integrity (black arrowheads in Fig. 4a Tg + Trolox panel and enlarged detail in the inset).
We also performed a detailed quantitative analysis of mitochondrial damage and swelling and of their volume, number and position (Table 1) to confirm the qualitative assessment of Figure 4. Results of this analysis indicated that:
5 6 7 8 9 10 11 12 13 14 15 16 17 18 19 20 21 22 23 24 25 26 27 28 29 30 31 32 33 34 35 36 37 38 39 40 41 42 43 44 45 46 47 48 49 50 51 52 53 54 55 56
doubled in MLC/SOD1G93A fibers than in wild type, was significantly reduced by the Trolox treatment (Table 1, columns A-C, first row).
b) The average size of apparently normal mitochondria (those that were not considered damaged, i.e. not included in Table1 first row) was increased in MLC/SOD1G93A fibers, but rescued to normal values in Trolox-treated samples (Table 1, columns A-C, second row), indication that the anti-oxidant treatment prevented mitochondrial swelling.
c) Swelling of mitochondria in MLC/SOD1G93A fibers caused, in turn, an increase in the relative fiber volume occupied by these organelles (Table 1, columns A-B, third row). d) While the mitochondrial volume was increased in MLC/SOD1G93A fibers (Table 1 columns A-B, third row), the number of organelles was actually reduced, likely as a result of mitochondrial loss due to damage (Table 1, columns A-B, fourth row).
e) In MLC/SOD1G93A fibers, number of mitochondria at the A band was increased, indication of mitochondrial misplacement from their correct position at the I band (Table 1,columns A-B, fifth row).
f) Finally, treatment with Trolox rescued mitochondrial volume and position, but not their number (Table 1, columns B-C third and fifth row).
We have also analysed the morphology of presynaptic terminals (or axon endings) in NMJ of EDL fibers from wild type, MLC/SOD1G93A untreated and MLC/SOD1G93A treated with Trolox (Fig. 4B). Presynaptic terminals usually contain several mitochondria and are filled with synaptic vesicles containing neurotransmitter molecules. Qualitative comparison of axon endings in MLC/SOD1G93A with those of wild type mice (Fig. 4B: compare Wt and Tg panels) revealed some evident modifications: a) mitochondria in MLC/SOD1G93A appeared damaged and swollen compared to wild type (Fig. 4B: compare Wt and Tg lower left inset); 5 6 7 8 9 10 11 12 13 14 15 16 17 18 19 20 21 22 23 24 25 26 27 28 29 30 31 32 33 34 35 36 37 38 39 40 41 42 43 44 45 46 47 48 49 50 51 52 53 54 55 56 57
Wt and Tg lower right inset); c) the external membrane of the presynaptic terminal was also less sharp and apparently damaged (compare upper inset in Wt and Tg panels). Treatment with Trolox restored significantly the morphological integrity of presynaptic terminals in MLC/SOD1G93A (Fig. 4B Tg + Trolox panel), and of the organelles contained in them (Fig. 4B Tg + Trolox lower left and right inset): a) mitochondria were more similar to those of wild type (Fig. 4B: compare Wt and Tg +Trolox lower left inset); b) vesicles appear sharper and more numerous (Fig. 4B: compare Tg and Tg + Trolox lower right inset); c) the external membrane of the presynaptic terminal is also sharper and apparently more continuous (Fig. 4B: compare Tg and Tg + Trolox panels). Quantitative analyses confirmed the qualitative ultrastructural observations (Table 2): a) mitochondria, that are less frequent in MLC/SOD1G93A than in wild type (respectively 1.2 ± 1.6 vs. 2.5 ± 2.7 / 1µm2), increase in number after Trolox treatment (2.7 ± 1.5/ 1µm2) (Table 2, columns A-C, first row); b) the number of damaged mitochondria (69% in MLC/SOD1G93A) following treatment with the anti-oxidant drug is reduced to almost normal levels (22% in Wt; 29% in MLC/SOD1G93A + Trolox) (Table 2, columns A-C, second row); c) the number of the vesicles per area (46.4 ± 25.3 / 1µm2 in MLC/SOD1G93A) is partially restored after treatment to values closer to wild type (61.9 ± 36.0 / 1µm2 in MLC/SOD1G93A + Trolox vs. 84.9 ± 36.8 / 1µm2 in Wt) (Table 2, columns A-C third row).
Overall these data suggest that Trolox treatment induces a stabilization of the NMJ. To support this evidence, we performed gene expression analysis for the gamma subunit of AChR (AChRγ), which is closely related to the innervation status. AChRγ is normally expressed at high levels in muscle during embryonic development and perinatally, whereas its expression is low or undetectable in a normal active or disused adult muscle. Conversely, 5 6 7 8 9 10 11 12 13 14 15 16 17 18 19 20 21 22 23 24 25 26 27 28 29 30 31 32 33 34 35 36 37 38 39 40 41 42 43 44 45 46 47 48 49 50 51 52 53 54 55 56
functionality (49).
Real time PCR revealed that AChRγ expression was reduced in the muscle of MLC/SOD1G93A mice treated with Trolox, compared to untreated littermates (Fig. 4C). In addition, we observed a significant down-regulation of miR-206 and miR-133a (Fig. 4D,E), two important regulators of the signaling that senses nerve activity within the muscle, in MLC/SOD1G93A muscle treated with Trolox.
These data suggest that muscle expression of SOD1G93A impairs mitochondrial function, which in turn promotes an initial defect on the NMJ. The reduction in oxidative-mediated damage rescues mitochondrial functionality and guarantees a stabilization of NMJ turnover and complexity. 5 6 7 8 9 10 11 12 13 14 15 16 17 18 19 20 21 22 23 24 25 26 27 28 29 30 31 32 33 34 35 36 37 38 39 40 41 42 43 44 45 46 47 48 49 50 51 52 53 54 55 56 57
What is the molecular mechanism underlying the toxic effect of SOD1G93A muscle specific expression on NMJ stability and function? Important mediators that play key roles in several aspects of synapse formation and signal transduction at the NMJ are protein kinases. Serine/threonine kinases PKC and PKA activities are implicated in the clustering and stability of AChRs in cultured muscle (17). Interestingly, one of the mediators that plays a critical role in functional activity-dependent synaptic circuits development (selectively occurring during the first two-thirds of the 2–3 weeks postnatal period in mice) is the theta isoform of PKC (PKCθ) (18, 20).
To evaluate whether PKCθ is also involved in the pathologic elimination of NMJ in MLC/SOD1G93A mice, we analyzed its active form in muscle of 4-month-old transgenic mice, an age when the PKCθ expression is reduced in wild type muscle compared to 2-3 week old mice (20). Figure 5A shows that the phospho-active form of PKCθ is significantly up-regulated in the muscle of 4-month-old MLC/SOD1G93A mice, compared to wild type littermates Fig. 5A and Supplemmentary Fig. S2). To link perturbation in redox signaling with PKCθ expression, we analyzed the expression level of PKCθ in muscle of MLC/SOD1G93A mice treated with Trolox. Immunoblot analysis revealed a significant reduction of the phosphorylated active form of PKCθ expression in Trolox-treated MLC/SOD1G93A mice, compared to untreated mice (Fig. 5B and Supplementary Fig. S3). These data demonstrate that PKCθ is involved in the synapse elimination in response to the toxic activity of SOD1G93A expression. Indeed immunofluorescence analysis revealed a significantly higher colocalization of PKCθ and AChR in muscle of MLC/SOD1G93A mice compared to wild type littermates (Fig. 5C,D). To substantiate this evidence, we treated transgenic mice with a potent and selective pharmacological inhibitor of PKCθ, namely the 5 6 7 8 9 10 11 12 13 14 15 16 17 18 19 20 21 22 23 24 25 26 27 28 29 30 31 32 33 34 35 36 37 38 39 40 41 42 43 44 45 46 47 48 49 50 51 52 53 54 55 56
inhibit the activity of PKCθ. It has been demonstrated that PKCθ is involved in the synapses elimination process that occurs during the first two weeks of postnatal life (20). Indeed PKCθ knock-out mouse shows a delay in synapses elimination and the percentage of polyneuronal innervation at 8 days of postnatal life is significantly higher in PKCθ knock-out mice compared to control littermates (20). Based on this evidence, we verified whether pharmacologic inhibition of PKCθ, by mean of C20 treatments, mimics the effects of the genetic ablation of PKCθ observed in knockout mice. To this purpose, we intraperitoneally treated wild type newborn mice with C20 for 10 days and analysed NMJ organization and the percentage of polyinnervation. We observed a statistically significant upregulation of percentage of polyinnervated NMJs in C20 treated wild type mice compared to untreated control littermates (Supplementary Fig. S4A,B). These data demonstrate that C20 can induce a defect in neuro-muscular synapses maturation comparable to that induced by genetic ablation of PKCθ (20).
It has been also demonstrated that LC3 is a specific target of PKCθ activity (25). It has been reported that C20-mediated PKCθ inhibition reduced the LC3-I to LC3-II conversion, a post-transductional modification that is indicative of the autophagic activity (25). Real-Time PCR and western blot analysis of LC3 isoforms revealed a significant down-modulation of both LC3II/LC3I protein ratio and transcript levels in C20 treated muscle, compared to untreated one, of MLC/SOD1G93A mice (Supplementary Fig. S4C), confirming the specificity of C20 inhibitor for PKC-θ activity. We then analyzed the effect of C20 on NMJ alteration associated with local expression of SOD1G93A.
Interestingly, C20 intraperitoneal treatment of MLC/SOD1G93A mice was associated with a significant reduction of PKCθ and AChR co-localization levels that became comparable to 5 6 7 8 9 10 11 12 13 14 15 16 17 18 19 20 21 22 23 24 25 26 27 28 29 30 31 32 33 34 35 36 37 38 39 40 41 42 43 44 45 46 47 48 49 50 51 52 53 54 55 56 57
of muscle mitochondria to maintain a membrane potential (Fig. 5F). To complement the pharmacological studies and determine the involvement of PKCθ in the elimination process in vivo, we looked for potential rescue in NMJ morphology and complexity in MLC/SOD1G93A treated mice. Morphological and morphometric analysis (Fig. 5G-K) revealed a maintenance of a pretzel-like NMJ morphology and complexity, with reduced number of fragments, in MLC/SOD1G93A treated mice compared to untreated mice.
Of note, the inhibition of PKCθ activity was associated with the stabilization of AChR turnover (Fig. 5L-N), which was also supported by the down-regulation of AChR-γ and miR-206 expression in C20 MLC/SOD1G93A treated muscle (Fig. 5O,P).
One of the main feature of MLC/SOD1G93A mice phenotype is muscle atrophy, associated with reduced muscle strength (7). To evaluate whether C20 treatment can improve muscle phenotype of MLC/SOD1G93A mice, we performed morphometric analysis of control and C20 treated muscles. As shown in the Figure 5Q we observed a significant increase of the Cross Sectional Area (CSA) of C20 treated muscle fibers that turns to mean levels close to those of wild type. Moreover, to support the histological and morphometric analysis we analyzed the functional performance of EDL muscle of both untreated (control) and C20 treated transgenic mice. Interestingly we observed that C20 treatment rescues muscle capacity to produce force (Figure 5R).
To define whether NMJ dismantlement is reduced by selective inhibition of PKCθ or can be also modulated by inhibitors of other PKC we used an alternative drug, namely Go6976, an inhibitor with a selective specificity for conventional PKC (cPKCs, including PKC-α, β and γ) but not for PKCθ (16). We treated intraperitoneally MLC/SOD1G93A mice with Go6976 for 10 days and analysed NMJ organization. Go6976 treatment, and therefore inhibition of 5 6 7 8 9 10 11 12 13 14 15 16 17 18 19 20 21 22 23 24 25 26 27 28 29 30 31 32 33 34 35 36 37 38 39 40 41 42 43 44 45 46 47 48 49 50 51 52 53 54 55 56
and did not reduce PKCθ - AChR co-localization that remains to percentage close to that of the untreated animals (Supplementary Fig. S4D-E).
Overall these findings demonstrate that muscle specific over-expression of mutant SOD1G93A gene affects NMJ integrity and induces the activation of PKCθ, which represents the molecular mechanism by which NMJ are dismantled.
Discussion
This study demonstrates that muscle-restricted expression of SOD1G93A gene induces mitochondrial alterations and NMJ dismantlement.
There is now growing consensus in the field that motor neurons are not the only primary target of SOD1G93A-mediated toxicity, and increasing evidence indicates an involvement of NMJ destruction in aging-associated sarcopenia and in the pathogenesis and progression of neuromuscular diseases, including ALS (1, 24, 38, 46, 53). However, controversy exists over whether NMJ dismantlement is a pathogenic event directly associated with the primary defects occurring in motor neurons or whether it occurs independently from motor neuron degeneration. To address this question, we made use of MLC/SOD1G93A mice (7), which represent an ideal model to separate the ubiquitous toxic effects of mutant SOD1G93A (10) with that of tissue-specific effects. In fact, the animal model that expresses the toxic mutant protein ubiquitously in all tissues, could not rule out which cell type, namely motor neurons or muscle fibers, might initiate NMJ dismantlement as consequence of oxidative damage caused by the toxic effect of SOD1G93A.
In a previous work, we demonstrated that skeletal muscle is a direct target of SOD1 mutation and that muscle-restricted expression of SOD1G93A gene was sufficient to induce severe 5 6 7 8 9 10 11 12 13 14 15 16 17 18 19 20 21 22 23 24 25 26 27 28 29 30 31 32 33 34 35 36 37 38 39 40 41 42 43 44 45 46 47 48 49 50 51 52 53 54 55 56 57
microglia activation, in the spinal cord of MLC/SOD1G93A mice (7).
In the present work, we demonstrated that muscle perturbation in redox signaling alters mitochondria morphology and function and promotes alteration and destabilization of NMJ. The role of mitochondria in aging and neuromuscular diseases, such as ALS, has been investigated by several studies, reporting that mutant SOD1 alters mitochondria organization, distribution (2, 41) and impairment in both neuron (47) and muscle cells (24). Other studies have defined mitochondrial defects as a primary cause of muscle denervation (8) or as an early pathogenic feature of SOD1 mutant–mediated ALS disease (53), suggesting that mitochondrial abnormalities, within muscle fibers, are potential culprits of NMJ instability in both sarcopenia and neuromuscular diseases (30, 39).
Our study disclosed the pathologic circuit that leads to NMJ instability. We demonstrated that functional neuromuscular denervation, that is a common feature of aging-sarcopenia and neuromuscular diseases, appears to occur independently to the activation of the cell death pathway in motor neurons, thus implicating that alterations in skeletal muscle are able to influence NMJ integrity. Notably, we observed that depolarized mitochondria were often localized adjacent to the AChR, contributing to disrupt NMJ integrity. In fact, we demonstrated the loss of morphological complexity of NMJ, alterations in the number and morphology of synaptic mitochondria, alteration in the ultrastructure of postjunctional folds and of presynaptic terminal membrane, which appears interrupted in MLC/SOD1G93A samples, compared with wild type specimens. Our work adds new insights to previous studies which reported that skeletal muscle fibers of young mice that ubiquitously express the SOD1G93A gene, display localized loss of mitochondrial inner membrane potential in segments near the NMJ prior to motor neuron degeneration (53). Thus, our experiments 5 6 7 8 9 10 11 12 13 14 15 16 17 18 19 20 21 22 23 24 25 26 27 28 29 30 31 32 33 34 35 36 37 38 39 40 41 42 43 44 45 46 47 48 49 50 51 52 53 54 55 56
NMJ dismantlement.
Considering that one of the pathogenic events associated with SOD1G93A-mediated toxicity is an increase in oxidative stress, we verified whether modulation of oxidative-mediated damage would induce any benefit in NMJ stability. We demonstrated that antioxidant treatment rescues mitochondria functionality, NMJ stability, and AChR turnover in the muscles of MLC/SOD1G93A mice.
Although several efforts have been made, the downstream pathways responsible for NMJ instability after muscle oxidative damage are still unknown. In our study, we also disclosed the molecular mechanisms by which muscle SOD1G93A gene expression, induces NMJ dismantlement.
It has been reported that functional activity-dependent synapse elimination, which occurs during the first 2-3 weeks of post-natal life in mice, requires PKC action. In particular, the theta isoform of PKC (PKCθ), which is abundantly expressed in skeletal muscle and selectively localized postsynaptically at the NMJ, is involved in the reduction of synapses that are normally generated in excessive and redundant numbers (18). The synaptic staining for PKCθ was found to appear as early as postnatal day four during development and persisted following prolonged skeletal muscle denervation in adult rats (12). Of note, activity-dependent synapse elimination was severely compromised in cultured preparations in which PKCθ was not expressed in muscle cells (20).
Interestingly, we found that muscle expression of toxic SOD1G93A gene induces the re-activation of PKCθ, in the muscle of MLC/SOD1G93A mice, promoting NMJ dismantlement. We demonstrated that PKCθ colocalizes with AChR in the muscle of MLC/SOD1G93A mice. Moreover, the up-regulation of PKCθ is intimately associated with the alteration in redox 5 6 7 8 9 10 11 12 13 14 15 16 17 18 19 20 21 22 23 24 25 26 27 28 29 30 31 32 33 34 35 36 37 38 39 40 41 42 43 44 45 46 47 48 49 50 51 52 53 54 55 56 57
levels of oxidative damage, by treating the MLC/SOD1G93A mice with an antioxidant compound, induced a reduction in PKCθ expression and phosphorylation.
To validate the hypothesis that the re-activation of PKCθ expression and activity was mechanistically associated with the dismantlement of NMJ, we pharmacologically interfered with PKCθ activity, treating the MLC/SOD1G93A mice with C20, a pharmacological inhibitor of PKCθ. We demonstrated that the inhibition of PKCθ activity was sufficient to reduce PKCθ - AChR co-localization, to restore mitochondrial functionality, to rescue the morphological complexity of NMJ, to stabilize AChR turnover, and to improve the morphofunctional properties of skeletal muscle in MLC/SOD1G93A transgenic mice.
Our study revealed that SOD1G93A-associated changes in NMJ are remarkably similar to that of naturally occurring synapse elimination during development (1, 20) and that PKCθ is as key player in activity-dependent synapse modulation and loss.
Importantly, this study provides new insights into the mechanisms that trigger functional denervation associated with sarcopenia and neuromuscular diseases, and suggests pharmacological intervention to attenuate muscle dysfunction, NMJ loss and eventually disease progression.
Innovation
Neuromuscular junctions (NMJ) serve as the interface between the nervous and skeletal muscular systems and NMJ degeneration represents a hallmark of aging sarcopenia and ALS. However, controversy exists over whether NMJ dismantlement is a pathogenic event directly associated with the primary defects occurring in motor neurons or whether it occurs independently from motor neuron degeneration. Mounting evidence suggests that the earliest 5 6 7 8 9 10 11 12 13 14 15 16 17 18 19 20 21 22 23 24 25 26 27 28 29 30 31 32 33 34 35 36 37 38 39 40 41 42 43 44 45 46 47 48 49 50 51 52 53 54 55 56
at the NMJ, as in a "dying-back" process. Our study disclosed the molecular mechanism that triggers functional denervation associated with the toxic activity of muscle SOD1G93A expression and suggests the possibility of developing a pharmacological intervention to attenuate muscle-nerve dysfunction, NMJ loss and eventually ALS disease progression in a sort of "saving-back" process.
5 6 7 8 9 10 11 12 13 14 15 16 17 18 19 20 21 22 23 24 25 26 27 28 29 30 31 32 33 34 35 36 37 38 39 40 41 42 43 44 45 46 47 48 49 50 51 52 53 54 55 56 57
Mice
The MLC/SOD1G93A mouse has been previously characterized (7). FVB mice (Jackson Laboratories) were used as strain control mice and male and female mice were used indiscriminately. Positive transgenic mice were selected by PCR using tail digests. The animals were housed in a temperature controlled (22 °C) room with a 12:12 h light-dark cycle and housed in a number of three to five per cage. All animal experiments were approved by the ethics committee of Sapienza University of Rome-Unit of Histology and Medical Embryology and were performed in accordance with the current version of the Italian Law on the Protection of Animals.
Protein extraction and Western Blot analysis
Protein extraction from both wild type and MLC/SOD1G93A transgenic muscles was performed in Sodium Chloride, 1mM Phenylmethylsulfonyl Fluoride, 1 µg/ml Aprotinin, 1 µg/ml Leupeptin, 1 µg/ml Pepstatin, 1 mM Sodium Orthovanadate, 1 mM Sodium Fluoride. Equal amounts of protein from each muscle lysate were separated in SDS polyacrilamide gel and transferred onto a nitrocellulose membrane. Filters were blotted with antibodies against HDAC4 (Cell Signaling Cat# 2072), PKCθ (Cell Signaling Cat# 13643), Phospho-PKCθ Thr538 (Cell Signaling Cat# 9377), α-tubulin (Sigma Aldrich Cat# T5168,), LC3 (Cell Signaling Cat# 2775). All the antibodies were chosen as validated for Western-Blot by manifactures.
Isolation of skeletal myofibers and measure of mitochondrial membrane potential.
FDB muscles were isolated from wild type and MLC/SOD1G93A mice, and we measured mitochondrial membrane potential by epifluorescence microscopy on the basis of the accumulation of TMRM fluorescence (Thermo Fisher Scientific Cat# T668), as previously 5 6 7 8 9 10 11 12 13 14 15 16 17 18 19 20 21 22 23 24 25 26 27 28 29 30 31 32 33 34 35 36 37 38 39 40 41 42 43 44 45 46 47 48 49 50 51 52 53 54 55 56
initial value of TMRM fluorescence. We performed imaging with a Zeiss Axiovert 100 TV inverted microscope equipped with a 12-bit digital cooled charge-coupled device camera (Micromax, Princeton Instruments). We analyzed the data with MetaFluor imaging software (Universal Imaging).
In Vivo Microscopy and Analysis of AChR Turnover and NMJ Fragmentation
In vivo microscopy of mice was performed under anesthesia using zoletil and xylazine on a Leica SP2 confocal microscope equipped with a 633 1.2 numerical aperture water immersion objective, essentially as described previously (36, 37). Automated analysis of AChR turnover and NMJ fragmentation used algorithms described earlier (36).
Histological and Immunofluorescence analysis
Segments of quadriceps from wild type and MLC/SOD1G93A transgenic mice were embedded in tissue freezing medium and snap frozen in nitrogen-cooled isopentane. Longitudinal frozen sections (40µm) were stained for fluorescent (BGT-AF488) α-bungarotoxin (Thermo Fisher Scientific Cat# B35451) and confocal images were analyzed using Leica Laser Scanning TCS SP2. A minimum of 30 NMJ were photomicrographed for each group (n=4/genotype); the z-stacked fluorescence images (2µm per focal plane) were collected and analyzed using ImageJ1 software (42). For fiber Cross Sectional Analysis a minimum of four random fields were photomicrographed for each muscle and mouse; fiber cross sectional area was analyzed using ImageJ software.
For PKCθ and Neurofilament immunofluorescence 20 µm sections and whole mount fibers were stained with Phospho-PKCθ (Thr538) or Neurofilament (Biolegend Cat# SMI-312R-100) Antibody and anti-rabbit Alexa Fluor-405 was used as secondary antibody. Sections were analyzed with Fluorescence high-resolution and images were acquired through an 5 6 7 8 9 10 11 12 13 14 15 16 17 18 19 20 21 22 23 24 25 26 27 28 29 30 31 32 33 34 35 36 37 38 39 40 41 42 43 44 45 46 47 48 49 50 51 52 53 54 55 56 57
immersion objective. The collinear light beams from 405 nm and 473 nm laser diode light sources were injected into the microscope via a FV1200 MPE laser scanning confocal device. The z-stacked 640x640 pixel fluorescence images (500 nm per focal plane, 110x110 nm pixel size) were collected in line sequential mode to reduce the cross-talk among the fluorescence channels, for a total acquisition time of less than 3 min per field of view. Microscopy data were processed with the Imaris 8.1 Bitplane imaging software. For polyinnervation the number of axons per endplate was counted, and the percentage of fibers with endplates receiving two or more axons was calculated.
RNA preparation and Real-time analysis.
Total RNA from wild type and MLC/SOD1G93A transgenic muscles was isolated by TRIzolTM reagent (Thermo Fisher Scientific Cat#: 15596026); total RNA (1µg) was treated with DNAse I Amplification Grade (Thermo Fisher ScientificCat#: AM2222) and reverse-transcribed using the SuperScriptTM III (Thermo Fisher Scientific Cat#: 18080093), while 10ng of RNA were reverse-transcribed using the TaqMan micro RNA Reverse Transcription Kit (Thermo Fisher Scientific Cat#: 4366596). Quantitative PCR was performed using the ABI PRISM 7500 SDS (Thermo Fisher Scientific), Taqman universal MMIX II (Thermo Fisher Scientific Cat# 4304437), and TaqMan probe (Thermo Fisher Scientific Cat# 431182). Quantitative RT-PCR sample value was normalized for the expression of β-actin and U6 snRNA for mRNA and microRNA, respectively. The relative expression was calculated using the 2-∆∆Ct method (21) and reported as fold change.
Electron Microscopy
EDL muscles were dissected, pinned to a Sylgard dish (Dow Corning), fixed at RT with 3.5% glutaraldehyde in 0.1 M NaCaCo buffer (pH 7.2), and stored in the fixative at 4oC. Small 5 6 7 8 9 10 11 12 13 14 15 16 17 18 19 20 21 22 23 24 25 26 27 28 29 30 31 32 33 34 35 36 37 38 39 40 41 42 43 44 45 46 47 48 49 50 51 52 53 54 55 56
as previously described (34). For neuromuscular junction (NMJ), after washing fixed muscles with phosphate buffer, small teased bundles of 15-20 fibers, were incubated for 15-30 min in a solution containing Indoxyl acetate and Hexazotized pararosanilin in 0.1 M citrate buffer, pH 6.0 (43). Regions containing NMJ were identified under a binocular microscope by a brick red deposit. These regions were cut out from the bundles (1-2 mm long), washed in sodium cacodylate buffer 0.1 M, post-fixed in 2% OsO4 for 1 h at 4°C and finally block-stained in saturated uranyl acetate. After dehydration, the specimens were embedded in an epoxy resin (Epon 812).
Ultrathin sections (~40 nm) of all preparations were cut using a Leica Ultracut R microtome (Leica Microsystem, Austria) with a Diatome diamond knife (DiatomeLtd. CH-2501 Biel, Switzerland) and double-stained with uranyl acetate and lead citrate. Sections were viewed in a FP 505 Morgagni Series 268D electron microscope (FEI Company, Brno, Czech Republic), equipped with Megaview III digital camera and Soft Imaging System (Munster, Germany) at 60 kV.
Quantitative analysis of muscle fiber.
a) The number of severely disrupted mitochondria was counted in micrographs taken at 18.000x magnification and their number is reported as percentage of the total number. Mitochondria with any or several of the following ultrastructural alterations were classified as severely disrupted: i) mitochondria with clear disruption of the external membrane; ii) severe vacuolization and disruption of the mitochondria internal cristae; iii) mitochondria containing myelin figures.
b) The average minimum diameter of mitochondria was measured in the same set of micrographs using the Soft Imaging System (Germany). In each fiber 8 to 10 micrographs 5 6 7 8 9 10 11 12 13 14 15 16 17 18 19 20 21 22 23 24 25 26 27 28 29 30 31 32 33 34 35 36 37 38 39 40 41 42 43 44 45 46 47 48 49 50 51 52 53 54 55 56 57
were analyzed for each EDL muscle (Wt, MLC/SOD1G93A, MLC/SOD1G93A + Trolox). Only mitochondria which were entirely visualized in the micrograph were measured. The diameter of normal and abnormal mitochondria presenting a translucent matrix, but with an apparently intact external membrane, was measured (excluding the severely disrupted ones). A total of 419 to 1204 mitochondria diameters were measured in each specimen.
c) The relative volume occupied by mitochondria was determined using the well-established stereology point-counting techniques (23, 29). In each specimen (Wt, MLC/SOD1G93A, MLC/SOD1G93A + Trolox) 14-17 cross-sectional fibers were analyzed and in each fiber 2 micrographs were taken at 7.100x magnification.
d) Mitochondrial number/area and their position relative to the sarcomeres was determined from electron micrographs of non-overlapping regions randomly collected from longitudinal sections. In each specimen (Wt, MLC/SOD1G93A, MLC/SOD1G93A + Trolox) 6 fibers were analyzed and in each fiber 8-10 micrographs were collected at 18.000x magnification. In each EM image, we determined the number of mitochondria as well as their positioning with respect to the I and A bands. If an individual mitochondrion extended from one band to the other, it was counted double.
Quantitative analysis of presynaptic terminals.
a) The area covered by NMJ profiles (sample size: 14 for each group) were measured in micrographs taken from longitudinal sections at 14.000-28.000x magnification using the Soft Imaging System software (Germany). b) Density of mitochondria and synaptic vesicles are reported as number / 1µm2. The number of damaged mitochondria in each NMJ is reported as percentage of the total number.
5 6 7 8 9 10 11 12 13 14 15 16 17 18 19 20 21 22 23 24 25 26 27 28 29 30 31 32 33 34 35 36 37 38 39 40 41 42 43 44 45 46 47 48 49 50 51 52 53 54 55 56
Software, Inc.) or by a Chi-squared test (Microsoft Office Excel 2007; Microsoft Corporation). Values of p < 0.05 (95% confidence) were considered significant.
Treatment
Wt and MLC/SOD1G93A transgenic mice and were treated daily intraperitoneally for 15 days with 30 mg/kg of Trolox or Compound 20 or Go6976.
Mechanical Measurements
Mechanical Measurements were performed as previously described (7)
Quantification and statistical analysis
Statistical parameters including sample sizes (n= number of animal subjects per group), the statistical test used and the statistical significance are reported in the Figure Legends. Sample size was considered adequate if the statistical power was equal /higher than 50%-70%; for real-time PCR we considered sample size adequate when the two groups were significantly different (P<0.05) and the fold change was higher than 1.5. Unless otherwise indicated, P-values for simple pair-wise comparisons were performed using a two-tailed unpaired and non parametric Mann-Whitney test and graph values are reported as mean ± SEM. (error bars). Mice were randomly assigned to either treatment or control groups and investigators were not blinded for group allocation or outcome assessment. Data is judged to be statistically significant when p < 0.05. In figures, asterisks denote statistical significance *p < 0.05, **p< 0.01, ***p< 0.001. All statistical analysis was performed using GraphPad PRISM 6 software. 5 6 7 8 9 10 11 12 13 14 15 16 17 18 19 20 21 22 23 24 25 26 27 28 29 30 31 32 33 34 35 36 37 38 39 40 41 42 43 44 45 46 47 48 49 50 51 52 53 54 55 56 57
This study was supported by Fondazione Roma, Telethon (GGP14066), ASI, progetti ateneo to AM; Telethon (GGP13213) to FP; MIUR Future in Research: RBFR13A20K to SB; Telethon (GGP13233) to MB.
Author contributions
Conceptualization, M.B., M.S., R.R., F.P. and A.M; Methodology, G.D., M.M., BM.S., V.R., S.B., C.N., L.P, S.D. and A.C; Validation: G.D., M.M., BM.S., V.R., S.B., C.N., L.P., S.D., A.C., M.B., M.S., R.R., F.P. and A.M; Formal Analysis: G.D., M.M., BM.S., V.R., S.B., C.N., L.P., S.D., A.C., M.B., M.S., R.R., F.P. and A.M; Investigation: G.D., M.M., BM.S., V.R., S.B., C.N., L.P., S.D., and A.C; Resources: M.B., M.S., R.R., F.P. and A.M; Data Curation: G.D., M.M., BM.S., V.R., S.B., C.N., L.P., S.D., A.C., M.B., M.S., R.R., F.P. and A.M; Writing-Original Draft: A.M.; Writing-Review & Editing: M.B., M.S., R.R., F.P. and A.M; Visualization: G.D., M.M., BM.S., V.R., S.B., C.N., L.P, S.D., A.C., M.B., M.S., R.R., F.P. and A.M; Supervision: M.B., M.S., R.R., F.P. and A.M; Project Administration: A.M; Funding Acquisition: A.M., M.B., and F.P.
Author Disclosure Statement
The authors declare that there is no conflict of interests regarding the publication of this paper.
Abbreviations:
NMJ=Neromuscular Junction
ALS= Amyotrophic Lateral Sclerosis AChR= Acetylcholine Receptor 5 6 7 8 9 10 11 12 13 14 15 16 17 18 19 20 21 22 23 24 25 26 27 28 29 30 31 32 33 34 35 36 37 38 39 40 41 42 43 44 45 46 47 48 49 50 51 52 53 54 55 56
SOD1= Superoxide Dismutase-1 MLC= Myosin Light Chain PKCθ = Protein Kinase Cθ
∆Ψm=Mitochondrial inner membrane potential
FCCP=Carbonyl cyanide 4-(trifluoromethoxy) phenylhydrazone BGT= Bungarotoxin
HDAC4= Histone deacetylase 4 5 6 7 8 9 10 11 12 13 14 15 16 17 18 19 20 21 22 23 24 25 26 27 28 29 30 31 32 33 34 35 36 37 38 39 40 41 42 43 44 45 46 47 48 49 50 51 52 53 54 55 56 57
1. Balice-Gordon RJ. Age-related changes in neuromuscular innervation. Muscle Nerve
Suppl. 5: S83-S87, 1997.
2. Bowling AC, Schulz JB, Brown RH, Jr., and Beal MF. Superoxide dismutase activity, oxidative damage, and mitochondrial energy metabolism in familial and sporadic amyotrophic lateral sclerosis. J Neurochem. 61: 2322-2325, 1993.
3. Chen JF, Mandel EM, Thomson JM, Wu Q, Callis TE, Hammond SM, et al. The role of microRNA-1 and microRNA-133 in skeletal muscle proliferation and differentiation.
Nat Genet. 38: 228-233, 2006.
4. Cohen TJ, Waddell DS, Barrientos T, Lu Z, Feng G, Cox GA, et al. The histone deacetylase HDAC4 connects neural activity to muscle transcriptional reprogramming.
J Biol Chem. 282: 33752-33759, 2007.
5. Cywin CL, Dahmann G, Prokopowicz AS, III, Young ER, Magolda RL, Cardozo MG, et al. Discovery of potent and selective PKC-theta inhibitors. Bioorg Med Chem Lett. 17: 225-230, 2007.
6. DiMario JX, Stockdale FE. Both myoblast lineage and innervation determine fiber type and are required for expression of the slow myosin heavy chain 2 gene. Dev Biol. 188: 167-180, 1997.
7. Dobrowolny G, Aucello M, Rizzuto E, Beccafico S, Mammucari C, Boncompagni S, et al. Skeletal muscle is a primary target of SOD1G93A-mediated toxicity. Cell Metab. 8: 425-436, 2008.
8. Dupuis L, Gonzalez de Aguilar JL, Oudart H, de Tapia M, Barbeito L, and Loeffler JP. Mitochondria in amyotrophic lateral sclerosis: a trigger and a target. Neurodegener Dis. 1: 245-254, 2004. 5 6 7 8 9 10 11 12 13 14 15 16 17 18 19 20 21 22 23 24 25 26 27 28 29 30 31 32 33 34 35 36 37 38 39 40 41 42 43 44 45 46 47 48 49 50 51 52 53 54 55 56
micro-RNA signature in skeletal muscle damage and regeneration induced by Duchenne muscular dystrophy and acute ischemia. FASEB J. 23: 3335-3346, 2009. 10. Gurney ME, Pu H, Chiu AY, Dal Canto MC, Polchow CY, Alexander DD, et al. Motor
neuron degeneration in mice that express a human Cu,Zn superoxide dismutase mutation. Science. 264: 1772-1775, 1994.
11. Hilgenberg L, Miles K. Developmental regulation of a protein kinase C isoform localized in the neuromuscular junction. J Cell Sci. 108 ( Pt 1): 51-61, 1995.
12. Hilgenberg L, Yearwood S, Milstein S, and Miles K. Neural influence on protein kinase C isoform expression in skeletal muscle. J Neurosci. 16: 4994-5003, 1996.
13. Irwin WA, Bergamin N, Sabatelli P, Reggiani C, Megighian A, Merlini L, et al. Mitochondrial dysfunction and apoptosis in myopathic mice with collagen VI deficiency. Nat Genet. 35: 367-371, 2003.
14. Jang YC, Lustgarten MS, Liu Y, Muller FL, Bhattacharya A, Liang H, et al. Increased superoxide in vivo accelerates age-associated muscle atrophy through mitochondrial dysfunction and neuromuscular junction degeneration. FASEB J. 24: 1376-1390, 2010. 15. Kablar B, Rudnicki MA. Development in the absence of skeletal muscle results in the
sequential ablation of motor neurons from the spinal cord to the brain. Dev Biol. 208: 93-109, 1999.
16. Koivunen J, Aaltonen V, Koskela S, Lehenkari P, Laato M, and Peltonen J. Protein kinase C alpha/beta inhibitor Go6976 promotes formation of cell junctions and inhibits invasion of urinary bladder carcinoma cells. Cancer Res. 64: 5693-5701, 2004.
5 6 7 8 9 10 11 12 13 14 15 16 17 18 19 20 21 22 23 24 25 26 27 28 29 30 31 32 33 34 35 36 37 38 39 40 41 42 43 44 45 46 47 48 49 50 51 52 53 54 55 56 57
postsynaptic maturation of the neuromuscular junction during neonatal synapse elimination depends on protein kinase C. J Neurosci Res. 67: 607-617, 2002.
18. Lanuza MA, Garcia N, Santafe M, Nelson PG, Fenoll-Brunet MR, and Tomas J. Pertussis toxin-sensitive G-protein and protein kinase C activity are involved in normal synapse elimination in the neonatal rat muscle. J Neurosci Res. 63: 330-340, 2001. 19. Lewis BP, Burge CB, and Bartel DP. Conserved seed pairing, often flanked by
adenosines, indicates that thousands of human genes are microRNA targets. Cell. 120: 15-20, 2005.
20. Li MX, Jia M, Yang LX, Jiang H, Lanuza MA, Gonzalez CM, et al. The role of the theta isoform of protein kinase C (PKC) in activity-dependent synapse elimination: evidence from the PKC theta knock-out mouse in vivo and in vitro. J Neurosci. 24: 3762-3769, 2004.
21. Livak KJ, Schmittgen TD. Analysis of relative gene expression data using real-time quantitative PCR and the 2(-Delta Delta C(T)) Method. Methods. 25: 402-408, 2001. 22. Lømo. Nerve-muscle interactions. In: Clinical Neurophysiology of Disorders of Muscle,
edited by Stalberg E. Elsevier, 2003, pp. 47-65.
23. Loud AV, Barany WC, and Pack BA. Quantitative evalutation of cytoplasmic structures in electron micrographs. Lab Invest. 14: 996-1008, 1965.
24. Luo G, Yi J, Ma C, Xiao Y, Yi F, Yu T, et al. Defective mitochondrial dynamics is an early event in skeletal muscle of an amyotrophic lateral sclerosis mouse model. PLoS
One. 8: e82112, 2013.
25. Madaro L, Marrocco V, Carnio S, Sandri M, and Bouche M. Intracellular signaling in ER stress-induced autophagy in skeletal muscle cells. FASEB J. 27: 1990-2000, 2013. 5 6 7 8 9 10 11 12 13 14 15 16 17 18 19 20 21 22 23 24 25 26 27 28 29 30 31 32 33 34 35 36 37 38 39 40 41 42 43 44 45 46 47 48 49 50 51 52 53 54 55 56
kinase Ctheta controls type 2 innate lymphoid cell and TH2 responses to house dust mite allergen. J Allergy Clin Immunol. 139: 1650-1666, 2017.
27. Marrocco V, Fiore P, Benedetti A, Pisu S, Rizzuto E, Musaro A, et al. Pharmacological Inhibition of PKCtheta Counteracts Muscle Disease in a Mouse Model of Duchenne Muscular Dystrophy. EBioMedicine. 2017.
28. Martini M, Dobrowolny G, Aucello M, and Musaro A. Postmitotic Expression of SOD1(G93A) Gene Affects the Identity of Myogenic Cells and Inhibits Myoblasts Differentiation. Mediators Inflamm. 2015: 537853, 2015.
29. Mobley BA, Eisenberg BR. Sizes of components in frog skeletal muscle measured by methods of stereology. J Gen Physiol. 66: 31-45, 1975.
30. Moloney EB, de Winter F, and Verhaagen J. ALS as a distal axonopathy: molecular mechanisms affecting neuromuscular junction stability in the presymptomatic stages of the disease. Front Neurosci. 8: 252, 2014.
31. Musaro A. Understanding ALS: new therapeutic approaches. FEBS J. 280: 4315-4322, 2013.
32. Musaro A, Fulle S, and Fano G. Oxidative stress and muscle homeostasis. Curr Opin
Clin Nutr Metab Care. 13: 236-242, 2010.
33. Pelosi L, Coggi A, Forcina L, and Musaro A. MicroRNAs modulated by local mIGF-1 expression in mdx dystrophic mice. Front Aging Neurosci. 7: 69, 2015.
34. Pietrangelo L, D'Incecco A, Ainbinder A, Michelucci A, Kern H, Dirksen RT, et al. Age-dependent uncoupling of mitochondria from Ca2(+) release units in skeletal muscle. Oncotarget. 6: 35358-35371, 2015. 5 6 7 8 9 10 11 12 13 14 15 16 17 18 19 20 21 22 23 24 25 26 27 28 29 30 31 32 33 34 35 36 37 38 39 40 41 42 43 44 45 46 47 48 49 50 51 52 53 54 55 56 57
stress in degeneration of the neuromuscular junction in amyotrophic lateral sclerosis.
Front Cell Neurosci. 8: 131, 2014.
36. Roder IV, Choi KR, Reischl M, Petersen Y, Diefenbacher ME, Zaccolo M, et al. Myosin Va cooperates with PKA RIalpha to mediate maintenance of the endplate in vivo. Proc Natl Acad Sci U S A. 107: 2031-2036, 2010.
37. Roder IV, Petersen Y, Choi KR, Witzemann V, Hammer JA, III, and Rudolf R. Role of Myosin Va in the plasticity of the vertebrate neuromuscular junction in vivo. PLoS One. 3: e3871, 2008.
38. Rudolf R, Deschenes MR, and Sandri M. Neuromuscular junction degeneration in muscle wasting. Curr Opin Clin Nutr Metab Care. 19: 177-181, 2016.
39. Rygiel KA, Picard M, and Turnbull DM. The ageing neuromuscular system and sarcopenia - A mitochondrial perspective. J Physiol. 2016.
40. Salgo MG, Pryor WA. Trolox inhibits peroxynitrite-mediated oxidative stress and apoptosis in rat thymocytes. Arch Biochem Biophys. 333: 482-488, 1996.
41. Sasaki S, Horie Y, and Iwata M. Mitochondrial alterations in dorsal root ganglion cells in sporadic amyotrophic lateral sclerosis. Acta Neuropathol. 114: 633-639, 2007. 42. Schneider CA, Rasband WS, and Eliceiri KW. NIH Image to ImageJ: 25 years of image
analysis. Nat Methods. 9: 671-675, 2012.
43. Strum JM, Hall-Craggs EC. A method demonstrating motor endplates for light and electron microscopy. J Neurosci Methods. 6: 305-309, 1982.
44. Tang H, Macpherson P, Marvin M, Meadows E, Klein WH, Yang XJ, et al. A histone deacetylase 4/myogenin positive feedback loop coordinates denervation-dependent gene induction and suppression. Mol Biol Cell. 20: 1120-1131, 2009.
5 6 7 8 9 10 11 12 13 14 15 16 17 18 19 20 21 22 23 24 25 26 27 28 29 30 31 32 33 34 35 36 37 38 39 40 41 42 43 44 45 46 47 48 49 50 51 52 53 54 55 56
repairing the neuromuscular junction. PLoS One. 9: e93140, 2014.
46. Valdez G, Tapia JC, Kang H, Clemenson GD, Jr., Gage FH, Lichtman JW, et al. Attenuation of age-related changes in mouse neuromuscular synapses by caloric restriction and exercise. Proc Natl Acad Sci U S A. 107: 14863-14868, 2010.
47. Vande VC, McDonald KK, Boukhedimi Y, McAlonis-Downes M, Lobsiger CS, Bel HS, et al. Misfolded SOD1 associated with motor neuron mitochondria alters mitochondrial shape and distribution prior to clinical onset. PLoS One. 6: e22031, 2011. 48. Williams AH, Valdez G, Moresi V, Qi X, McAnally J, Elliott JL, et al. MicroRNA-206 delays ALS progression and promotes regeneration of neuromuscular synapses in mice.
Science. 326: 1549-1554, 2009.
49. Witzemann V, Brenner HR, and Sakmann B. Neural factors regulate AChR subunit mRNAs at rat neuromuscular synapses. J Cell Biol. 114: 125-141, 1991.
50. Wong M, Martin LJ. Skeletal muscle-restricted expression of human SOD1 causes motor neuron degeneration in transgenic mice. Hum Mol Genet. 19: 2284-2302, 2010. 51. Wu TW, Hashimoto N, Wu J, Carey D, Li RK, Mickle DA, et al. The cytoprotective
effect of Trolox demonstrated with three types of human cells. Biochem Cell Biol. 68: 1189-1194, 1990.
52. Zanin-Zhorov A, Ding Y, Kumari S, Attur M, Hippen KL, Brown M, et al. Protein kinase C-theta mediates negative feedback on regulatory T cell function. Science. 328: 372-376, 2010.
53. Zhou J, Yi J, Fu R, Liu E, Siddique T, Rios E, et al. Hyperactive intracellular calcium signaling associated with localized mitochondrial defects in skeletal muscle of an animal model of amyotrophic lateral sclerosis. J Biol Chem. 285: 705-712, 2010. 5 6 7 8 9 10 11 12 13 14 15 16 17 18 19 20 21 22 23 24 25 26 27 28 29 30 31 32 33 34 35 36 37 38 39 40 41 42 43 44 45 46 47 48 49 50 51 52 53 54 55 56 57
5 6 7 8 9 10 11 12 13 14 15 16 17 18 19 20 21 22 23 24 25 26 27 28 29 30 31 32 33 34 35 36 37 38 39 40 41 42 43 44 45 46 47 48 49 50 51 52 53 54 55 56
Fig. 1. Muscle-specific expression of SOD1G93A induces mitochondrial alterations and affects the complexity of NMJ. (A,B) Mitochondrial response to oligomycin in myofibers isolated from FDB muscles of Wt (A) and Tg
transgenic mice (B). Where indicated, 6 µM oligomycin (Olm) (arrow) or 4 µM of the protonophore carbonylcyanide-p-trifluoromethoxyphenyl hydrazone (FCCP) (arrow) were added. Each trace represents the
tetramethylrhodamine methyl ester (TMRM) fluorescence of a single fiber. The fraction of myofibers with depolarizing mitochondria is indicated for each condition, where fibers are considered as depolarizing when they lose more than 10% of initial value of TMRM fluorescence after oligomycin addition. (C-E) Double stain
with TMRM probed (green) and α-Bungarotoxin (red) in Wt (C) and Tg (D) muscle; white and yellow arrowheads indicate respectively homogeneous and fuzzy TMRM staining. (E) Depolarized mitochondrial area
of transgenic fibers faced with the Tg NMJ. 185x125mm (300 x 300 DPI) 5 6 7 8 9 10 11 12 13 14 15 16 17 18 19 20 21 22 23 24 25 26 27 28 29 30 31 32 33 34 35 36 37 38 39 40 41 42 43 44 45 46 47 48 49 50 51 52 53 54 55 56 57
Fig. 2. Muscle-specific expression of SOD1G93A induces NMJ instability and affects the molecular regulatory circuit of muscle innervation. (A,B) Representative maximum projection of photomicrographs showing α-bungarotoxin staining in quadriceps muscles of wild type (Wt) (A) and MLC/SOD1G93A mice (Tg) (B). Scale
bar: 10µm. (C-F) Quantitative morphometry of NMJ in quadriceps from Wt and Tg mice, representing the number of primary (C) and secondary (D) ramifications from the principal gutter, the number of fragments
per NMJ (E), the area of the AChR clusters (F); (***p =0.0008 (C); **p= 0.0051 (D); *p=0.0279 (E) *p=0.0449 (F) ; Wt, Tg n=33,38 NMJs from at least 3 litters/group. Data are represented as mean ± SEM).
(G,H) AChRs turnover: muscles of Wt (G) and Tg (H) animals were injected with infrared fluorescent α-bungarotoxin-AF647 to label AChRs present at that time point ('old receptors'). Ten days later, red fluorescent α-bungarotoxin-AF555 was injected to mark 'new receptors' and then muscles were imaged with confocal microscopy. Panels show maximum-z projections of 'old receptors' and 'new receptors' in green and red, respectively. Scale bar: 50µm. (I) Graph represents the number of fragments per NMJ in relation to 5 6 7 8 9 10 11 12 13 14 15 16 17 18 19 20 21 22 23 24 25 26 27 28 29 30 31 32 33 34 35 36 37 38 39 40 41 42 43 44 45 46 47 48 49 50 51 52 53 54 55 56
graph means fold increase of transcript expression in Tg vs Wt mice. Data are represented as mean ± SEM.). (N) Representative western blot analysis of HDAC4 protein expression in quadriceps muscle of both Wt and Tg mice. Lower panel shows densitometric analysis for HDAC4 expression relative to α-tubulin in Wt
and Tg mice; (*p = 0.0176 Wt, Tg n=6,9 mice from at least 3 litters/group. Data are represented as mean ± SEM). In N the lanes were run on the same gel but were non contiguous.
166x275mm (300 x 300 DPI) 5 6 7 8 9 10 11 12 13 14 15 16 17 18 19 20 21 22 23 24 25 26 27 28 29 30 31 32 33 34 35 36 37 38 39 40 41 42 43 44 45 46 47 48 49 50 51 52 53 54 55 56 57
Fig. 3. Trolox treatment rescues mitochondrial function and NMJ fragmentation and stability (A) Mitochondrial membrane potential of Trolox treated Tg FDB single fibers. Percent means number of myofibers with depolarizing mitochondria related to total fibers analyzed. (B-D) Quantitative morphometric
analysis of NMJ from untreated and treated Tg mice; (*p=0.0318 (C) *p=0.0356 (D); Tg, Tg + Trolox n=38,27 NMJs from at least 3 litters/group. Data are represented as mean ± SEM). (E,F) AChRs turnover: Maximum-z projections of 'old' (green) and 'new' (red) Acetylcholine receptors in untreated (E) and Trolox treated (F) Tg muscles. Scale bar: 50µm. (G) Graph representing number of pixels of red signal
per total NMJ pixels. 184x203mm (300 x 300 DPI) 5 6 7 8 9 10 11 12 13 14 15 16 17 18 19 20 21 22 23 24 25 26 27 28 29 30 31 32 33 34 35 36 37 38 39 40 41 42 43 44 45 46 47 48 49 50 51 52 53 54 55 56
Fig. 4. Trolox treatment rescues mitochondrial damage and the morphology of presynaptic terminals in MLC/SOD1G93A (A) EM images of EDL fibers from wild type (Wt) (left panel), untreated MLC/SOD1G93A
(Tg) (center panel), and MLC/SOD1G93A treated with Trolox (Tg+ Trolox) (right panel); in insets, representative mitochondria. Black arrowheads point to mitochondria correctly positioned at the I band; in
Tg EDL (center panel) white arrowheads points to damaged mitochondria, while the single arrow points to an unusually large mitochondria disposed longitudinally next to the A band. Scale bar: 0.5µm; insets: 0.1µm. (B) Morphology of a presynaptic terminals and of the organelles contained in them (mitochondria
and synaptic vesicles) in Wt, Tg, and Tg + Trolox. Lower left insets of each panel show representative mitochondria, while lower right insets represent synaptic vesicles; the external membrane are represented in upper insets of each panel. Scale bars: panels: 0.5 µm; upper insets: 0.2 µm; lower insets: 0.1 µm. (C-E)
Real-time PCR analysis of AChRγ (C), miR-206 (D), and miR-133a (E) transcripts in untreated and treated Tg mice; (*p = 0.0190 Tg, Tg + Trolox n= 6,4 (C); **p = 0.0095 Tg, Tg + Trolox n=6,4 (D); *p = 0.0159 Tg, Tg + Trolox n= 5,4 (E); mice from at least 2 litters/group. The number above graph means fold increase 5 6 7 8 9 10 11 12 13 14 15 16 17 18 19 20 21 22 23 24 25 26 27 28 29 30 31 32 33 34 35 36 37 38 39 40 41 42 43 44 45 46 47 48 49 50 51 52 53 54 55 56 57
167x230mm (300 x 300 DPI) 5 6 7 8 9 10 11 12 13 14 15 16 17 18 19 20 21 22 23 24 25 26 27 28 29 30 31 32 33 34 35 36 37 38 39 40 41 42 43 44 45 46 47 48 49 50 51 52 53 54 55 56
Fig. 5. PKCθ is involved in NMJ dismantlement and pharmacological interference with PKC-θ activity restored NMJ morphology and stability. (A,B) Upper panels: PPKCθ and total PKCθ expression in wild type (Wt) and in
MLC/SOD1G93A (Tg) (A), and in untreated and Trolox treated Tg mice (B). Lower panels indicate densitometric analysis in Wt and in Tg treated and untreated mice; (*p =0.0448 Wt, Tg n= 11,10 (A); *p =0.0490 Tg, Tg + Trolox n= 10,3 (B); mice from at least 2 litters/group. Data are represented as mean ±
SEM). In A, B, upper panels lanes were run on the same gel but were non contiguous. (C-E) 3D representation for AChR (green) and PPKCθ (red) staining of muscle from Wt (C), Tg (D), and C20 Tg
treated mice (E). Scale bar: 10µm. Graph represent the percentage of colocalized voxel in Wt (white column), in untreated (black column) and C20 treated Tg mice (grey column); (*p = 0.0127; ** p = 0.0034; Wt, Tg, Tg + C20 n= 14,11,8; NMJs from at least 2 litters/group. Data are represented as mean ±
SEM). (F) Mitochondrial membrane potential of C20 treated transgenic FDB single fibers. Percent means number of myofibers with depolarizing mitochondria related to total fibers analyzed. (G,H) NMJ morphology
in quadriceps muscles of untreated (G) and C20 treated Tg mice (H). Scale bar: 10µm. (I-K) Quantitative 5 6 7 8 9 10 11 12 13 14 15 16 17 18 19 20 21 22 23 24 25 26 27 28 29 30 31 32 33 34 35 36 37 38 39 40 41 42 43 44 45 46 47 48 49 50 51 52 53 54 55 56 57
Tg + C20 n= 38,37 NMJs from at least 3 litters/group. Data are represented as mean ± SEM). (L,M) AChRs turnover in Tg untreated (L) and treated (M) muscles. Scale bar: 50µm. (N) Quantitative graphic representation of NMJ stabilization after PKCθ pharmacological inhibition. (O,P) Real-time PCR analysis of AChRγ (O) and miR-206 (P) transcript in untreated and C20 treated Tg mice; (t-test *p= 0.0423; Tg, Tg +
C20 n= 6,4 (O); *p= 0.0390; Tg, Tg + C20 n= 6,3 (P); mice from at least 2 litters/group. The number above graph means fold increase of transcript expression of untreated vs C20 treated Tg mice. Data are represented as mean ± SEM). (Q) Fiber size in Wt (white bars) Tg (black bars) and Tg + C20 (grey bars)
mice of TA muscles (mean ± SEM; Wt = 2156.21 ± 23.18 µm2; Tg = 1388.68 ± 25.35 µm2; Tg + C20 2217.23 ± 18.92; ****p < 0,0001 Wt, Tg, Tg + C20 n=3,3,3). (R) Muscle strenght of EDL muscles of Tg and Tg + C20 mice. All measurements are presented as mean ± SEM (t-test *p = 0.022; ****p < 0.0001;
Wt, Tg; Tg+C20 n=10,10,6) 190x275mm (300 x 300 DPI) 5 6 7 8 9 10 11 12 13 14 15 16 17 18 19 20 21 22 23 24 25 26 27 28 29 30 31 32 33 34 35 36 37 38 39 40 41 42 43 44 45 46 47 48 49 50 51 52 53 54 55 56