1
GENETIC CHARACTERIZATION OF SOUTH AMERICA DOMESTIC GUINEA PIG USING MOLECULAR MARKERS1
[CARACTERIZACIÓN GENÉTICA DEL CUY DOMÉSTICO EN AMÉRICA DEL SUR USANDO MARCADORES MOLECULARES] D. F. Avilés-Esquivel1,*, A. M. Martínez2, V. Landi2, L. A. Álvarez3, A.
Stemmer4, N. Gómez-Urviola5 and J.V. Delgado2
¹Facultad de Ciencias Agropecuarias, Universidad Técnica de Ambato, Cantón Cevallos vía a Quero, sector el Tambo- La Universidad, 1801334, Tungurahua,
Ecuador. Email: [email protected]
2Departamento de Genética, Universidad de Córdoba, Campus Universitario de
Rabanales 14071 Córdoba, España.
3Universidad Nacional de Colombia.
4Universidad Mayor de San Simón, Cochabamba, Bolivia.
5Universidad Nacional Micaela Bastidas de Apurímac, Perú.
*Corresponding author
SUMMARY
Twenty specific primers were used to define the genetic diversity and structure of the domestic guinea pig (Cavia
porcellus). The samples were collected from the Andean countries (Colombia, Ecuador, Peru and Bolivia). In
addition, samples from Spain were used as an out-group for topological trees. The microsatellite markers were used and showed a high polymorphic content (PIC) 0.750, and heterozygosity values indicated microsatellites are highly informative. The genetic variability in populations of guinea pigs from Andean countries was (He: 0.791; Ho: 0.710), the average number of alleles was high (8.67). A deficit of heterozygotes (FIS: 0.153; p<0.05) was detected. Through the analysis of molecular variance (AMOVA) no significant differences were found among the guinea pigs of the Andean countries (FST: 2.9%); however a genetic differentiation of 16.67% between South American populations and
the population from Spain was detected. A poor genetic structure was found among the Andean countries with high genetic variability. The results suggest that it is necessary to take urgent measures to prevent further genetic erosion of native guinea pigs in the Andean countries with plans for recovery and conservation of this important genetic resource in South America.
Keywords: DNA markers, Cavia porcellus, South America, genetic diversity. RESUMEN
Se utilizaron 20 cebadores específicos para definir la diversidad genética y la estructura del cobayo doméstico (Cavia
porcellus). Las muestras fueron recolectadas de los países andinos (Colombia, Ecuador, Perú y Bolivia). Además, se
utilizaron muestras de España como grupo externo de los árboles filogenéticos. Los marcadores microsatélites mostraron un alto contenido de información polimórfica (PIC) 0.750, y los valores de heterocigosidad indicaron que los microsatélites son altamente informativos. La variabilidad genética en las poblaciones de cuyes de los países andinos fue (He: 0.791, Ho: 0.710), el número promedio de alelos fue alto (8.67). Se detectó un déficit de heterozigotos (FIS: 0.153; p <0.05). A través del análisis de varianza molecular (AMOVA) no se encontraron diferencias significativas entre los cuyes de los países andinos (FST: 2.9%); Sin embargo, se detectó una diferenciación genética del 16,67% entre las poblaciones sudamericanas y la población española. Se encontró una estructura genética deficiente entre los países andinos con alta variabilidad genética. Los resultados sugieren que es necesario tomar medidas urgentes para prevenir una mayor erosión genética de cuyes nativos en los países andinos con planes para la recuperación y conservación de este importante recurso genético en América del Sur.
Palabras clave: Marcadores de ADN, Cavia porcellus, América del Sur, diversidad genética.
2 INTRODUCTION
The guinea pig (Cavia porcellus) is a native animal to the Andes (Wing, 1986). This animal plays an important role in the economic income of rural families and, at the same time, it is strongly connected to cultural and religious Pre-Inca traditions (Avilés et
al., 2014). The guinea pig and South American
camelids are a source of food due to their ability to convert poor vegetable resources to good protein (Avilés et al., 2015). Guinea pig meat contains about 70% dry matter, 21.4% crude protein, 3.0% fat, 0.5% carbohydrate and 0.8% minerals, while chicken meat contains 70.2% dry matter, 18.3% crude protein, 9.3% fat, 1.2% carbohydrates and 1% minerals, which reaches commercial maturity at 3.5 months of age with an average between 800 g to 1200 g (Manjeli, 1998; Zumárraga, 2011). Since the sixteenth century, guinea pig has been introduced in Europa as a pet or scientific experimentation (Guerrini, 2003) and is now widespread in Central and South America. It even has been introduced to sub-Sahara Africa (SSA) where it has an extensive distribution and plays an important role with smallholder farmers in better nutrition and poverty reduction (Manjeli et al., 1998; Matthiesen et al., 2011; Maass et al., 2016).
During the 1970s, in the four Andean countries (Colombia, Ecuador, Peru and Bolivia), the three commercial lines of domestic guinea pigs introduced from Peru, have been phenotypically characterized, but never using molecular marker while several studies have been conducted on guinea pig breeding with the aim to increase meat production performance (INIA, 2005). Native guinea pigs in Ecuador but also in the other Andean countires, due their lower meat production are being substituted by commercial animals without any breeding plan.
Nowadays, there exist studies on genetics of Cavia
porcellus and its close relatives covered the
phylogenetic of living lineages and domestication effects in Latin America (Spotorno et al., 2004; 2006; 2007; Brust and Guenther, 2015), molecular assess of systematics, taxonomy and biogeography of the genus Cavia (Dunnum and Salazar-Bravo, 2010); and differentiation of cryptic genetics differences in wild cavies (Trillmich et al., 2004); no complete genetic study has been carried out on the domestic guinea pig to understand the pattern of genetic variation in the Andean countries. Only one study has been
performed with small marker panel of microsatellites in Colombia (Burgos-Paz et al., 2011).
Microsatellite markers have been used, among others, for the characterization, genetic diversity and differentiation assessment, the reciprocal influence of the genetic relationships between one or more breeds’ populations on each other, paternity testing and kinship studies. Currently, it is also used as a tool for genetic differentiation between domestic species (Martínez et al., 2000).
In order to inquire about the genetic diversity and structure of seven domestic guinea pig populations reared in the four Andean countries; this study included one Spanish commercial population from an experimental population as an out-group. The aim of this work was to evaluate the diversity and genetic structure of guinea pig, using microsatellite markers, so as to undertake a program of genetic resources’ conservation.
MATERIALS AND METHODS Sample collection
Hair from the back part of 476 animals from four South American Andean countries were analyzed, 282 samples corresponded to the three different commercial lines: Andean (AND, 94), Inti (INTI, 94) and Peru (LPR, 94) (Chauca, 1997); these samples were obtained from ten Andean provinces from Ecuador: Carchi, Imbabura, Pichincha, Cotopaxi, Tungurahua, Bolivar, Chimborazo, Cañar, Azuay, and Loja. Samples from native Andean guinea pigs from currently guinea pig meat consuming countries were obtained: Ecuador (NTVE, 94), Colombia (COL, 17), Peru (PERU, 41) and Bolivia (BOL, 13) (Figure 1). As an out-group, 29 samples of guinea pig from Spain (SPAIN) were included, because there might be a genetic variation due to the adaptation of the environment of guinea pigs carried 500 years ago. All these native samples were obtained from the BIOCUY consortium, established within the
CONBIAND Network
(http://www.uco.es/conbiand/Bienvenida.html). Molecular marker analysis were carried out at the Applied Molecular Genetics laboratory from Animal Breeding Consulting Company S.L. (ABC) of the University of Cordoba, Spain.
Molecular Markers
The marker set was previously studied in Avilés et al. (2015). The final panel is listed in Table 1.
3
Figure 1. Geographical map of samples from Andean countries that consume guinea pig meat
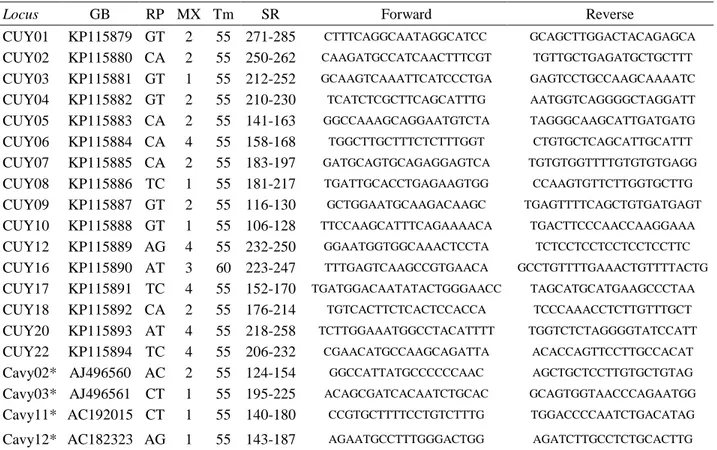
Table 1. General characteristics of microsatellites
Locus GB RP MX Tm SR Forward Reverse
CUY01 KP115879 GT 2 55 271-285 CTTTCAGGCAATAGGCATCC GCAGCTTGGACTACAGAGCA
CUY02 KP115880 CA 2 55 250-262 CAAGATGCCATCAACTTTCGT TGTTGCTGAGATGCTGCTTT
CUY03 KP115881 GT 1 55 212-252 GCAAGTCAAATTCATCCCTGA GAGTCCTGCCAAGCAAAATC
CUY04 KP115882 GT 2 55 210-230 TCATCTCGCTTCAGCATTTG AATGGTCAGGGGCTAGGATT
CUY05 KP115883 CA 2 55 141-163 GGCCAAAGCAGGAATGTCTA TAGGGCAAGCATTGATGATG
CUY06 KP115884 CA 4 55 158-168 TGGCTTGCTTTCTCTTTGGT CTGTGCTCAGCATTGCATTT
CUY07 KP115885 CA 2 55 183-197 GATGCAGTGCAGAGGAGTCA TGTGTGGTTTTGTGTGTGAGG
CUY08 KP115886 TC 1 55 181-217 TGATTGCACCTGAGAAGTGG CCAAGTGTTCTTGGTGCTTG
CUY09 KP115887 GT 2 55 116-130 GCTGGAATGCAAGACAAGC TGAGTTTTCAGCTGTGATGAGT
CUY10 KP115888 GT 1 55 106-128 TTCCAAGCATTTCAGAAAACA TGACTTCCCAACCAAGGAAA
CUY12 KP115889 AG 4 55 232-250 GGAATGGTGGCAAACTCCTA TCTCCTCCTCCTCCTCCTTC
CUY16 KP115890 AT 3 60 223-247 TTTGAGTCAAGCCGTGAACA GCCTGTTTTGAAACTGTTTTACTG
CUY17 KP115891 TC 4 55 152-170 TGATGGACAATATACTGGGAACC TAGCATGCATGAAGCCCTAA
CUY18 KP115892 CA 2 55 176-214 TGTCACTTCTCACTCCACCA TCCCAAACCTCTTGTTTGCT
CUY20 KP115893 AT 4 55 218-258 TCTTGGAAATGGCCTACATTTT TGGTCTCTAGGGGTATCCATT
CUY22 KP115894 TC 4 55 206-232 CGAACATGCCAAGCAGATTA ACACCAGTTCCTTGCCACAT
Cavy02* AJ496560 AC 2 55 124-154 GGCCATTATGCCCCCCAAC AGCTGCTCCTTGTGCTGTAG
Cavy03* AJ496561 CT 1 55 195-225 ACAGCGATCACAATCTGCAC GCAGTGGTAACCCAGAATGG
Cavy11* AC192015 CT 1 55 140-180 CCGTGCTTTTCCTGTCTTTG TGGACCCCAATCTGACATAG
Cavy12* AC182323 AG 1 55 143-187 AGAATGCCTTTGGGACTGG AGATCTTGCCTCTGCACTTG
GB: GenBank accession number; RP: microsatellite repeat motive; MX: polymerase chain reaction multiplex reaction where the locus amplified; Tm: annealing temperature of polymerase chain reaction; SR: size range in base pairs. * Selected Loci from Kanitz et al. (2009) and Asher et al. (2008)
4 Microsatellite analysis
Genomic DNA was extracted by incubating 3 hair roots in the presence of 100 L of 5% Chelex (Biorad, Göttingen, Germany) resin suspension at 95C for 15 minutes, 60C during 20 minutes and 99C for 3 min. Twenty microsatellite loci were amplified in four multiplex PCRs divided into three electrophoresis sets (Avilés et al., 2015). The PCR products were separated through electrophoresis using a 3130Xl Genetic Analyzer (Life Technology, Madrid, Spain), using a POP7 polymer and the internal size standard GeneScan500-Rox (Applied Biosystems, Carlsbad, CA, USA). The allelic typification was achieved through Genescan 3.1.2 and Genotyper 3 software packages (Applied Biosystems, Carlsbad, CA, USA).
Statistical analyses
Mean number of alleles, observed, and unbiased expected gene diversity estimates and their standard deviations were obtained with the MS Excel Microsatellite Toolkit software (Park, 2001) (Dublin, Ireland). The distributions of gene variability within and between breeds were studied through the analysis of F-statistics (Weir and Cockerham, 1984) as implemented in Genetix 4.05 (Belkhir et al., 2003) (Montpellier, France). The within-breed inbreeding coefficient (FIS) in each population was calculated
with a 95% confidence interval. Deviations from Hardy–Weinberg equilibrium (HWE) were assessed by means of using Genepop 3.4 software (Raymond and Rousset, 1995). To determine the structure and genetics differentiation among populations (South American and European), an analysis of molecular variance was performed (AMOVA), calculations were assessed with Arlequin 3.01 (Excoffier and Lischer, 2010) (Lausanne, Switzerland). Genetic distances were calculated (Reynolds et al., 1983) using Populations 1.2.28 software (Langella, 1999) (Boston, MA, USA).
A distance tree (NeighborNet) was developed from the obtained matrix DA of Nei et al. (1983) with Splits Tree4 software (Huson & Bryant, 2006) (Tübingen, Germany) to represent the relationships between breeds graphically, as well as to depict the evidence of admixture. The version 2.3.4 of Structure software (Pritchard et al., 2000) (Stanford, CA, USA) was used to identify the genetic structure, which identifies clusters of related individuals from multilocus genotypes and assigns individuals to identified clusters using a Bayesian algorithm based on the Markov chain Monte Carlo method. The analysis involves an admixture model with correlated allele frequencies. Eight independent runs were
conducted with 50,000 interactions during the burn-in phase and 1,000,000 interactions for sampling from K=2 to K=8. The Structure results in graphic representations were obtained with the program Distruct 1.1 (Rosenberg, 2004). The proportion of each individual genotype in each cluster or breed (q) and the probability of ancestry in other breeds were estimated.
RESULTS AND DISCUSSION Microsatellite markers
Over the past 40 years, guinea pigs have experimented an increase in their population size from the introduction of improved lines, but the reduction of native animals might be relevant for the future sustainable utilization and conservation of this important “mini livestock” species. All the 20 microsatellite markers used in this study were successfully amplified in all the populations. A total of 216 alleles, with a mean value of 10.80 ± 3.49, were found for the 20 analysed microsatellites loci. All the microsatellites were highly polymorphic with a minimum of 6 alleles (CUY06) and a maximum of 19 (Cavy12). To evaluate the present situation, we have genetically characterized the South American guinea pig population with the efficiency of microsatellite panel has been demonstrated by the large number of alleles detected for the whole population (10.8 ± 3.40) (Avilés et al., 2015), which was higher than the values found for Ivory Coast alleles, 5.98 ± 0.37, in creole guinea pigs by Kouakuo
et al. (2015); for Colombian alleles, 6.8 ± 1.64, in
domestic cavies (native line and unspecified commercial lines) by Burgos-Paz et al. (2011), and 7.4 alleles were found for Brazilian wild cavies, by Kanitz et al. (2009) and 10 Uruguayan alleles by Asher et al. (2008).
Breed diversity
The mean number of alleles for all the eight populations was high (8.67±2.65), ranging from a low 4.85 (SPAIN) to a high 11.15 (INTI). Overall genetic diversity was high (He = 0.733 ± 0.025). FIS values
were significantly different from zero and ranged between 0.072 and 0.327. All the breeds showed a significant heterozygosity deficit (0.153±0.091) as shown in Table 2. The diversity ratios, represented by heterozygosity, were high in all the South American populations. The SPAIN population obtained the lowest diversity (0.504). Kouakuo et al. (2015) in Ivory Coast, and Burgos-Paz et al. (2011) in Colombia showed a lower diversity than our study. Heterozygotes deficit was found in all the populations (FIS = 0.153). Kouakuo et al. (2015) and Burgos-Paz
5 (0.225 and 0.323) respectively. These indexes indicate high levels of genetic variability in South American population’s guinea pigs.
Genetic differentiation and population structure The values of FST (Table 3, above diagonal)
corresponding to the value of genetic differentiation by pairs of breeds, ranged from 0.006 (LPR vs INTI) to 0.2829 (BOL vs SPAIN). Reynolds’ pairwise genetic distance (Table 3, below diagonal) ranged
from 0.0012 (LPR vs INTI) to 0.3392 (BOL vs SPAIN). Reynolds’ pairwise genetic distance (Table 2, below diagonal) ranged from 0.0012 (LPR vs INTI) to 0.3392 (BOL vs SPAIN). The SPAIN population accounted for the greatest distance from all the guinea pig populations in this study. The FST
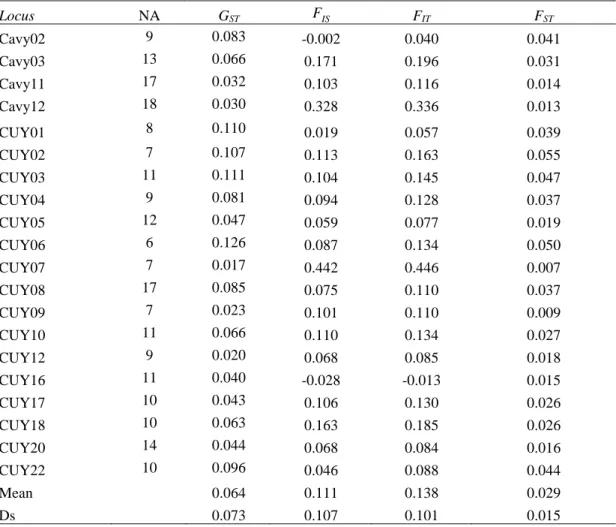
value (0.029) by Wright and GST value (0,064) by Nei shows that genetic differentiation between South America populations is very small (Table 4).
Table 2. Summary of the statistics for the eight populations’ genetic parameters
Pop N MNA He He Ds Ho Ho Ds Fis CI 95% HWE
AND 94 10.80 0.792 0.017 0.735 0.010 0.072 0.031 - 0.107 5* INTI 94 11.15 0.787 0.020 0.700 0.011 0.112 0.060 - 0.153 6* LPR 94 10.90 0.789 0.019 0.709 0.011 0.103 0.056 - 0.142 8* NTVE 94 10.90 0.797 0.019 0.697 0.011 0.127 0.072 - 0.178 9* PERU 41 8.50 0.761 0.020 0.707 0.016 0.072 0.005 - 0.114 4* BOL 13 5.45 0.694 0.032 0.474 0.031 0.327 0.098 - 0.457 10* COL 17 6.80 0.736 0.020 0.556 0.027 0.250 0.057- 0.371 8* SPAIN 29 4.85 0.504 0.051 0.424 0.021 0.162 0.035 - 0.261 4* Mean 59.5 8.67 0.733 0.025 0.625 0.017 0.153 0.052-0.233 6.75
The following estimates were obtained through averaging across the 20 microsatellites: sample size (N), mean number of alleles (MNA), expected (He) and observed (Ho) heterozygosity, within-breed deficit in heterozygosity (FIS) and the confidence interval, and the number of loci deviated from HWE proportions (HWE). Populations
abbreviations: AND: commercial line Andean, INTI: commercial line Inti, LPR: commercial line Peru, NTVE: Native Ecuadorean, PERU: Native Peruvian, BOL; Native Bolivian, COL: Native Colombian, SPAIN: out-group from Spain.
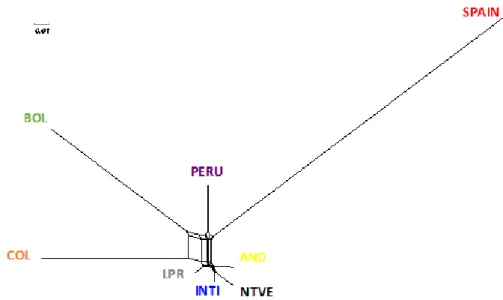
Figure 2. Neighbor-Net dendogram representing the Reynolds genetic distances between the eight studied populations.
6 These particular differentiations can be based on the great interchange of male and females without control and registration between Andean country markets.
This open reproduction system among the South American populations favours their migration (Figure 2).
Table 3. Estimated pairwise FST as a measure of genetic differentiation (above diagonal) and Reynolds
genetic distances (below diagonal).
Pop AND INTI LPR NTVE PERU BOL COL SPAIN
AND 0 0.0028 0.0013 0.0044 0.0182 0.0409 0.0212 0.1828 INTI 0.0033 0 0.0006 0.0023 0.0191 0.03196 0.0298 0.1822 LPR 0.0019 0.0012 0 0.0047 0.0155 0.0320 0.0236 0.1839 NTVE 0.0050 0.0030 0.0054 0 0.0264 0.0476 0.0223 0.1825 PERU 0.0190 0.0202 0.0165 0.0278 0 0.0379 0.0425 0.1979 BOL 0.0440 0.0355 0.0340 0.0521 0.0420 0 0.0594 0.2829 COL 0.0236 0.0330 0.0265 0.0255 0.0465 0.0718 0 0.2530 SPAIN 0.2029 0.2026 0.2046 0.2032 0.2224 0.3392 0.2966 0
AND: commercial line Andina, INTI: commercial line Inti, PLR: commercial line Peru, NTVE: Ecuador's native, PERU: Peru's native, BOL: Bolivia's native, COL: Colombia's native and SPAIN out-group from Spain.
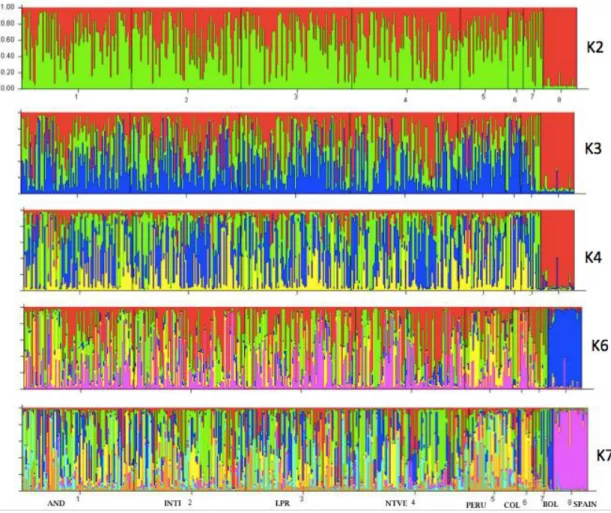
7 The same way we can appreciate that between Andean populations we cannot find a clear population structure (Figure 3). The interesting trade started from the first settlers of South America which began to venture into new territories creating a trade route that began on the coasts of Ecuador and Peru with the trade of Spondilus or Mullu shell (Spondilus calcyfer) extended by the Pacific Ocean to Michoacan in Mexico to the north, crossing Central America, Colombia, Ecuador, Peru, and Bolivia (Hocquenghem, 2009), during these trips according to Sthal and Norton (1984) guinea pigs and ducks were transported to feed the crew and exchange with the pre-Columbian people. Thus, the inter-trade route, which persists to this day, was established. In the
works of Burgos- Paz et al. (2011) and Kouakuo et al. (2015) neither observed genetic structure in the populations studied
The Neighbor-Net dendogram is presented in Figure 2. The tree shows the populations from Ecuador (AND, INTI, LPR and NTVE) clustered in the same branch; COL, PERU and BOL appeared in separate clusters, while the out-group from Spain showed the greatest distance and the longer branch when comparing it to the studied South America populations. This Neighbor-Net dendogram shown the guinea pigs in the Andean population seem to have had a common origin in one single branch as showed in the studies realized by Spotorno (2004, 2006, 2007).
Table 4. Values of the coefficient of genetic variation (GST) and F statistics (FIS, FIT y FST).
Locus NA GST FIS FIT FST Cavy02 9 0.083 -0.002 0.040 0.041 Cavy03 13 0.066 0.171 0.196 0.031 Cavy11 17 0.032 0.103 0.116 0.014 Cavy12 18 0.030 0.328 0.336 0.013 CUY01 8 0.110 0.019 0.057 0.039 CUY02 7 0.107 0.113 0.163 0.055 CUY03 11 0.111 0.104 0.145 0.047 CUY04 9 0.081 0.094 0.128 0.037 CUY05 12 0.047 0.059 0.077 0.019 CUY06 6 0.126 0.087 0.134 0.050 CUY07 7 0.017 0.442 0.446 0.007 CUY08 17 0.085 0.075 0.110 0.037 CUY09 7 0.023 0.101 0.110 0.009 CUY10 11 0.066 0.110 0.134 0.027 CUY12 9 0.020 0.068 0.085 0.018 CUY16 11 0.040 -0.028 -0.013 0.015 CUY17 10 0.043 0.106 0.130 0.026 CUY18 10 0.063 0.163 0.185 0.026 CUY20 14 0.044 0.068 0.084 0.016 CUY22 10 0.096 0.046 0.088 0.044 Mean 0.064 0.111 0.138 0.029 Ds 0.073 0.107 0.101 0.015
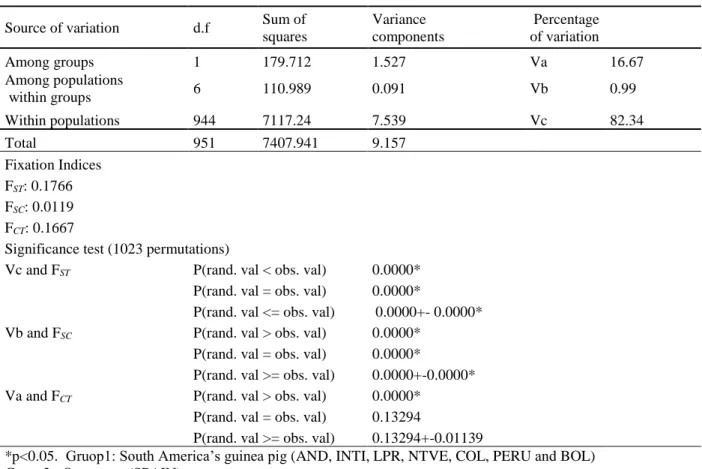
AMOVA results (Table 5) indicated the differentiation between breeds was significant (16.67%), when all the South American population (or group one) and the out-group (SPAIN) (or group two) were considered. AMOVA and Structure analysis confirmed the general features observed in the Neighbor-Net dendogram. The results indicate
that, the Spain population represented the highest differentiation (16.67%) and showed the population structure. This differentiation began with the discovery of America; the colonists took guinea pigs to Europe, where they quickly became popular as exotic pets among the upper classes and royalty, including Queen Elizabeth I (Morales, 1995). In
8 Europe and USA, guinea pigs are considered pets, so that, Cavy clubs and associations devoted to showing and breeding guinea pigs have been established worldwide. Data Bayesian analysis through Structure
program (Pritchard et al., 2000) revealed no clear population structure in South American guinea pigs, while the out-group from Spain presented a clear separation as shown in Figure 3.
Table 5. Genetic variation of domestic guinea pigs between the populations of South America and Spain.
Source of variation d.f Sum of
squares Variance components Percentage of variation Among groups 1 179.712 1.527 Va 16.67 Among populations within groups 6 110.989 0.091 Vb 0.99 Within populations 944 7117.24 7.539 Vc 82.34 Total 951 7407.941 9.157 Fixation Indices FST: 0.1766 FSC: 0.0119 FCT: 0.1667
Significance test (1023 permutations)
Vc and FST P(rand. val < obs. val) 0.0000*
P(rand. val = obs. val) 0.0000*
P(rand. val <= obs. val) 0.0000+- 0.0000*
Vb and FSC P(rand. val > obs. val) 0.0000*
P(rand. val = obs. val) 0.0000*
P(rand. val >= obs. val) 0.0000+-0.0000*
Va and FCT P(rand. val > obs. val) 0.0000*
P(rand. val = obs. val) 0.13294
P(rand. val >= obs. val) 0.13294+-0.01139
*p<0.05. Gruop1: South America’s guinea pig (AND, INTI, LPR, NTVE, COL, PERU and BOL) Gruop2: Out-group (SPAIN)
CONCLUSION
This study has shown the guinea pigs in the Andean population seem to have had a common origin in one single branch. Over all, the results indicate the population of Latin American guinea pigs has a high genetic variability and poor population structure. The results suggest that it is necessary to take urgent measures to prevent the further genetic erosion of native guinea pigs from Andean countries. We should design and implement recovery and conservation plans for native andean guinea pigs to prevent the loss of this autochthonous genetic resource from South America. On the other hand, the comercial lines do not seem to have a clear population structure, needing to improve their marketing channel by genetically defining these popuations, without affecting the native ones.
REFERENCES
Asher, M., Lippmann, T., Epplen, J. T., Kraus, C., Trillmich, F., Sachser, N. 2008. Large males
dominate: ecology, social organization, and mating system of wild cavies, the ancestors of the guinea pig. Behav Ecol Sociobiol 62: 1509-1521. Doi: 10.1007/s00265-008-0580-x
Avilés, D., Martínez, M. A., Landi, V., Delgado J. V. 2014. El cuy (Cavia porcellus). Un recurso andino de interés agroalimentario. Recursos Genéticos Animales 55: 87-91. Doi: https://doi.org/10.1017/S2078633614000368 Avilés, D., Landi, V., Delgado J. V., Vega-Pla, J. L., Martínez, M. A. 2015. Isolation and characterization of dinucleotide microsatellite set for a parentage and biodiversity study in domestic guinea pig (Cavia porcellus). Italian Journal of Animal Science. 14(3960): 615-620pp. Doi: http://dx.doi.org/10.4081/ijas.2015.3960 Belkhir, K., Borsa, P., Chikhi, L., Raufaste, N.,
Bonhomme, F. 2003. Genetix: 4.05 Logiciel sous WindowsTM pour la genetique des
9 populations, In: U. d. Montpellier Ed. Montpellier, France.
Burgos-Paz, W., Ceron-Muñoz, M., Solarte-Portilla, C. 2011. Genetic Diversity and Population Structure of the Guinea pig (Cava porcellus, Rodentia, Caviidae) in Colombia. Genet. Mol. Biol. 34 (4): 711-718. Doi: 10.1590/S1415-47572011005000057 Brust V., Guenther A. 2015. Domestication effects on
behavioural traits and learning performance: comparing wild cavies to guinea pigs. Animal Cognition 18(1): 99-109. Doi: 10.1007/s10071-014-0781-9
Chauca, L. 1997. Producción de cuyes (Cavia
porcellus). FAO, Roma, Italia, Pp.77.
Dunnum, J. L., Salazar-Bravo, J. 2010. Molecular systematics, taxonomy and biogeography of the genus Cavia (Rodentia: Caviidae). J Zool Syst Evol Res 48(4): 376-388. Doi: 10.1111/j.1439-0469.2009.00561.x
Excoffier, L., Lischer, H. E. 2010. Arlequin suite ver 3.5: a new series of programs to perform population genetics analyses under Linux and Windows. Molecular Ecology Resources 10: 564-567.
Guerrini, A. 2003. Experimenting with humans and animals: from Galen to animal rights. Johns Hopkins University Press, Baltimore, MD, USA. Pp. 165.
Hocquenghem, A. M. 2009. El Spondylus princeps y la edad de bronce de los Andes centrales. Congreso Internacional de Americanistas. ICA.Pp. 53.
Huson, D. H., Bryant, D. 2006. Application of Phylogenetic Networks in Evolutionary Studies. Mol Biol Evol 23: 254-267. Doi: 10.1093/molbev/msj030
Instituto Nacional de Innovación Agraria. 2005. Generación de Líneas Mejoradas de Cuyes
de Alta Productividad.
http://www.inia.gob.pe/images/AccDirectos/
publicaciones/cuyes/doc/INIA-INCAGRO2005.pdf
Kanitz, R., Trillmich, F., Bonatto, S. L. 2009. Characterization of new microsatellite loci for the South-American rodents Cavia
aperea and C. magna. Conservation Genet
Resour 1: 47–50. Doi: 10.1007/s12686-009-9011-1
Kouakou, P. K., Skilton, R., Apollinaire, D., Agathe, F., Beatrice, G., Clément, A. S. 2015. Genetic diversity and population structure of cavy (Cavia porcellus L) in three agro ecological zones of Côte d'Ivoire. International Journal of Agronomy and Agricultural Research 6: 27-35.
http://www.innspub.net/wp- content/uploads/2015/03/IJAAR-V6No3-p27-35.pdf
Langella, O. 1999. Populations. Boston. http://bioinformatics.org/populations/. Maass, B. L., Chauca, L., Wanjiku Ch., Sere, C.
2016. From “cuy” South Ameria to cavy in Sub-Sahara Africa: advancing development through South- South coopetarion. Conference: Tropentag” Solidarity in a competing world-fair use of resources.18-21 September, BoKU, Vienna, Austria. URL: http://www.tropentag.de/abstract.php? code=Fj4wN4Am
Manjeli, Y., Tchoumboue, J., Njwe, R. M., Teguia, A. 1998. Guinea-pig productivity under traditional management. Trop. Anim. Health
Pro. 30:115-122. Doi:
10.1023/A:1005099818044
Martínez, A. M., Delgado, J. V., Rodero, A. Vega-Pla, J. L. 2000. Genetic structure of the Iberian pig breed using microsatellites. Animal Genetics. 31(5): 295-301.
Matthiesen, T., Nyamete, F., Msuya, J. M., Maass, B. L. 2011. Importance of guinea pig husbandry for the livelihood of rural people in Tanzania: a case study in Iringa region. http://www.tropen-
tag.de/2011/abstracts/links/Matthiesen_ll Ddf2DY.pdf
Morales, E. 1995. The guinea pig: Healing, food, and ritual in the Andes. Pp. 177.
Nei, M., Tajima, F., Tateno, Y. 1983. Accuracy of estimated phylogenetic trees from molecular data. II. Gene frequency data. J Mol Evol. 19 (2):153-170
Park, S. D. E., 2001. Trypanotolerance in west african cattle and the population genetics effects of selection. Ph.D. dissertation, University of Dublin.
Pritchard, J. K., Stephens, M., Donnelly, P. 2000. Inference of Population Structure Using Multilocus Genotype Data. Genetics 155 (2):
10 945-959.
http://www.genetics.org/content/155/2/945 Raymond, M., Rousset, F. 1995. GENEPOP:
Population genetics software for exact test and ecumenicism. J. Hered., 86, 248–249. Reynolds, J., Weir, B. S., Cockerham, C. C. 1983.
Estimation of the coancestry coefficient: Basis for a short-term genetic distance.
Genetics 105(3): 767-769.
Rosenberg, N. A. 2004. DISTRUCT: a programme for the graphical display of population structure. Mol Ecol Notes.4:137-138. Doi: 10.1046/j.1471-8286.2003.00566.x
Spotorno, A. E., Valladares, J. P., Marín, J. C., Zeballos, H. 2004. Molecular diversity among domestic guinea-pigs (Cavia
porcellus) and their close phylogenetic
relationship with the Andean wild species Cavia tschudii. Rev Chil Hist Nat 77: 243– 250. Doi: http://dx.doi.org/10.4067/S0716-078X2004000200004
Spotorno, A. E., Marín, J. C., Manríquez, G., Valladares, J. P., Rico, E., Rivas C. 2006. Ancient and modern steps during the domestication of guinea pigs (Cavia
porcellus L.). J Zool. 270: 57–62. Doi:
10.1111/j.1469-7998.2006.00117.x
Spotorno, A. E., Manriquez, G., Fernandez, L. A., Marín, J. C., Gonzalez, F., Wheeler, J. 2007. Domestication of guinea pigs from a southern Peru-northern Chile wild species and their middle Pre-Columbian mummies. In: Kelt DA, Lessa EP, Salazar-Bravo J,
Patton JL. Ed. The Quintessential Naturalist: Honoring the Life and Legacy of Oliver P. P. Pearson. Univ Cal Pubs Zool, Berkeley, Los Angeles, and London. Pp. 1-981. Doi: http://dx.doi.org/10.1525/california/9780520 098596.003.0014
Stahl, P., Norton, P. 1984. Animales domésticos y las implicaciones del intercambio precolombino desde Salamago, Ecuador. Miscelánea Antropológica Ecuatoriana 4: 83-92. Trillmich F., Kraus C., Künkele J., Asher M., Clara
M, Dekomien G., Epplen J. T., Saralegui A.,
Sachser N. 2004. Species-level
differentiation of two cryptic species pairs of wild cavies, genera Cavia and Galea, with a discussion of the relationships between social systems and phylogeny in the Caviinae. Canadian Journal of Zoology 82(3): 516-524. https://doi.org/10.1139/z04-010
Weir, B. S., Cockerham, C. C. 1984. Estimating F-statistics for the analysis of population structure. Evolution 38: 1358-1370. Doi: 10.2307/2408641
Wing, E. S. 1986. D9omestication of Andean mammals. En: F. Vuilleumier & M. Monasterio. Eds., High altitude tropical biogeography, pp. 246-264. Oxford University Press y American Museum of Natural History, Oxford
Zumárraga, S. 2011. Invovaciones Gastronómicas del cuy. Imbabura desde:
http://repositorio.utn.edu.ec/handle/1234567 89/1139