UNIVERSITÀ DEGLI STUDI DI FOGGIA
DIPARTIMENTO DI SCIENZE MEDICHE E CHIRURGICHE
Dottorato di Ricerca in Immunoreumatologia ed Oncologia Clinica e
Sperimentale, Bioetica ed Epidemiologia dei Tumori
XXVIII CICLO
CORDINATORE: Prof. Francesco Paolo CANTATORE
_____________________________________________________
DELIVERY OF SMALL INTERFERING RNA INTO AIRWAY
EPITHELIAL CELLS
DOWN OF THE REGULATION PRO-INFLAMMATORY
CYTOKINE HIGH MOBILITY GROUP BOX 1
RELATORE:
Prof. Massimo
CONESE
CORRELATORE
Dottor Sante
DI GIOIA
DOTTORANDA:
Dott.ssa Giuliana
BELGIOVINE
_____________________________________________
II INTRODUCTION
1.1 Nucleic acid -based drugs 1
1.2 Nanocomplexes for gene delivery to the lung 4
1.3 Cationic polymers used in this study 6
1.3.1.Polyaminoacidic polymers 6
1.4 High-mobility group box 1 7
1.4.1.Involvement of HMGB1 in chronic lung diseases 10
AIM OF THE STUDY MATERIALS AND METHODS 3.1 Polymers 14
3.2 siRNA 14
3.3 Dynamic light scattering measurement and zeta potential analysis 15 3.4 Gel retardation assay 15
3.5 Cell lines 16
3.6 Trasfections 17
3.7 Epifluorescence 18
3.8 Flow cytometry 18
3.9 Real time quantitative polymerase chain reaction 19
3.10 Immunoprecipitation and Western blotting 19
3.11 MTT assay 20
3.12 Stimulation of cells with LPS 21
3.13 Proliferation assay 22
3.14 Cell cycle analysis 22
3.15 Statistical analysis 23
RESULTS AND DISCUSSION 4.1 Complexation of cationic polymers with nucleic acids 24
4.2 Biophysical characterization of complexes formed with siRNAs 26
4.3 Evaluation of HMGB1 mRNA levels in airway ephitelial cell lines 29
4.5 Entry of siRNA complexes into cells 30
III
4.7 Down regulation of HMGB1 mRNA 35
4.8 Cell toxicity with siRNA complexes 40
4.9 LPS stimulation of H441 cells 41
CONCLUSIONS AND FUTURE PERSPECTIVES 49
REFERENCES 50
1
1. INTRODUCTION
1.1. Nucleic acid-based drugs
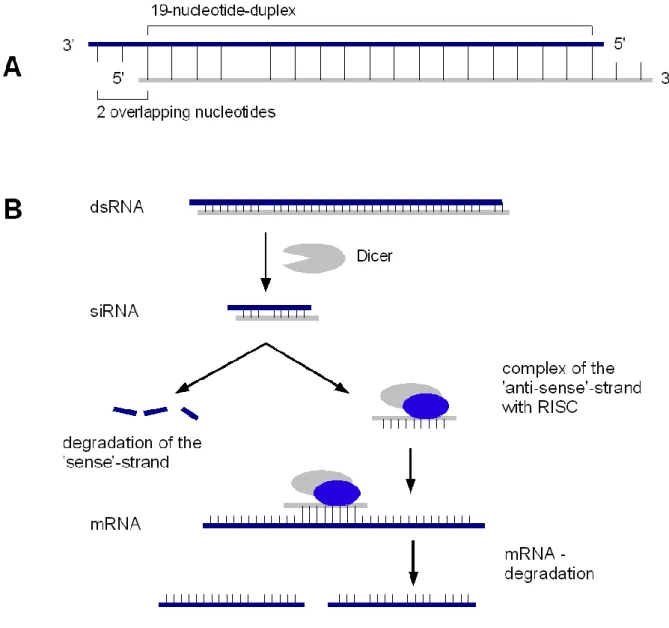
Nucleic Acid-based drugs (NABDs) are a novel class of pharmaceuticals including small interfering RNA (siRNA) and aptamers (Pestourie et al. 2005; Durcan et al. 2008). Both aptamers and siRNAs are oligonucleotides but their activity is different: aptamers are generally applied to inhibit extracellular molecules whereas siRNAs has to enter cells to exert their gene silencing activity. In the last years, RNA interference (RNAi) has been shown as a powerful tool for post-transcriptional gene silencing (Fujita et al. 2013) and has opened new avenues in gene therapy. A siRNA molecule is a 19-21 basepair RNA core duplex that is followed by a 2 nucleotide 3’ overhang on each strand (Figure 1A).siRNA most notable role in the cells is in the RNAi pathway, where it interferes with the expression of specific genes with complementary nucleotide sequences. siRNA functions by causing mRNA to be degraded after transcription, resulting in no translation. The Dicer enzyme catalyzes production of siRNAs from long dsRNAs; in alternative siRNAs can be introduced ito cells by transfection. The activity of siRNAs in RNAi is largely dependent on its binding ability to the RNA-induced silencing complex (RISC). Binding of the duplex siRNA to RISC is followed by unwinding and cleavage of the sense strand with endonucleases through the activity of Ago-2. The remaining anti-sense strand-RISC complex can then bind to target mRNAs, so that Ago-2 then cleaves the target mRNA, resulting in mRNA degradation and gene silencing (Figure 1B).
2
Figure 1. A) Schematic structure of a siRNA molecule. B) Pathway of generation of siRNAs:
upon loading onto RISC, while the sense strand is degraded by endonucleases, the anti-sense strand mediates the degradation of the target mRNA.
However, its application and development in the medical field is currently limited by the lack of optimal delivery systems (Grassi et al. 2010). Indeed, entry of siRNAs into the cells is hampered by their high molecular weight and their negative charges on the phosphate groups which interact with negative phospholipids of the plasma membrane (Raemdonck et al. 2008). Moreover, once entered in the cytosol, naked siRNAs are rapidly degraded by intracellular
3 nucleases (Mantei et al. 2008). Therefore, siRNAs require an appropriate vector to
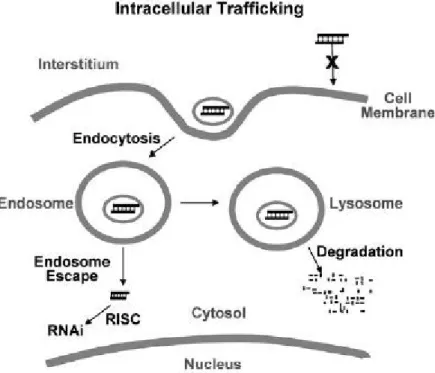
trespass the plasma membrane, evade nuclease degradation, and finally exert their activity. The major mode of internalization is endocytosis, whereby the drug molecules are internalized together with a component of the cell membrane (Figure 2). Coating of carriers with ligands and antibodies can promote the carrier-specific binding to cell membrane. The positively charged siRNA–carrier complex interacts with anionic proteoglycans on the cell surface, forms an endocytic vesicle, and enters the cells by endocytosis (Wang et al. 2010).
Figure 2. Cellular barriers to siRNA internalization. Barriers to cellular internalization are
dependent on the surface properties of siRNA and carriers (e.g., charge, pegylation, and specific binding antigen). The major barriers for delivering siRNA to its site of action are the endosomal entrapment and the lysosomal degradation of siRNA and carriers. Form Wang et al., The AAPS Journal, 2010.
4
1.2. Nanocomplexes for gene delivery to the lung
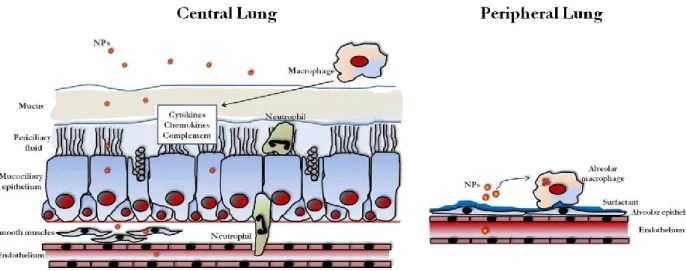
The lung represents a proper target for gene therapy for the purpose to treat various lung diseases, such as inherited monogenic disorders, acquired chronic lung diseases, such as asthma and chroncic obstructive pulmonary disease, or bronchial tumors. There have been major advances in the understanding of the molecular pathogenesis of pulmonary diseases in past decades. However, effective translation of this knowledge into viable gene-based therapies and realization of their clinical potential is yet to be achieved. The many barriers that the gene therapy vectors encounter in the airways are a difficult hurdle to be overcome (Figure 3).
Figure 3. Overview of the barriers encountered by gene-therapy vectors in the lung.Nanoparticles
(NPs) encounter different barriers in the central and peripheral airways because the lung has evolved innate mechanisms of defence in order to limit access of foreign particles. NPs must cross the airway and the pulmonary epithelium in order to reach the underlying tissues or the systemic circulation overcoming the mucus layer and the mucociliary clearance in the airways and the surfactant as well as the phagocytosis mediated by alveolar macrophages in the peripheral lung. Neutrophils represent additional barriers and sentinels for the innate and adaptive immune systems in airways, such as cytokines, chemokynes and complement. The nanometre size of NPs may enable to avoid the clearance by macrophages allowing transcytosis and the treatment of the submucosa, while crossing of the endothelium allows systemic treatment. From Di Gioia et al., Pulm Pharmacol Ther. 2015.
5 Moreover, speaking of the delivery of plasmids, the performance of a gene
delivery system is influenced both by transgene expressionand by reaching the correct target site in the lung. Indeed, many efforts have been made so as to improve gene delivery performances, such as considering the use of specific targeting ligands into the vector, in order to optimize gene delivery to the appropriate target cells and reduce the total dose of vector required. Similar hurdles hold for delivery of siRNAs to the lung cells (Merkel and Kissel 2012; Ramsey et al. 2013).
Gene delivery to the lung can be obtained by using two classes of non-viral vectors, so that polycations and cationic lipids have been applied in order to transfer gene to the lungs (Davis and Cooper 2007). Both classes are quite efficient as gene transfer agents, but possess both a poor targeting capacity and, particularly liposomes, a significant toxicity (Ruiz et al. 2001). Therefore, targeting is supposed to increase efficiency in face of reduced toxicity. Targeting strategies aimed at increasing gene transfer efficiency in airway and respiratory epithelial cells in vitro and in vivo are: 1) Ligand and physical targeting can direct therapeutic gene expression in specific cell types in the respiratory tract; 2) Mucopenetrating NPs are endowed with promising features to be useful in treating respiratory diseases and should be now advanced in pre-clinical trials (Di Gioia et al. 2015a). Along with these studies, the finding and optimization of biocompatible polymers and lipids is an actual goal of the ongoing research.
6
1.3. Cationic polymers used in this study
1.3.1. Polyaminoacidic polymers
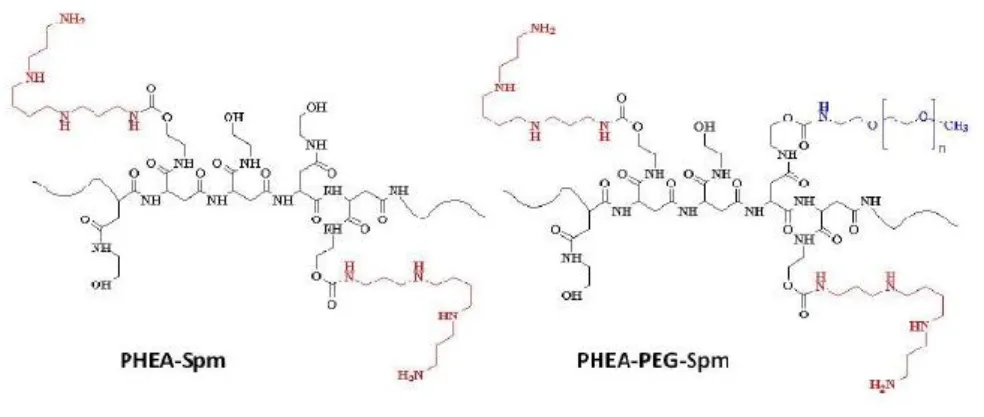
Co-polymers based on the cationic polymer poly(N-2-hydroxyethyl)-DL-aspartamide (PHEA) were obtained from Prof. Gennara Cavallaro, Dipartimento di Scienze e Tecnologie Biologiche, Chimiche e Farmaceutiche (STEBICEF), University of Palermo, Italy. PHEA-Spm and PHEA-PEG-Spm copolymers (Figure 4) were produced starting from PHEA by one or two synthetic steps respectively.
Figure 4. Graphical representation of the chemical structure of PHEA-Spm and PHEA-PEG-Spm.
Spermine was used as molecule to be linked to PHEA, in order to obtain the polycationic PHEA-Spm copolymer, considering that this oligoamine when grafted by one terminal amino groups to PHEA by urethanic linkage, maintains three free amino groups (one primary and one secondary) that are protonated at physiological pH (pH 7.4-7.5). The amount of spermine linked to PHEA, determined by 1H NMR, was about 28%. PHEA-PEG-Spm copolymer was
obtained by grafting spermine to PHEA-PEG copolymer, containing an amount of PEG chains at a molecular weight of 2000 Da of 2 mol% (Cavallaro et al. 2010).
7 Molecular characteristics of PHEA-Spm and PHEA-PEG-Spm are reported in
Table 1.
1.3.2. Chitosan- N-acetyl-cysteine (NAC)
Chitosan-NACwasobtained from Prof. Giuseppe Trapani and Prof. Adriana Trapani, Dipartimento di Farmacia – Scienze del Farmaco, University of Bari, “Aldo Moro”, Italy. Chitosan was condensed with NAC in order to achieve better mucoadhesion. In fact, according to recent findings in the literature, thiolated polymers (namely thiomers) are able to increase the interactions with mucous substrates due to the formation of disulphide linkages with cysteine residues in the mucine backbones (Trapani et al. 2014). In this context, some experiments were also carried out to obtain mucoadhesive nanoparticles based on Chitosan-NAC able to deliver dopamine to the striatum (Di Gioia et al. 2015b).
1.4. High-mobility group box 1
High-mobility group box 1 (HMGB1), originally identified as a nuclear nonhistone protein with DNA-binding domains, can be secreted by cells and now regarded as an important endogenous danger signaling molecule. Besides as a
8 signal of tissue injury, HMGB1 is considered a mediator of inflammation and
high levels of HMGB1 are found in various inflammatory conditions such as sepsis, cystic fibrosis and rheumatoid arthritis (Wang et al. 2001; Taniguchi et al. 2003; Karlsson et al. 2008; Rowe et al. 2008).
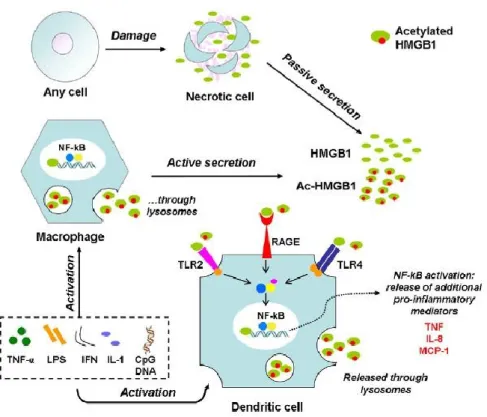
From the beginning, HMGB1 has been considered as a late mediator of the systemic inflammatory response syndrome (SIRS) and it has been foundalsoelevatedin bacterial sepsis and hemorrhagic shock (Wang et al. 1999; Abraham et al. 2000; Kim et al. 2005). Unde rnon pathological conditions, HMGB1 serves as a transcription factor that is expressed in the nucleus of a wide variety of cell types (Musumeci et al. 2014). In pathological conditions, HMGB1 can be released by dying cells or actively secreted (Figure 5). In inflammatory states, HMGB1 is released into the extracellular environment by stimulated macrophages through a non-classical pathway (Gardella et al. 2002; Bonaldi et al. 2003), activating acute inflammation through Toll-like receptor (TLR)-2, TLR-4, and receptor for advanced glycationend products (RAGE)(Bonaldi et al. 2003; Park et al. 2004; Lotze and Tracey 2005). HMGB1 is also released by cells undergoing necrosis (Scaffidi et al. 2002), a mechanism proposed to explain its effects on perpetuating systemic inflammation in conditions in which cell death is prominent (Wang et al. 2004), although release during apoptosis has also been reported (Bell et al. 2006). Resting, non-activated inflammatory cells, such as monocytes or macrophages, contain HMGB1 in their nuclei. When these cells are activated by lipopolysaccharide (LPS) or inflammatory cytokines, they translocate and exocytose nuclear HMGB1 into the cytoplasm. Extracellular HMGB1 then reaches responsive cells, either by diffusion in adjacent areas or via the blood stream to more distant compartments, thus activating the inflammatory cascade. We have already known that acetylation of HMGB1 on certain lysine residues
9 promotes relocation by preventing nuclear re-entry from the cytoplasm, a
prerequisite for extracellular secretion (Bonaldi et al. 2003).
Figure 5. HMGB1 is a multi-functional regulator: intracellularly, it acts as a chromatin-binding
factor. It can be passively released by damaged or virus-infected cells, or actively secreted by innate immune cells in response to exogenous bacterial products (e.g. endotoxin or CpG-DNA) or endogenous inflammatory stimuli (e.g. TNF or IFN-γ). Extracellular HMGB1 acts on its target receptors (TLR-2, -4, and RAGE) leading to nuclear translocation of transcription factors (e.g. NF-kB) and subsequent activation of the release of additional proinflammatory mediators. Form Musumeci et al., Pharmacology & Therapeutics, 2014.
Extracellular HMGB1 has pleomorphic effects on multiple organs in models of sepsis and shock including activation of nuclear factor (NF)-B, diffuse endothelial activation, pulmonary inflammation reminiscent of the adult respiratory distress syndrome, hepatocellular injury, and systemic activation of inflammatory cells (Sappington et al. 2002; Wang et al. 2004; Lotze and Tracey 2005). As already said above, HMGB1 kinetics in sepsis indicates its role as a late inflammatory mediator, increasing only after tumor necrosis factor (TNF)- and
10 IL-1 have peaked (Wang et al. 2004), making it an attractive therapeutic target.
Inhibitors of the inflammatory activities of HMGB1 have been efficacious in animal models (Yang et al. 2004; Ogawa et al. 2006; Suda et al. 2006; Yang et al. 2006), and are currently in preclinical development.
1.4.1. Involvement of HMGB1 in chronic lung diseases
Previous studies defining the role of HMGB1 in the lung have included acute inflammatory states, such as in hemorrhage andseptic shock, and an animal model of ventilator-induced lung injury, as well as induction of an adult respiratory distress syndrome–like phenotype after direct instillation (Abraham et al. 2000; Ogawa et al. 2006). These studies have outlined that HMGB1 is an inflammatory mediator in lung pathologies (Ding et al. 2013), and exerts its effects either directly (Andersson et al. 2000) or through the production of other inflammatory mediators (Wang et al. 2001; Yang et al. 2002). HMGB1 can modulate the inflammatory response in the airway diseases by inducing MUC8 expression in airway epithelial cells (Kim et al. 2012) and mediating cytokine production via TLR4 in acute lung injury (Deng et al. 2013).
Cystic fibrosis (CF) and chronic obstructive pulmonary disease (COPD), which are two important chronic lung disease, show a prominent neutrophilic inflammatory response (Cohen and Prince 2012). To evaluate the potential role of HMGB1 in CF lung disease, Rowe et al. (2008) examined expression levels and the biological activity of HMGB1 in samples derived from patients with CF and froma murine model of CF lung disease (Scnn1b-transgenic [Scnn1b-Tg] mouse) characterized by chronic neutrophilic inflammation and airway mucus obstruction (Mall et al. 2004). They found increased expression of HMGB1 in human subjects
11 with CF and inScnn1b-Tg mice, and demonstrated its pathogenic role as a
neutrophil chemoattractant through a CXCR2-dependent pathway. Further, intratracheal instillation of HMGB1 in mice induced significant airway neutrophilia and was accompanied by lung matrix degradation, as evidenced by the production of proline-glycine-proline (PGP), a bioactive collagen degradation product that also directly activates neutrophils through CXCR receptors (Weathington et al. 2006). It can hypothesized that neutrophil influx by HMGB1 through CXCR2 and activation mediated through the NF-B pathway may contribute to the release of bioactive enzymes, including neutrophil elastase and matrix metalloproteinase 8 and 9, each previously reported to be present in neutrophils highly active in the CF lung (Sagel et al. 2005; Gaggar et al. 2007). Collagen degradation induced by activation of innate immunity in the inflamed airway results in liberation of PGP. Combined with HMGB1, release of this peptide fragment provides a positive feedback mechanism that contributes to persistent neutrophilic inflammation in the CF lung.
The concentrations of HMGB1 in asthmatic and COPD (chronic obstructive pulmonary disease) patients positively and significantly correlated with neutrophils counts and percentage of neutrophils in sputum (Hou et al. 2011). In another study, it has been demonstrated that HMGB1 neutralizing antibody attenuates neutrophilic inflammation in vivo by using a murine model of neutrophilic asthma induced by ovalbumin plus lipopolysaccharide (Zhang et al. 2014). However, the role of HMGB1 in respiratory diseases is still elusive but nevertheless these studies suggest an involvement of this cytokine in their pathogenesis.
12
2. AIM OF THE STUDY
The aim of this study was that to compare three different cationic polymers as delivery systems for siRNA into airway epithelial cells and to down-regulate efficiently the pro-inflammatory cytokine HMGB1.
In the field of biocompatible synthetic polymers, PHEA has been used as drug carrier in the synthesis of macromolecular conjugates polymeric (Cavallaro et al. 2004a; Cavallaro et al. 2004b; Cavallaro et al. 2006b), starting polymer for the synthesis of polymeric micelles (Caliceti et al. 2001; Cavallaro et al. 2003; Cavallaro et al. 2004c; Salmaso et al. 2008), hydrogels (Pitarresi et al. 2007; Casadei et al. 2008) and polycations for gene therapy (Cavallaro et al. 2006a; Licciardi et al. 2006; Cavallaro et al. 2009). However, considering that PHEA-copolymers bearing permanently positive charged groups in general showed a great condensing ability, excellent biocompatibility, but a not high DNA release capability, oligoamines (such as spermine), bearing amino groups protonable at physiological conditions, have been chosen to prepare PHEA copolymers in order to better modulate the DNA release (Cavallaro et al. 2008; Cavallaro et al. 2010).
During the last decade, increasing attention has been paid to the development of muchoadesive polymers, irrispective of their natural or semisynthetic origin. Such polymers can be suitable for transmucosal administration because they provide an intimate contact with mucosa, so prolonging the interaction with absorption sites. Overall, muchoadesive polymers have been exploited for low molecular weight agent delivery and also for high molecular weight substances, such as nucleic acids and proteins. Among the most promising polymers for mucoadhesion, chitosan (CS) and its derivatives have shown excellent performances both in vitro and in vivo. However, it is well known that CS possesses a pKa value around 6.5
13 and, therefore, it is not soluble at physiological pH values. To bypass such
limitation, an interesting approach consists of the sinthesys of thio-derivatives of CS, namely thiomers, which combine both solubilization at physiological pH values and important mucoadhesive properties. In the area of sucht hiomers, the CS-N-acetylcisteyne derivative (CSNAC) and the CS-glutathionyl derivative (CSGSH) were also obtained and the results of the use of CSNAC are mentioned in this thesis. Additionally, both CSNAC and CSGSH were obtained with the idea in mind to formulate a novel thiomer where the “thio-moiety” was endowed of antioxidant activity in order to reinforce other mechanisms of action of drugs adminstered in the presence of such thiomers.
14
3. MATERIALS AND METHODS
3.1. Polymers
The synthesis of α,β-poly(N-2-hydroxyethyl)-co-[N-2-(spermidylcarbamate) ethylen]-D, L-aspartamide derivative (PHEA-Spm and PHEA-PEG-Spm) have been previously described (Cavallaro et al. 2008; Cavallaro et al. 2010).
The synthesis of chitosan-NAC was as follows: In a flask, a solution of CS 10 mg/mL was prepared in 0.2 mM of HCl and the pH was adjusted to 6 in the presence of 1 M of NaOH. In a separate flask, 141 mg of EDAC (N-(3-Dimethylaminopropyl)-N′-ethylcarbodiimide hydrochloride) and 100 mg of NAC were dissolved in 10 mL of 0.2 mM of HCl. Then, the solution of CS was added in a dropwise mode to the flask containing NAC and EDAC and the mixture was left 7 hours at room temperature under stirring. Then, the solution was dialyzed for 24 hours against 1L of HCl 0.2 mM EDTA and against 1L of 1L of HCl 0.2 mM for the remaining 72h. The purified CSNAC was ready for freeze drying for 48h (Christ-Alpha 1-4 LSC) and after freeze drying the resulting polymer CSNAC was stored at 4 °C until use.
3.2.siRNA
Active siRNA pool directed against HMGB1, scrambled negative control siRNA and Quasar 570-conjugated hGAPDHsiRNAwere purchased from Riboxx GmbH, Radebeul, Germany.
15
3.3. Dynamic light scattering measurement and zeta potential
analysis
Dynamic light scattering studies (DLS) were performed at 25°C with a Malvern ZetasizerNano ZS instrument fitted with a 532 nm laser at a fixed scattering angle of 173°, using the Dispersion Technology Software 7.02. The PHEA-Spm and PHEA-PEG-Spm/siRNA polyplexes were prepared in Dulbecco’s modified Phosphate Buffered Saline (DPBS) nuclease free (pH 7.4), by adding to 50 µl of siRNA solution, at a concentration of 0.008 µg/µl, the same volume of PHEA-Spm or PHEA-PEG-PHEA-Spm solutions at various concentration in order to obtain weight ratios in the range of 0.1 to 5. The intensity-average hydrodynamic diameter (nm), and polydispersity index (PI) were obtained by cumulative analysis of the correlation function.
Polyplex containing solutions were then diluted with 400 µl of DPBS nuclease free and used to determine the potential of PHEA-Spm and PHEA-PEG-Spm /siRNA complexes at the above mentioned weight ratio ranges. Zeta potential measurements were performed by aqueous electrophoresis measurements, recorded at 25 °C using the same apparatus. The potential values (mV) were calculated using the Smoluchowsky relationship.
3.4. Gel retardation assay
One volume of solvent (water molecular biology grade, Euroclone, Milan, Italy) containing double strand DNA 21-nt oligonucleotide (ODN; AT content = 52%, GC content = 48%) at a concentration of 0.1 g/l was mixed with one volume of the same solvent containing various amount of polymer (Spm or
PHEA-16 PEG-Spm) so as to obtain weight ratios ranging from 0.1 to 10. After 30 min of
incubation at 37°C, complexes were loaded onto 0.7% agarose gel containing ethidium bromide using uncomplexed ODN as running control.
3.5. Cell lines
16HBE14o- cells and CFBE41o- cells were obtained from Dr. D. Gruenert, University of California, San Francisco, CA. 16HBE14o- cells are SV40 large T-antigen immortalized bronchial epithelial cells that have been described as being derived from a 1-yr-old male heart-lung transplant patient (Cozens et al. 1994). CFBE41o- cells are also SV40 immortalized bronchial epithelial cells (1st bifurcation). They derived from a female CF patient homozygous for the F508del mutation (Bruscia et al. 2002; Illek et al. 2008).
Cells were grown in Eagle’s minimal essential medium (MEM; Sigma-Aldrich, Milan, Italy) supplemented with 10% fetal bovine serum, L-glutamine, and penicillin/streptomycin (PAA Pasching, Austria) at 37 °C under 5% CO2. Cells
were routinely grown on plastic flasks coated with an extracellular matrix containing fibronectin/vitrogen/bovine serum albumin. The extracellular matrix coating was prepared as follows: 10 mg/ml fibronectin adhesion-promoting peptide (BD Biosciences, Milan, Italy), 100 mg/ml albumin from bovine serum (Sigma-Aldrich), and 30 mg/ml bovine collagen type I (BD Biosciences) were dissolved in MEM. The mixture was sterilised by 0.2-mm filter. Each substrate plastic, glass, or permeable support was coated with the mixture for 2 h at 37 °C before cell seeding.
17 H441 cells were derived from a patient with papillary adenocarcinoma of the
lung and show features of Clara-like bronchiolar epithelium (Vuong et al. 2002; Hermanns et al. 2004). H441 cells were cultured in in RPMI 1640 medium containing 5% FBS, 4.5 g/L glucose, 100 U/ml penicillin and 100 g/ml streptomycin.
A549 cells were derived from a human alveolar adenocarcinoma and resemble type II pneumocytes. They were cultured in DMEM containing 10% FBS, 100 U/ml penicillin and 100 g/ml streptomycin.
3.6. Transfections
Cells were seeded on to 24-well plates at 5-6 x 10⁴ per well to obtain 70-80%
confluence after 48 h. Complexes prepared with 30 nM siRNA in 100 l of water molecular biology grade transfection solution at room temperature for 30 min, then added with 400 l of Opti-MEM (Life Technologies, Milan, Italy) and finally added to each well. In the epifluoresescence and flow cytometry experiments, cells were incubated for 4 h in Opti-MEM and then analysed. For silencing experiments, cells were incubated for 4 h and then the transfection medium was substituted with RPMI medium (Sigma-Aldrich, Milan, Italy), containing 10% FBS, 1% streptomycin and 1% penicillin (complete RPMI medium) for further 20 hours.
18
3.7. Epifluorescence
H441 cells (1 X 10⁵) were plated on glass coverslips (12 mm circles, fit in 24-well
dishes) in complete RPMI 24 h before transfection. The day after, cells were transfected. After 4 h, cell nuclei were labelled with the 4’6-diamidino-2-phenylindole (DAPI) fluorescent dye for 5 min, then cells were overlayed with a drop of fluorescent mounting medium (Dako, Milan, Italy) followed by a coverslip. Samples were analyzed with a Nikon Intensilight C-HGFI (Nikon, Florence, Italy) through a 20X and 40X objectives. The microscope was equipped with a DAPI filter (350 nm excitation; 460 nm emission) and a TRITC filter (532 nm excitation; 570 nm emission). Digital images were processed using the NIS Elements program (Nikon).
3.8. Flow cytometry
At 4 h post transfection with 30 nM hGAPDH siRNA conjugated with Quasar 570 fluorochrome previously complexed with the above described different polymers or used as naked siRNA, H441 cells were washed twice with phosphate-buffered saline (PBS), treated or not treated with trypan blue 0.04% in PBS in order to quench extracellular fluorescence, harvested by digesting with trypsin/ethylenediaminetetracetic acid (EDTA) and finally resuspended in PBS. The cells were analyzed by fluorescence-activated cell sorting (FACS) with a EPICS XL MCL flow cytometer (Beckman Coulter Fullerton, CA, USA). The percentage of positive cells was determined after setting the gating on 99% of an untransfected control population of cells and by subtracting the fluorescence of the untransfected control cells. Ten thousand cells were examined in each
19 analysis. Analysis of positive cells was performed by plotting the FLH-2 channel
(575 nm) against the FLH-3 channel (620 nm).
3.9.
Real-time quantitative polymerase chain reaction
Total RNA from treated cells was extracted using the RNeasy Mini Kit (Ambion, Life TecnhologyBrooklyn, NY), following the manufacturer’s instructions. The mRNA was reverse transcribed by SuperScript III First Strand Synthesis System (Life Technology, Brooklyn,NY). Experiments were performed in quadruplicate in optical 96-well reaction plates on an iCycleriQ Multicolor Real-Time PCR Detector (Bio-Rad, Hercules,CA) with iQ SYBR green supermix (Bio-Rad). Oligonucleotide primers specific for GAPDH were 5’ TGCACCACCAACTGCTTAGC3’ and 5’GGCATGGACTGTGGTCATGAG3’. Quantitect primer assay (Qiagen, Germany) for hs_HMGB1 was used. Expression levels of HMGB1 mRNA were normalized to GAPDH levels in the same sample. A relative quantitative method was applied using CT method. Melting curves were analyzed to ensure that fluorescence signals solely reflected specific amplicons. PCR conditions were as follows: 7 minutes at 95°C and 45 cycles of 30 seconds at 95°C and 30 seconds at 60°C.
3.10. Immunoprecipitation and Western blotting
For detection of secreted HMGB1 by Western blotting, conditioned medium was first spin to clear the samples of cell debris. Protease inhibitors were added to supernatants to prevent proteolysis, dephosphorylation and denaturation. Two of
20 the most commonly used protease inhibitors for immunoprecipitation (IP) PMSF
(50 g/ml) and aprotinin (1 g/ml) were used. Samples then were subjected to IP. HMGB1 IP was performed by incubating 0.5 ml of cell supernatant with 1 g of rabbit anti-HMGB1 (Millipore, Upstate code 07-584) and Dynabeads protein G sepharose (Invitrogen) for 16 h at 4°C under agitation. The antibody/antigen complex was then pulled out of the sample using Magnetic bead-based separation. When the incubation time was over, the supernatant was removed and the beads washed in PBS three times (each time centrifuging at 4°C and removing the supernatant). Finally, the last supernatant were removed and 25-50 µl of 2x loading buffer (Laemmli sample buffer) were added. Samples were boiled at 95-100°C for 5 minutes to denature the protein and separated from the protein-G beads. The immunocomplexes underwent 12% SDS-PAGE and were transferred to a nitrocellulose membrane. Western blot analysis was performed using goat anti-HMGB1 (Santa Cruz, code 26351) and antibody secondary antigoat (Santa Cruz; 1/10000). HMGB1 bands were visualized using an enhanced chemifluorescence kit according to the manufacturer's instructions (BioRad) and quantify using a VersaDoc Gel Imaging System (BioRad) and The Quantity One analytical software. Intensity of individual bands was measured using the ImageJ program (http://imagej.nih.gov/ij/).
3.11. MTT assay
MTT (3-(4,5-dimethyl-thiazol-2-yl)-2,5-diphenyl tetrazolium bromide) is a water-soluble yellow dye that is readily taken up by viable cells and reduced by the action of mitochondrial dehydrogenases. The reduction product is a
water-21 insoluble blue formazan that must then be dissolved for colorimetric
measurement. Briefly, a stock solution of MTT (Sigma) in phosphate buffered saline (PBS) (5 mg/ml) was added to each well reaching a final concentration of 0.5 mg/ml (in 1000 µl of complete medium). After 4 hours the formazan crystals were dissolved in a 10% SDS/0.01N HCl solution and measured spectrophotometrically by an ELISA reader (PowerWave HT, Bio-tek, Milan, Italy) at a wavelength of 570 nm with a reference wavelength of 690 nm. The relative viability was calculated in respect to control wells containing mock cells, i.e. cells treated with 150 mM NaCl (considered as 100%). 1% SDS-treated cells were used as positive control.
3.12. Stimulation of cells with LPS
H441 cells were seeded at the density of 6 X 10⁴ per well of a 24 well plate in
RPMI medium containing 0.4% FBS. The day after, cells were incubated with lipopolysaccharide (LPS) from P. aeruginosa 10 (Sigma, code L8643) for various time points (3-48 h) and at different concentrations (0.1-10 g/ml) in RPMI medium + 0.4% FBS. At each time point, cells were lysed for obtaining total RNA and the conditioned medium was processed for immunoprecipitation and western blotting. In other experiments, metabolic activity (MTT assay), cell counts, and cell cycle phases were evaluated.
22
3.13. Proliferation assay
After stimulation with LPS, cells were detached, and counted at the TC 10TM
Automated Cell Counter (BioRad). The experiment was performed in triplicate per each condition. At the moment of cell count, the cells from the three wells were pooled, spinned down, and counted.
3.14. Cell cycle analysis
The cell cycle analysis was carried out using the reagents of the FlowCellectTM
Bivariate Cell Cycle kit (Merck-Millipore). After stimulation with LPS, cells were detached with trypsin/EDTA, resuspended in the Wash Buffer, and fixed in Fixation Buffer for 20 min on ice. Then, cells were incubated with the Permeabilization Buffer for 5 min on ice, washed once with the Assay Buffer, and incubated with the Propidium Iodide (PI)/RNase mix for 30 min at room temperature in the dark. Cells were analysed by the Amnis FlowSightTM IS100
(Millipore). 3 X 10⁴ cells were analysed for propidium iodide fluorescence (CH5).
Cell cycle analysis was performed by plotting on histogram the number of PI positive cells against PI fluorescence intensity that is directly proportional to DNA content. As the DNA content of cells duplicates during the S phase of the cell cycle, the fluorescence of cells in the G2/M phase will be twice (4N) as high as that of cells in the G0/G1 phase (2N), resulting in two peaks (G0/G1 and G2/M) that could be easily distinguished and gated. Cells with a DNA content between 2N and 4N are representative of the S phase.
23
3.15. Statistical analysis
Data are displayed by mean ± SEM and analyzed for statistical significance using 2-way ANOVA with Tuckey’s Multiple Comparison test and two-tailed unpaired Student t test using Graphpad Software v. 4 (Graphpad Software, La Jolla, CA, USA). A p<0.05 was considered statistically significant.
24
4. RESULTS AND DISCUSSION
4.1. Complexation of cationic polymers with nucleic acids
PHEA-Spm and PHEA-PEG-Spmhave been already used to deliver plasmid DNA to various cell types, but there are still no data on siRNA delivery. Moreover, Cavallaro et al. have recently shown that PHEA derivatized with diethylaminoethyl methacrylate (DEAEMA) was able to deliver both siRNAs and pDNA in the hepatocellular carcinoma cells HuH7 (Cavallaro et al. 2014). Both PHEA-Spm and PHEA-PEG-Spm were preliminarily tested for complexation of pDNA and transfection of luciferase-bearing plasmid DNA in H441 bronchial epithelial cells, finding that these polymers efficiently complexed pDNA and were endowed with a good transfection efficiency in the absence of relevant in vitro cytotoxic effects (Di Gioia et al., to be published).
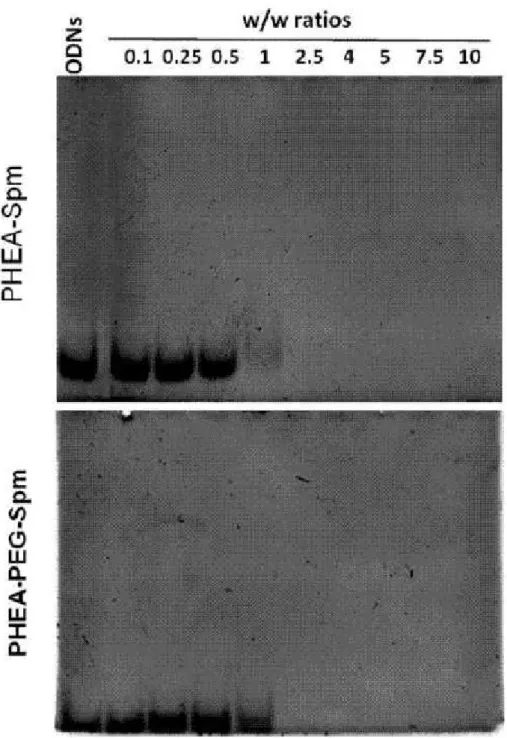
In order to see whether these cationic vectors complexed efficiently oligonucleotides, an 21 base-pair double stranded DNA (dsDNA) was used for cost-effective reasons. Because the complexation process between dsDNA and the PHEA-base copolymers is driven by charge-charge interactions, dsDNA is a reasonable surrogate for siRNA, as shown already by others (Sizovs et al. 2014). The complexation of dsDNA was studied by a gel retardation assay. As shown in Figure 6A and B, a gel shift was negligible until a w/w ratio of 1 was used with both PHEA-Spm and PHEA-PEG-Spm. At the w/w ratios of 2.5 and higher, no free dsDNA was observed migrating in the gel, indicating that dsDNA molecules were completely complexed with the copolymers.
25
Figure 6. Electrophoretic mobility of dsDNA complexes obtained with the polymers PHEA-Spm
and PHEA-PEG-Spm at different w/w ratios. Free ODNs were run as internal control and are shown on the left of each gel.
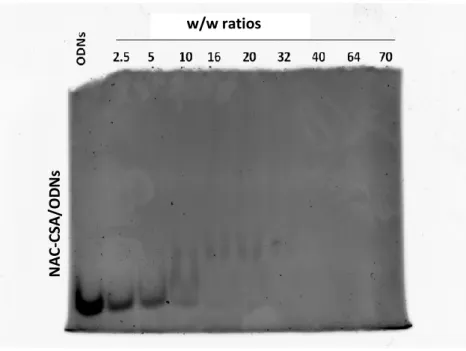
As for PHEA-based copolymers, chitosan-NAC was analysed in the gel retardation assay (Figure 7). Complexation began with a w/w ratio of 10 and was complete at w/w ration of 40
26
Figure 7. Electrophoretic mobility of dsDNA complexes obtained with the CS-NAC at different w/w ratios. Free ODNs were run as internal control and are shown on the left of the gel.
4.2. Biophysical characterization of complexes formed with
siRNAs
PHEA-Spm and PHEA-PEG-Spm polyplexes were characterized by dynamic light scattering (DLS) technique to determine the size and potential. Complexes were formed in DPBS at pH 7.4, considering that pH, salt concentration and ionic strength of this medium are close to that of physiological environment; since polycation/siRNA complexation is driven by electrostatic interactions, the presence of DPBS, by increasing significantly the total ionic strength and reducing the overall force of electrostatic interactions, is expected to have a destabilizing effect on the complexes in terms of induction of the interaction among nanocomplexes. N A C -C SA /OD N s C SA/ OD N s w/w ratios
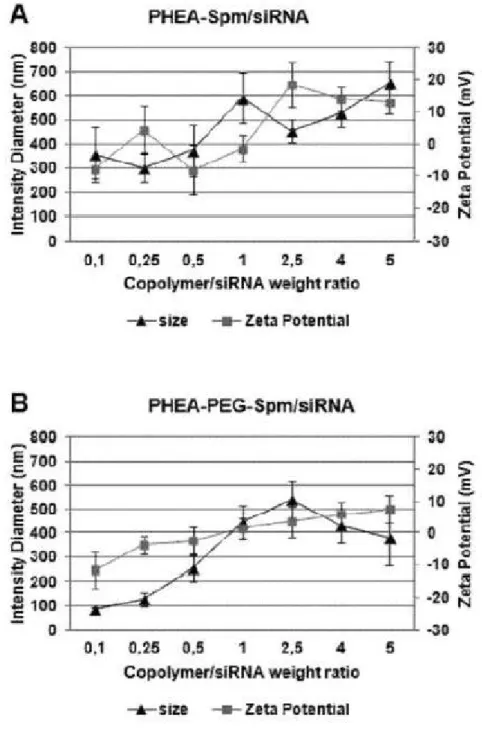
27 As can be seen from Figure 8, size values for polyplexes obtained with
PHEA-Spm copolymer increase at polycation/siRNA weight ratio (R) between 0.1 and 1 from 350to 600 nm, then decrease for R equal to 2.5 and start to increase again until about 650 nm for R equal to 5.
Figure 8. Size and -potential profiles of PHEA-SPM (A) and PHEA-PEG-SPM (B).
Polyplexesas a function of weight ratio of polycation/siRNA (R). Data are expressedas the mean ± SEM of three experiments.
28 The very high values of size for PHEA-Spmpolyplexes at R near to 1 can be
explained considering that at this weight ratio the overall charge of polyplexes is close to the neutrality (ζ potential is close to zero) and aggregation probably occurs, confirmed also by a polydispersity values of 0.51. The increase of size of polyplexes at R greater than 2.5 can be explained considering the occurring of a different arrangement in the polyelectrolyte interaction in the presence of high amount of polycation (Bordi et al. 2014).
Also for PHEA-PEG-Spm copolymer, polyplexsize increases, until about 500 nm, at R equal to 2.5, corresponding to R values, in that ζ potential is near to neutrality, and therefore some aggregation can occur, confirmed also in this case by an high polydispersity index equal to 0.44; however the size of PHEA-PEG-Spm polyplexes remains, also in condition of ζ potential near to neutrality, lower that that obtained with PHEA-Spm suggesting a protective effect of hydrophilic PEG shell against aggregation.
Polyplexes at the ratio of 2.5 and higher gave a complete retardation of electrophoresis run of dsDNA, indicating that positively charged complexes were stuck into the well (Figure 6). On the other hand, as shown in Figure 8, polyplexes at the ratio of 0.5 were negatively charged (more with PHEA-Spm than with PHEA-PEG-Spm), likely because the polycation molecules were not enough to neutralize all negatively charges dsDNA molecules. This determined also the behavior of these polyplexes in the gel retardation assay. These data are in agreement with those obtained in other similar studies with polycations (Jafari et al. 2014).
Based on these results, we chose to carry on the following experiments with two ratios, one corresponding to a condition of partially complexation (w/w of 0.5=R1) and another corresponding to a full complexation (w/w of 5=R2). We
29 then analyzed internalization of siRNA complexes by airway epithelial cells using
two methods: epifluorescence and flow cytometry.
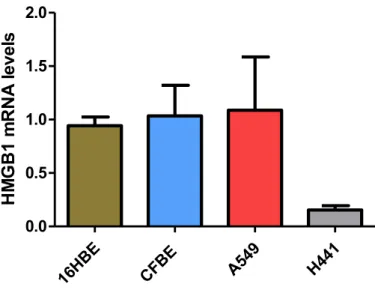
4.3. Evaluation of HMGB1 mRNA levels in airway epithelial cell
lines
Before starting with the experiments aimed at evaluating the entry of polyplexes and down-regulation of HMGB1, we sought to understand which was the best cell line in the context of HMGB1 mRNA expression. For this purpose, we analyzed HMGB1 mRNA levels in various cell lines obtained from different lung districts. 16HBE41o- and CFBE14o- are bronchial epithelial cells, H441 are bronchiolar epithelial cells; A549 are type II pneumocytes. As shown in Figure 9, real-time PCR experiments showed that H441 cells displayed the least HMGB1 mRNA levels as compared with 16HBE41o-, CFBE14o-, and A549 cells. We considered that H441 cells would be an interesting model due to low basal levels which could be increased by inflammatory stimuli. Moreover, other interesting features are presented by this cell line.
The H441 cell line has been fruitfully utilized as a monolayer in drug and nanoparticle transport studies (Hermanns et al. 2010; Salomon et al. 2014). Interestingly, H441 cells were used to mimic in vitro the effect of n-Pen c 13 (a major allergen secreted by Penicillium citrinum) on pulmonary epithelial barrier integrity in vivo (Chen et al. 2011). These results prompted us to use H441 cells for the study of polyplex-mediated siRNA internalization and down-regulation of HMGB1.
30 16HB E CFBE A5 49 H441 0.0 0.5 1.0 1.5 2.0 HM GB1 m RN A le ve ls
Figure 9. HMGB1 mRNA levels in various epithelial cell lines originated form human lung.
HMGB1 mRNA levels were obtained by real time PCR and computed accordingly to the Ct
method.
4.5. Entry of siRNA complexes into cells
Thus, H441 were chosen as the cellular model useful for our studies on siRNA delivery. We tested the association and entry of siRNA complexes as formed by the three cationic polymers previously evaluated in the gel retardation assay.
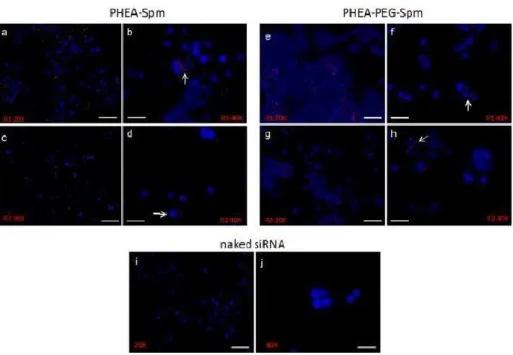
H441 cells were incubated with a siRNA conjugated with a fluorochrome emitting in the red channel either naked or complexed with polyaminoacidic polymers. Following 4 h of incubation, epifluorescence showed association of fluorescently labeled complexes made by PHEA-Spm without any relevant difference between R1 and R2 ratios (Figure 10 a-d). Interestingly, images suggested a likely perinuclear localization. Figure 3e-h shows that a similar pattern of association was evident also for PHEA-PEG-Spm complexes. The naked siRNA was never found associated with cells (Figure 10i-j).
31
Figure 10. Epifluorescence of cells incubated with siRNA complexed with PHEA co-polymers.
H441 cells were treatedwith PHEA-Spm (a-d) or PHEA-PEG-Spm (e-h) fluorochrome-conjugated siRNA complexesformed at the w/w ratios of 0.5 (R1) and 5 (R2) for 4 h. Naked fluorochrome-conjugated siRNAwas used as control (i and j). White arrows indicate cells with internalized complexes.Magnifications were 20X(scale bar = 40μm) and 40X (scale bar = 20μm).
Also the CS-NAC was evaluated for siRNA internalization as evaluated by epifluorescence. Figure 11 shows, as for PHEA-based nanocomplexes, a fluorescent signal inside the cells with both w/w ratios (R1 = 5 and R2 = 40). However, it is possible to see that fluorescent spots are more enriched in R1-treated cells.
32
Figure 11. Epifluorescence of cells incubated with siRNA complexed with CS-NAC. H441 cells
were treatedwithCS-NACfluorochrome-conjugated siRNA complexes formed at the w/w ratios of 5 (R1) and 40 (R2) for 4 h. White arrows indicate cells with internalized complexes.Magnifications were 20X (scale bar = 40 μm) and 40X (scale bar = 20 μm).
4.6. Quantification of siRNA internalization
To evaluate quantitatively siRNA uptake, a cytofluorimetric assay based on the quenching of membrane-associated fluorescence was performed. After 4 h of incubation of cells with fluorochrome-conjugated complexes, cells were treated or not with trypan blue treatment before analysis. Trypan blue quenches extracellular fluorescence allowing to determine intracellular signal only (Conese et al. 2009), therefore whole cell-associated fluorescence is detected in cells not treated with trypan blue, while internalized fluorescence is revealed in trypan blue-treated cells. Results showed that PHEA-Spm/siRNA complexes at R1 and R2 ratios
33 were internalized by approximately 42% and 47% of cells respectively, with a
significant increase as compared with naked siRNA (~20%) only with the R2 ratio (Figure 12A). PHEA-PEG-Spm/siRNA complexes were internalized by approximately 30% of H441 cells with both R1 and R2 ratios, but these results were not statistically significantly different from those obtained with naked siRNA (Figure 12A). Figure 12B shows that the percentage of positive cells with internalized complexes as calculated on the whole cell-associated complexes was lower with PHEA-PEG-Spm than with PHEA-Spm.
Figure 12. Cytofluorimetric analysis of cells incubated with PHEA polymer/siRNA complexes.
(A)H441 cells were treated with polymer/fluorochrome-conjugated siRNA complexes at the ratios of0.5 (R1) and 5 (R2) for 4 h. Cells were treated or not with Trypan Blue (TRP) and then analyzed byflow cytometry. Internal controls included naked fluorochrome-conjugated siRNA. (B) Internalizedfluorescent complexes were calculated over the whole cell-associated fluorescence. Data are reported as mean ± SD of three experiments. *p<0.05 vs. naked siRNA treated with TRP.
These results demonstrate that nanocomplexesare taken up by H441 cells, however this was observed with PHEA-Spm also at the ratio R1 of 0.5, which gave partial complexation with oligonucleotides. These complexes were
34 characterized by a size of almost 400 nm and a zeta potential of -8 mV. siRNA
delivery has been attempted in vivo to the lung in the absence of carrying molecules and nevertheless obtaining positive results (Fulton et al. 2009; Rosas-Taraco et al. 2009; Gutbier et al. 2010; Senoo et al. 2010), with some reports showing no significant difference in gene silencing efficiency between naked siRNA and the use of delivery vectors (Bitko et al. 2005; Fulton et al. 2009). It has been hypothesized that the siRNA modifications transfection or the damage of the airway epithelium caused by viral infection, or by other pathological processes, may have caused increased internalization of naked siRNAs (Fujita et al. 2013). In vitro, these factors cannot be invoked. We can speculate that negatively charged polyaminocidic polymer/siRNApolyplexes may favor, with an unknown mechanism which disturbs the plasmamembrane, the uptake of siRNA. On the other hand, the lower internalization of PHEA-PEG-Spm polyplexes was an expected result. PEG have been shown to inhibit the uptake of nanoparticles, likely by interfering with the endocytosis mechanism (Mishra et al. 2004). In the presence of PEG, the interaction between positively charged polyplexes and heparan-sulfate proteoglycans is hampered by the steric hindrance of PEG, which may have caused reduced endocytosis of copolymer/siRNApolyplexes (Hatakeyama et al. 2009).
CS-NAC mediated siRNA internalization in 50-55% of cells (Figure 13). There was a statistically significant differences between CS-NAC R1 and R2 with naked siRNA, both at p<0.01.
35
Figure 13. Cytofluorimetric analysis of cells incubated with CS-NAC/siRNA complexes. H441
cells were treated with polymer/fluorochrome-conjugated siRNA complexes at the ratios of 5 (R1) and 40 (R2) for 4 h. Cells were treated or not with Trypan Blue (TRP) and then analyzed byflow cytometry. Internal controls included naked fluorochrome-conjugated siRNA. Data are reported as mean ± SD of three experiments. ** p<0.01.
4.7. Down-regulation of HMGB1 mRNA
Having observed PHEA copolymer/siRNA internalization, we performed real-time PCR to study the down-regulation of HMGB1 mRNA levels. We observed that after 24 h PHEA-Spm-mediated siRNA delivery did not reduce HMGB1 mRNA levels as compared to untreated controls at the ratio R1 (Figure 14). At the higher ratio R2, PHEA-Spm down-regulated HMGB1 mRNA by 42% and gained a statistically significant difference (p=0.0006). PHEA-PEG-Spm/siRNA complexes were able to lower HMGB1 mRNA levels to 61% of untreated cells (p=0.0061), at the lower w/w ratio R1, while the higher ratio R2 determined a down-regulation of 33% (p=0.020) (Figure 14). Scrambled negative siRNA, either
36 naked or complexed, and naked active siRNA did not exert any significant effect
on HMGB1 mRNA levels (Figure 14).
Figure 14. Real-time PCR evaluation of HMGB1 mRNA levels. H441 cells were treated
withpolymer/siRNA complexes for 24 h. Internal controls include scrambled negative siRNA, eithernaked or complexed, and naked active siRNA. The values of untransfected cells have been set at 1and the relative levels obtained in treated cells are shown. *p<0.05; **p<0.01; ***p<0.001 vs. untransfected cells.
However, a comparison between active and scrambled complexes did not reveal any statistically significant difference. These results might be imputed to an increase in HMGB1 as an alarmin following transfection and thereby not allowing a strong downregulation by active complexes in comparison with scrambled complexes. Indeed, previous work has shown that transfection of DNA complexed
37 with a lipid (Lipofectamine 2000) determined HMGB1 secretion by murine
macrophage cell line RAW 264.7 cells (Jiang and Pisetsky 2008).
With PHEA-Spm, an efficient down regulation of HMGB1 mRNA was achieved only with the ratio R2, while with the ratio R1 neither nanocomplexes entry nor HMGB1 down regulation reached statistically significance. On the contrary at R2 the polymer protected internalized siRNA from nuclease-mediated degradation bringing to efficient HMGB1 down-regulation. Although PHEA-PEG-Spm based nanocomplexes did not reach statistically significance in cell internalization as compared with naked siRNA (Figure 12), these nanocomplexes achieved a significant down-regulation of HMGB1 mRNA levels (Figure 14). Indeed, PEGylation has been shown to inhibit both uptake and endosomal escape of nanocomplexes (Guo et al. 2014). Accordingly, the ratio R2, which exerted a full complexation of dsRNA, was less efficient in gaining significant HMGB1 down-regulation than the R1 ratio, which determined a partial complexation. The reason why PEGylated PHEA-Spm-based nanocomplexes gave HMGB1 down-regulation at the lower ratio is not known at the moment. Nevertheless, the effective HMGB1 downregulation in the case of PEGylated nanocomplexes may be explained by the protection exerted by this polyaminoacidic polymer on delivered siRNA from nuclease degradation. It has been shown that target gene knockdown by nucleofection of naked siRNA is effective but extremely short-lived, and that chemical modification preventing nucleolytic degradation within the cell dramatically prolongs the siRNA effect (Mantei et al. 2008). On the other hand, in our experiments PEGylated nanocomplexes increased cell uptake by around 10% as compared to naked siRNA (Figure 12) not resulting in a significative difference in the HMGB1 downregulation between PEGylated complexes and naked siRNA (Figure 14). Since it is known that PEG inhibits
38 endosomal escape of nanoparticles mediating pDNA or siRNA delivery (Mishra
et al. 2004; Remaut et al. 2007; Hatakeyama et al. 2009), we can speculate that HMGB1 downregulation could have been higher if PEG moieties were acid-labile and sheddable, as it has been suggested by bioresponsive PEGylated complexes (Murthy et al. 2003; Oishi et al. 2005; Rozema et al. 2007; Chan et al. 2012). In alternative, given the positive properties of PEG for in vivo administration purposes (inhibition of hemolysis or aggregation of erythrocytes, avoidance of immune stimulation, improvement of circulation time, protection of the cargo from enzymatic degradation, and generally provision of colloidal stability and ‘stealth’), PEgylated co-polymers might be formulated such in a way to display pH-dependent membrane disruptive behavior finely-tuned for efficient endosomal escape and cytoplasmic delivery (Nelson et al. 2013).
Down-regulation of HMGB1 was also investigated with CS-NAC with both ration, R1 and R2, As it can be seen in Figure 15, the only significant decrease in HMGB1 mRNA levels was obtained with CS-NAC complexed with the active siRNA at the w/w ratio of 5 (R1).
39 Figure 15. Silencing of HMGB1 as mediated by CS-NAC. H441 cells were treated
with CS-NAC/siRNA complexes for 24 h. Internal controls include scrambled negative siRNA, eithernaked or complexed, and naked active siRNA. The values of untransfected cells have been set at 1and the relative levels obtained in treated cells are shown. **p<0.01 vs. untransfected cells.
Alhtough R1 and R2 of CS-NAC/siRNA complexes promoted uptake by H441 cells (Figure 13), downregulation of HMGB1 mRNA levels was achieved only with R1. Since the complexation of siRNA with CS-NAC at R2 ratio was obtained at higher amount of CS-NAC (80 fold), it can be speculated that the more the CS-NAC the higher the packaging of siRNA and the lesser the siRNA amount which could be released in the cytosol.
40
4.8. Cell toxicity with siRNA complexes
Biocompatibility is an essential requisite for any polyplexes proposed to vehicle NABDs to cells and tissues. For this reason, copolymer/siRNApolyplexes were tested for their cytotoxicity by using the MTT assay. Neither PHEA-Spm nor PHEA-PEG-Spm complexes at w/w ratios between 0.5 and 5 exerted a cytotoxic effect on H441 cells post 24 h of incubation (Figure 15). This is consistent with previously published data on the excellent biocompatibility of polyamnocidic polymers complexingsiRNA or DNA (Cavallaro et al. 2008; Cavallaro et al. 2014).
Figure 15. Cytotoxicity of copolymer/siRNApolyplexes. H441 cells were incubated with
PHEASpmand PHEA-PEG-SpmsiRNA complexes prepared at w/w ratios of 0.5, 2.5 and 5. 1% SDS-treatedcells were used as positive control while untreated cells were used as negative control. Dataare expressed as the mean ± SEM of percentages of viable cells compared to the negative control.The data represent two separate experiments performed in esuplicate.
41 The cytotoxicity of CS-NAC/siRNA complexes is currently under investigation.
However, a cytotoxic effect is not expected, as chitosan nanoparticles have been shown to be compatible with cell lines of human origin from airway and alveolar regions of the pulmonary tract (Lim et al., 2001; Grenha et al., 2007).
4.9. LPS stimulation of H441 cells
Since HMGB1 is induced by pro-inflammatory stimuli, we analyzed the effect of the lipopolysaccharide (LPS) from P. aeruginosa on the HMGB1 mRNA and protein levels. H441 cells were incubated with various concentrations of LPS (0.1, 1, and 10 g/ml) for different time points (3, 6, 24 and 48 hours) and then mRNA or proteins were collected. Real time PCR results show that LPS induced an increase up to 2.3 fold in mRNA HMGB1 levels at very early time point (3 h), while this increase was less at late time point (48 h) as compared with unstimulated cells (Figure 16).
42
Figure 16. HMGB1 mRNA levels in cells stimulated with LPS. H441 cells were maintained in 0.4
%FCS overnight, and then stimulated with LPS at the indicate concentrations (in g/ml) for 3, 6, 24, and 48 hours. RNA was extracted and subjected to real time PCR.
Immunoprecipitation and western blotting of immunoprecipitates was used to reveal HMGB1 protein in conditioned media obtained from the same samples analysed for HMGB1 mRNA levels (Figure 17).
Figure 17. Immunoprecipitation and western blotting of HMGB1 on conditioned media.
Experimental conditions are the same of those of Figure 16.
Analysis of gels with the Image J software (Figure 18) revealed that LPS at 0.1 g/ml induced a 2.4-fold increase of HMGB1 protein levels at 48 h. LPS at 1 g/ml determined an increase at both 24 and 48 h, while at 10 g/ml was without effect.
43
Figure 18. Analysis of HMGB1 bands on gels. The bands obtained in gels shown in Figure 17
were analyzed by the Image J software. Each control within the gel was posed equal to 1.
HMGB1 has been recognized as an inflammatory mediator of delayed endotoxin lethality and lung injury (Andersson et al. 2000; Arcaroli et al. 2001). In murine macrophage-like RAW 264.7 cells stimulated with LPS, HMGB1 mRNA levels showed no significant change at 0–18 h after stimulation with LPS, but increased significantly at 24, 36, and 48 h compared witht hat at baseline (Wu et al. 2012). These findings were similar by those obtained previously (Wang et al. 1999). On the other hand, this study also showed that HMGB1 cytoplasmic protein increased at 12 h and peaked at 48 h after the cell was stimulated with LPS, compared with that at 0 h. HMGB1 nuclear protein was comparatively high at 0–6 h and decreased gradually at 12–24 h. At 36–48 h, the HMGB1 nuclear protein increased gradually again after LPS stimulation. Overall, these results suggest that the increase of cytoplasmic HMGB1 is due to the relocation of HMGB1 from nucleus to cytoplasm, and that, after export to the cytoplasm,
44 HMGB1 is re-synthesized,or replaced, in the nucleus, keeping its level high. In
macrophages RAW 264.7, a significant up-regulation of intracellular HMGB1 mRNA occurred at 24 h after LPS stimulation, coinciding with the increase of intranuclear HMGB1 production, whereas in H441 cells the mRNA increase occurred already at 3 h. Different species (mouse vs. human) and cell types (macrophages vs. airway epithelial cells) may account for this result, while it may also suggest that HMGB1 mRNA kinetics are different in airway epithelial cells and macrophages, being released at earlier times at the level of the airway epithelium.
In order to see whether LPS could induce changes in cell viability, a MTT assay was performed. Interestingly, we obtained a picture closely resembling those given by HMGB1 mRNA and protein levels. Indeed, Figure 19 shows that cell metabolic activity, an index of cell viability, was increased after 3 h post-stimulation, decreased at 6 and 24 h, and presented again an increase at 48 h.
Figure 19. Cell viability upon LPS stimulation. H441 cells were incubated with various
concentrations of LPS as indicated (in g/ml) at different time points and evaluated with the MTT assay.
45 Since the MTT assay investigates a mitochondrial activity, we sought to
investigate whether cell proliferation was affected by LPS stimulation. To this end, a cell count-based assay was employed. As expected, the absolute numbers of cells were not different at 3 h- and 6 h-time points as compared with time 0, i.e. at the starting of the experiment, while an increase in cell counts was found at 24 and 48 h in comparison with time 0. However, this assay did not reveal any significant differences in cell counts between LPS- and unstimulated cells (Figure 20).
Figure 20. Cell count assay in LPS-stimulated cells. H441 cells were stimulated with LPS at
various concentrations as indicated (in g/ml) at different time points. At each time point, cells were detached and counted.
Counting cell numbers in wells gives no information on the cell cycle phases (G1, S, G2, M). It could be that LPS may affect one of such phases. In order to
46 study any effect on the cell cycle, LPS- and unstimulated cells were incubated
with propidium iodide and analysed by flow cytometry. G1, S, and G2/M phases were distinguished in unstimulated cells (Figure 21). Interestingly, a reduction of cell percentages in G0/G1 phase at 3 and 6 h was observed with the highest concentration of LPS (Figure 22). Conversely, an increase of cell percentages in G2/M was noted at 6 and 24 h.
Figure 21. Analysis of cell cycle in H441 cells. The histogram is representative of unstimulated
cells at 6 h. Histogram plots are obtained by plotting the the number of PI positive cells (shown as “Normalized Frequency” on the y-axis) against PI fluorescence intensity (shown as “Intensity_MC_Ch05” on the x-axis). The percentage of cells present in each phase is obtained by gating the different regions: in this case, G0/G1 = 59.7%; S = 13.6%; G2/M = 24.2%.
47
Fig. 22. Cell cycle phases in unstimulated and LPS-stimulated cells. Histograms represent the
percentages of cells in each phase and at each time point. *p<0.05; **p<0.001; ***p<0.0001.
LPS is known to induce proliferation in various cell types, including bronchial epithelial cells (Verspohl and Podlogar 2012), hepatic stellate cells (Liu et al. 2015), keratinocytes (Preciado et al. 2005), and mononuclear cells (Dawes et al. 2008).
In particular, Verspohl and Podlogar (2012) have shown in the bronchial epithelial cell line BEAS-2B that LPS increased cell proliferation in a dose-dependent fashion (up to 10 g/ml), as assessed by [3H]-thymidine incorporation,
while having no effect on the MTT assay. Increased proliferation of airway epithelial cells is closely related to airway remodeling occurring in chronic inflammatory bronchial diseases like asthma. The proliferative effect of LPS on BEAS-2B cells is contradictory to the findings of Freitag et al., who describe an inhibited proliferation of rat tracheal epithelial cells in the presence of LPS (Freitag et al. 1996). This may be caused by the use of LPS from different species, differences between rat and human cells and between tracheal and bronchial
48 epithelium. The difference in assays and cell lines could be also the cause of our
data generated in H441 cells constrasting those obtained in BEAS-2B cells.
On the other hand, Liu et al. (2015) showed, by the MTT assay, that LPS (from 10 ng/nl to 5 g/ml) promoted hepatic stellate cells proliferation and protected against apoptosis, and our data re in line with the latter. MTT reflects the activity of the mitochondrial enzyme dehydrogenases, and has been often used as a proliferation assay. In our hands, LPS did not affect neither cell counts nor cell cycle phases, indicating that LPS exert an effect on metabolic activity which is not followed by cell proliferation. It could be that this cell activation has to do with secretion of inflammatory mediators: HMGB1 in our case and IL-8 and RANTES in the paper by Verspohl and Podlogar (2012).
49
5. CONCLUSIONS AND FUTURE PERSPECTIVES
Although non-viral-mediated siRNA delivery has been recently show to downregulate HMGB1 in other cellular targets (Kim et al. 2010; Jiang et al. 2012), to the best of our knowledge this study is the first reporting downregulation of HMGB1 by cationic polymer-based nanocomplexes in airway epithelial cells. In this thesis we show that biocompatible polyaspartamide-based nanocomplexes deliver siRNA into H441 airway epithelial cells and down-regulate the pro-inflammatory mediator HMGB1. The downregulation was up to 61% of control untransfected cells. Similar results were obtained with a chitosan derivatized with N-acetylcysteine. This partial down regulation might be preferable to total ablation, since extracellular HMGB1 has been implicated also in physiological processes, such as cell migration and cell differentiation (Sparatore et al. 1996; Fages et al.
2000).
Time course and functional studies are warranted in order to decide if this approach would be suitable in inhibiting inflammation in the airway epithelium. Thus, we plan to determine whether the inhibition occurs also at the protein level and if the HMGB1 down-regulation may alleviate cytokine secretion by airway epithelial cells upon inflammatory stimuli. We found that LPS, which can mimick a bacterial infection in vivo, could elicit an increase of HMGB1 at the level of both mRNA and protein. Interestingly, LPS augmented also the cellular mitochondrial metabolism and the progression of cells in the cell cycle at some extent. It would be very interesting to evaluate the role of HMGB1 in these processes by the siRNA approach.Finally, I would like to stress that other data showing the possibility to use the approach to silence HMGB1 for the control of asthma or other respiratory disease
50 are lacking to date, thereby showing the originality of this approach. These studies
have to be completed in the appropriate animal models of disease to further advance this therapeutic approach in the pre-clinical evaluation.