Received July 11, 2019, accepted July 24, 2019, date of publication July 29, 2019, date of current version August 31, 2019. Digital Object Identifier 10.1109/ACCESS.2019.2931637
Quantifying Uncertainty in Internet of Medical
Things and Big-Data Services Using
Intelligence and Deep Learning
FADI AL-TURJMAN 1, HADI ZAHMATKESH 2, AND LEONARDO MOSTARDA 3
1Department of Computer Engineering, Antalya Bilim University, 07190 Antalya, Turkey
2Computer Engineering Department, Middle East Technical University, Northern Cyprus Campus, 99738 Guzelyurt, Cyprus 3Computer Science Department, Camerino University, 62032 Camerino, Italy
Corresponding author: Leonardo Mostarda ([email protected])
ABSTRACT In the cloud-based Internet of Things (IoT) environments, quantifying uncertainty is an important element input to keep the acceptable level of reliability in various configurations. In this paper, we aim to address the pricing model of delivering data over the cloud while taking into consideration the dynamic uncertainty factors such as network topology, transmission/reception energy, nodal charge and power, and computation capacity. These uncertainty factors are mapped to different nodes with varying capabilities to be processed using Artificial Intelligence (AI)-based algorithms. Accordingly, we aim to find a way to calculate and predict the price per big data service over the cloud using AI and deep learning. Therefore, in this paper, we propose a framework to address big data delivery issues in cloud-based IoT environments by considering uncertainty factors. We compare the performance of the framework using two AI-based techniques called Genetic Algorithm (GA) and Simulated Annealing Algorithm (SAA) in both centralized and distributed versions. The use of AI techniques can be applied in multilevel to provide a kind of deep learning to further improve the performance of the system under study. The results reveal that the distributed algorithm outperforms the centralized one. In addition, the results show that the GA has lower running time compared to the SAA in all the test cases such as 68% of improvement in the centralized version, and 66% of improvement in the distributed version in case when the size of uncertainty array is 256. Moreover, when the size of uncertainty array increases, the results show 60% speed up in the distributed GA compared to its centralized version. The improvements achieved would help the service providers to actually improve their profit using the proposed framework.
INDEX TERMS IoT, cloud, trading model, AI, deep learning, big data.
I. INTRODUCTION
Internet of Thing (IoT) paradigm is influencing the world and people’s life where cloud computing plays a significant role in realizing it. IoT allows people and things (e.g. sensors, actuators, and smart devices) to be connected anytime and anywhere, with anyone and anything. Most of these things are expected to communicate with each other, collect data and provide services via the cloud paradigm. Delivering data in a cost-effective and scalable manner is vital in order to support the continued growth of cloud services [1]. In a modern data center, the majority of data is generated by bandwidth-hungry
The associate editor coordinating the review of this article and approving it for publication was Victor Hugo Albuquerque.
long flows [2]. According to [3], more than 90% of flows are short flows with the size of less than 100 MB. However, more than 90% of bytes are in flows bigger than 100 MB. The overall quality of the computation can be degraded if the short flows cannot deliver the associated data on time. There-fore, efficient data delivery is crucial in order to enhance the overall quality and performance of various cloud services such as transport, traffic and healthcare while reducing their overall cost of delivery and energy consumption. On the other hand, there would be huge cost for the cloud providers if an unplanned data delivery is utilized without paying attention to the price and resource scarcity. Furthermore, cost effec-tiveness is one of the main characteristics defined on an IoT setting [4]. Therefore, an efficient IoT-specific pricing
model would help cloud providers to identify different factors affecting the level of service that aggregates data from various sources. This in turn causes enhancements in the reliability of services.
Nowadays, we are all connected with our computers, smart-phones, and many other objects and devices that can send and receive data. This in turn raises a couple of questions such as; how much does it require to send data over the network? and, what happens if the pricing model of energy or the topological order of the nodes change? Therefore, it is significant to investigate different approaches to optimize the pricing schemes in order to have cost-efficient data delivery in cloud-based IoT infrastructures. However, since the IoT is growing fast, a problem that any service provider may face is the uncertainty problem. Uncertainty in cloud-based IoT solutions arise mainly from the heterogeneity of the utilized devices and communication links towards the cloud. This important issue has an impact on computing efficiency, and brings additional challenges to scheduling problems in cloud environment [5]. Therefore, uncertainty analysis should be an important part of design and service provisioning approaches in the IoT era. Moreover, quantifying uncertainty is an impor-tant element input to keep the acceptable level of reliability in various cloud-based IoT setups.
Artificial Intelligence (AI) is expected to be a $70 billion industry by 2020 [6]. It is an important technology for smart machine development. For instance, AI is used by the U.S. Automobile Association to provide safety for self-driving cars [7]. Moreover, the great interest in AI and big data has created opportunities for companies such as Google to utilize AI in their cloud-based services [8]. The use of AI at the edge of the network will improve the computational speed and the range of IoT-based industrial applications. In addition, in Industrial IoT (IIoT) a large amount of data is collected by sensing devices and is then transmitted to the cloud-data centers using Wireless Sensor Networks (WSNs) or the Internet [9]. Then, the cloud data-center can monitor and analyze the collected IoT big data. Therefore, the big data analytics in the cloud data center is crucial in the IoT era in order to provide intelligent services such as smart healthcare. Using AI techniques in addressing data delivery in the IoT environment provides a kind of deep learning which can be applied to manage the uncertainties. Deep learning methods provide precise results and high performance in big data applications [10]. Moreover, deep learning helps to improve IoT security by performing classification tasks directly from the images and texts [11]. With recent advancements in deep learning, several applications such as tracking and localiza-tion, audio sensing, and user identification have utilized Deep Neural Networks (DNNs) to better make sophisticated map-ping between the input measurements from the sensors and the predicted values. In addition, deep learning techniques such as Convolution Neural Networks (CNNs), Long Short-Term Memory (LSTM), auto-encoders, deep generative mod-els and deep belief networks have already been applied to efficiently analyze possible large collections of data.
Applications of these methods in medical signals and images can aid the clinicians in clinical decision-making. Deep learn-ing is one of the extensively applied techniques that provides state of the art accuracy. It opened new doors in medical image analysis as well. Applications of deep learning in healthcare cover a broad range of problems ranging from can-cer screening and disease monitoring to personalized treat-ment suggestions. For example, in [12], the authors proposed a methodology for classifying DNA microarray. Artificial Bee Colony (ABC) is used for dimensionality reduction to select the best set of genes to find out particular diseases. The reduced genes are then utilized to train Artificial Neu-ral Networks (ANNs) to classify the DNA microarray. The study in [13] presents a hybrid method of forward neural network and improved ABC to classify a magnetic resonance brain image as normal and abnormal. Parameters of forward neural network are optimized using improved ABC which is based on both fitness scaling and chaotic theory. In addition, the study in [14] uses ant colony technique for optimization of the weights of neural networks. Moreover, it trains the neural network for pattern classification. In [15], a hybrid technique is used for training of the neural network in order to provide back propagation with good initial weight using global optimization algorithm. A few studies build a relation-ship between people’s personal health and smartphone sensor data using a traditional deep learning method called Deep Stacked AutoEncoder (DSAE). In this method, data from the smartphones can be categorized based on various states of the user motions (e.g. running, walking, standing and sitting). In addition, the authors build the quantitative correlation between individual health and the classified sensor data. The performance of the proposed method is also verified using a simulation experiment.
Apart from the healthcare, deep learning techniques have been extensively utilized in signal processing applications. For example, the study in [16] describes some of the neuro-modeling methodology used for applications in signal processing and pattern classification and recognition. The authors indicate their original contributions such as hybrid optimization for optimal design of frequency selective sur-faces, optimization of neural network for pattern classifica-tion and recogniclassifica-tion using wavelet transforms.
As discussed in this section, various studies consider AI algorithms and deep learning in several applications such as healthcare and signal processing as well as in tracking and localization, audio sensing, and user identification. However, no study considered the use of AI technology and deep learning in quantifying uncertainty for big data cloud services delivery which is an important part of the design and service provisioning approaches in the IoT Era. The computational power needed to find the optimal pricing is already a com-putationally expensive task while introducing the uncertainty problem makes this to a highly computational problem that would require more power to solve compared to a single com-puter. This introduces the IoT solution by itself where using distributed systems can actually help solving the problem
by taking all the uncertainty factors into consideration. This would allow companies not only to solve the uncertainty in their mathematical models but also predict future pricing if used properly.
Therefore, our main contributions in this paper are as follows.
• We propose an optimized pricing framework covering a cost-effective IoT infrastructure.
• To be best of our knowledge, this study is the first study to address data delivery issues in the cloud-based IoT era using AI technology and deep learning considering uncertainty factors.
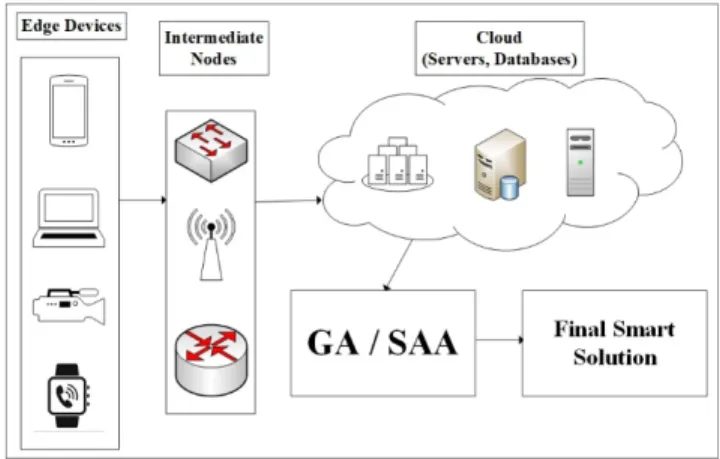
• The performance of the proposed framework is inves-tigated using two AI-based algorithms called GA and SAA in both centralized and distributed versions. In order to assist the readers, a list of abbreviations along with their brief definitions used throughout the paper is provided in Table 1. Moreover, the general overview of the whole system in this study is depicted in Figure 1 showing how the information is coming to the cloud and being processed intelligently using GA and SAA.
TABLE 1. List of abbreviations.
The rest of this paper is organized as follows. Section II outlines the related works and background behind the pric-ing model and uncertainty factors which are introduced in
FIGURE 1. An overview of the system model.
Section III. Moreover, the algorithms used in the study are presented in section IV. Section V discusses the results and findings of the study. Finally, section VI concludes this paper.
II. BACKGROUND
Uncertainty features can be utilized to provide services in a way that the overall requirements of the communication systems are satisfied. Cloud-based IoT paradigms provide unique services that are possible only through smart devices such as smartphones, tablets, sensors, tags, etc. connected via the Internet. These services can be classified into three categories; computing services, storage services, and com-munication services. In cloud-based IoT systems, several configurations for the shared computing load among various devices/nodes can be considered and the processing require-ments may differ according to the actual work. Pricing the uncertainty in these configurations plays a key role in pro-viding a real-time response and improves the reliability of the system.
Meanwhile, in IoT systems, a massive amount of data can be generated using billions of sensor devices in smart environments. These devices are not even capable of storing the generated data for one day. Moreover, it is not necessary to push all the data directly to the cloud, if there is redundancy or irrelevance in data. Therefore, a few of these devices can vol-unteer to store partial data based on a pricing model temporar-ily. Together with computing services, storage services can filter, analyze, and compress data for efficient transmissions. On the other hand, the utilized wireless protocols control the communication services in the cloud-based IoT systems. These protocols can adapt for narrow-band transmission, low-power operation, or longer range of coverage because of the constrained resources per smart device. An efficient pricing model can combine these protocols into a single globalized communication system utilized by the cloud. This would help to manage subnetworks of smart devices such as sensors and actuators in addition to providing security and reliability in the IoT system.
Nowadays, these three categories of services are offered based on static/mobile devices in the IoT paradigm.
However, the data delivery in these services varies as well based on the utilized device and technology. For example, 4G Long Term Evolution (LTE) has lower costs since no radio network controller for 3G Wideband Code Division Multiple Access (WCDMA) and service continuity can be obtained by interfacing different systems such as WCDMA [17]. More-over, costs are measured and distributed between different service layers in production of cloud services. For various communication technologies, hardware-, software-, cooling-, and cloud utilization- cost would be different and therefore, the price of services vary accordingly.
There have been a number of attempts for addressing data delivery problem by providing a pricing framework in the IoT-based cloud environment. For example, Hybrid Energy-Efficient Distributed clustering (HEED) algorithm [18] tack-les the computational power that is needed when it comes to distributed systems. The new simplified version of this algorithm reduces communication between the master node and the slave nodes [19]. In this study, the approach is based on scattering data into the computing nodes, since every node computes a completely independent uncertainty prob-lem. The master node will only gather the data after it is completely processed a coupled analysis approach.
Addressing data delivery and exchange in the IoT-based cloud by providing a pricing framework is considerably important nowadays [4]. It allows us to compute the required price for each node in the cloud. Different incentives can take part in the pricing model that dictates the choice of a group of candidates for data processing. Recent results in incentive-based data exchange have been well studied. For example, in [20], the authors present a comprehensive investigation on routing and forwarding in MANETs by focusing on the gain per individual node.
Moreover, quantifying uncertainty in data driven equip-ment health monitoring is a research topic considered in various studies and it is of paramount importance in machine-assisted medical decision making. For example, analytical algorithms are used to estimate the uncertainty in prognostic. The authors consider different sources of uncertainty such as inaccurate measurement of sensors, and the operating and loading conditions of the system in order to quantify their integrated effect on prognostics or remaining useful life pred-ication. In these studies, different types of uncertainties are propagated to formulate an uncertainty propagation problem using the state space model until failure. The state space models are also used to estimate the future states of the system. Unlike the presented analytical approaches, other studies focus on the same problem using a much simpler approach. The authors utilize a group of DNNs to model the available sensor data time-series until a specific point in time without estimating the future state of the system. In addi-tion, the use of dropout at the interface time is proposed to provide Bayesian approximation in the remaining useful life predication. Similarly, other studies utilize a group of neural networks to estimate predictive uncertainty and show their use compared to Bayesian models.
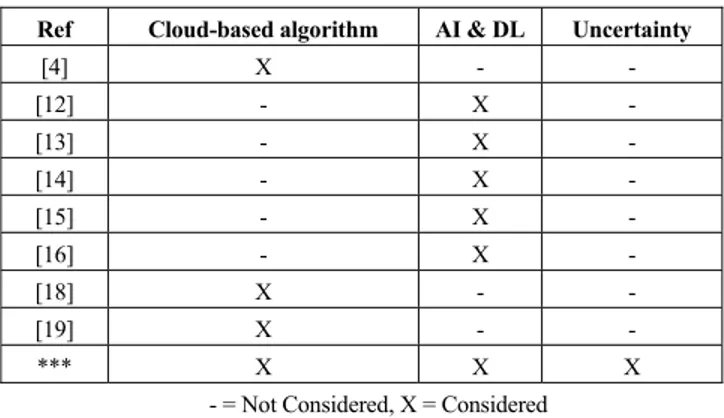
The pricing model presented in this study is based on the laws of supply and demand [4]. Moreover, uncertainty is available in delivering data through the cloud but a proper research about the uncertainty in the cloud has not been con-ducted yet. This allows us to address the problem of pricing model simultaneously with uncertainty factors in terms of the topological order, transmission and reception energy, nodal charge and nodal power as well as computation capacity in the pricing model. Adaptive optimization algorithms have been applied in this study in order to overcome prices uncer-tainty in cloud-based services. The GA and SAA were used to find sub-optimal solutions using distributed and parallel systems [20]. A summary of the state of the art studies in the literature in presented in Table 2 in comparison with our study.
TABLE 2.Summary of the studies in comparison with our study.
III. SYSTEM MODEL
There are different tools available for testing uncertainties in cloud-based IoT systems such as SALSA [21]. However, the problem with these tools is that the developers need to have fixed the current virtual structures and they must determine the description of the system for accurate deploy-ment. Moreover, cloud-based IoT systems can be modelled using software engineering tools [22] but it is not possible to integrate them with the deployment tools or incorporate them with uncertainty objectives [23]. Other tools lack char-acteristics for specifying test configuration based on uncer-tainty models. Therefore, an optimized pricing framework covering a cost-effective IoT infrastructure is proposed in this study to address the data delivery issues in the IoT era using intelligence and deep learning technology by considering uncertainty factors.
In this section, we describe our main system model used in addressing the pricing uncertainty in cloud-based IoT infras-tructure. The assumed pricing is as follows [4]:
pi =γi∗[
Etx+ Erx
Ei
+π + Ui+ S +CSBs] (1) whereγiis a pricing factor for each node providing the same
based on the state of the current resources in the system. Etx and Erx are transmission and reception energy
respec-tively. Ei, π and Ui represent nodal charge, nodal power
and computation capacity respectively. Furthermore, S is the security level and CSBs represent the accuracy of the brokers in the pricing framework.
Moreover, another issue in this regard can be related to the uncertainty in wireless signal strength. The signal level from a transmitter to a receiver at distance D can be varied according to the environment. These differences can be captured using a model called log-normal distribution model. The signal level at distance D follows this distribution centered on the average value of the power at that point. This model can be formulated as follows:
PR= M0−10PLlog(D) − µD (2)
In Equation (2), D is the distance between transmitter and receiver, PL represents the path loss content computed
according to the data obtained from the experiment, M0 is
the constant computed according to the average height of the receiver and transmitter, andµ is a normally distributed random variable with the variance of σ2 and the mean of zero.
In this study, genetic and simulated annealing algorithms are used to solve the problem as we are trying to optimize the outcome of the mathematical model. Together with the uncertainty factors, it would be hard to actually compute on a single node since this would require too much time to compute if the uncertainty arrays are significantly large. Uncertainty factors are represented by the constants of the pricing model whereγi,π, Ui, and Eiare assigned different
values every time the algorithm works. This would allow us to simulate various conditions that might actually be present in the future based on a level of probability of uniform distribu-tion. The constants are represented in an array of uncertainty numbers. For example, [0.6, 4, 55, 14] is an uncertainty array where 0.6 represents the network inter-connectivity. The numbers 4 and 55 would represent the amount of charge every node will need and the capability per node respectively. The number 14 in the uncertainty array would represent the number of packets the node has to process and relay. More-over, the size of the uncertainty array can vary ranging from 8 to 2000 entries. The issue of uncertainty would be crucial when it comes to the whole networks of smart environments integrated with other complex IoT networks such as smart cities, smart healthcare, and smart energy systems. The afore-mentioned factors may influence the occurrence of the uncer-tainty in the cloud-based IoT environments. Heterogeneity of devices and wide scale use of wireless technology may cause uncertainty in transferring speeds, and delay in delivery of data. For example, uncertainty is one of most important problems in most IoT systems based on Radio Frequency Identification (RFID) technology [24]. In this context, uncer-tainty can happen due to inconsistent data. Since RFID tags can be read using different readers simultaneously, therefore, it is possible to obtain inconsistent data about the precise
location of the tags. Captured data may include redundant data with significant amount of additional information which may be another cause of uncertainty.
In this paper, using a distributed computation approach, the uncertainty array is mapped to different nodes with the same algorithm that is ready to perform the computation. This would allow different nodes to take apart of the heavy process instead of one processor doing all the tasks. The array of a certain size would be mapped to these different nodes and this provides a speed up of 60% since both algorithms are distributed according to Amdahl’s law.
IV. PROPOSED ALGORITHM
In this section, we propose two AI-based algorithms called GA and SAA to solve the pricing framework discussed in Section III in the cloud-based IoT infrastructure in order to compute the required price for each node in the cloud. The main idea here is to optimize the abovementioned uncertain values in the pricing framework presented in Equation 1. First, GA is used to quantify the uncertainty in the pricing model.
GA is a metaheuristic and AI-based probabilistic searching algorithm that helps to optimize the solution of the pricing framework in the cloud-based IoT era. The pseudocode for the algorithm is given as follows in Algorithm 1.
Algorithm 1 Genetic Algorithm (GA) 1. Initialize: Gmax, PoC, PS, PoM 2. Generate initial random solution (δ)
3. Compute Piin Eq. (1) 4. Select best found solution
5. For i = 1 to Gmax
6. For j = 1 to PS/2
7. Select two parents using tournament_selection
8. Apply crossing-over between the parents with PoC
9. Apply mutation with PoM
10. End For
11. Replace parents with children
12. Generate the new population
13. Compute Piin Eq. (1)
14. End For
15. Return best found solution
In the GA, the algorithm begins by initializing Gmax,
PoC, PS, and PoM in line 1. Gmaxis the maximum generation
number such that the best solution is found. PS represents the population size. PoM and PoC are probabilities of mutation and crossover respectively. The initial random solution based on PS is generated in line 2. In line 3, pi is computed in
accordance with Equation 1. And in line 4 we select the best found solution. In lines 5 – 14, we iterate over a specific generation number, and in lines 6 – 10, we iterate over half of the PS since we choose two parents at each generation for applying crossover. In line 7, two parents are selected using tournament selection. In line 8, we apply crossover operation to generate two children and mutate them using PM
in line 9. Line 10 ends the inner ‘‘for’’ loop. In line 11, all the parents are replaced with the newly generated children. In lines 12 and 13, we generate the new population and compute the piin Equation 1 respectively. Line 14 ends the
outer ‘‘for’’ loop. And in line 15, the best found solution is returned. The centralized version of the algorithm would run on a single node which is processing all the entries of the uncertainty array and running the algorithm on each entry. However, the distributed version of the GA utilizes the map function that will chunk the uncertainty array and will scatter the entries upon the number of nodes that are available.
Simulated Annealing Algorithm (SAA) is used to compare the performance of the GA in its centralized and distributed forms. SAA is another AI-based algorithm which can be used to solve NP complete optimization problems in a heuristic approach [25]. The usefulness of the SAA is related to two heuristics of iterative enhancement approach and divide and conquer [25]. For instance, SAA is an effective approach in the mitigation of Virtual Machine (VM) in the cloud or edge [26] because by increasing the number of VMs in the data center it would be computationally difficult to check the number of Physical Machines (PMs) to be turned off, and which VMs to be chosen and moved to other PMs. Therefore, SAA can be utilized to find an approximate (if not optimal) solution for the problem. The pseudocode for the SAA is given in Algorithm 2.
Algorithm 2 Simulated Annealing Algorithm (SAA) 1. Initialize T0,δ0,α, a, b
2. δ = δ0, δF=δ0, T1=T0
3. For i = 1 to a
4. For j = 1 to b
5. Generate a random solution (δ)
6. Calculate its price using Piin Eq. (1) (f(δ)) 7. Generate a random neighboring
(close to) solution (δTemp)
8. Calculate the new solution’s price (f(δTemp)) 9. Compare them:
10. If: f(δTemp) ≤ f(δ) then
11. δ = δTemp
12. End If
13. Else If: U(0, 1) ≤ e−(
(f(δTemp)−f(δ)) Tt )then 14. δ = δTemp 15. End Else If 16. If: f(δ) ≤ f(δF) then 17. δF =δ 18. End If 19. End For 20. Tt+1=α.Tt 21. End For 22. ReturnδF
In line 1 of algorithm 2, we initialize T0,δ0,α, a, and b.
T0 is the initial temperature of the system which is used to
enable the acceptance or rejection of the solutions. We assign
a maximum temperature to T0and reduce it slowly by using
α as the cooling factor which was set to 0.85 in this study. The initial solution (δ0) is also initialized in line 1 in order to be
used for the selection of better results. In addition, a and b represent the number of stages, and the count of moves in each stage with a specific temperature in the algorithm respectively. In line 2, the initial value is assigned toδ as well asδF as the final solution. Moreover, the temperature
is initialized to the current temperature. Lines 3 – 21 iterate over the initialized number of stages. And lines 4 – 19, iterate over the number of moves in a specific stage. Line 5 generates a random solution and its price is calculated using pi in
Equation 1 in line 6. Line 7 generates a random neighboring solution (δTemp) and the new solution’s price is calculated
in line 8. Line 9 compares the solutions. Line 10 checks if the new solution is better than the current solution. If the condition in line 10 is met, then the new solution is assigned to the current solution in line 11. The first ‘‘If’’ statement is ended in line 12. The current temperature Tt is utilized in
line 13 to find an exponential value. This value is compared with a random number between 0 and 1 (U (0, 1)) to specify whether or not the temporary bad solution should be accepted. If the condition in line 13 is met, then the temporary solution is assigned to the current one in line 14. Line 15 ends the ‘‘Else if’’ statement. Line 16 checks if the current solution is better than the final solution (δF). If the condition in line 16
is satisfied, then the current solution is assigned to the final solution. Lines 18 and 19 end the ‘‘If’’ statement and the inner ‘‘for’’ loop respectively. The next stage temperature of the system (Tt+1) is computed in line 20 using the cooling factor.
Line 21 ends the outer ‘‘for’’ loop. Finally, line 22 returns the final solution.
We remark here, that centralized version of SAA would have the same processing time as of the centralized version of the GA. Meanwhile, the distributed version of the SAA uses all the nodes available to compute the uncertainty array by mapping each entry to a node. In the next section, both algorithms are compared in both forms, centralized and dis-tributed, in terms of various uncertainty factors in the pricing model.
V. PERFORMANCE EVALUATION
An i7-4770HQ processor and 16GB of Random Access Memory (RAM) are used to simulate the nodes of the dis-tributed system. The number of entries used in the experiment creates the uncertainty array. Each entry represents a number of constants in the pricing model equation. The equation is considered as the objective function for the algorithms used in this experiment. The simulation code is written in python and uses the multiprocessing library to map the entries of the uncertainty array to the nodes processing it.
A. SIMULATON METRICS AND PARAMETERS
The simulation tool randomly generates the uncertainty array based on the amount of entries required. The aforementioned algorithms are utilized to compute the optimal results for
each entry. The parameters used in the simulation are as follows:
1) NETWORK TOPOLOGY (γi)
This is the topological order that would affect the pricing model. Companies try to reduce the cost and increase their profits since moving data from a source to a destination would have a cost for them. This would help them achieve that by representing the number of nodes the data package went through before reaching destination. This factor can be calculated based on the state of the current resources in the system.
2) TRANSMISSION ENERGY (Etx)
It is the energy consumed per transmitted packet measured in joules. This factor represents the varying energy requirement per connected device to the cloud.
3) RECEPTION ENERGY (Erx)
It is the energy consumed by the received packet measured in joules.
4) NODAL CHARGE (Ei)
It represents the charge that is needed per node. Nodal charge varies from a node to another.
5) NODAL POWER (π)
It represents the power consumption per node.
6) COMPUTATION CAPACITY (Ui)
It represents the capacity to compute and relay messages as a factor of utilization.
The following performance metrics are considered to assess the proposed model.
7) RUNNING TIME
This metric represents the time it takes for the GA and SAA to solve the pricing model in both centralized and distributed versions.
8) ENERGY CONSUMPTION
This is the average energy consumed by the nodes consider-ing both algorithms. This metric is measured in (mJ).
9) AVERAGE DELAY
This metric represents the delay which may occur due to the increase in the size of the uncertainty array.
10) THROUGHPUT
This is the overall network throughput which is measured in Megabytes per second (Mbps). This metric represents the total amount of successful works per the time unit in terms of the total data received by the algorithms.
B. RESULTS AND DISCUSSIONS
The flexibility of cloud-based infrastructures requires a cost-effective pricing model to enhance the reliability of the sys-tem especially for the ones under uncertainty. Pricing the uncertainty in the cloud-based IoT configurations plays a significant role in providing a real-time response and improv-ing the reliability of the system. Moreover, understandimprov-ing the pricing problem in a cloud-based platform will provide useful insight into the complexity of the problem in the presence of uncertainty as well as on the cloud monitoring value network. As discussed earlier, in this paper, various performance metrics such as network topology, transmission energy, reception energy, nodal charge, nodal power and computation capacity are used in the simulation to randomly generate the uncertainty array based on the amount of entries required. During experiment,γi was set to have a uniform
distribution between 0 and 1 whereas Ui was set to have
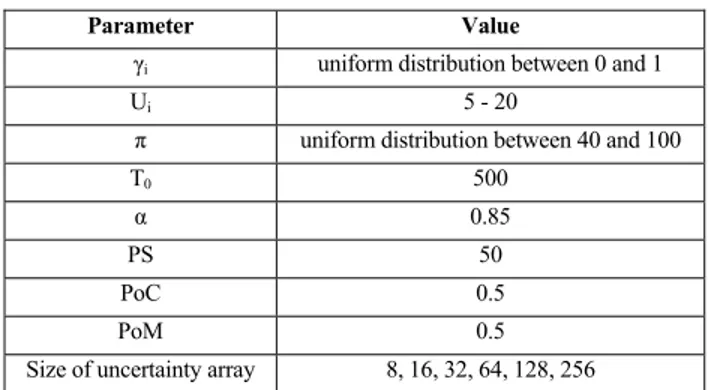
a value between 5 and 20 to have the most random data packages income and processed. Furthermore,π would have a uniform disturbed value between 40 and 100 to illustrate the different power consumption that every node uses. In the pricing model problem, the SAA and the GA both have the same entries of data to show which one would be more accurate on distributed systems. The test is performed by creating uncertainty arrays that has the following sizes: 8, 16, 32, 64, 128, 256. They are all computed by both algorithms to find the best algorithm on distributed systems. Moreover, an initial temperature (T0) of 500 was chosen for the SAA
and the cooling factor (α) in the SAA was set to be equal to 0.85. Additionally, initialization for the GA was done as follows. The PS was selected as 50, and the stopping criteria as 500. Both PoC and PoM were chosen as 0.5. Table 3 shows a summary of all the simulation parameters used throughout the paper.
TABLE 3.Simulation parameters.
The following figures reveal the average execution time value over 100 runs for both GA and SAA. In the simula-tion, the relative precision is employed as one of the most commonly utilized stopping criterion, and therefore, the sim-ulation is stopped at the first checkpoint when the condition δ ≤ δmax is satisfied. In this condition, δmax can have a
value between 0 and 1 (0 < δmax < 1) and it represents
the maximum acceptable value of the relative precision of the confidence intervals at the 100(1−α)% significance level. All the results obtained from the simulations are within the confidence interval of 5% with a confidence level of 95%. Therefore, the default values for both α and δ in our sim-ulation are set to 0.05. This in turn helps in evaluating the evolutionary convergence of the algorithms.
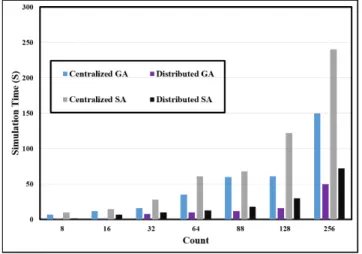
As shown in Figure 2, GA and SAA perform well when they are distributed but the GA shows its powerful com-putation power compared to the SAA when it comes to centralized or distributed systems. The 256 entries reveal that the running time of the distributed GA is less than 50 seconds with a 4 seconds difference than the previous experiment which would be counted as computational timing error.
FIGURE 2. Uncertainty factors.
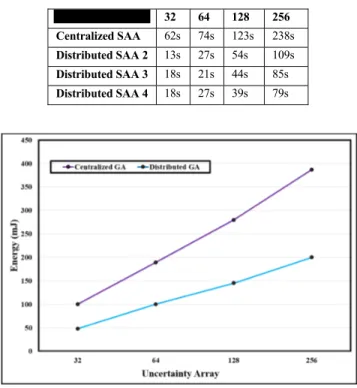
TABLE 4. Centralized vs. distributed GA & SAA.
The results presented in Table 4 show that how the SAA grows exponentially when we take an uncertainty value of 2n in its centralized form. Furthermore, its performance in the distributed form is reduced to half. However, the GA provides promising results in terms of running time when it runs on a distributed manner since every array of uncertainty is mapped to a node with a GA ready to compute the variables. For instance, with the centralized GA, it runs more than 2 minutes with the uncertainty array of 256 entries whereas it just takes 49 seconds with the distributed GA. Moreover, the SAA shows that it takes longer when calculating the 256 entries with a running time of 4 minutes whereas it took only 2 minutes and 41 seconds computing the previous 256 entries.
Please note that the experiment was done using a dis-tributed system that has 4 cores in its computational power. The following figures represent the uncertainty factors pro-portional to time. The pricing problem is solved using dif-ferent core powers to represent the speed up that distributed systems would achieve when it solves/computes uncertainty. For this experiment, the test is performed by creating a matrix of uncertainty that held 64, 88, 128 and 256 entries of uncer-tainty. In addition, it considers various computational power to see how it would affect the running time of the algorithms compared to the centralized approach. Figure 3 shows how the distributed system helps in computing uncertainty prob-lems when it comes to time and core efficiency. Considering the computation on two different nodes, the algorithm shows that it takes approximately 2 minutes compared to the 50% speed up. This shows that predicting the pricing model of any node is possible if the algorithm is efficient enough to be distributed.
FIGURE 3. Uncertainty factors - GA.
TABLE 5.Simulation time vs. different nodes for GA.
The results presented in Table 5 show how the uncertainty factors are affected by the number of present nodes. The centralized GA is compared with the distributed approach considering 2, 3, and 4 nodes. With 256 entries, it is shown that the centralized algorithm takes 2 minutes to actually compute all the entries whereas increasing the nodes would make the computational time lower. This approach can be implemented with more nodes and more uncertainty fac-tors allowing us to compute more facfac-tors in the pricing model.
The same experiment was conducted for the SAA with different number of distributed nodes to see the effect of
uncertainty on the computational power of the algorithm. The uncertainty array that was computed in the previous test was used again to have a consistent metric.
As shown in Figure 4, the distributed system actually helps in computing uncertainty problems when it comes to time and core efficiency. The algorithm shows that running 256 entries in a single node is computationally expensive using the SAA. On the other hand, using distributed systems help to find the optimal solution most of the time.
FIGURE 4. Uncertainty factors - SAA.
FIGURE 5. Running time of GA vs. SAA.
In addition, the results show that the GA has lower running time compared to the SAA in all the test cases. For exam-ple, Figure 5 compares the running time of the centralized GA with the centralized version of the SAA considering various uncertainty arrays. As the size of uncertainty array increases, the running time of both algorithms increase. How-ever, the GA has lower running time in all the cases.
The results presented in Table 6 compare the distributed SAA and the centralized SAA in terms of running time. With 32 entries, the centralized SAA surpasses the 1-minute mark, in which the GA is able to compute the 256 entries with a lower running time. Moreover, the distributed one performs
TABLE 6.Simulation time vs. different nodes for SAA.
FIGURE 6. Energy consumed vs. uncertainty array - GA.
FIGURE 7. Average delay vs. uncertainty array - SAA.
better since multiple nodes perform the heavy computation instead of a single node.
In Figures 6 – 8, we studied other important parameters such as energy consumption, average delay and network throughput, while varying the size of the uncertainty array. We applied this experiment to compare the performance of both GA and/or SAA in the centralized and distributed ver-sions. Figure 6 shows the average energy consumption of GA per delivered data packet which is a linear relationship. The results show that the distributed version of GA has up to 52% improvements compared to the centralized version of the algorithm.
In Figure 7, the average delay per packet of the SAA in both centralized and distributed versions is compared while
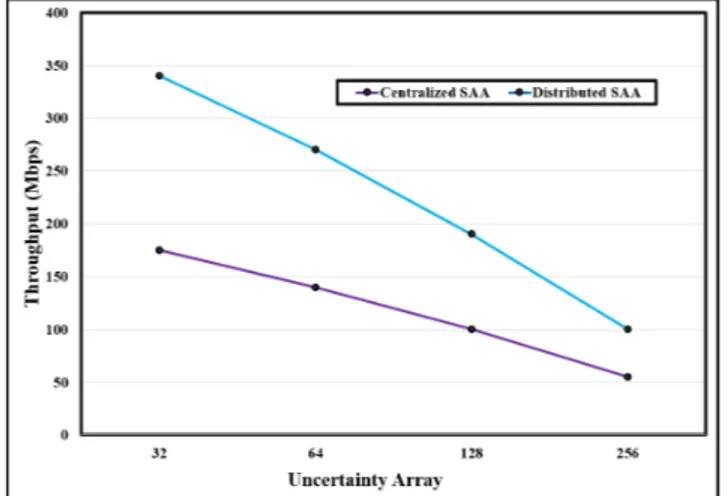
FIGURE 8. Throughput vs. uncertainty array - SAA.
varying the size of uncertainty array. As we increase the size of uncertainty array, the delay in the system increases too. However, the distributed SAA has a better performance compared to the centralized SAA. This increase in the delay reduces the overall network throughput of the SAA as shown in Figure 8.
VI. CONCLUSION AND FUTURE WORK
Uncertainty is an important issue that affects computing effi-ciency and brings additional challenges to cloud providers in the IoT environments. In this paper, we propose a pricing framework for a cloud node in the IoT era by considering uncertainty factors such as network topology, transmission/ reception energy, nodal charge and power, and computation capacity. With all the factors that might change in the net-work, the aim of this study is to use IoT itself to calcu-late these uncertainty variables for the pricing of the cloud nodes. The results presented based on calculating the uncer-tainty on centralized and decentralized algorithms show a significant improvement in terms of computing uncertainty in the cloud-based IoT era. Based on the results presented, distributed algorithms outperformed the centralized algo-rithms in all the given test cases. Furthermore, the results show that the GA has lower running time compared to the SAA in all the test cases with 68% of improvement in the centralized version, and 66% of improvement in the dis-tributed version in case when the size of uncertainty array is 256. When the size of uncertainty array increases, the algo-rithms’ speed-up in the distributed systems is phenomenal. We achieved 60% speed-up in the distributed GA compared to its centralized version. This would be helpful for the companies to actually compute their profit and loss when it comes to IoT.
In the future, the performance of proposed framework will be evaluated using other AI-based and deep learn-ing algorithms such as ANN, RF, K-nearest neighbor, and SVM in order to find the optimal algorithm in providing big data services in the cloud by considering uncertainty factors.
REFERENCES
[1] W. Sun and W. Hu, ‘‘Integrated data flow delivery with built-in mass storage,’’ in Proc. 16th IEEE Int. Conf. Transparent Opt. Netw. (ICTON), Jul. 2014, pp. 1–4.
[2] M. Kheirkhah, I. Wakeman, and G. Parisis, ‘‘Multipath transport and packet spraying for efficient data delivery in data centres,’’ Comput. Netw., vol. 162, Oct. 2019, Art. no. 106852.
[3] A. Greenberg, J. R. Hamilton, N. Jain, S. Kandula, C. Kim, P. Lahiri, D. A. Maltz, P. Patel, and S. Sengupta, ‘‘VL2: A scalable and flexible data center network,’’ Commun. ACM, vol. 54, no. 3, pp. 95–104, 2011. [4] F. Al-Turjman, ‘‘Price-based data delivery framework for dynamic and
pervasive IoT,’’ in Cognitive Sensors and IoT. Boca Raton, FL, USA: CRC Press, 2017, pp. 187–222.
[5] A. Tchernykh, U. Schwiegelsohn, V. Alexandrov, and E. G. Talbi, ‘‘Towards understanding uncertainty in cloud computing resource provi-sioning,’’ Proc. Comput. Sci., vol. 51, pp. 1772–1781, Jun. 2015. [6] K. Hwang, Cloud Computing for Machine Learning and Cognitive
Appli-cations. Cambridge, MA, USA: MIT Press, 2017.
[7] A. de Jesus. (Jan. 16, 2019). AI for Self-Driving Car Safety—Current Applications. Accessed: Jul. 1, 2019. [Online]. Available: https://www. emerj.com
[8] R. Fleming. (Apr. 2019). Google AI Services Top 10 Report— Excerpt for Accenture. Accessed: Jul. 1, 2019. [Online]. Available: https://www.accenture.com
[9] Q. Zhang, L. T. Yang, Z. Chen, P. Li, and F. Bu, ‘‘An adaptive dropout deep computation model for industrial IoT big data learning with crowd-sourcing to cloud computing,’’ IEEE Trans. Ind. Informat., vol. 15, no. 4, pp. 2330–2337, Apr. 2019.
[10] A. Mary, O. Teena, and M. Aaramuthan, ‘‘An uncertain trust and prediction model in federated cloud using machine learning approach,’’ Int. J. Recent Technol. Eng., vol. 7, no. 5, pp. 93–97, 2019.
[11] W. Abbass, Z. Bakraouy, A. Baïna, and M. Bellafkih, ‘‘Classifying IoT security risks using deep learning algorithms,’’ in Proc. 6th IEEE Int. Conf. Wireless Netw. Mobile Commun. (WINCOM), Oct. 2018, pp. 1–6. [12] B. A. Garro, K. Rodríguez, and R. A. Vázquez, ‘‘Classification of DNA
microarrays using artificial neural networks and ABC algorithm,’’ Appl. Soft Comput., vol. 38, pp. 548–560, Jan. 2016.
[13] Y.-D. Zhang, L. Wu, and S. Wang, ‘‘Magnetic resonance brain image classification by an improved artificial bee colony algorithm,’’ Prog. Elec-tromagn. Res., vol. 116, pp. 65–79, 2011.
[14] C. Blum and K. Socha, ‘‘Training feed-forward neural networks with ant colony optimization: An application to pattern classification,’’ in Proc. 5th IEEE Int. Conf. Hybrid Intell. Syst. (HIS), Nov. 2005, p. 6.
[15] M. Mavrovouniotis and S. Yang, ‘‘Evolving neural networks using ant colony optimization with pheromone trail limits,’’ in Proc. 13th IEEE UK Workshop Comput. Intell. (UKCI), Sep. 2013, pp. 16–23.
[16] R. M. Cruz, H. M. Peixoto, and R. M. Magalhães, ‘‘Artificial neural networks and efficient optimization techniques for applications in engi-neering,’’ in Artificial Neural Networks—Methodological Advances and Biomedical Applications. Rijeka, Croatia: InTech, 2011.
[17] J. Byun, B. W. Kim, C. Y. Ko, and J.-W. Byun, ‘‘4G LTE network access system and pricing model for IoT MVNOs: Spreading smart tourism,’’ Multimedia Tools Appl., vol. 76, no. 19, pp. 19665–19688, 2017. [18] O. Younis and S. Fahmy, ‘‘HEED: A hybrid, energy-efficient, distributed
clustering approach for ad hoc sensor networks,’’ IEEE Trans. Mobile Comput., vol. 3, no. 4, pp. 366–379, Oct./Dec. 2004.
[19] R. Pawlak, B. Wojciechowski, and M. Nikodem, ‘‘New simplified HEED algorithm for wireless sensor networks,’’ in Proc. Int. Conf. Comput. Netw., Jun. 2010, pp. 332–341.
[20] F. Al-Turjman, L. P. Lemayian, S. Alturjman, and L. Mostarda, ‘‘Enhanced deployment strategy for the 5G drone-BS using artificial intelligence,’’ IEEE Access, vol. 7, no. 1, pp. 75999–76008, 2019.
[21] D.-H. Le, H.-L. Truong, G. Copil, S. Nastic, and S. Dustdar, ‘‘SALSA: A framework for dynamic configuration of cloud services,’’ in Proc. 6th IEEE Int. Conf. Cloud Comput. Technol. Sci., Dec. 2014, pp. 146–153. [22] M. Guerriero, S. Tajfar, D. A. Tamburri, and E. Di Nitto, ‘‘Towards a
model-driven design tool for big data architectures,’’ in Proc. 2nd Int. Workshop Big Data Softw. Eng., May 2016, pp. 37–43.
[23] H.-L. Truong, L. Berardinelli, I. Pavkovic, and G. Copil, ‘‘Modeling and provisioning IoT cloud systems for testing uncertainties,’’ in Proc. 14th EAI Int. Conf. Mobile Ubiquitous Syst., Comput., Netw. Services, Nov. 2017, pp. 96–105.
[24] A. Magruk, ‘‘The most important aspects of uncertainty in the Internet of Things field—Context of smart buildings,’’ Procedia Eng., vol. 122, pp. 220–227, Nov. 2015.
[25] I. Mohiuddin and A. Almogren, ‘‘Workload aware VM consolidation method in edge/cloud computing for IoT applications,’’ J. Parallel Distrib. Comput., vol. 123, pp. 204–214, Jan. 2019.
[26] H. Zhou, Q. Li, K.-K. R. Choo, and H. Zhu, ‘‘DADTA: A novel adaptive strategy for energy and performance efficient virtual machine consolida-tion,’’ J. Parallel Distrib. Comput., vol. 121, pp. 15–26, Nov. 2018.
FADI AL-TURJMAN received the Ph.D. degree in computer science from Queen’s University, Kingston, ON, Canada, in 2011. He is cur-rently a Professor with Antalya Bilim University, Antalya, Turkey. He is a leading authority in the areas of smart/cognitive, wireless, and mobile net-works’ architectures, protocols, deployments, and performance evaluation. He has published over 200 publications in journals, conferences, patents, books, and book chapters, in addition to numerous keynotes and plenary talks at flagship venues. He has authored/edited more than 20 books about cognition, security, and wireless sensor networks’ deployments in smart environments, published by Taylor & Francis and Springer. He has received several recognitions and best papers’ awards at top international conferences. He also received the prestigious Best Research Paper Award from Elsevier Computer Communications Journal for the period 2015 to 2018 and the Top Researcher Award at Antalya Bilim Univer-sity, Turkey, in 2018. He has led a number of international symposia and workshops in flagship communication society conferences. He currently serves as the Lead Guest Editor for several well reputed journals, including the Elsevier Computer Communications (COMCOM), Sustainable Cities & Sociaities(SCS), IET Wireless Sensor Systems, and the Springer EURASIP and MONET journals.
HADI ZAHMATKESH received the B.Sc. degree in physics from the University of Mazandaran, Iran, in 2008, and the M.Sc. degree in infor-mation systems and the Ph.D. degree in applied mathematics and computer science from Eastern Mediterranean University, Cyprus, in 2011 and 2017, respectively. He has recently completed a research project as a Postdoctoral Researcher at Middle East Technical University, Northern Cyprus Campus (METU NCC). His current research interests include the Internet of Things (IoT), computer net-works, wireless communication systems, wireless sensor netnet-works, and performance modeling.
LEONARDO MOSTARDA received the Ph.D. degree from the Computer Science Department, University of L’Aquila, in 2006. He was with the European Space Agency (ESA) on the CUSPIS FP6 project to design and implement novel secu-rity protocols and secure geo tags for works of art authentication, and he was combining traditional security mechanisms and satellite data. In 2007, he was a Research Associate with the Comput-ing Department, Distributed System and Policy Group, Imperial College London, working on the UBIVAL EPRC project in cooperation with Cambridge, Oxford, Birmingham, and UCL for building a novel middleware to support the programming of body sensor networks. In 2010, he was a Senior Lecturer with the Distributed Systems and Net-working Department, Middlesex University, where he founded the Senso LAB, an innovative research laboratory for building energy efficient wireless sensor networks. He is currently an Associate Professor and the Head of the Computer Science Department, Camerino University, Italy.