Universities of Siena, Florence and Pisa
Joint Ph.D Programme in Economics
XXXII Cycle
Three essays on the evaluation of public policies in the field of
addictions
Elisa Benedetti
Supervisor: Paolo Brunori
PhD Pogram Coordinator: Ugo Pagano
Academic Year: 2019-2020
ELISA BENEDETTI 28.01.2021 12:36:25 UTC
Three essays on the evaluation of public policies in the field of
addictions
Elisa Benedetti
Abstract
This dissertation, composed of three essays, aims at providing an evaluation of selected
public policies in the field of addictions, focusing on drugs and gambling. Evaluation is
increasingly recognised as essential for effective policymaking, helping to empirically verify
that policies and programmes have the desired effect, provide value for money and do not
have negative unintended consequences. In the case of socially undesirable behaviours,
policy evaluation is frequently challenged by the limited data available.
To tackle this challenge, the analyses proposed in the present work make use of novel
datasets which combine epidemiological, financial, political and administrative data.
On the one hand, addictive behaviours constitute an enormous source of revenue for
organized crime and for national governments, in the case of legal substances or behaviours
such as gambling. On the other hand, they represent a cost for public authorities, e.g., for
public health and law enforcement reasons. For these reasons, over the years several policy
approaches have been implemented to contrast the externalities produced by the spread
of addictive behaviours, however very limited work has been performed to evaluate their
effects.
The present dissertation aims at contributing to the literature seeking to provide evidence
on the possible intended and unintended effects of public policies on addictions, focusing
on selected policies aimed at regulating cannabis consumption and gambling.
The first chapter is aimed at analysing the effects that the drug policy reforms implemented
in Europe in the last 15 years had on youth cannabis consumption behaviours.
In
fact, cannabis is the most used illicit drug and accounts for the largest share of the
European illicit drug market. To tackle this longstanding problem, a broad set of reforms
to national cannabis control policies have been implemented, but their effectiveness in
achieving the desired results is still unclear. This essay analyses the association between
selected categories of cannabis policy reforms and changes in cannabis availability and use
among adolescents. Data from 20 European countries across 15 years were drawn from a
novel database of the European school Survey Project on Alcohol and other Drugs. The
influence of policy changes on reported access to cannabis and different frequencies of
use was estimated through an identification strategy based on a Differences-in-Differences
model, which application is allowed by the fact that only thirteen out of the twenty
countries included in the analysis implemented relevant reforms. The findings suggest
that selected categories of reforms influence the availability and prevalence of cannabis
among adolescents. In particular, some forms of restrictive interventions reduce the general
prevalence of use and more liberal reforms seem to cause an increase in the share of students
approaching cannabis. However, none of the analysed reforms seems to have been able to
influence the consumption habits of frequent users.
The second chapter deepens the analysis of the effects of drug policy changes by focusing
of the reform that in the period 2006-2014 criminalised the possession of cannabis for
personal use in Italy. The chapter addresses a key question in the ongoing policy debate
over cannabis’ legal status as to whether removing or increasing penalties attached to
cannabis use and possession leads not only to changes in the proportion of cannabis users,
but also to changes in the dynamics of cannabis use. Empirically investigating this aspect
is a growing field of study. This paper aims at extending previous research by studying
the effect of increasing penalties on initiation into cannabis use. This is done in the Italian
context where, despite the relevant drug policy reforms implemented over the last 30 years,
very little econometric studies have been performed to evaluate their effects. In order to
identify the effect of criminalisation on the transition into cannabis use, the paper exploits
the policy change that in the period from 2006 to 2014 increased the penalties attached to
cannabis possession in Italy. For this, a unique dataset pooling seven waves (2001-2017)
of the Italian Population Survey on Alcohol and other Drugs (IPSAD) is used.
The
empirical investigation is based on a Complementary Log-Log regression model to analyse
the starting rate, that is, the transition rate from non-use to use. The results suggest that
the introduction of higher punishments for cannabis possession has a significant, although
limited, effect in reducing the uptake of cannabis. However the research highlights that this
relative achievement need to be evaluated against the backdrop of the social consequences
of criminalisation.
The third chapter is aimed at assessing the market effects of limiting the supply of
gambling products. This is done by exploiting the effects of the local policies that imposed
restrictions on the supply of offline entertainment machines implemented in the years
2017-2018 by some municipalities in one of the Northern regions of Italy. The market
effects of reducing the allowed functioning time of offline entertainment machines are
assessed both on the level of the gross gambling turnover and on its composition in terms
of possible shifts towards online gambling products. Although the policy should have
applied to the entire regional territory, some municipalities did not approve the necessary
implementing acts, whilst others imposed functioning time restrictions with varying level
of intensity. This variation is exploited using a regression-based Differences-in-Differences
(DiD) design with continuous treatment with a unique dataset recording yearly gambling
turnover by type of game in the years 2016, 2017, and 2018 matched with data on
municipal acts collected for the study and socio-demographic variables.
The results
suggest that the implemented policies actually reduced the gambling consumption through
offline entertainment machines. However, no significant reduction of the total gambling
consumption was observed. In fact, focusing on the composition of gambling turnover there
is evidence of a shift toward online gambling products. These results support the argument
that limiting the physical availability of entertainment machines is an effective policy for
reducing the amount of resources invested by consumers in this type of game. At the same
time attention should be paid to the possible unintended effects on the shift towards other
gambling products, which by definition cannot be subject to similar restrictions.
Contents
List of Figures
iii
List of Tables
v
1
The impact of cannabis policy changes on cannabis use among
adolescents: evidence from Europe
1
1.1 Introduction . . . .
2
1.2 Literature review . . . .
5
1.3 Institutional setting: European policy classification . . . .
7
1.4 Data . . . 11
1.5 Empirical model . . . 14
1.6 Results . . . 16
1.6.1 Policy changes and perceived availability . . . 16
1.6.2 Policy changes and cannabis use . . . 17
1.7 Robustness Checks . . . 18
1.7.1 Sensitivity analysis . . . 19
1.7.2 Parallel trend test . . . 20
1.8 Discussion and conclusions . . . 21
1.9 Appendices . . . 24
1.9.1 Policy changes in Europe . . . 24
1.9.2 Other robustness checks . . . 25
2
Criminalisation and the onset of cannabis use
35
2.1 Introduction . . . 36
2.2 Institutional setting . . . 38
2.3 Data . . . 41
2.3.1 Long term trends in cannabis use onset . . . 42
2.3.2 Descriptive analysis . . . 44
2.4 Empirical model . . . 47
2.5 Results . . . 51
2.6 Robustness checks . . . 55
3
Assessing the impact of regional policy interventions limiting gambling
supply:
a quasi-natural experiment
62
3.1 Introduction . . . 63
3.2 Institutional setting . . . 65
3.3 Literature review . . . 66
3.4 Data . . . 67
3.5 Empirical model . . . 73
3.6 Results . . . 75
3.6.1 Effect of local interventions on gambling turnover . . . 76
3.6.2 Effect of local interventions on the “hybrid” and “on-line” components
of gambling turnover . . . 78
3.7 Robustness Checks . . . 83
3.8 Conclusions . . . 83
3.9 Appendix . . . 85
List of Figures
1.1 Trends in RMPS and controls groups . . . 30
1.1.a Perceived availability of cannabis . . . 30
1.1.b All users . . . 30
1.1.c Experimenters (last year) . . . 30
1.1.d Frequent users . . . 30
1.2 Trends in RPSMO and controls groups . . . 31
1.2.a Perceived availability of cannabis (all students) . . . 31
1.2.b All users (lifetime) . . . 31
1.2.c Experimenters (last year) . . . 31
1.2.d Frequent users . . . 31
1.3 Trends in FCMC and controls group . . . 32
1.3.a Perceived availability of cannabis (all students) . . . 32
1.3.b All users (lifetime) . . . 32
1.3.c Experimenters (last year) . . . 32
1.3.d Frequent users . . . 32
1.4 Trends in INPP and controls groups . . . 33
1.4.a Perceived availability of cannabis (all students) . . . 33
1.4.b All users (lifetime) . . . 33
1.4.c Experimenters (last year) . . . 33
1.4.d Frequent users . . . 33
1.5 Trends in IPP and controls groups . . . 34
1.5.a Perceived availability of cannabis (all students) . . . 34
1.5.b All users (lifetime) . . . 34
1.5.c Experimenters (last year) . . . 34
1.5.d Frequent users . . . 34
2.1 Number of drug supply-related offenders and prison population (1992-2017) 41
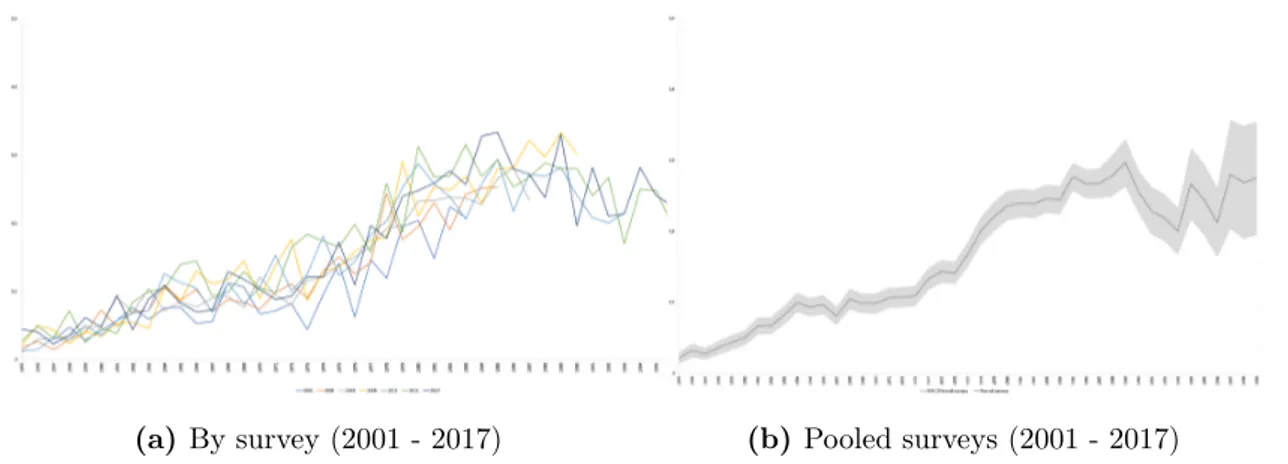
2.2 Proportion of cannabis first use at age less or equal to 20 among older
than 20 years, by birth cohort (1955-1996) . . . 42
2.2.a By survey (2001 - 2017) . . . 42
2.2.b Pooled surveys (2001 - 2017) . . . 42
2.3 Proportion of cannabis first use at age less or equal to 17 among older
than 17 years, by birth year (1955-1999) . . . 43
2.3.a By survey (2001 - 2017) . . . 43
2.3.b Pooled surveys (2001 - 2017) . . . 43
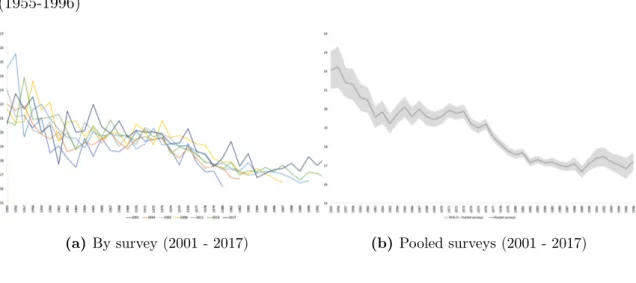
2.4 Average age of cannabis first use among older than 20 years, by birth
year (1955-1996) . . . 44
2.4.a By survey (2001 - 2017) . . . 44
2.4.b Pooled surveys (2001 - 2017) . . . 44
2.5 Hazard function for the uptake of cannabis . . . 46
2.6 Survival function for the uptake of cannabis . . . 47
2.7 Baseline hazard functions for the uptake of cannabis . . . 50
2.7.a Non-parametric form (log-likelihood: -29316.248; BIC: 58644.5;
AIC: 58706.29) . . . 50
2.7.b Logarithmic form (log-likelihood: -31087.628; BIC: 62181.26;
AIC: 62212.15) . . . 50
2.7.c Quadratic form (log-likelihood: -29460.171; BIC: 58928.34;
AIC: 58969.54) . . . 50
2.7.d Cubic form (log-likelihood: -29413.094; BIC: 58836.19; AIC:
58887.6) . . . 50
2.8 Predicted hazard rates for cannabis uptake for lower and higher risk
individuals not under the policy and under the policy . . . 53
2.9 Predicted survival functions for cannabis uptake for lower and higher
risk individuals not under the policy and under the policy . . . 53
2.10 Marginal effects of age on the probability of cannabis onset, by policy
regime and gender (95% CIs). . . 54
2.10.a At-risk period: ages 11-13 . . . 54
2.10.b At-risk period: ages 14-15 . . . 54
2.10.c At-risk period: ages 16-17 . . . 54
2.10.d At-risk period: ages 18-20 . . . 54
3.1 Geographic distribution of municipalities included in the sample, with
List of Tables
1.1 Classification of changes in cannabis law regarding possession for
personal use occurred in Europe from 2001 to 2014 . . . .
9
1.1 (Continued) . . . 10
1.2 Sample size by country and year . . . 12
1.3 Descriptive statistics of outcome variables . . . 13
1.4 Policies and share of of students considering easy to find cannabis . . 16
1.5 Policies and students using cannabis (in the last year) . . . 18
1.6 Policies and students using cannabis (in lifetime) . . . 19
1.7 Parallel trend test estimates . . . 20
1.8 Reduction of the prison sentence for minor offences . . . 25
1.9 Reduction of the maximum prison sentence . . . 25
1.10 Facilitation of the closure of minor cases . . . 26
1.11 Facilitation of the closure of minor cases - Parallel trend test estimates 26
1.12 Increase of the non prison penalties . . . 26
1.13 Increase of the non prison penalties - Parallel trend test estimates . . 27
1.14 Increase of the prison penalties . . . 27
1.15 Estimates and robustness check without controls . . . 28
1.16 Estimates and robustness check without Italy . . . 29
2.1 Penalties for the possession of cannabis (1990-2019) . . . 39
2.2 Sample means . . . 45
2.3 Correlation matrix of macro region of residence, per capita GDP and
unemployment rate . . . 48
2.4 Parameter estimates for the rate of uptake of cannabis (at-risk period
10-20) . . . 51
2.5 Parameter estimates for the rate of uptake of cannabis (at-risk period
10-25) . . . 56
2.6 Robustness check: Parameter estimates for the rate of uptake of
tobacco (at-risk period 10-20) . . . 58
3.1 Gambling payout and taxation by type of game . . . 69
3.2 Description of public games available in the dataset and categorisation
adopted . . . 70
3.4 Municipalities in the sample by type of regulation and year of adoption 72
3.5 Summary statistics (years 2016-2018) . . . 74
3.6 Estimated effect of municipal policies on total per capita gambling
turnover . . . 76
3.7 Estimated effect of municipal policies on per capita gambling turnover
from entertainment machines . . . 77
3.8 Estimated effect of municipal policies on Gambling Specialisation
Index for “exclusively land-based” games (i.e. entertainment machines) 78
3.9 Estimated effect of municipal policies on Gambling Specialisation
Index for all games excluding “exclusively land-based” (i.e. entertainment
machines) . . . 79
3.10 Estimated effect of municipal policies on Gambling Specialisation
Index for “hybrid games" . . . 80
3.11 Estimated effect of municipal policies on Gambling Specialisation
Index for “online games” . . . 82
3.12 Robustness check 1: Estimated effect of leaded municipal policies on
total per-capita gambling turnover . . . 85
3.13 Robustness check 2: Estimated effect of leaded municipal policies on
per-capita gambling turnover from entertainment machines . . . 86
3.14 Robustness check 3: Estimated effect of leaded municipal policies on
Gambling Specialisation Index for “exclusively land-based” games (i.e.
entertainment machines) . . . 87
3.15 Robustness check 4: Estimated effect of leaded municipal policies
on Gambling Specialisation Index for all games (“hybrid” and online
games), excluding “exclusively land-based” (i.e. entertainment machines) 88
3.16 Robustness check 5: Estimated effect of leaded municipal policies on
Gambling Specialisation Index for “hybrid games” . . . 89
3.17 Robustness check 6: Estimated effect of leaded municipal policies on
Gambling Specialisation Index for “on-line games” . . . 90
3.18 Estimated effect of municipal policies on per capita gambling turnover
from online games . . . 91
3.19 Estimated effect of leaded municipal policies on per capita gambling
turnover from “on-line games” . . . 92
3.20 Estimated effect of municipal policies on per capita gambling turnover
from all games (“hybrid” and online games), excluding “exclusively
land-based” (i.e. entertainment machines) . . . 93
3.21 Estimated effect of leaded municipal policies on per capita gambling
turnover from all games (“hybrid” and online games), excluding “exclusively
land-based” (i.e. entertainment machines) . . . 94
3.22 Estimated effect of municipal policies on per capita gambling turnover
3.23 Estimated effect of leaded municipal policies on per capita gambling
turnover from “hybrid games” . . . 96
3.24 Sensitivity analysis: total gambling turnover . . . 97
3.25 Sensitivity analysis: turnover from entertainment machines . . . 98
3.26 Sensitivity analysis: turnover from hybrid and online games . . . 99
3.27 Sensitivity analysis: turnover from hybrid games . . . 100
3.28 Sensitivity analysis: turnover from online games . . . 101
3.29 Sensitivity analysis: GSI of exclusively land-based games (entertainment
machines) . . . 102
3.30 Sensitivity analysis: GSI of hybrid games . . . 103
3.31 Sensitivity analysis: GSI of online games . . . 104
3.32 Descriptive statistic for municipalities included and excluded from
the study . . . 105
Chapter 1
The impact of cannabis policy
changes on cannabis use among
adolescents: evidence from Europe
Abstract
Cannabis is the most used illicit drug and accounts for the largest share of the illicit drug market. To tackle this longstanding problem, a broad set of reforms to national cannabis control policies have been implemented in Europe, but their effectiveness in achieving the desired results is still unclear. This paper analyses the association between selected categories of cannabis policy reforms and changes in cannabis availability and use among adolescents. Data from 20 European countries across 15 years were drawn from a novel database of the European school Survey Project on Alcohol and other Drugs. We estimate the influence of policy changes on reported access to cannabis and different frequencies of use. Our identification strategy is based on a Difference-in-Differences (DiD) design, which application is allowed by the fact that only thirteen out of the twenty countries included implemented relevant reforms. Our results suggest that selected categories of reforms influence the availability and prevalence of cannabis among adolescents. In particular, some forms of restrictive intervention reduce the general prevalence of use and more liberal reforms seem to cause an increase in the share of students approaching cannabis. However, none of them seems able to influence the consumption habits of frequent users.
Keywords: cannabis use and availability; drug policy; adolescents; ESPAD; policy impact; Differences-in-Differences.
1.1
Introduction
Cannabis policy is a topic of constant discussion and changes worldwide. This
is because, notwithstanding the coordinated efforts to disrupt cannabis market,
both supply and consumption indicators have constantly increased over the past
decades (UNODC, 2017). Since 2012, some jurisdictions in United States, Uruguay,
and more recently Canada, have legalised the production, distribution, and sale of
cannabis for non-medical purposes. In Europe, a renewed debate about reforms
to the national policies limiting access and restricting the use of cannabis has
developed (Rogeberg et al., 2018; EMCDDA, 2017a). In fact, although there is
some European Union regulation concerning cannabis trafficking offences, legislative
responses to unauthorised cannabis use and minor possession are still primarily
responsibility of individual member states and therefore little harmonised (Edwards
& Galla, 2014; Boekhout van Solinge, 2002). Although draft laws for cannabis
legalisation have been proposed in some national parliaments, to date no government
has expressed support for this idea, but several countries have implemented policy
reforms modifying the size of the penalties for trafficking and use-related offence
(EMCDDA, 2017a). Focusing on the latter, despite a general trend to reduce
punishments, few countries moved in the opposite direction. This results in a
variety of policy approaches running in parallel in Europe, which range from
administrative to criminal offences (Hughes et al., 2018), with the notable exception
of the Netherlands where a system of limited distribution has evolved since the
1970s. Furthermore, some countries legally treat cannabis like other drugs, whilst
in others penalties for cannabis are lower, typically because the level of harm that
the use of the drug may cause is taken into consideration (Pacula et al., 2005).
Despite the foregoing heated debate around the legal treatment of cannabis
possession, it is surprising to note that empirical research on the effects of the
different types of control policies is still limited (Pacula et al., 2014). Most
of the existing literature has tried to test the hypothesis based on the theory
of crime developed by Becker (1968), that higher penalties for drug possession
would discourage cannabis use by making the lifetime cost associated to a possible
punishment higher than the expected benefits of drug use. Gathering scientific
evidence firstly on whether and which type of cannabis policy reforms are able to
affect the availability of the substance and the prevalence of use, and secondly by
which type of users and by how much seems crucial in order to support the design
of effective policies (Williams and Bretteville-Jensen, 2014).
In recent years increasing attention has been devoted to the effects that
depenalisation of cannabis possession for personal use might have on the
consumption behaviour of young people (Anderson and Rees, 2014; Pacula et al.,
2014). This is because, cannabis is by far the most popular illicit substance among
youth, particularly in Europe, where adolescents show higher prevalence of cannabis
use compared to the adult population (EMCDDA, 2017b). Furthermore, research
shows that initiation into cannabis use typically occurs during the mid to late teens
(van Ours, 2006; Williams & Bretteville-Jensen, 2014) and that there is a strong
positive relationship between early first use and the length and intensity of cannabis
consumption during adulthood (Pudney, 2004; Etilé, 2006; van Ours and Williams,
2007). Since those who initiate cannabis use early are more likely to continue
using the drug later in life (van Ours and Williams, 2007), gathering evidence
on possible effects of cannabis policies on today’s adolescent consumption, may
provide useful insights into the long-term effects of policy reforms on consumption
among the general population. Despite the fact that policies ruling cannabis-related
offences are primarily targeted at adults, an adolescent deciding whether to use
cannabis for the first time is likely to be sensitive to its criminal status (Williams
and Bretteville-Jensen, 2014). It is also presumable that, by contributing to shape
the background drug culture of a society, drug policies may indirectly influence
adolescent cannabis use (Pudney, 2010).
The available literature analysing the possible effects of drug policies on youth
participation in cannabis use has provided mixed evidence and mainly focused on a
single type of policy, i.e. decriminalisation (Pacula, 2010). Some works did not find
significant effects (Thies and Register, 1993; Pacula, 1998; DiNardo and Lemieux,
2001; Williams, 2004; Anderson et al., 2012; Williams and Bretteville-Jensen, 2014),
whilst some others did find that youth demand for cannabis is significantly related to
its legal status (Pacula et al. 2003), and that depenalisation significantly increases
it (Model, 1993; Saffer and Chaloupka, 1999; Damrongplasit et al., 2010). However,
the possible effects seem more evident on the extensive margins (decision whether or
not to use cannabis), rather than on the intensive margins (how frequently cannabis
is used).
Some studies went further, analysing the differential impact that cannabis
policies might have on different consumption behaviours. Overall, the evidence
found suggest that where an effect has been found it has been more likely observed
on extensive margins (decision whether or not to use cannabis), rather than on the
intensive margins (how frequently cannabis is consumed by those who are already
users) (Thies and Register, 1993; Pacula, 1998; Chaloupka, Grossman and Tauras,
1999; Farrelly et al., 2001; Hall and Pacula, 2003; Williams, 2004).
All the aforementioned studies are based on data sources from the United States
and Australia, whilst to the best of our knowledge due to the lack of comparable
data very little work has been performed in Europe, and mainly focused on a single
country perspective (Reinarman et al., 2004; Reinarman, 2009; Simon-Morton, 2010;
Shi et al., 2015; Ceverny et al., 2017).
Despite the scarcity of previous studies, Europe constitutes an interesting case
for conducting this type of research, particularly because the cannabis law reforms
passed over the last 20 years in many countries generated significant variations
in the intensity and trajectory of policy changes (towards a decrease or decrease
of penalties), which offer and optimal ground for research (EMCDDA, 2011 and
2017a).
In this light, the first aim of this study aims is to contribute to address the lack
of an European perspective on the links between drug law reforms and the perceived
easy access to cannabis, used as a proxy of availability, and patterns of use of this
substance among adolescent students in Europe.
we have the unique opportunity to base our analysis on comparable data from
the European school Survey Project on Alcohol and other Drugs (ESPAD), collected
with a standardised methodology from nationally representative samples of 16
years-old students in 20 European countries, covering a period of more than 15
years (1999-2015).
The second aim is to be able to distinguish in this analysis different types of users.
In fact, as in the case of adults, also when focusing on teenagers, it is important to
acknowledge the fact that cannabis market is segmented into a number of different
types of consumers and that the same policy might have differential or null effect
on them (Pacula, 2010). In order to do this, we first explore the link between the
various policy changes and the prevalence of use (measured as any use in the last
year) and then we deepen the analysis by focusing on three types of adolescents
consumers based on different thresholds of frequency of use: experimental use (only
once or twice in a year), non-frequent use (use in the year but less than 20 times per
month) and frequent use (daily or almost daily cannabis use, i.e. 20 or more times
per month).
Our identification strategy is based on a Differences-in-Differences model, which
application is allowed by the fact that only 13 out of the 20 countries analysed
implemented relevant cannabis policy changes in our observation period, leaving us
with a group of seven countries that did not undergo any reforms.
Our findings indicate that selected categories of changes in the regulation of
cannabis possession for personal use seem to affect the perceived availability and
prevalence of use among adolescent students. In particular, consistently with the
hypothesis based on the theory of crime, some forms of restrictive interventions are
linked to a reduction in the overall proportion of cannabis users. Consistently, more
liberal reforms are associated with an increase in the share of students approaching
cannabis. However, when restricting our analysis to frequent users we do not find
evidence of a significant association between any type of policy reforms and changes
in the share of of this type of consumers.
The rest of paper is is structured as follows: Section 1.2 reviews existing
theoretical and empirical literature on the topic, Section 1.2 provides a description of
the policy classification adopted and an analysis of each country’s reform, Section 1.4
presents the data used, Section 1.5 describers the empirical model, Section 1.6 shows
our results, Section 1.7 provides some robustness checks and Section 1.8 discusses
the results and concludes. Other robustness checks and other insights are provided
in the Appendix in Section 1.9.
1.2
Literature review
Generally, cannabis legislation reforms are based on different theories concerning
the sensitivity of the demand to changes in sanctions and penalties (Pacula et al.,
2005; Shi et al., 2015). In particular, much debate has focused on the effectiveness
of the use of governments’ coercive power in influencing drug consumption (Dave
and Kaestner, 2002; Glied, 2002; Zhao and Harris, 2004; Cunningham and Finlay,
2015).
Penalty approaches are inspired by the notion from the theory of crime (Becker,
1968) that use should decline as the cost of the drug and the size of the punishment
increase. Consequently, policies driven by this approach are designed to deter use
both constraining supply in order to make the drug difficult to obtain and expensive,
and providing disincentives to demand by setting strict and certain consequences
of detention (DeSimone and Farrelly, 2003; Room et al., 2010). It follows that
laxer policies would cause an increase in availability and social acceptability of use,
as well as a reduction of the fear of punishments and perceived risk. This would
altogether lead to an increase in the prevalence, frequency, quantity of cannabis used
and related problems (Reinarman et al., 2004; Reinarman, 2009). Furthermore, it
is believed that a more liberal stance on cannabis, by sending a wrong message
of social acceptability about drug use in general, would increase the access to
more dangerous forms of illegal substances (Pudney, 2010). On the opposite side,
depenalisation policies question the effectiveness of legal sanctioning in reducing the
use and the associated harm of drugs (Damrongplasit et al. 2010), and favour the
implementation of some mix of legislative and regulatory structures other than the
criminal law. At individual user-level, a criminal charge is seen as a too severe
penalty relative to the crime itself, implying high costs, e.g. in terms of reduced
educational attainment and future employment opportunities (Becker et al., 2006;
Room et al., 2010; Damrongplasit et al. 2010; Williams and Bretteville-Jensen, 2014;
Kopp and Ogrodnik, 2017; Wang and Xie, 2017). From a societal point of view,
criminalization is deemed to be too expensive in terms of enforcement, adjudication
and incarceration costs, relative to the results achieved (Simons-Morton et al., 2010).
In this view, maintaining a strong prohibition line in the face of high and persistent
demand implies that cannabis consumers have to turn to the unregulated black
market, where they are more likely to enter into direct contact with sellers of other
illicit and to move on to use them (Damrongplasit et al. 2010; Simons-Morton
et al., 2010). Depenalisation would therefore reduce drug trafficking and facilitate
the separation of a regulated market for cannabis from the market of other harder
drugs (Grube and Nygaard, 2001; Stockwell, 2001). An important point is that at
a societal level, a more liberal approach would have small or no positive effect both
on the prevalence and on the frequency of cannabis use. The example typically
brought is the Netherlands where the prevalence of cannabis use, both among
adults and youth, is not higher than in other European countries or the United
States (Reinarman, 2004; Hughes and Stevens, 2010). Public resources diverted
from deterrence, would then be more efficiently employed in public education and
prevention, as well as greater availability of treatment services for addiction (Pacula,
2010).
As highlighted in Section 1.1, despite the strong views around cannabis legal
status, econometric studies examining the effect of policy reforms on youth have
produced mixed evidence. Thies and Register (1993), Pacula (1998), DiNardo
and Lemieux (2001), Williams (2004) and Anderson et al.
(2012) reported
insignificant effects of cannabis decriminalisation on youth individual smoking
decisions. In contrast, Model(1993), Saffer and Chaloupka (1999), Pacula et al.
(2003), Damrongplasit et al. (2010) did find that the demand for marijuana is
significantly related to its legal status, and that depenalisation significantly increases
participation in cannabis use by youth. Among the most recent studies, Williams
and Bretteville-Jensen (2014) found no evidence of significant long run effect of
decriminalisation on initiation into cannabis use in either the adult population or
youth, but only a decrease in the age of onset during the first years after adoption
of the policy.
Some studies also analysed the policy impact on different consumption
behaviours. Chaloupka et al. (1999) estimated that cannabis decriminalisation
was associated with higher reported use in the past year, but did not increase the
probability of more recent use or the number of occasions in which users consumed
cannabis. Similarly, Farrelly et al. (2001) and Hall and Pacula (2003) provided
evidence that the decision to start using cannabis is affected by changes in the legal
penalties and related enforcement for its possession, but the frequency of use among
those who are already cannabis users is not. Differently, the studies conducted by
Thies and Register (1993), Pacula (1998) and Williams (2004) found no evidence
that decriminalisation significantly increases either participation in cannabis use
by youth, or frequency of use among current cannabis users. In other words,
these findings suggest that if there is any effect of changes in legal penalties on
consumption behaviours, these are more likely to be displayed on the probability
that an adolescent will ever use cannabis, but there is no evidence of impact on the
share of adolescent frequent users.
All the aforementioned studies are based on data sources from the United
States and Australia. In Europe, far less literature is available. The first study
exploring possible links between different drug policies and user practices restricted
the analysis to the Netherlands, the only European example of a system of licensed
cannabis shops, comparing representative samples of young experienced cannabis
users in Amsterdam and in San Francisco, a city with similar characteristics but
subject to a criminalization policy regime (Reinarman et al., 2004). Interestingly the
study found that perceived availability was not different nor there were significant
differences concerning the age of uptake of cannabis use and the frequency of use.
The only major difference was that American respondents were three times more
likely to report being able to purchase other illicit drugs from their cannabis sources
(Reinarman et al., 2009). Simon-Morton (2010), by comparing the liberal policy
of the Netherlands with the United States and Canada, also found results that are
inconsistent with the hypothesis based on the theory of crime (Becker, 1968) that
strict laws and enforcement would prevent adolescent cannabis use. Ceverny et al.
(2017), exploiting restrospective information on the age of first cannabis use, did not
find any evidence that the decriminalisation implemented in the Czech Republic in
2010 induced an earlier uptake of cannabis use among youngsters. Based on official
statistics regarding the yearly amount of cannabis seizures reported by the police,
the author suggested that this was possibly due the lack of changes in the illegal
supply of the drug as a result of the policy, hypothesis supported by the absence of
significant changes in the share of consumers reporting easy access cannabis.
1.3
Institutional setting: European policy
classification
A cross-country analysis for the European case is challenged by the difficulty of
trying to capture the complexity of policy changes across heterogeneous legal systems
within broad definitions like depenalisation, decriminalisation, or prohibition.
Furthermore, it is well known that drug laws tend to be complicated, subject to
interpretation, and enforced variably (Simons-Morton, 2010), particularly in relation
to trafficking offences where the penalty range allowed in countries’ laws may depend
on a variety of defined aggravating circumstances (EMCDDA; 2017a). We therefore
focus on a particular aspect of the reforms that allows to make a more sensible
direct comparison between countries, which is the treatment of cannabis possession
for personal use.
To do so, we adopt a refined categorisation of the types of change in law for
cannabis possession proposed by the European Monitoring Centre for Drugs and
Drug Addiction (EMCDDA, 2017a). Based on this categorisation, the five main
types of policy changes addressing cannabis personal possession are classified as
follows: reforms removing the prison sentences for minor offences (RP SMO);
reforms reducing the maximum prison sentence (RMP S); reforms facilitating
the closure of minor cases (F CMC); reforms increasing the non-prison penalty
(IN P P )
; and reforms increasing the prison penalty (IP P ). Then, we analysed the
national legislation of those countries that were not comprised in the EMCDDA
categorisation and added them to the analysis. We also performed a review of
policy changes implemented, and provided a description of the situation pre- and
post-reform in each country in order to allow for a more meaningful interpretation
of results. The outcome of this analysis is reported in Table 1.1. An additional,
more detailed, description of the policy changes implemented in each country is
provided in Section 1.9.1
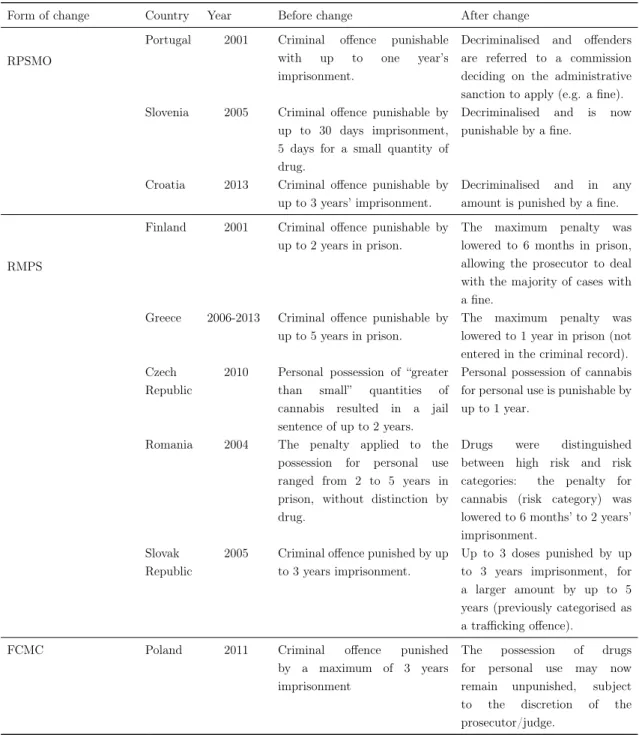
Table 1.1: Classification of changes in cannabis law regarding possession for personal use
occurred in Europe from 2001 to 2014
Form of change Country Year Before change After change
RPSMO
Portugal 2001 Criminal offence punishable
with up to one year’s
imprisonment.
Decriminalised and offenders are referred to a commission deciding on the administrative sanction to apply (e.g. a fine).
Slovenia 2005 Criminal offence punishable by
up to 30 days imprisonment, 5 days for a small quantity of drug.
Decriminalised and is now punishable by a fine.
Croatia 2013 Criminal offence punishable by
up to 3 years’ imprisonment.
Decriminalised and in any amount is punished by a fine.
RMPS
Finland 2001 Criminal offence punishable by
up to 2 years in prison.
The maximum penalty was lowered to 6 months in prison, allowing the prosecutor to deal with the majority of cases with a fine.
Greece 2006-2013 Criminal offence punishable by up to 5 years in prison.
The maximum penalty was lowered to 1 year in prison (not entered in the criminal record). Czech
Republic
2010 Personal possession of “greater
than small” quantities of
cannabis resulted in a jail sentence of up to 2 years.
Personal possession of cannabis for personal use is punishable by up to 1 year.
Romania 2004 The penalty applied to the
possession for personal use ranged from 2 to 5 years in prison, without distinction by drug.
Drugs were distinguished
between high risk and risk categories: the penalty for cannabis (risk category) was lowered to 6 months’ to 2 years’ imprisonment.
Slovak Republic
2005 Criminal offence punished by up to 3 years imprisonment.
Up to 3 doses punished by up to 3 years imprisonment, for a larger amount by up to 5 years (previously categorised as a trafficking offence).
FCMC Poland 2011 Criminal offence punished
by a maximum of 3 years imprisonment
The possession of drugs
for personal use may now remain unpunished, subject to the discretion of the prosecutor/judge.
Source: Authors’ elaboration on EMCDDA (2017a); RPSMO = Removal of the prison sentences for minor offences; RMPS = Reduction of the maximum prison sentence; FCMC = Facilitation of closure of minor cases; INPP = Increase of the non-prison penalty; IPP = Increase of the prison penalty
Table 1.1: (Continued)
Form of change Country Year Before change After change
INPP
Denmark 2004 Criminal offence but did not
result in prosecution, and was instead punished by a warning.
It remains a criminal offence: normal response for minor quantities is a fine, the size of which depends on type/quantity of the drug involved.
Italy 2006-2014 Decriminalised and cannabis
classified as a soft drug punishable with administrative
sanctions. In 2006 the
distinction between soft and hard drugs was eliminated. The administrative sanctions for soft drugs increased with hard drugs to a max. of 1 year.
In 2014, the Constitutional Court repealed the 2006 law and penalties for minor personal use offences were reinstalled to 1-3 months for cannabis and other less dangerous drugs.
Ukraine 2010 Administrative offence if in the
amount of a small size.
If the amount of drugs
possessed does not exceed the ‘small’ amount, it remains an administrative offence, but the legal threshold of “small”, “large” quantities have been significantly reduced. Over the "small" threshold, a criminal case is opened.
IPP Hungary 2013 Criminal offence, punished by
up to two years imprisonment.
Punishment remains up to two years in prison if it involves small quantities, but other penalties are now one to five years for a basic offence, increasing significantly in certain circumstances.
Source: Authors’ elaboration on EMCDDA (2017a); RPSMO = Removal of the prison sentences for minor offences; RMPS = Reduction of the maximum prison sentence; FCMC = Facilitation of closure of minor cases; INPP = Increase of the non-prison penalty; IPP = Increase of the prison penalty
Note that three countries that implemented policy reforms were excluded from
the analysis because the related ESPAD data are not available for all the considered
years: the United Kingdom, which in the time window from 2004 to 2009 lowered
the maximum penalties for personal possession from five to two years’ imprisonment;
Estonia and Luxembourg which in 2002 and 2001 respectively decriminalised
cannabis use and possession for personal use; and Belgium that in 2003 differentiated
the personal possession of cannabis from that other controlled substances, setting
the penalty to a fine based on an anonymous police report.
1.4
Data
Our empirical analysis is based on data from the European school Survey Project
on Alcohol and other Drugs (ESPAD). ESPAD is a repeated cross-sectional
multinational survey conducted every four years since 1995, designed to provide
nationally representative and comparable data on substance use and other risk
behaviours among 16 years-old students in Europe (Kraus et al., 2016).
In this survey a cluster sampling design is used to sample the students who turn
16 years of age in the given survey year. In the majority of countries, class is the last
unit in a multistage stratified sampling procedure. Participating countries adhere to
common research guidelines to guarantee consistency in sampling, questionnaires,
and survey implementation, and conform to the respective national ethics and
data protection regulation. A standardized anonymous questionnaire is voluntarily
completed in the classroom setting with paper-and-pencil (the only exceptions
are the Netherlands and Latvia which in 2015 used the computer-assisted mode).
Detailed information about survey representativeness, data collection methodology,
and country participation rates in each survey year are reported in the dedicated
reports (Hibell et al., 2000, 2004, 2009, 2012; Guttormsson et al., 2015). Sampling
frame coverage, school, class and student participation rates were generally high in
the considered period.
For the present analysis, starting from the individual level data about 306,693
students collected in five ESPAD data collection waves (1999, 2003, 2007, 2011 and
2015) we calculated annual prevalences for each country of a subset of variables
referring to cannabis use and perceived availability, obtaining a balanced panel
covering 20 countries in the interval 1999-2015 (a total of five observations per
country). Table 1.2 provides an overview of the initial sample by country and year.
Table 1.2: Sample size by country and year
1999
2003
2007
2011
2015
Total
Croatia
3454
2823
2947
2953
2490
14667
Czech Rep.
3478
3078
3805
3826
2689
16876
Denmark
1497
2442
844
2105
1624
8512
Finland
2945
3182
4902
3692
3960
18681
France
2177
2090
2843
2463
2641
12214
Greece
2160
1871
2990
5654
3168
15843
Hungary
2669
3037
2758
2995
2692
14151
Iceland
3342
1503
3421
3242
2604
14112
Italy
4041
4693
9396
4657
3878
26665
Latvia
2238
2782
2231
2542
1059
10852
Malta
3593
3363
3601
3307
3171
17035
Netherlands
2613
2019
2055
2030
1680
10397
Norway
3582
3631
3077
2684
2320
15294
Poland
3208
5770
2080
5818 11645 28521
Portugal
3496
2827
3049
1889
3355
14616
Romania
2304
4214
2224
2678
3327
14747
Slovak Rep.
2402
2098
2390
1902
2179
10971
Slovenia
2304
2706
3037
3113
3390
14550
Sweden
3243
3142
3078
2451
2485
14399
Ukraine
2833
3998
2336
2132
2291
13590
Total
57579 61269 63064 62133 62648 306693
The 20 countries considered are divided into those that underwent cannabis
policy changes: Croatia, Czech Republic, Denmark, Finland, Greece, Hungary, Italy,
Poland, Portugal, Romania, Slovak Republic, Slovenia and Ukraine; and those that
did not: France, Iceland, Latvia, Malta, the Netherlands, Norway, Sweden.
Information on the perceived ease of access to cannabis is provided by responses
to the question: “How difficult do you think it would be for you to get marijuana
or hashish (cannabis) if you wanted?”. This question was asked to every student
answering the questionnaire, both those who reported having ever used cannabis and
those that did not. The answer options are: “Impossible”; “Very difficult”; “Fairly
difficult”; “Fairly easy”; “Very easy”; “Don’t know”. To our purpose, the proportions
of students in each country answering ‘fairly easy’ or ‘very easy’ were merged to
indicate perceived easy availability.
Information on the use of cannabis is provided by responses to the question: “On
how many occasions (if any) have you used marijuana or hashish (cannabis)?”. This
question was asked with reference to three different timeframes: in the lifetime, in
the last 12 months and in the last 30 days. The answer options for all timeframes
are: “0”; “1-2”; “3-5”; “6-9”; “10-19”; “20-39” and “40 or more”. Using the information
regarding cannabis use in the last 12 months and in the last 30 days, individuals
were classified into different types of users: all users (at least once in the last 12
months); experimenters (only 1-2 times in the last 12 months); non-frequent users
(all users in the last 12 months, excluding those having reported use in the last 30
days with a frequency equal to or higher than 20-29 times); frequent users (having
reported use in the last 30 days with a frequency equal to or higher than 20-29
times). Using the same categorisation, we replace the reported use in lifetime to the
reported use in the last 12 months to conduct a sensitivity analysis in Section 1.7.
In this additional analysis individuals are therefore classified as follows: all users (at
least once in the lifetime); experimenters (only 1-2 times in the lifetime).
In Table 1.3 we report the descriptive statistics for our outcome variables.
Overall, our proxy of cannabis availability shows an average constant path across
the years, while the use of cannabis has a slight increase in the 1999-2015 interval.
In particular, the frequent use of cannabis involved on average the .41 percent of
students in 1999 and the .68 percent in 2015.
Table 1.3: Descriptive statistics of outcome variables
Prevalence (%) N. Countries
1999 2003 2007 2011 2015
Mean Mean Mean Mean Mean St. D. St. D. St. D. St. D. St. D.
Perceived cannabis availability 20 13.9230.42 15.1532.15 16.0333.07 12.4931.34 11.5230.38
Use of cannabis in the last year (any) 20 11.42 12.54 12.01 12.95 12.11
6.40 8.44 8.54 6.77 7.05
Experimental use of cannabis in the last year (only one or two times) 20 5.00 5.63 5.50 6.26 5.68
2.26 2.89 3.13 3.06 3.03
Frequent use of cannabis (20 or more per month) 20 0.410.41 0.620.60 0.680.63 0.600.67 0.640.68
Use of cannabis in the lifetime (any) 20 15.07 17.08 15.99 16.82 15.65
8.08 10.25 10.70 9.31 9.04 Experimental use of cannabis in the lifetime (only one or two times) 20 6.36 7.10 6.84 7.48 6.58
2.77 3.07 3.52 3.79 3.40
Notes: Author’s elaboration on ESPAD data. Cannabis availability= percentage of students rating cannabis as either ‘fairly easy’ or ‘very easy’ to obtain. Use of cannabis in the last year: use of cannabis >=1-2 times in the last 12 months. Experimental use of cannabis (in the last year): use of cannabis =1-2 times in the last 12 months. Frequent use of cannabis: use of cannabis >= 20-29 times in the last 30 days. Lifetime use of cannabis (any): use of cannabis >=1-2 times in the lifetime. Experimental use of cannabis (in the lifetime): use of cannabis =1-2 times in the lifetime. Sample size: Average (country/year)= 3066.93 students, Min= 844 (Denmark 2007), Max= 11645 (Poland 2015).
1.5
Empirical model
In order to investigate the relationship linking the policy changes (treatments)
and the perceived availability and consumption of cannabis among adolescents, we
use a Differences-in-Differences (DiD) approach. The basic strategy of DiD is to
compare the difference in outcomes after and before the intervention between the
treated and the untreated groups. The use of DiD allows to avoid the endogeneity
problems typical of comparisons between heterogeneous groups (for an overview
see Meyer, 1995). In this framework, the identification of the effect of a policy on
the outcome of interest is based on the assumption that the policy is exogenous
with respect to the outcome (Besley and Case, 2000; Heckman, 2000). In our
case, there might be the concern that this condition is not fully met, as reforms
concerning cannabis use might be influenced by changes in individual preferences
and behaviours, including cannabis use. This issue is less of a concern once country
and year fixed effects are controlled for, as in our case (Cohen and Einav, 2003;
Williams and Bretteville-Jensen, 2014). Moreover, policy reforms are the outcome
of a political process, which is complex, lengthy and uncertain. Whether and when
legislation is passed seem therefore to depend on a mix of political, administrative
and ideological factors unlikely related to changes in cannabis use (Levitt, 1996;
Cohen and Einav, 2003; Palali and van Ours, 2014) and can therefore be considered
plausibly exogenous to an individual’s decision to use the substance (Williams and
Bretteville-Jensen, 2014). In line with Braakmann et al. (2014), the idea underlying
our approach is that individuals will react to policy reforms when the new law comes
into effect, and not to the possible earlier political debate or announcement, as what
is expected to matter for individual changes in behaviour is the actual punishment
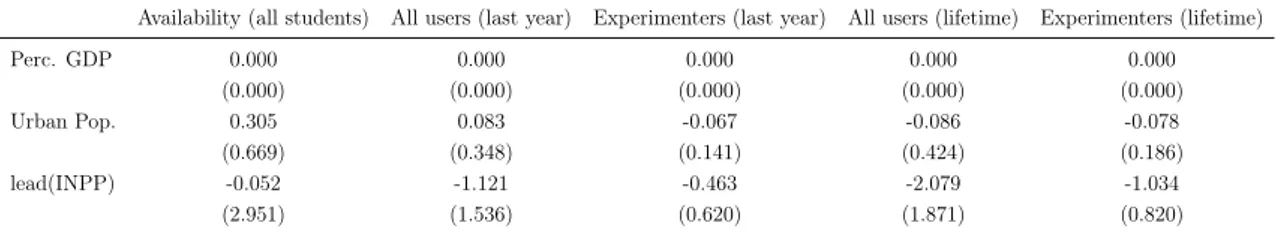
in place. To rule out the opposite hypothesis we test the existence of anticipated
changes in behaviour by performing a parallel trend test in Section 1.7.2 where we
lead of one survey period (corresponding to four years) those policy reforms that in
our analysis show a significant effect. In this paper we are interested in the effect of
different categories of policy changes. More in details, as reported in Table 1.1, we
have five different treatments: Removal of the prison sentences for minor offences
(RP SM O)
; Reduction of the maximum prison sentence (RMP S); Facilitation of
the closure of a minor case (F CMC); Increase of the non-prison penalty (INP P );
Increase of the prison penalty (IP P ).
On the basis of the generalized DiD, we estimate the effect of all the considered
policies in the same regression, which is given by the following equation:
Yst= θs+ λt+ β1RP SM Ost+ β2RM P Sst+ β3F M CMst+ β4IN P Pst+ β5IP Pst+ β6Xst+ εst
(1.1)
Where:
• θ
sare country-level fixed effects;
• RP SMO
st= 1
in countries and years Removing the prison sentences for minor
offences;
• RMP S
st= 1
in countries and years Reducing the maximum prison sentence;
• F CMC
st= 1
in countries and years Facilitating closure of minor cases;
• INP P
st= 1
in countries and years Increasing the non-prison penalty;
• IP P
st= 1
in countries and years Increasing the prison penalty;
• X
stis a vector control variables containing country level per-capita GDP and
share of urban population (World Bank, 2018). Per-capita GDP is used to
proxy for the country socio-economic conditions, which have been associated
with youth consumption of psychoactive substances (see Svensson and Hagqui,
2010 and Shi et al., 2015). The share of urban population, calculated using the
World Bank population estimates and urban ratios from the United Nations
World Urbanization Prospects, serves as a proxy for the level of urbanisation
of a country, which has been identified as a risk factor for substance misuse
(see Schifano (2008) for a review).
Estimated β
i, for each one of the five policy categories (i = 1, . . . 5), is the
difference between the average outcome observed in the treated countries after the
implementation of the reforms, and the average outcome that would be expected for
the same countries, in the same time periods, given their level of GDP per capita and
level of urbanisation. Italy and Greece, in which the analysed reforms remained in
force for a limited period, the dummy variable corresponding to the reform assumes
value equal to one only in those years.
These parameters can be interpreted as the possible effect of the reforms on the
outcome under the assumption of equal trends in the absence of treatment. That
is, we are assuming that changes in the country prevalence of cannabis use and
availability would have moved in tandem in absence of treatment. The validity
of this assumption cannot be proved but can be assessed testing the existence of
common trends in periods before the reforms were implemented. In the case of
cannabis legislation reforms in Europe we do not find evidence to reject the null
hypothesis of equal trends, see Section 1.7.2 for details. In the next section we report
the results of our regression using the different proxies of cannabis availability and
use described in Section 1.4 as outcome Y
st. The robustness of our results is checked
in Section 1.7 through a sensitivity analysis and the mentioned parallel trend test.
The following robustness checks are provided in the Appendix in Section 1.9: 1)
single-group estimates with related parallel trend test in case of significative results
and sensitivity analysis on the lifetime use dependent variables; 2) specifications of
the models presented in Section 1.6 and sensitivity analysis without control variables,
as X
stcould be endogenous when measured at the same time of the policy reforms;
3) specifications of the models presented in Section 1.6 and sensitivity analysis
excluding Italy from the INP P group, since it is among the countries where the
policy effect is significative. Finally, in the Appendix in Section 1.9 figures showing
cannabis perceived availability and use trends are also provided.
1.6
Results
On the basis of our research questions, this section presents the estimates of our
model on two main outcomes: perceived availability and patterns of use of cannabis.
1.6.1
Policy changes and perceived availability
The examine the relationship between the different policy changes and the perceived
availability of cannabis we first look at the whole population in our dataset, including
also non-users. Table 1.4 shows that the only policy changes showing a significant
effect on the share of adolescent students reporting easy availability of cannabis are
those increasing the non-prison penalties (INP P ). Indeed, with the significance of
.049, INP P is linked to a reduction in the perceived availability of 5.8 percentage
point. All the other policy categories seem to have no significant effect.
Table 1.4: Policies and share of of students considering easy to find cannabis
All students Non-frequent users Frequent users
Perc. GDP
0.000
0.000
0.000
(0.000)
(0.000)
(0.000)
Urban Pop.
0.311
0.360
-0.050*
(0.412)
(0.402)
(0.021)
RMPS
-2.158
-2.093
-0.065
(2.508)
(2.448)
(0.130)
RPSMO
-2.034
-2.134
0.100
(3.199)
(3.122)
(0.166)
FCMC
6.568
6.604
-0.036
(4.954)
(4.835)
(0.257)
INPP
-5.783*
-5.675*
-0.108
(2.891)
(2.821)
(0.150)
IPP
-1.855
-1.640
-0.036
(5.826)
(5.685)
(0.257)
Sample size: Average (20 countries/5 years) = 3092.35 students, Min = 844 (Denmark 2007), Max = 11645 (Poland 2015); =". p<0.1 * p<0.05 ** p<0.01 *** p<0.001"
Since we are interested in investigating how perceived availability changes
when distinguishing between different types of subjects, we specify our model
distinguishing non-frequent users and frequent users. In fact, one of the main issues
of considering the availability perceived by all students (comprising both users and
non-users) is that results could be biased by the fact that the frequent use of cannabis
can affect its perceived availability. In fact, frequent consumers might have stable
access to supply networks which is not affected by the imposition of exogenous
policy restrictions (Coomber and Turnbull, 2007). Therefore, also in cases where
cannabis availability is generally perceived as lowered (for example because it is
more difficult to see small street cannabis dealing), we could find that there is no
effect for frequent purchasers of larger quantities. In order to verify this, in the
second column of Table 1.4 we present the outcome estimated excluding frequent
users. The results are substantially unchanged: only INP P with a significance of
.048 is linked to a decrease of 5.7 percentage points on this outcome. In the third
column, we present the estimates on the share of adolescents reporting a frequent
use. Confirming our hypothesis, no policy reform seem to significantly affect the
availability perceived by this sub-population.
1.6.2
Policy changes and cannabis use
Based on our hypothesis that different policy reforms might have different effects
on different types of users, Table 1.5 reports the estimates of our DiD on different
outcomes as follows: in the first column on the share of all those students reporting
any use in the past year; in the second column, only those students who tried the
drug and did not repeat the experience (only once or twice in the past year), in
the third column all those who reported use in the past year excluding the frequent
users, and in the fourth column the focus is restricted to the share of frequent users.
Table 1.5: Policies and students using cannabis (in the last year)
All users Experimenters Non-frequent users Frequent users
Perc. GDP
0.000
0.000
0.000
0.000
(0.000)
(0.000)
(0.000)
(0.000)
Urban Pop.
0.060
-0.011
0.079
-0.049*
(0.208)
(0.077)
(0.211)
(0.022)
RMPS
0.497
0.994*
0.554
-0.087
(1.265)
(0.469)
(1.184)
(0.136)
RPSMO
1.033
0.985
0.886
0.067
(1.614)
(0.599)
(1.503)
(0.173)
FCMC
6.607*
2.849**
6.588**
-0.011
(2.499)
(0.927)
(2.341)
(0.268)
INPP
-3.333*
-1.792**
-3.239*
-0.109
(1.458)
(0.541)
(1.374)
(0.156)
IPP
-0.959
-0.032
-0.588
-0.225
(2.939)
(1.090)
(2.715)
(0.315)
Sample size: Average (20 countries/5 years) = 3092.35 students, Min = 844 (Denmark 2007), Max = 11645 (Poland 2015); =". p<0.1 * p<0.05 ** p<0.01 *** p<0.001"
Results in the first column show that only two types of policy induce a change
in the size of the population of cannabis users: the Facilitation of closure of minor
cases (FCMC), with a significance of .010, is linked to an increase in the share of
users by 6.6 percentage points, whilst the Increase of the non-prison penalty (INPP)
with a significance of .025, is linked to a decrease of 3.3 percentage points. Results
in the second and third column show that the same effects are observed with a
higher significance both if we just focus on experimenters and if we widen the scope
to the share of all non-frequent users. Moreover, when looking at the experimental
users, with a significance of .038 the Reduction of the maximum prison sentence
is associated with an increase of 1 percentage point. Interestingly, results in the
fourth column show that when restricting the analysis on “frequent” users, all policy
coefficients lose statistical significance. These findings are consistent with what
suggested by Farrelly et al. (2001) and Hall and Pacula (2003), who also found
that changes in the general prevalence of cannabis users following policy reforms are
mainly driven by changes in the share of those not making a frequent use.
1.7
Robustness Checks
In this section, we examine the reliability of our results by means of two robustness
checks: a sensitivity analysis and a parallel trend test. Further checks are provided
in Section 1.9.
1.7.1
Sensitivity analysis
To perform this analysis we focus on the main finding of this paper, which is that
the influence of the different drug policy reforms investigated on adolescent cannabis
users is strongly related to their frequency of use. In order to check the robustness
of this finding we re-estimate the specifications of model presented in Section 1.5
concerning the share of users (any type) and only the share of experimental users,
choosing as outcome variable the reported use in the lifetime instead of the use
in the last year. As Table 1.6 shows, the effects on the share of students having
used cannabis at least once in their lifetime are in line with the effects on share
of students having used cannabis at least once in the last year presented in Table
1.4.1. In particular, the policies increasing the non-prison penalty (INPP) have
a significant negative effect, whilst the one facilitating the closure of minor cases
(FCMF) has a significant positive effect. Also the estimate concerning the share of
students reporting having tried cannabis only once or twice in their lifetime is in line
with our results: the policies that reduced the maximum prison sentence (RMPS)
and those that facilitated the closure of minor cases (FCMC) show a positive effect,
whilst the one that increased the non-prison (INPP) had a negative effect.
Table 1.6: Policies and students using cannabis (in lifetime)
All users Experimenters
Perc. GDP
0.000
0.000
(0.000)
(0.000)
Urban Pop.
-0.065
0.039
(0.245)
(0.098)
RMPS
1.921
2.016**
(1.494)
(0.597)
RPSMO
1.434
1.463.
(1.906)
(0.762)
FCMC
7.963**
3.646**
(2.951)
(1.179)
INPP
-5.443**
-2.458***
(1.722)
(0.688)
IPP
-0.075
0.522
(3.470)
(1.387)
Sample size: Average (20 countries/5 years) = 3092.35 students, Min = 844 (Denmark 2007), Max = 11645 (Poland 2015); =". p<0.1 * p<0.05 ** p<0.01 *** p<0.001"