UNIVERSITÀ DEGLI STUDI DELLA TUSCIA DI VITERBO
DIPARTIMENTO PER L’INNOVAZIONE NEI SISTEMI BIOLOGICI, AGROAMBIENTALI E FORESTALI
Corso di Dottorato di Ricerca in
ENVIRONMENTAL SCIENCE - XXVIII Ciclo.
Storage dynamics and energy potential of lingo-cellulosic biomass from energy crops
(s.s.d. BIO/19)
Tesi di dottorato di:
Dott. Antonio Scarfone
Coordinatore del corso Tutore
Prof. Maurizio Petruccioli Prof. Maurizio Petruccioli
Firma ……….. Firma ………
Co-tutore
Dott. Luigi Pari
Firma……… 22/06/2016
iii
Table of Contents
Abstract List of Figures List of Tablespag.
1. Introduction and objectives
1.1 Biomass as source of renewable energy: potential and policy in EU 1
1.2 The problem of storage 2
1.2.1 Risk of self ignition and thermogenesis 4
1.2.2 Energetic losses due to microbial degradation 4
1.2.3 Health risks related to storage of biofuel 5
1.3 The Characteristics of lingo-cellulosic biomass and their relation with the storage performance
5
1.3.1 Fungal activity 6
1.3.2 Particle size 7
1.3.3 Moisture content 10
1.3.4 Heating value 11
1.3.5 Ash content and ash melting point 12
1.4 Purpose of the research 14
2. Storage dynamics and fuel quality of poplar chips
2.1 Introduction 17
2.2 Materials and methods 19
2.3 Results 23
2.4 Discussion 29
2.5 Conclusions 30
3. Open-air drying of cut and windrowed short-rotation
poplar stems
3.1 Introduction 33 3.2 Materials and methods 35 3.3 Results 38 3.4 Discussion 3.5 Conclusions
42 44
iv
4. Alternative storage systems of Arundo donax L. and
characterization ofthe stored biomass
4.1 Introduction 46
4.2 Materials and methods 48
4.3 Results 52
4.4 Discussion 57
4.5 Conclusions 59
5. Airborne fungi in biofuel wood chip storage sites
5.1 Introduction 61
5.2 Materials and methods 62
5.3 Results 66
5.4 Discussion and Conclusione 71
6. Main findings of the research program
72References
75v
Abstract
Once harvested, the lingo-cellulosic biomass used for energy purposes is comminuted and stored in specific sites before conversion. Storage is a required process of the bioenergy chain since fresh biomass has characteristics such as moisture content that make inefficient the conversion.
However, the conservation of lingo-cellulosic biomass entails different problems such as the risk of self-ignition, the risks for human health during material handling, and the losses of dry matter due to microbial activity. The latter is due to the presence of fungi and bacteria that come in contact with the material during processing (i.e. immediately after chipping) as consequence of the presence of easily accessible carbohydrates. From an economic point of view, this phenomenon is considered a major problem since in a few months the amount of losses can be very significant, reducing dramatically the energy potential of the fuel delivered at the beginning to the storage station. The focus of the Ph.D. program has been the assessment of the phenomena related to the storage of lingo-cellulosic biomass and the evaluation of the respective fuel quality changes and energy losses occurred during the storage period. Indeed, the effects of storage on different types of lingo-cellulosic biomass and different storage forms (chips, chopped, logs) were investigated. In addition, the evaluation of the human exposure to biological risk of fungal spores was performed because such detailed experiences in a storage site were not identified.
The research has been designed in four activities, each one focused on different aspects of the storage process, which will be presented separately. The core of the results are summarized in the final chapter of the thesis; in general, they indicate that the factor affecting storage performance of the biomass can be partially controlled with minimal costs and that storage behavior differ according to storage form or plant part used. Key words: bioenergy, storage, biomass, chips, microorganisms.
vi
Abstract
Dopo la fase di raccolta, la biomassa ligno-cellulosica da desinare a scopo energetico viene generalmente cippata e stoccata in specifiche aree prima di essere convertita. Lo stoccaggio della biomassa è un processo necessario poiché il fuel allo stato fresco presenta caratteristiche, come l’alto livello di umidità, che rendono la conversione inefficiente. La conservazione delle biomasse lingo-cellulosiche presenta diversi problemi come ad esempio il rischio di autocombustione, il rischio biologico per gli operatori e le perdite di energia causate della degradazione della sostanza secca. Quest’ultima è provocata da funghi e batteri che, a seguito della cippatura, hanno facile accesso ai composti zuccherini più degradabili della biomassa.
Da un punto di vista economico, questo fenomeno è considerato il problema principale dato che in pochi mesi l’ammontare delle perdite può essere significativamente elevato, riducendo drammaticamente il potenziale energetico del fuel consegnato in centrale. L’obiettivo del programma Ph.D. è stato quello di valutare le dinamiche relazionate allo stoccaggio di biomasse ligno-cellulosiche e delle relative perdite e cambiamenti prodotti sulla qualità del fuel. Gli effetti dello stoccaggio sono stati analizzati prendendo in considerazione diverse specie di colture energetiche e utilizzando diverse forme di conservazione. Inoltre, l’attività di ricerca ha previsto la valutazione dei potenziali rischi per la salute umana, causati dall’esposizione degli operatori alle spore fungine durante la fase di movimentazione del cippato; tale analisi è stata eseguita su base sia qualitativa che quantitativa. La ricerca è stata divisa in quattro casi di studio, presentati come il risultato di pubblicazioni scientifiche su riviste indicizzate. Gli aspetti più interessanti della ricerca sono stati riassunti nell’ultimo capitolo della tesi; questi mostrano che le performance di stoccaggio del fuel possono variare considerevolmente a seconda della specie, della forma del prodotto e della porzione di pianta utilizzata, ma che questi, in alcuni casi, possono essere controllati, anche con costi contenuti.
vii
List of Figures
Figure 1 - Projections on the stipulated production of energy from renewable resources in the EU27 countries based on national renewable energy action plans.
Figure 2 - Monthly electricity supply in the principal European countries in 2015. Figure 3 - Visual differences between wood chip (left) and hog fuel (right). Figure 4 - Heating value as function of the moisture content.
Figure 5 - View at soil level of the wood chip piles. Figure 6 - Aerial view of the wood chip piles.
Figure 7 - Arrangement of measurement points in the three layers of the pile. Figure 8 - Installation of samples and thermocouple in a measurement point. Figure 9 - Climatic characterization of the storage site during the storage period. Figure 10 - Temperature changes during storage at the different points of crown wood
piles. Each line represents the temperature recorded over time in each measurement point. Each value is the average of the three semi-piles. Figure 11 - Temperature changes during storage in the different measurement points of
stem wood piles. Each line represents the temperature recorded over time in each measurement point of the pile layers.
Figure 12 - Particle size distribution of crown woodchips. Figure 13 - Particle size distribution of stem woodchips.
Figure 14 - Changes in energy content (%) in stem and crown wood chips of Poplar, Dry matter losses were calculated by weighing the whole semi-pile or by using the net bags weighing method.
Figure 15 - Meteorological data recorded during the entire duration of the experiment. Figure 16 - Mean precipitation between 2006 and 2012 and mean precipitation in 2013. Figure 17 - Moisture content trends according to the treatment.
Figure 18 - Scheme of the fan used in the ventilated treatment.
Figure 19 - Letter A indicates the storage treatment in ventilated bins, letter B indicates the storage treatment in perforated bins, letter C indicates the storage treatment in small pile on plastic platform.
viii Figure 21 - Time course of the temperature in: A) ventilated bins; B) unventilated bins; C)
open-air piles. The grey line correspond to the data recorded with the probes located at 15 cm from the bottom, while the black line represents those recorded at 30 cm.
Figure 22 - Time course of chopped Arundo moisture content (mean±SD) stored in ventilated bins, bins without ventilation or on open-air. Different letters indicate a significant difference between the treatments at each time-point at the level of p<0.01 after Tuckey’s test. Before the ANOVA analysis the data were transformed as square root of the arcsine
Figure 23 - Time course of dry matter losses (mean±SD) of chopped Arundo stored in ventilated bins, bins without ventilation or on open-air. Different letters indicate a significant difference between the treatments at each time-point at the level of p<0.01 after Tuckey’s test. Before the ANOVA analysis the data were transformed as square root of the arcsine.
Figure 24 - Lignin and cellulose contents detected before storage on fresh biomass (T0) and after storage on the three treatments (T30). Means ± SD (two replicates for three samples), same letters above bars indicate the lack of statistically
significant differences within each treatment. The apostrophe was used to avoid confusion between the statistical analysis made for lignin and cellulose. Figure 25 - Meteorological parameters measurements registered during the experiment. Figure 26 - Schematic disposition of environmental sampling stations: filled circle active
air sampling: squared circles passive air sampling.
Figure 27 - Taxonomic assignment of the fungal spores and mycelial fragments collected from bio-aerosol (environmental and personal sampling) and from workers’ skin in wood chip storage plan.
ix
List of Tables
Table 1 - Dimensional classes according the new classification.
Table 2 - Material classification according to moisture content and ash content.
Table 3 - Heating value, ash content and ash melting point of different biomass sources. Table 4 - Mean moisture content (±Standard.deviation) of the two wood chips assortments
at the beginning (T0) and after six months (T6) of storage in the three layers. Table 5 - Bulk density expressed in kg m^3-1 (± St. Dev.) at the beginning (T0) and after
six months (T6) of storage on both wood chips assortments.
Table 6 - Dry matter losses (%, dry weight basis) determined by net-bag sampling method and by the total weight of the semi-pile before and after storage.
Table 7 - Chemical analyses and heating values at the beginning (T0) and after six months (T6) of storage in the studied wood chip assortments.
Table 8 - Chemical analyses and heating values of stem and crown wood chips after six months of storage. The values are reported for each semi-pile layer.
Table 9 - Characteristics of the poplar stand. Table 10 - Sampling periods.
Table 11 - Regression equation for estimating moisture content (y) as a function of days in storage and felling date.
Table 12 - Cumulate precipitation, mean air temperature, and mean relative humidity over a period of three months from felling for the four treatments.
Table 13 - Regression equation for estimating moisture content (y) as a function of days in storage and cover treatments (x) for each felling date.
Table 14 - Dry matter losses at the beginning and end of the storage period, for the four felling dates.
Table 15 - Fuel quality parameters of fresh biomass (T0) or after storage (T30) under different conditions.
x Table 16 - Arundo biomass - ash fusion temperature.
Table 17 - Active and passive environmental air sampling at different distance from the wood chip piles. Results from passive sampling are obtained after 1 h of exposition.
Table 18 - Personnel exposure to particulate and airborne fungi as a function of task. Epidermal sampling is referred to 1 h of exposure.
Table 19 - Taxonomic assignment of the fungal spores and mycelial fragments collected from bio-aerosol (environmental and personal sampling) and from workers’ skin in wood chip storage plan.
1
1. Introduction and objectives
1.1 Biomass as source of renewable energy: potential and policy in EU
The increasing security in energy supply is set as one the main objectives of the EU energy policy. By the year 2020, all members’ states are called to produce at least the 20% of the total energy supply just from renewable energies. Today in Europe the average production from renewable is rather below this target, and only few countries have reached the objective. To achieve the European goal, research and development activities on renewable energies must be enforced in order to develop new supply systems as well as to maximize the efficiency of the existing ones (EU 2009).Among the main renewable source of energy, the biomass is probably the most promising one. According to the EU perspectives, it is expected to cover by 2020 more than half of the 20% EU renewable energy target (Bentsen and Felby 2012) (Figure 1).
Figure 1: Projections on the stipulated production of energy from renewable resources in the EU27 countries based on national renewable energy action plans.
According to Italian regulations, Biomass for energy is defined as any agricultural and forestry product, any residue deriving from the wood and paper industry, and any organic product deriving from the biological activity of animals and humans such as those coming from urban waste.
2 Biomass is therefore defined as any organic matter with animal or plant origin intended for energy purposes (DLgs 28/2011). It is possible to classify the biomass in three chains: the wood chain, the agricultural chian deriving from dedicated cultivation (rapeseed, soy, etc.), chain of residues and waste.
Focusing the attention on ligno-cellulosic (LC) biomass coming from arboreal and herbaceous crops, it must be pointed out that for practical reasons these types of feedstock cannot be used in their natural form, but they must be mechanically processed in order to get suitable energetic material.
The basic forms of LC biomass to be used in the large scale energy industry consist of wood chips, hog fuels and pellets. However, depending on geographic location and season, the availability of the feedstock do not always meet the demand for energy production, so there could be periods of the year in which the demand for energy cannot be satisfied (Jirjis 2004). In this regard, identifying efficient biomass conservation methods would guarantee a safe and continues supply, as required by the EU. However, during storage, the preservation of the energy characteristics of the ligno-cellulosic biomass is usually difficult for different reasons.
1.2 The problem of storage
Beyond particular locations and climatic conditions, the production of biomass takes place all over the year. This almost constant production does not always meet the demand for energy production, which varies country by country according the geographic location and season. For instance, the Northern European countries that suffer hard climatic conditions concentrate the energy demand in specific periods of the years, which generally correspond to the coldest months.
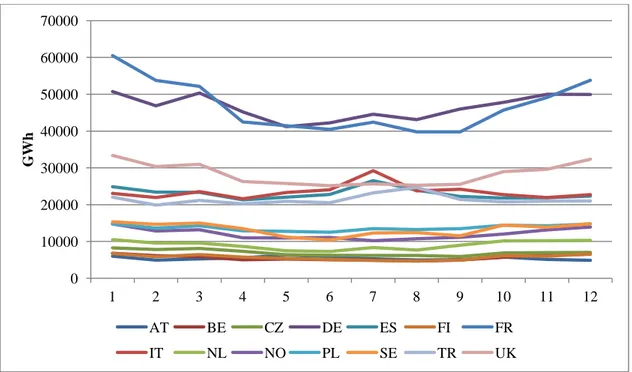
This unbalance implies the need of energy storage to guarantee constant production also during the period of highest demand. However, unlike other forms of energy, the electricity cannot be accumulated, so the energy stored in form of biomass represents a way to meet the demand of the peak periods. In figure 2 are shown the data concerning the electricity supply in 2015 the principal European countries.
3
Figure 2 - Monthly electricity supply in the principal European countries in 2015.
Another reason that implies the need of biomass storage is the initial moisture content of the fuel delivered to the power plant. Usually, the moisture content of fresh biomass is about 40-50%, but to obtain an efficient conversion the level of moisture content should be below 30% (Kofman, 2006). The storage process allows the material drying because wood chips exposed to wind and sun tends to dehydrate.
Finally, a short term period of storage at the storage site is physiologic because biomass power plant can process only certain amount of fuel per day and delivery just in time is almost impossible. Indeed, power plants have always a buffer zone for the storage of fuel in order to be less vulnerable for fluctuations and delays in the delivery chain. (Thörnqvist and Jirjis, 1990).
The fuel can be stored at the heating plant in many different ways depending on the type of fuel and the local conditions. They could be stored uncomminuted or comminuted. They can be stored outdoors or inside in barns, silos or container. Wood powder and pellets can be stored in silos. Large scale wood chip or hog fuel storage are in almost all cases stored outdoors in piles. There are other storages methods such as in piles under roofs, but these methods are for technical and economical reasons not used for large quantities.
0 10000 20000 30000 40000 50000 60000 70000 1 2 3 4 5 6 7 8 9 10 11 12 G Wh AT BE CZ DE ES FI FR IT NL NO PL SE TR UK
4 There are several problems related to the storage of wood chips and hog fuels in piles: among the most significant there are the risk of self-ignition, the losses of dry matter and the risks for human health during material handling.
1.2.1 Risk of self ignition and thermogenesis
The thermogenesis in stored biomass is linked to the development of heat started by the respiration of the cells of the wood structure still alive and continued by the biological activity of microorganisms, chemical oxidation and acid hydrolysis of the cellulosic components of the wood.
All these processes release heat, especially in the deeper parts of the pile, which are more isolated from ambient conditions and, for that reason, more convenient for the first development of microorganisms (Ericson 2011). The heat produced creates a difference in temperature between the inside and the outside and so a gradient of pressure, provoking the ascension of warm moist air current to the higher part of the pile and the entrance of external air to the lowest part of the pile (chimney effect).
The temperature acquired during thermogenesis and the time it is maintained during the storage period depends on the characteristics of the biomass itself (composition, moisture content and particle size distribution) and the ones belonging to the pile (shape, dimension) (Thörnqvist 1985). However, when the thermal balance between heat generated and heat being dissipated is not offset, problems of self-ignition may take place (Armstrong 1973).
1.2.2 Energetic losses due to microbial degradation
The presence of microorganisms (mainly aerobic) is developed in the first step of the material processing, i.e. immediately after chipping as consequence of the presence of easily accessible carbohydrates (Ericson 2011). Moisture content and nitrogen amount are both critical factors affecting the entity of colonization degree. Microorganisms are fed by vegetable material, need oxygen and as a consequence of respiration process generate heat, carbon dioxide and water vapor.
Apart from the release of heat by microorganism, thermogenesis also includes the development of chemical reactions (oxidation and acid hydrolysis). In general, most
5 chemical reactions increase in importance if a previous initial degradation by fungi has occurred (Armstrong 1973).
These modifications in the composition of the biofuel in most cases mean a degradation of their energetic and physical characteristics such as a decrease of the heating value and an increase of the ash content and fine particles.
1.2.3 Health risks related to storage of biofuel
Large-scale biomass storage sites may represent a “reservoir” of fungal spores, similarly to composting and recycling plants. Moving large quantities of wood materials leads to the release into the air of a high concentration of spores that may then be inhaled and ingested by workers and/or deposited onto their skin and eyes.
Since airborne mold spores have a diameter of only 2-10 µm and are ubiquitous, they can easily penetrate into the lower airways of the human respiratory tract, causing severe diseases like invasive pulmonary infection, or contributing to allergic sinusitis and allergic broncho-pulmonary diseases (O’Gorman 2011).
1.3 The Characteristics of lingo-cellulosic biomass and their relation with
the storage performance
All woody material consists of water, burnable substance and ash. Basically dry material has about 52 % carbon, about 42 % oxygen, 6 % hydrogen and a few percent of minerals. In general, the LC biomasses have similar major components but in different proportions. Some differences can be identified between fuels according to the age or part of the plant that is studied. The principal components in LC biomasses are carbohydrates (cellulose and hemicelluloses), lignin and extractives.
The cellulose is composed approximately by 10.000 glucose units, while hemicellulose includes in its composition also xylose, mannose, galactose, and arabinose. The lignin is formed by several units of phenolpropane, which furnish to the material its mechanical strength due to its gluing effect to the cellulose.
6 The extractives mainly include terpene, phenol and different types of fats. The amount of the singular component varies in the woody cells according to age, species and plant part, but in general the cellulose represents about 40% of the dry weight, hemicellulose about 30%, lignin about 20-30% and the extractives 2-4%.
The heating value of the biomass varies according to the amount of these components. For instance, cellulose has an energy content of 17-18 MJ/kg, hemicellulose around 16-17 MJ/kg, lignin around 25-26 MJ/kg DM, while the extractives around 33-38 MJ/kg DM (Strömberg, 2005).
1.3.1 Fungal activity
According to Noll and Jirjis 2012, the establishment of microbial communities in wood chip piles and wood logs are due to the following aspects:
- surface area of wood particles (e.g. microorganisms present on and in bark, needles or leaves);
- previous microbial colonization of inner parts of wood (e.g. tunneling bacteria and wood-rotting fungi transported by arthropods or other vertebrates);
- atmospheric deposition by rain;
- transportation into the wood chip piles and wood logs by wind;
- active microbial immigration from nearby environments such as the belowground.
The particle size of the stored biomass, as well as particle size distribution, plays a major role in the microbial establishment and growth. Chipping or crushing forest residues or other woody biomass, especially freshly harvested material, damage plant cells and release its soluble contents.
The enhanced accessibility of substrates in comminuted wood chips compared to wood logs may explain shifts in microbial community composition. Moreover, the comminution process greatly increases the surface area of the biomass which facilitates extensive colonization.
Storage of woody biomass is a multi factorial environment that determines the presence and activity of the microbial community. For this reason, a universal decomposition patterns in wood chips and logs are unlikely. However the decomposers of the main wood
7
compounds are white and brown-rot fungi (Rajala et al. 2010; Noll et al. 2010). White-rot fungi degrade mainly lignin, and at a lower rate also hemicellulose and cellulose, while brownand soft-rot fungi remove cellulose and leave lignin essentially unchanged (Schwarze 2007).
1.3.2 Particle size
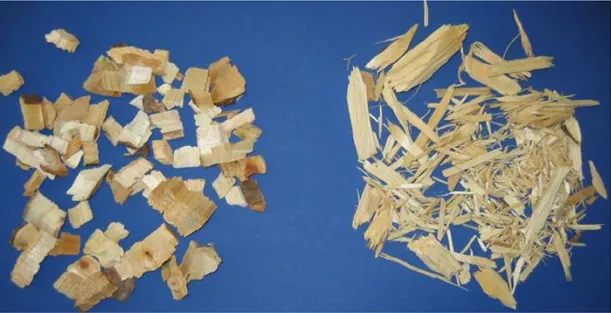
According to the machine used for harvesting, the comminuted LC biomass will take the form of wood chip or hog fuel. Basically, wood chips consist of chipped woody biomass in the form of pieces with a defined particle size produced by mechanical treatments with sharp tools such as knives. They have a sub-rectangular shape with typical length 5 to 50 mm and low thickness compared to other dimensions. Hog fuel is wood fuel in the form of pieces of varying size and shape, produced by crushing with blunt tools such as rollers, hammers, or fails (Alakangas, 2014) (Figure 3).
Figure 3 - Visual differences between wood chip (left) and hog fuel (right).
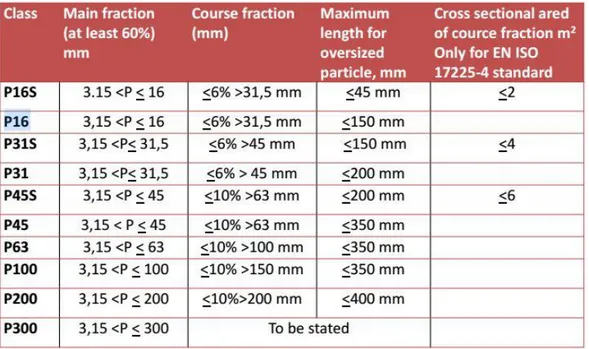
To determine the particle size distribution, the biomass is sieved through a range of sieve sizes. The amount retained on each screen is divided by the total weight of the sample to give a percentage. The new criteria of classification in based on EN ISO 17225 standard. Table 1 shows the dimensional classes that have been defined in the new standards.
8
Table 1 - Dimensional classes according the new classification (Alakangas, 2014).
As for the previous classification system, the letter P before the number indicates the Particle size. On the other hand, the introduction of the letter S after the number reflects a new criterion that has been introduced for small size plants. The variation has been applied because small size plants do not tolerate large size material, so the main requirement in P16S and in P31S is the absence of fractions larger than 45 and 150 mm respectively. On the contrary, in P16 and P31 toleration until 150 and 200 mm is included. In table 2 are shown the criteria of material classification also for moisture content (M) and ash (A).
9 Generally, each biomass power plant requires specific nominal size of the fuel. For instance, small boilers (<250 kW) requires a nominal size of 8-15 mm. The amount of oversize particles should be restricted, which means avoiding lumpy chips or overlong particles (longer than 10 cm). Oversize or overlong particles can clog the auger feeding the boiler.
For medium boilers (250 kW<X<1 MW) a nominal size of 8 to 25 mm can be used. The demands on the amount of oversize and overlong chips are not as stringent as for the small boilers. The augers feeding this type of boiler are much larger and more robust than for the small boilers. Too many overlong particles will, however, increase the tendency of the fuel to bridge over openings, which might cause the boiler to stop because of a lack of fuel.
For large boilers (>1 MW) a large nominal size of 25 to 35 mm is usually required. There are hardly any restrictions on oversize or overlong particles, because this type of boiler is usually fed by a crane into a hopper and from the hopper by hydraulic ram into the boiler. Even though the requirements are low, too many overlong particles might get the fuel to bridge over the infeed hopper and thus cause the boiler to stop because of a lack of fuel (Kofman, 2006).
The particle size is an important parameter that can significantly affect the storage performance of the biomass. Firstly, the chip size influences the exposed surface area of the material to air influencing the heat release occurring immediately after chipping through the respiration of the crop. Secondly it can influence the degree of microbial colonization and consequently further heat release.
In general, the production of small size chips creates many fine fractions, limiting the air penetration and the heat dissipation in the piles. The air penetration is responsible of the chip drying process which in turn determines the entity of the microbial attack.
Jirjis in 2005 tested the storage of comminuted Salix viminalis creating chips (particle size between 7 and 16 mm) and chunks (particle size between 22-45 mm). The study showed that microbial growth during the first two months of storage was clearly higher in the chips compared to the chunk wood.
10
1.3.3 Moisture content
LC biomass is not typically found in the oven-dry state, but it has a moisture which may vary from 60 to 15% depending on the duration of open-air seasoning. In arboreal plants, the wood is a behave an hygroscopic material and, due to its chemico-histological structure, it has two different types of porosity:
- the macroporosity created by the cavities of the conductive vessels and by parenchymal cells containing free (or imbibition) water.
- the microporosity of the actual wood substance (mainly cellulose, hemicellulose and lignin), which always contains a certain amount of bound (or saturation) water.
Wood begins to lose water from the moment the tree is cut down. First, imbibition water evaporates from the outermost (sapwood) and, later, innermost (duramen) parts of the trunk. At a certain point in time, all free water in seasoned wood evaporates, while saturation water reaches a dynamic balance with the outward moisture, reaching a value below 20%.
Wood moisture is expressed as a percent and is calculated using these two formulas:
Moisture on dry basis is indicated as u (%) and represents the mass of water present in relation to the mass of oven-dry wood. The formula for its calculation is the following:
Ww = wet weight of wood W0 = oven-dry weight of wood
On the other hand, moisture content on wet basis is indicated as M (%) and represents the mass of water present in relation to the mass of fresh wood. This measure is used in the marketing of wood fuels. The formula used for its determination is the following:
Ww = wet weight of wood W0 = oven-dry weight of wood
11 Assuming that the mass of newly-chopped fresh wood is made up half by water and half by wood substance, wood has a moisture on w.b. (M) of 50% and a moisture on d.b. (u) of 100%.
1.3.4 Heating value
The heating value or calorific value of a fuel represents the amount of energy released during the complete combustion of a mass unit. Regarding LC biomasses, the heating value depends by several factors such as biomass type (species, plant parts), moisture content, bulk density, storage before conversion.
The biomass type affects heating value because the distribution of the components such as lignin, cellulose and hemicelluloses varies according to species and plat parts. Lignin is the component having higher energy potential (27 MJ/kg), while cellulose and hemicelluloses have respectively 17.2-17.5 MJ/kg and 16 MJ/kg. Therefore, a biomass type having high lignin content in proportion respect the other components, will have more energy potential respect a species that in proportion has more cellulose and hemicelluloses.
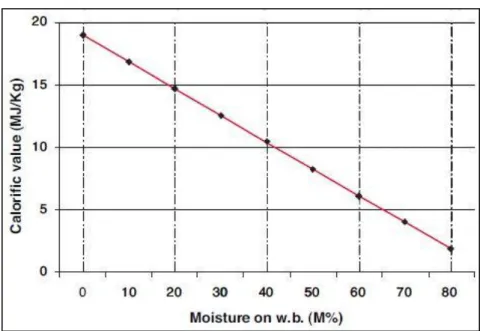
Another important parameter affecting the heating value of the LC biomasses is the moisture content, because part of the energy released during the combustion process is spent for the evaporation of water. Water evaporation involves the ‘consumption’ of 2.44 MJ per kilo of H2O. It is thereby possible to distinguish between the following:
- Higher heating value (HHV): in this case the energy deriving from the combustion process includes the energy spent for water evaporation
- Lower heating value (LHV): in this case the energy obtained from the combustion of the biomass does not include the energy spent for the evaporation of water.
It widely accepted the LHV is the main reference parameter used to describe the fuel quality. In order to calculate the LHV (MJ/kg) of wood with given moisture content (M) the following formula is used:
12 LHV0= Lower heating value of the dry biomass
M= Moisture content of the biomass
In figure 4 it is shown the heating value as a function of the moisture content.
Figure 4 - Heating value as function of the moisture content.
The third parameter affecting the heating value is the bulk density of the fuel. The bulk density is expressed as kg of biomass/m3; obviously, as the bulk density is higher, the energy produced per kg of biomass will be higher.
Finally, the storage is the last parameter that can affect the heating value of the fuel. In fact, during storage, the microorganisms that colonize the biomass can be specialized for the degradation of one component than another. For instance, as described in paragraph 1.3.1, the white-rot fungi degrade mainly lignin, while brown and soft-rot fungi remove cellulose and leave lignin essentially unchanged. Indeed, the attack of a species respect another determines the reduction of a specific component respect another influencing the final heating value of the fuel.
1.3.5 Ash content and ash melting point
Ash is the general term used to describe the inorganic matter in a fuel. In biomass fuels, the ash content may originate from the biomass itself, e.g. materials that the plant absorbed from the water or the soil during its growth, or from the supply chain, e.g. soil collected along with biomass. In any case, after the collection of a sample the ash content is typically
13 measured by combusting the biomass at a laboratory furnace under controlled conditions, taking into account the relevant standard EN 14775.
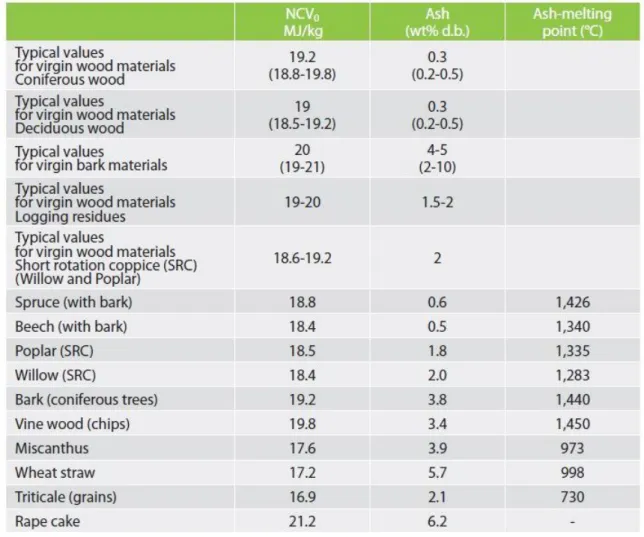
It is important to notice that the ashing temperature for biomass fuels is 550 °C, lower than the typical ashing temperature for coals, which is 780 °C. Generally, the ash content of herbaceous biomass is higher than that of woody biomass. Among solid biofuels, wood without bark is the one with the lowest ash content, whereas agricultural biofuels typically have high ash content. While ash weight content (in dry basis) values of less than 1% are expected for wood, different herbaceous biomass types have reported values ranging from less than 2% up to 8 – 10 % or even up to 25% for rice husks.
During combustion, some physical modifications in the ashes may occur. In fact, with the rise in temperature, they soften until the complete fusion of the particles is reached. Using fuels with low ash fusion temperatures increases the risk of ash slagging being formed on the grate. Fusion slags disturb the combustion process by altering primary air flows and favoring the overheating of the great as well as corrosive phenomena.
Wood and bark have a relatively high melting point (1,300-1,400°C) and thus do not have any criticalities. On the contrary, the melting point of herbaceous plants is below 1,000°C and, consequently, slags can easily be created during combustion. In the case of cereal (grains),the melting point is lower than 750°C and is, thus, particularly critical.
For the reasons listed above, agricultural biofuels have higher criticalities as compared to wood, and are only to be used in specific combustion devices. Ash can be divided into two categories:
1) Bottom ash - it is a considerable portion of the ash that gathers under the boiler grate and it is channelled into a storage tank. It has a mass density of 1.3 t/m3.
2) Fly ash - it is the ash that derives from flue gas cleaning and can further be divided into cyclone light ash and fine particles from electrostatic and bag filters. It has a mass density of 0.8-0.9 t/m3.
Table 3 shows the heating value, the ash content and the ash melting point of different biomasses.
14
Table 3 - Heating value, ash content and ash melting point of different biomass sources (Strömberg B., 2005)
1.4 Purpose of the research work
The research program has been focused on the assessment of the phenomena related to the storage of LC-biomass and on the evaluation of the respective fuel quality changes and energy losses occurred during storage. For such a purpose, three case studies were performed as follows:
1) Storage test last six months carried out with poplar wood chips piles deriving from different tree parts (stem and crown). The effects of storage were evaluated with respect to fuel quality and dry matter losses due to microbial degradation.
2) Storage test last six months carried out using whole poplar stems. The reduction of moisture content and dry matter losses were evaluated as for the previous study to understand differences in storage dynamics of different products (chips vs whole stems).
15 3) Storage test last three months using comminuted biomass of the perennial grass Arundo donax L. L.. The aim of the study was to investigate, in small-scale, different storage systems assessing the dynamics of storage and their effects on energy losses and fuel quality.
Another important objective of the Ph.D. has been the study of the occupational exposure of workers during the handling of the wood chip in the storage site. In fact, when lingo-cellulosic biomasses are stored, they may become a reservoir of microorganisms. The contact with these biologic entities can represent a “biologic risk” for workers. For this reason, another activity has been performed and it is indicated as follows:
4) Analysis of a wood chip storage station as “working environment”, identifying and quantifying the microorganisms present in bio-aereosol surrounding the storage site. The four research activities that have been indicated will be described separately as chapters of this Ph.D. thesis.
16
Chapter 2: Storage dynamics and fuel quality of poplar chips
17
2.1 Introduction
Italian poplar plantations cover about 120.000 hectares and represent 1.3 % of the national forest surface (Spinelli et al., 2011). Even if they cover a very small surface, poplar crops play a major role in the domestic raw material supply for the national wood industries. Due to their intense photosynthetic activity, poplar plantations also play an important role in CO2 sequestration and climate change mitigation (Zenone et al., 2007).
The strategic importance of poplar for industrial wood supply is recognized in many other countries, such as China, France, India, and Turkey – each producing more than 1 million m3 of poplar wood per year from specialized plantations (Spinelli et al., 2008).
Poplar wood has many potential uses, and even the longest rotation cycles are relatively short compared to those of most other trees; this can favour their integration with agricultural systems (Ulrich, 2004). Managed on 10 to 30 years rotations, selected poplar clones can be used for different purposes. The tree portion utilized is the stem, which is separated from the crown, and prepared for production of veneer-grade logs, boards, boxwood and pulp material.
In contrast, the physical characteristics of tree branches make it unsuitable for industrial use, resulting in a low economic value. In many cases, branches and tops represent a waste, and its disposal incurs additional costs (Manfredi, 2011). Studies have shown that branch wood may account for up to 40 % of the total biomass available on the plantation (Federlegno, 2011). Disposing of such a quantity of wood could be costly and time-consuming, if profitable end-uses are not identified.
A possible outlet for branch wood is offered by the particle board industry, where poplar residues are chipped into very fine particles and used to produce boards for various uses (Jahan-Latibari and Roohnia, 2010). However, studies have confirmed that delivery to the particle board industry offers very little benefit to plantation owners, due to the high costs of transportation and handling (Ondro, 1989).
Despite the widespread presence of poplar plantation across the world, it is clear that the identification of a viable use for harvesting residues is crucial to make poplar plantations a more attractive investment (Vietto et al., 2011).
18 In this regard, the increasing demand for renewable energy across Europe may offer new perspectives to this product. The Renewable Energy Directive 2009/28/EC sets new and ambitious targets for all member states, with the goal of increasing the share of renewable energy to 20% of the total by the year 2020 (European Parliament, 2009).
Within this context, the identification of new renewable energy sources is considered a priority. There is now much interest for harvesting residues (pruning, crowns, and stumps), because they are available in large quantities and their recovery can give a dramatic boost to the production of renewable energy (FAO, 1990).
However, forest operations are often seasonal, which entails the need for storage. In turn, wood storage is a complex business, whose economical efficiency is affected by many factors, and especially handling cost and product susceptibility to decay.
Wood fuels can be stored before or after comminution. Storage before comminution helps in minimizing decay by reducing the surface area exposed to potential microbial degradation (Afzal et al. 2010). However, handling cost is higher for uncomminuted wood than it is for chips (Manfredi et al., 2011). It is therefore necessary to find ways to store comminuted wood, such as chips, without causing biomass loss or a quality decline. Unfortunately, wood chips are extremely vulnerable to microbial degradation during storage, which often leads to high dry matter losses, reduction of energy value, risk of self-ignition, and potential human health risk due to exposure to airborne microspores.
Several investigations have been carried out to evaluate the changes in fuel quality and dry matter losses which occur during storage of comminuted wood (De Toro et al., 1994; EU, 2009; Ericson, 2011; Ilder et al., 2005; Jirjis et al., 2005; Jirjis et al., 2008; Jirjis, 2001; Jirjis and Theander, 1990; Samuelsson et al., 2006; Thörnqvist, 1990, Nellist et al., 1993). However, many of these studies have focused on storage of whole tree wood chips, and on species other than poplar. Moreover, there is little information available concerning the conservation capacity of comminuted poplar crown wood and its susceptibility to microbial degradation.
Nowadays, the international literature on wood chips degradation suggests that the material should be stored in conical piles, under aerated sheds (roof); eventually the material can be covered with transpiring sheets such as Gore-Tex or Top-Tex (Barontini et al., 2013). However, these measures are often very costly and the advantages gained do not always
19 justify the expense (Bonari et al 2009). Therefore, further studies are still needed to define cost-effective systems for fuel chip storage. This will be crucial for the future exploitation of poplar residues.
This study aims at determining the storage dynamics of poplar chips from two tree parts; stem and crown, with respect to internal heat development in the storage piles, changes in moisture content, dry matter losses and fuel quality. It is particularly important to know if, under the conditions typical of Southern Europe, chips obtained from poplar tree crowns are more difficult to store compared to that of poplar stems. Such information may help devising better storage techniques for chips obtained from energy plantation.
2.2 Material and methods
The storage trial was conducted in Central Italy at Cra-Ing Research Station in Monterotondo (42° 10’ 19’’ N latitude, 12° 62’ 66’’ E longitude). The study compared the storage behavior of wood chips produced from two different parts of poplar trees (Populus x canadensis M.): stems with a top diameter > 20 cm, and crown wood smaller than 20 cm in diameter. The threshold of 20 cm was chosen because it corresponds to the average branching point of the studied trees.
Stems and crowns, completely free of leaves, were chipped separately using the same machine, (Pezzolato), a commercial drum chipper. Details of the chipping operations have been published separately (Assirelli et al., 2013). The chips were used to build three large-scale piles for each tree part (stem and crown).
The experimentation ran between March and September 2012. Considering the importance of producing good quality fuel at a minimum cost for storage facility, 6 plastic sheets (1 per pile) were used as storage floor. Plastic sheets are less suitable than asphalt due to their low drainage properties, but they offer a much cheaper way to avoid direct microbial contamination from the soil.
Experimental piles
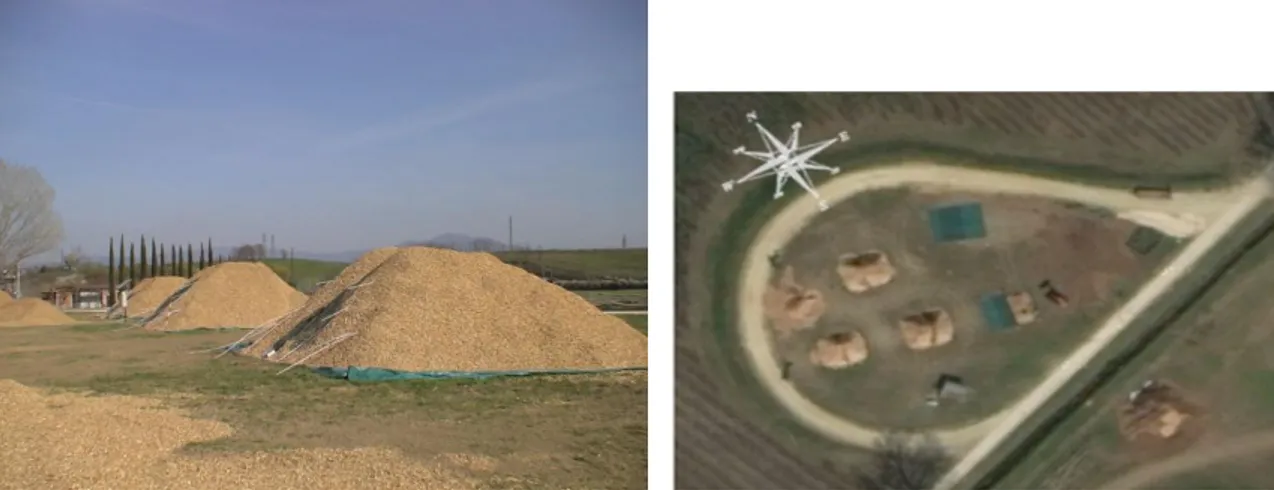
All piles were 10m long, 8m wide, and 4m high, with a mean volume of 117 m3 of loose chips (Figure 5). During the entire storage period, all piles were exposed to the same climatic conditions (Figure 6).
20
Figure 5- View at soil level of the wood chip piles. Figure 6 - Aerial view of the wood chip piles.
Climatic data were recorded using a weather cab “SIAP-MICROS DA9000” certified by SIAN (National Informative System for Agriculture). This was located approximately 800 m from the storage site (Lat. 42° 05', Long. 12° 38', Alt. 51 m AMSL). The collected data including local microclimate, precipitation, external temperature, and air humidity were recorded during the entire storage period.
Each pile was divided into two equal semi-piles, using a plastic net. This was done to produce two semi-piles, which could be sampled at different times. Therefore, we opened and sampled 6 semi-piles after six months, leaving the remaining semi-piles for future studies. The piles were marked with sampling points at three levels: 1.0, 2,5 and 3,5 m from the ground and identified as L1, L2 and L3 respectively. The points within each layer are shown in figure 7.
Parameters studied
At each measurement point we placed a thermocouple (model PT 100) and 4 plastic net bags filled with fresh chips. Each bag was weighed and the chips moisture content was determined at the beginning and the end of the trial. In order to monitor heat development during storage, thermocouples were placed close to the sampling bags and the other end was connected to a computerized control unit that transmitted temperature data to the office computer in real-time (Figure 8).
21 Six thermocouples were placed in each semi-pile, with a total of 36 thermocouples in all piles. Around each thermocouple, we placed 4 net bags/ sampling point, for a total of 144 net bags (36 thermocouples x 4 net bags).
Fuel quality is defined here by the parameters: moisture content, ash content, heating value (lower and higher) and chemical composition. These parameters were determined both before and after storage, according to the respective European standards UNI EN 14774-2, 14918, 14775, 15104, and 15289. Fuel quality at the beginning of the storage period was determined using 24 chip samples (12 for each treatment) with a weight of 500 g each. Samples were randomly selected and collected from the piles during their construction. Fuel quality after storage was determined using the chips stored in the 36 net bags, collected from the different sampling points.
Dry matter losses and moisture content after storage were determined on the remaining 3 chip bags present in each point of the 6 semi-piles (i.e. 108 net bags). Initial dry weight was calculated using the moisture content of parallel samples of fresh material. At the end of the trial, sample bags were collected and weighed before and after drying in a ventilated oven set at 105 ± 2°C, until they reached constant weight. Dry matter losses were calculated using the following equation (equation 1) (Jirjis and Theander, 1990):
DML = [1-(
)] x 100 [1] DML: Dry matter losses [%DM] DW1: Dry weight before storage [kg] DW2: Dry weight after storage [kg]
Figure 8 - Installation of samples and thermocouple in a
measurement point.
Figure 7 - Arrangement of measurement points in the three layers of the pile.
22 In addition, dry matter losses were also evaluated by comparing the total dry weight of the semi-piles, measured at the beginning and at the end of the storage period. To this purpose, all the chips constituting each semi-pile were weighed by taking the incoming transports to a certified weighbridge.
At the end of the storage trial, when the semi-piles were dismantled, all the chips from each semi-pile were loaded on trucks and taken again to the same weighbridge. The weights were corrected for moisture content to determine the dry weight of each semi-pile before and after storage. The results obtained from this operation were compared with those calculated by weighing the sample bags for validation.
Bulk density was determined before and after storage on both types of materials, according to UNI EN 15103. A steel cylinder of known internal volume was filled with chips and then weighed. Chips were dropped into the cylinder from a height of about 20 cm, to simulate the compacting effect of a conveyor. The ratio between the net weight of the cylinder and its internal volume represented chips density, expressed in kg/m3. Bulk density measurements were repeated 24 times at the start of the trial and 36 times (6 replicates for each semi-pile) at the end.
Particle size distribution was determined on 20 samples (10 per treatment) weighing 1 kg each, by using a mechanical sieve according to UNI EN 14961 [32].
Variations in energy content were calculated with the following equation (equation 2) (Thörnqvist and Jirjis, 1990):
[2]
Final LHV = Lower Heating Value after storage Initial LHV = Lower Heating Value before storage
Data were analyzed with the Statview advanced statistics software (SAS 1999), in order to check the statistical significance of the eventual differences between treatments. After checking the data for normality, the software was used for performing typical analyses of variance (Anova), especially suited to the experiment just described. Anova tables were drawn, in order to see how the sum of squares was divided between main effects,
23 0 10 20 30 40 50 60 70 80 90 100
relative air humidity (%) precipitation (mm) mean daily temp.(˚C)
interactions and residuals. Before statistical analysis, nitrogen content data were arcsine transformed in order to normalize their distribution.
2.3 Results
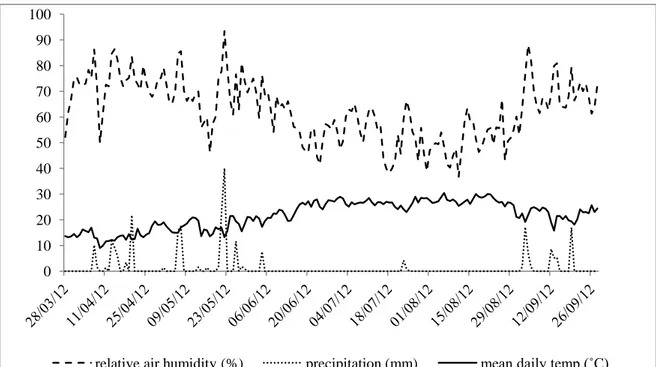
Weather conditionsDuring the storage period the mean daily temperature ranged between 9 and 30 °C, while the accumulated precipitations amounted to 259 mm. Rainfall events were mainly concentrated in the first two months of storage, followed by a drought period of about three months (Figure 9).
Figure 9 - Climatic characterization of the storage site during the storage period.
Temperature inside the semi-piles
Internal heat development was monitored for the entire period of storage in the six regions of each semi-pile. Figures 6 and 7 show the average internal temperature trends recorded during the storage period in the semi-piles of crown and stem chips, respectively, and it was built by averaging the temperatures recorded for that same level in the three semi-piles. Temperature trends were very similar in the semi-piles of the same material. In contrast, temperature patterns were very much different between the two treatments
24 (Figure 10 and 11). In particular, the three semi-piles built with crown chips showed a rapid peak near 70 °C in the first week of storage. Then temperature decreased over time and stabilized around the fourth month of storage. Heat development in these semi-piles did not differ much between pile layers.
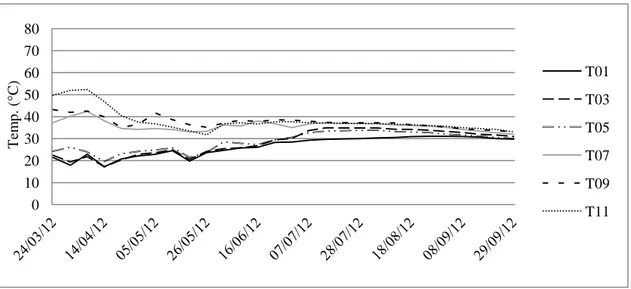
The temperature inside the stem chip piles did not rise as fast as in crown chip piles, nor did it reach similar levels. In fact, temperatures started from a level lower than the one observed for the crown chips (Figure 11) and the maximum temperature did not exceed 55°C. Furthermore, there was a clear difference between pile layers, with the lower layers (T01, T03, T05) remaining very close to ambient temperatures throughout the whole storage period, and the upper layers (T07, T09, T011) heating up during the initial months in storage.
Figure 10 - Temperature changes during storage at the different points of crown wood piles. Each line represents the temperature recorded over time in each measurement point. Each value is the average of the three semi-piles.
Figure 11 - Temperature changes during storage in the different measurement points of stem wood piles. Each line represents the temperature recorded over time in each measurement point of the pile layers.
0 10 20 30 40 50 60 70 80 T em p . (° C) T01 T03 T05 T07 T09 T11 0 10 20 30 40 50 60 70 80 T em p . (° C) T01 T03 T05 T07 T09 T11
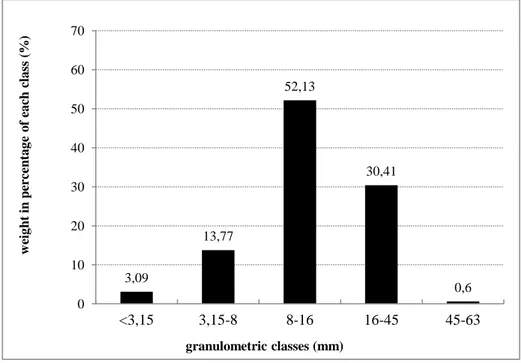
25 3,11 11,81 55,56 29,52 0 10 20 30 40 50 60 70 <3,15 3,15-8 8-16 16-45 w eig h t in p er ce n ta g e o f ea ch c la ss (% ) granulometric classes (mm) 3,09 13,77 52,13 30,41 0,6 0 10 20 30 40 50 60 70 <3,15 3,15-8 8-16 16-45 45-63 w eig h t in p er ce n ta g e o f ea ch c la ss (% ) granulometric classes (mm)
Particle size distribution, moisture content, woodchip density and dry matter losses
Particle size distribution did not differ significantly between chips from stem or crown biomass, which implies that pile permeability and air circulation was similar. The most represented particle length was between 8 and 16 mm. Chips within this class represented over 50% of the total weight of the semi-piles, for both material (Figure 12 and 13).
Figure 12 - Particle size distribution of crown woodchips.
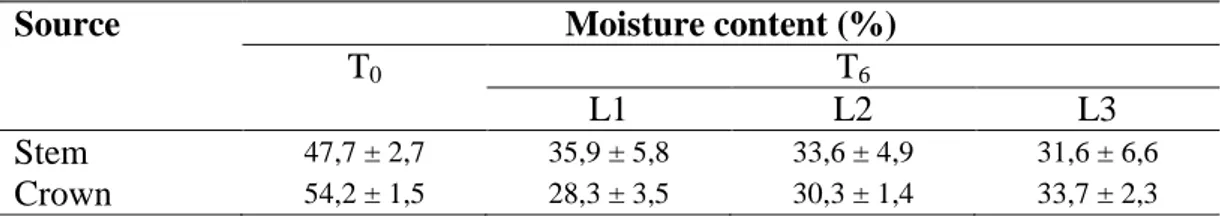
26 Concerning the moisture content (MC), all the tested samples showed a clear reduction in moisture content after six months of storage (Table 4). Despite the higher initial mc of the crown chips, the average MC after storage was lower than that of the stem wood chips. Analysis of variance confirmed that differences between the two assortments, the two periods (beginning and end of storage) and their interaction were significant at the 1% level. No significant differences in MC were found between different layers at the end of the storage period.
Table 4 - Mean moisture content (±Standard.deviation) of the two wood chips assortments at the beginning (T0) and after six months (T6) of storage in the three layers.
Source Moisture content (%)
T0 T6
L1 L2 L3
Stem 47,7 ± 2,7 35,9 ± 5,8 33,6 ± 4,9 31,6 ± 6,6
Crown 54,2 ± 1,5 28,3 ± 3,5 30,3 ± 1,4 33,7 ± 2,3
The results of bulk density measurements showed that crown chips had a higher mean value than stem wood chips at the beginning of the trial. However, stem wood had a higher bulk density after storage (table 5). In both cases, bulk density increased after storage, by 25% for stem chips and by 18% for crown chips. Analysis of variance indicated that the differences between the two treatments were not significant, but the differences between the two periods and the interaction of period with treatment were significant at the 1% level. Differences between bulk densities values measured in different layers of the piles were not statistically significant (data are not shown).
Table 5 - Bulk density expressed in kg m^3-1 (± St. Dev.) at the beginning (T0) and after six months (T6) of storage
on both wood chips assortments.
Time Source
Stem Crown
T0 327.2±11.7 341.2±7.6
T6 408.0±19.6 402.3±20.9
Dry matter losses ranged between 6 and 27% (dry weight basis), depending on treatment and measurement method (net bag samples or whole pile), and they were consistently higher for stem wood chips. Both measurement methods returned similar figures and
27 trends, validating each other (table 6). Analysis of variance indicated that the difference between treatments was significant at the 1% level.
Table 6 - Dry matter losses (%, dry weight basis) determined by net-bag sampling method and by the total weight of the semi-pile before and after storage.
Source Net bag Semi-piles weighing
Layer Mean Semi-piles Mean
1 2 3 A B C
Crown 4 7 9 6.6 11 10 9 10.0
Stem 24 21 20 21.6 26 26 28 26.6
Fuel characteristics
Table 7 shows the main quality parameters for the two chip types at the beginning of the trial, whereas table 8 shows the same parameters at each layer of the piles at the end of storage period. The good results obtained after storage are marked by the heating values of the two chip kinds which increased in both cases.
Table 7 - Chemical analyses and heating values at the beginning (T0) and after six months (T6) of
storage in the studied wood chip assortments.
Concerning the analysis of the chemical elements (C, H, N, S), the only significant difference between the two chip types at the beginning of the trial is in Nitrogen content, which was 0.32% in the crown wood chips and 0.21% in the stem wood chips. After six months, Nitrogen content had decreased significantly, and it was 0.21% in the crown wood chips and 0.15% in the stem wood chips. Nitrogen content differences between tree part and sampling time (initial vs. T6) were statistically significant at the 5% level, according to
Parameter Unit Source
Crown Stem T0 * T6 ** T0 * T6 ** Ash % s.s. 2,91 ± 0,70 3.09 ± 0,54 3,02 ± 0,30 3,20 ± 0,73 Nitrogen % 0,32 0.20 0,21 0.15 Carbon % 47,70 46.88 47,20 47.81 Hydrogen % 5,90 6.07 5,96 6.16 Sulfur % 0,03 0.03 0,03 0.03 HEATING VALUE -
Higher Heating Value MJ/kg d.w. 16,28 ± 0,29 17,18 ± 0,25 15,61 ± 0,64 17,69 ± 0,34
28 -20 -15 -10 -5 0 5 Stem Crown D E n. (%)
Semi-pile Net bag
the Scheffe’s post-hoc test. After six months in storage, a slight increase in ash content for both chip types was also observed.
Table 8 - Chemical analyses and heating values of stem and crown wood chips after six months of storage. The values are reported for each semi-pile layer.
Parameter
Source Layer Ash (%) N (%) C (%) H (%) S (%) HHV
(MJ/kg) LHV (MJ/kg) STEM 1 3,70 ± 0,60 0,20 47,2 6,0 0,030 17,08 ± 0,20 15,74 ± 0,22 2 2,50 ± 0,23 0,10 47,5 6,1 0,020 17,27 ± 0,27 15,98 ± 0,25 3 3,00 ± 0,40 0,16 47,9 6,3 0,030 17,32 ± 0,33 16,04 ± 0,30 CROWN 1 3,20 ± 0,30 0,21 47,7 6,2 0,030 17,83 ± 0,28 16,49 ± 0,28 2 3,00 ± 0,80 0,20 45,2 5,9 0,030 17,61 ± 0,42 16,27 ± 0,41 3 2,70 ± 0,10 0,20 47,8 6,2 0,030 17,43 ± 0,13 16,10 ± 0,08
After six months of storage, changes in energy content calculated according to equation 2, using dry matter losses obtained by the two evaluation methods, were minimal in crown wood chips. Losses in the energy content of stem wood chips, however, were substantial irrespective of calculation method (Figure 14).
Figure 14 -Changes in energy content (%) in stem and crown wood chips of poplar, Dry matter losses were calculated by weighing the whole semi-pile or by using the net bags weighing method.
29
2.4 Discussion
Temperature level inside a stored chip pile can be considered as an indicator of storage performance, since aerobic degradation reactions are exothermic and generate a marked temperature rise. Different species of microorganisms have varying capacity to degrade cellulose, lignin and other wood components present in a chip pile. Most mould fungi, for example, utilize mainly available soluble nutrients but unable to degrade more complicated substrates such as lignin. The presence of such fungi normally leads to small dry matter loss. On the other hand many species of rot fungi can consume lignin and cause high substance losses.
The immediate rise in temperature in the crown chip pile could be due to the fast establishment of moulds on the nitrogen-rich biomass. As such substrate diminishes, temperature starts to slowly decline to more moderate levels allowing other species to grow. Stem wood normally contain lower concentrations of nitrogen and soluble nutrient are less available than the crown part of the tree. This is most probably the reason behind the moderate rise in temperature in the stem pile.
In all cases, the piles temperature was close to the ambient temperature after about 150 days of storage. Similar observation was recently reported by Manzone et al.. Different heat development in the piles may explain their different moisture content. In general, the chips were dried by the end of the trial, indicating the occurrence of natural drying. Stem chip piles had relatively higher moisture content than crown piles. The high heat development in the crown chip piles facilitated better drying of the material.
The dry matter losses were clearly higher in the stem wood piles compared with crown wood. The moderate temperature and the higher moisture content in the former provided favorable conditions for the growth of rot fungi species which are known to lead to high substance loss. Just as high dry matter losses was measured after storing Salix chips in a three meters high pile during May- September (Jirjis and Lehtikangas, 1998). The study further reported the presence of an intensive growth of white rot fungi in the pile.
The values of dry matter loss obtained through the weighing of net bags were systematically lower than those obtained by weighing the whole semi-piles. This may be related to semi-pile geometry, and in general with the difficulty of integrating the behavior of a whole semi-pile through 24 samples only, however aptly located. Differences in bulk
30 density at the beginning of the trial are explained by different moisture content in the two treatments, because particle size distribution turned out to be the same for both treatments. Different moisture content may explain the switchover in bulk density values at the end of the trial, when stem chip samples were denser than crown wood samples.
The chemical analyses made at the beginning and at the end of the storage period did not detect any differences between treatments and periods, except for nitrogen content. Changes in energy content was closely related to moisture content and dry matter losses, and it was marginally higher for crown chips at the end of the storage period. In fact, crown chips did incur negligible energy loss after the six-month storage period, whereas stem chips lost between 13 and 18% of their energy content. Indeed, these results are somehow unexpected.
Studies on the crown part of the woody species often show substantial deterioration in quality while stem wood has generally better storage properties. However, all indicators concurred to the same results, so we can categorically exclude any errors in the measurements. It is possible that poplar chips behave differently, partly because poplar wood is quite vulnerable to microbial attack in general which would explain the poor performance of stem chips. Another possible explanation for this discrepancy is that studies made on the crown of soft wood species almost always contained needle fraction. The crowns tested in this study were chipped in winter, without any leaves.
2.5 Conclusions
Crowns generally represent a residue to be disposed of rather than used as a commercial commodity. Easier problem-free storage may increase their attraction as a renewable fuel for the biomass energy market. The building of uncovered heap on plastic sheets is the cheapest and most suitable solution for a low-value commodity such as wood chips. From the practical viewpoint, the results of the study indicate that it is advisable to store poplar stem wood as logs and chipping it just before use, whereas poplar crown wood can be chipped immediately and stored as chips. Due to the lower dry matter losses and the retaining of higher energy content, chips obtained from the crown can be stored for a longer period compared with stem chips without a remarkable decline of feedstock quality. This has a practical implication and particularly convenient, because it is easy to
31 manufacture and store logs from stem wood, while it would be much more complicated to store uncomminuted crowns, which are difficult to handle and take up much space.
Stem and crown chips can possibly support the growth of different biota, adapted to the specific substrate and to the climate of central Italy, leading to a different decay rate during storage and influencing the fuel quality after the storage period.
Future studies will be needed in order to model the exact storage dynamics of different chip types, under different conditions. Ideally, such tests should be conducted under a controlled environment, in order to analyze all main factors affecting chips decay.
32
Chapter 3: Open-air drying of cut and windrowed short-rotation poplar
Stems
33
3.1 Introduction
Dedicated tree plantations can help meeting the increasingly large demand for wood fiber, experienced at a global level (Sims et al., 2006). Large amounts of wood biomass can be obtained from tree farms, established on ex-arable land with fast-growing hardwoods and harvested every 2 to 10 years, according to site conditions and product strategy (Spinelli et al., 2012). Over the years, improved management techniques have been developed, which offer a good energy balance (Manzone et al., 2009) and acceptable economic results (Spinelli et al., 2011).
Although not exclusive, coppice management is very popular, because it allows reducing regeneration cost while simplifying operation management (Heller et al., 2003). Pioneering studies have explored the technical possibilities of year-round coppicing (Sims and Venturi, 2004), which remains a theoretical option and is generally excluded from common practice. As a rule, coppicing is performed during the dormant season only, in winter time. That restricts the production window to 5 months at most, and places a significant strain on production planning when trying to meet a demand for wood biomass that is steady and sustained all along the year (Nord-Larsen and Talbot, 2004). Diachronic supply and demand create a need for a product buffer to secure supply at all times (Jirjis, 1995).
Biomass storage strategies change with product type and local conditions (Jirjis, 2005), but they can be described based on the site where the product is stored and on the form under which it is stored. Biomass can be stored at the user plant, at wood terminals or near the plantations (Kanzian et al., 2009), with the last option being generally considered as the least expensive. Furthermore, biomass can be stored before or after comminution.
Storage before comminution allows minimizing wood decay, but results in higher handling costs compared with storage after comminution (Afzal et al., 2010). Comminuted wood is much easier to handle, but very difficult to store: unless they are dried, fresh wood chips are subject to rapid decay, leading to high dry-matter losses (Barontini et al., 2014), reduction of energy content (Pecenka et al., 2014), increased emissions (Wihersaari, 2005), and risk of self-ignition (Thörnqvist, 1987).
Storing uncomminuted stems on the field seems an ideal solution, because it combines the most durable product form with the cheapest storage site, while minimizing handling cost. The new harvesting system developed by the Italian Council for Research in Agriculture