UNIVERSITÀ DEGLI STUDI DI MESSINA
DIPARTIMENTO DI
MEDICINA CLINICA E SPERIMENTALE
CORSO DI DOTTORATO IN BIOTECNOLOGIE MEDICHE ECHIRURGICHE
XXXII CICLO (SSD MED/17)
Naive vs memory CD4 T cells: which subset
harbors the real reservoir?
Tesi di dottorato di:
Relatore:
Dott. Emmanuele Venanzi Rullo Chiar.mo Prof. Giuseppe
Nunnari
Coordinatore del corso:
Chiar.mo Prof. Giovanni
Squadrito
Revisori esterni:
Una O’Doherty MD, Phd
Santiago Moreno MD, Phd
Index
Introduction pag. 1
Naïve CD4 T cells: the first to rise, the last to die pag. 4 Chronologic overview on Naïve CD4+ T cells and HIV pag. 7 Reservoir and CD4 T cell subsets pag. 18
Methods pag. 20
Results pag. 28
Discussion pag. 33
Figures and Tables pag. 38
Introduction
With the advent of antiretroviral therapy (ART) the natural history of HIV infection changed. On ART, viral loads decline to undetectable levels, immune recovery occurs, and life expectancy as well as quality of life improved 1. Nonetheless, the virus persists as a latent, treatment-resistant
reservoir of HIV proviruses requiring life-long therapy 2,3. Pioneering work
has shown that the HIV reservoir has a very slow rate of decay. Estimates of reservoir decay suggested a half-life of 44 months using Quantitative Viral Outgrowth Assay (QVOA) 2,3. However, these measurements were indirect,
and their error was sufficiently large that the precise half-life of the reservoir in individual subjects was uncertain. Differentiating error due to assay inconsistency versus biological variation is difficult. If biological variation is prominent, a subset of subjects may have significant reservoir decline while others may not. For this reason, it becomes essential to robustly measure each individual’s reservoir decay rate, especially in cure studies. This biological variation could arise for multiple reasons, including variable ART compliance or biological differences in the host or pathogen.
Viral nucleic acid measurements have been used as a surrogate for HIV reservoir size, as some studies have shown significant correlations with QVOA 4. Longitudinal studies suggest HIV DNA is relatively stable after the
first few years of ART 5. However, HIV DNA measurements suffer from the
presence of defective proviruses, which constitute the majority of the total DNA; thus, while the intra-assay variation for PCR is small, the variable and
largely unknown frequency of defective proviruses 6-10 results in precise but
inaccurate estimates of replication-competent reservoir size. As a consequence, large changes in replication-competent proviruses may be masked by defective proviral DNA. Moreover, selective pressures on defective DNA may be different than selective pressures on intact proviruses 11, and thus HIV DNA measures may not be an appropriate way
to longitudinally monitor reservoir dynamics.
Monitoring the frequency of individual proviral sequences over time in the presence of ART could reveal positive and negative selective pressures that act on infected cells. Furthermore, such an approach would differentiate between replication-competent and defective proviruses, allowing for a direct calculation of decay of the replication-competent reservoir. While such an approach is currently not feasible for all HIV-infected individuals due to limited throughput and cost, in-depth study of a subset of subjects might provide new insights into reservoir dynamics as well as the effect of the host on reservoir persistence.
We recently employed limiting dilution polymerase chain reaction (PCR) followed by DNA sequencing to obtain full-length sequences of integrated HIV proviruses in four subjects on suppressive ART over time 12. We provide
evidence that both intact and defective proviruses that contain genetic elements that favor protein expression are under negative selective pressure. Interestingly, defective proviruses that lack these genetic elements, but encode a strong donor splice sequence, are under relative positive selective pressure. We also show significant biological variation in
reservoir decay in two of these individuals. In this case, clonal expansion represents an important factor contributing to slower decay. An important implication from our analysis is that the replication-competent reservoir of intact proviruses is under more negative selection than defective proviruses, suggesting that the majority of the replication-competent reservoir is expressed over time.
Naïve CD4 T cells: the first to rise, the last to die
Following positive and negative selection, T cells are released from the thymus as mature, naive T (Tn) cells harboring a given epitope specificity. When Tn encounter a cognate antigen (Ag) they proliferate and differentiate into effector cells, the vast majority of which migrate to peripheral tissues and inflamed sites to facilitate destruction of infected targets (reviewed in
13). After Ag clearance, >95% of the effector cells die while a small pool of
T cells ultimately develops into long-lived memory T cells 14. Tn and memory
cells can be separate on the basis of surface proteins expressed, due to different splice of the CD45 gene product: CD45RA and CD45RO 15. The
first is expressed by Tn and the latter by memory T cells. CD45RO+ cells are rarely found in neonates and their number progressively grows with age
16,17. Tn express high levels of the lymphnode homing receptor CD62L
(L-selectin), while memory cells are split into CD62L+ and CD62L− subsets 18.
This allows Tn to recirculate form lymphnode to peripheral blood as well as central memory T cells (Tcm). Transitional and Effector memory T cells lack this capability (CD62L− subsets) and are confined to periphery.
Following deuterated glucose administration, CD4+ CD45RA+ CCR7+ Tn are uniformly (>99%) nondividing. Conversely, memory cells have been found to incorporate more deuterium, with TEM cells incorporating the highest levels of it 19. From the observation of deuterium levels decay,
Macallan et al. estimated that a Tn cell doubles on an average about once a year, a Tcm cell every 60 days, and Tem or Ttm cell every 20 days.
A precursor-product relationship between CCR7+ memory cells (Tcm) and CCR7- memory cells (Tem) has been suggested by the fact that Tcm retain longer telomeres than Tem and are capable of generating Tem in vitro, but not vice versa 20. Indeed, after these first pioneering papers, a lot of different
methods used to calculate the subsets’ half-life gave very different estimates. Nonetheless, the average half-life of Tn (calculated from 1 to 9 years in different studies), resulted always longer than in memory subsets. Also, between memory subsets the same pattern has been proven with an increasing half-life going from Tcm to Ttm and Tem.
Eleven-color flow cytometric analysis has revealed that not a single marker or a combination of two markers are enough for the identification of pure Tn cells 21. Ideally, the more markers are included to define cells, the better.
However, some of these markers have a largely redundant expression, therefore not providing additional information. In the last few years the most accepted sorting strategy picked CD45RA to divide Tn from memory cells and CCR7 and CD27 (or 28) to divide different memory subsets and to obtain purer Tn. Also, since the discovery of a less differentiated memory subset, that share the same Ag expression (CD45RA+CCR7+CD27+) with Tn, an additional marker has been added: CD95. Nowadays the subsets are defined as: Tn (CD45RA+CCR7+CD27+CD95-), Tscm (CD45RA+CCR7+CD27+CD95+), Tcm (CD45RA-CCR7+CD27+), Ttm (CD45RA-CCR7-CD27+) and Tem (CD45RA-CCR7-CD27-).
In conclusion Tn shares some characteristics that made them a unique subset. It is the first subset rising from the thymus; than, after Ag encounter, Tn differentiate into memory cells but not vice versa; Tn have the longest half-life and the capability to recirculate from lymphnodes to peripheral blood and, finally, Tn have the lowest metabolic activity and protein expression. All of these characteristics represent, in our opinion, an additional hurdle to the HIV eradication when Tn are infected and persist as part of the so-called reservoir.
Chronologic overview on Naïve CD4+ T cells and HIV
For many years it has been assumed that the pool of memory CD4+ T cells represents the real reservoir in HIV. This was supported by several observations demonstrating preferential HIV-1 isolation and accumulation of provirus within the memory versus naive subsets of CD4+ T cells obtained from HIV-1-infected individuals 22-25. Similar findings have been
obtained not only in adult but also in HIV-1 infected children by Sleasman et al. 26, that could prove Tn infection with an integration level 10 to 100-fold
lower than in memory cells.
Early studies have shown that although memory (CD45RO+) and naive (CD45RA+) CD4+ T cells are equally susceptible to acute infection by CXCR4-tropic viruses, memory CD4+ T cells have a greater capacity to produce infectious virus in tissue cultures after activation by various physiologic stimuli, such as interleukin 2, or anti-CD3 plus anti-CD28 co-stimulation 24,27-29. In particular, Roederer et al. 27 isolated CD45RA+ and
CD62L+ naive CD4+ T cells from normal HIV-uninfected blood donors and showed that these cells were inherently resistant to productive infection by CXCR4-tropic viruses after anti-CD3 and anti-CD28 co-stimulation. These findings have questioned the importance of naive CD4+ T cells as a potential reservoir for HIV-1 and suggest that naive CD4+ T cells in vivo should be devoid of HIV-1.
Spina et al. 28 argued that nef could play a more important role in Tn than in
memory cells. Deletion of HIV nef function caused a severe reduction in viral replication, especially in the CD45RA+ naive cell after CD3 induction.
Chun et al 30 suggested that there are differences between memory and
naive CD4 T cells, in terms of susceptibility to the cytopathic effect of an CXCR4-tropic virus. Namely, naive cells (CD4+ HLA-DR- CD45RA+) were less susceptible after activation.
The first experiment that tried to explore differences between CXCR4 and CCR5-tropic viruses among CD4+ T cell subsets was published in 1998. Riley et al. 31 infected activated and resting CD4+ T cells but they also report
that susceptibility to CCR5 viruses is not governed solely by the level of CCR5 expression, but rather by the balance between CCR5 expression and ß-chemokine expression. The neutralization of these ß-chemokines rendered memory CD4+ cells highly sensitive to infection with CCR5 HIV-1 isolates, indicating that downregulation of CCR5 is not sufficient to mediate complete protection from CCR5 strains of HIV-1. These results indicate that susceptibility to CCR5 HIV-1 isolates is determined not only by the level of CCR5 expression but also by the balance of CCR5 expression and ß-chemokine production. Joined with the evidence that is the CCR5 virus the responsible of the spreading infection, at least in early stages of the disease, make the authors suggest a model of HIV-1 transmission and pathogenesis in which naive rather than memory CD4+ T cells serve as the targets for early rounds of HIV-1 replication.
It has been shown that developing thymocytes at the CD4+ CD8+ double-positive stage can become infected by HIV and thus might contribute to infection of the peripheral naive CD4+ T cell pool 32,33. Brenchley et
observed that they did not find any infected naive CD8+ T cell and that most infected naive CD4+ T cells are CD31-, suggested that they were probably infected while proliferating in the periphery 34. On the other hand, Wightman
et al. 35 did not find either any significant differences in HIV-DNA levels or
evidence of genetic compartmentalization, between CD31+ and CD31- naive CD4 T cells before ART. The higher level of CD31- naive cells could be proven only after months on ART. They also observed lack of changes in CD31+/CD31- ratio after ART initiation 35. According to the authors the
preserved ratios of CD31+ and CD31- naive CD4+ T cells after ART are consistent with both thymic regeneration and peripheral expansion leading to reconstitution of the naive CD4+ T cell pool. Finally, Fabre-Mersseman et al. 36 showed in both treated and untreated infected subjects, only slightly
higher HIV-DNA levels in CD31- and CD31+ naive T cells (median fold difference 1.4, P <0.015).
Ostrowski in 1999 37 using an Alu-LTR PCR found HIV-DNA in Tn (defined
as CD45RA+CD62L+). The integration level was lower in Tn than in memory cells but present in 8 out of 10 subjects. It is important to notice that the subjects were infected with both CXCR4 and CCR5-tropic viruses.
In 2001 Baldanti et al. 38 found no differences in terms of HIV-DNA levels
between responders and no responders subjects on ART. Also, in this study memory cells had a 10 to 20-fold higher integration level than Tn.
A real breakthrough in the field of HIV reservoir and CD4+ T cell subsets was represented by the study of Chomont et al 39. Given the evidence that
have been accumulating and that discourage the theory of ongoing replication as a mechanism of persistence for the reservoir, the authors followed the idea that homeostatic and antigen-driven proliferation could play a different role among the subsets. They measured the integration levels using an Alu-LTR PCR in Tn, Tem, Tcm and Ttm. Their results showed that Tcm harbor the highest amount of HIV-DNA followed by Tem-Ttm. The lowest amount, and even undetectable in some case, was detected in Tn. They also built phylogeny trees of the env sequences isolated in different subsets and, based on their results, high proliferation levels (in Ttm and Tem) are associated with a limited genetic evolution of the reservoir over time. Vice versa they found genetic evolution in long-lived cells.
There are few caveats to point out. The measure of total HIV-DNA cannot distinguish between intact and defective proviruses. The defective and not replication competent proviruses represent 90-99% of the proviruses in subjects on ART. Additionally, using only the env sequences we could underestimate the genetic evolution because nearly 50% of the proviruses lack of this part.
Also, Heeregrave et al 40 found similar results with similar methods
(measure of total HIV-DNA and analysis of env sequences). They added the interesting observation that in a treated individual, who switches from CCR5 to dual CCR5/CXCR4 coreceptor usage, a pronounced increase in the infection level of the naive population was observed, and there was no sign of viral compartmentalization among all subsets.
In 2009 Dai et al. 41 demonstrated that in vitro infection of naive CD4 T cells
is possible even without prior activation with a CXCR4-tropic virus. They also speculated that resting memory CD4+ T cells are more susceptible to HIV infection than naive cells in large part because viral fusion occurs more efficiently in memory cells. In their experiments the authors obtained naive cells infection by spinoculation, with a CXCR4-tropic virus but not with a CCR5-tropic virus.
In 2011 Centlivre et al. 42 measured HIV-DNA both in acute and chronic
patients, sorting naive and memory CD4 T cells among other subsets. In their study they showed that the reservoir harbored in naive CD4 T cells was pretty much stable and it was established in an early phase. In fact, there were no significant difference in terms of integration levels between acute and chronic patients and in both groups of patients the memory compartment has a higher integration level overall 42. The naive as well as
the total memory CD4 compartments appeared to be massively infected from the early stages II/III 42.
Indeed, in one cohort study with subjects with a median 225 days from estimated seroconversion date, the HIV-DNA content was huge in naive, central, transitional and effector memory cells, regardless of their activation status; infection level was significantly higher in TEM than in the other three subsets.
Ganesan et al. in 2010 found the biggest difference in terms of HIV-DNA integration level between Tn and memory cells. It was 100-fold lower in Tn
43.
Sáez-Cirión et al. 44 measured HIV-DNA in vivo and HIV recovery after
stimulation of resting CD4 T cell subsets. As expected, Tn had the lower integration level (also undetectable in a lot of samples) by PCR. When they stimulated in vitro the collected subsets, though, they could recover infectious viruses even in those naive samples that had undetectable HIV-DNA. In our opinion these could be consistent with our findings that show a low integration level but a high percentage of intact proviruses in Tn. The undetectability of HIV-DNA could be explained by the insufficient number of cells used by the authors 44. The possible high percentage of intact
proviruses harbored in Tn could explain the HIV recovery after stimulation even in those samples where the integration level was so low to be undetectable by PCR measurements.
45 twelve subjects included at a median of 36 days after infection. Tn
infected with an integration level 10-fold lower than total memory. All CCR5-tropic. In 88% of the subject studied by sequencing of the env region, each
subject’s isolated clones all belonged to a single cluster (which was different for each study participant), and there was no compartmentalization between plasma, rectum and reservoir across all the subsets.
Comparing the resting CD4 subsets frequency between acutely infected and uninfected individuals they noticed that the frequency of differentiated short-lived subsets was at least twice as high among study participants (median 30% Ttm cells and 7.4% Tem cells) than in uninfected individuals (median 14% Ttm cells and 1.9% Tem cells, p=0.0010). This relative increase was balanced by a significant decrease (p,0.0014) in patients’ long-lived subsets with a median frequency of 26% Tn cells and 16% Tcm cells, compared to uninfected individuals (median 48% Tn and 26% Tcm). Using total HIV-DNA measures they calculate the contribution of Tn and memory to the total reservoir, being 2% and 98% respectively.
In contrast, when they stimulated sorted subsets with different methods. When stimulated with IL-7 HIV production was multiplied by 100 in the Tn subset, and by 10 in the Tcm, Ttm and Tem subsets, while neither cell proliferation nor cell survival were associated with viral production. These contrasting findings could be explained if Tn harbored the highest percentage of intact (and so replication competent) proviruses. Once again, it could have been interesting calculate the contribution after the distinction between intact and defective proviruses. Using of total HIV-DNA could be misleading in this case.
Josefsson et al. studied chronically infected and untreated individuals. Both naive and memory cells recovered in lymph nodes (LN) had higher integration level than in peripheral blood 46. But while naive in LN and
peripheral blood are a homogeneous population, the memory compartment is not fairly distributed. Due to antigenic presentation (CCR7 and CD27 among others) only Tcm can recirculate like naive cells do. Ttm and Tem are found only in periphery and usually have the highest integration levels. The authors detected identical clones through different subsets both in blood and periphery. The lack of compartmentalization found by phylogenetic analysis, could be an indirect sign of recirculation and of the Tn giving rise to memory cells.
Buzon et al. calculated the contribution of different subsets to the reservoir in 2014 47. They studied chronically infected subjects on ART. Tn had the
lowest integration level, as usual, and the contribution calculated without dividing intact and defective proviruses was 4-9% for Tn 47. Unfortunately,
even if they did a VCOA in memory subsets they did not do it with Tn. The VCOA could have done an indirect indication on the presence/absence of intact proviruses within the Tn.
Soriano-Sarabia et al 48 investigated the presence of replication competent
proviruses among acutely and chronically treated patients, by QVOA. Tn from 11 patients were cultured and in two of six treated during acute phase and in two of five treated during chronic phase, the cultures revealed
replication-competent HIV. They pointed out the fact that the two acute patients had the highest levels of peak of viremia prior to therapy recorded in their cohort, and the two chronic patients had the highest levels of set point viremia prior to ART in the other cohort, suggesting that latent infection of naive cells may be associated with particularly poor immune control of HIV replication.
Baxter et al. gave prove of different response to LRAs among the subsets
49. They stimulated CD4 T cell subsets of untreated and treated chronic
patients with ingenol and bryostatin. With bryostatin they obtained low to none HIVRNA+/Gag+ cells from Tn while a better recovery was obtained with ingenol. Less viral translation competent (population of HIV-RNA+/Gag+ cells as the cells detected contain virus capable of producing HIV mRNA and proteins) among Tn.
In 2016 Zerbato et al. 50 tested in vitro the capacity of Tcm and Tn to be
infected by X4 and R5-tropic viruses, in presence of CCL19. Both subsets were infected with the X4 virus but only Tcm were infected with the R5-tropic virus. When stimulated with different LRAs (anti-CD3/CD28 antibodies, phorbol 12-myristate 13-acetate (PMA) plus PHA and prostratin), both infected Tcm and Tn gave rise to infectious HIV. The authors then, normalized extracellular HIV-RNA production to the total HIV-1 DNA copy number/cell at each time point. Surprisingly their data revealed that Tn yielded as much (or more) HIV-RNA as the Tcm cells. In these experiments
there was no difference in cellular decay due to cytotoxicity, 10 days after infection, between the two subsets.
In 2017 Sara Palmer et al. 7 applied a full-length sequencing technic in CD4
T cell subsets sorted from 6 HIV-infected donors on ART. Doing so they were able to distinguish intact (and so replication competent) from defective proviruses. Of the 531 sequences, 26 (5%) were characterized as genetically intact and potentially replication competent. They observed the order from lowest to highest intact proportion to be Tcm < Ttm < Tn < Tem. Strikingly, they did not find any intact provirus in Tcm even though, as always reported before, they had the highest HIV-DNA integration level. They also calculated the percentage contribution to the reservoir by each subset, counting only the intact proviruses and giving a more realistic picture than previous papers. But there is a big caveat, they could sequence proviruses from only 3 out of 6 subjects due to the scarcity of sample. When they calculate the mean contribution, they exclude 2 of the 3 subjects with Tn sequences available and used the 3 without sequences assigning them a value of 0. The final result is a mean Tn contribution calculated with 4 out of 6 subjects, having 3 of them an arbitrary value of 0 that does not reflect the lack of intact proviruses sequenced but the lack of sample available. If we look at the only patient with both enough sample and the contribution studied, we see that Tn is one of the major contributors.
51 by p24 production, lowest integration level in Tn both in untreated and on
Recently, Zerbato et al showed by viral outgrowth there are similar amounts of HIV in Tn and Tcm even though Tcm have higher levels of integrated HIV
52 which suggest indirectly a higher percentage of intact proviruses found in
Reservoir and CD4 T cell subsets
Most efforts to study the HIV reservoir have focused on memory CD4 T cells because this heterogeneous cellular subset carries the highest levels of HIV DNA in vivo 7,34,37,39,44,45,47,52,53. Moreover, a limited number of CCR5 tropic
HIV virions are responsible for transmission 54 reinforcing the central role of
memory T cells since higher levels of CCR5 are present on memory CD4 T cells compared to naïve CD4 T cells (Tn) 55.
Studies on Tn infection are limited due to the perceived dominant role of memory T cells in HIV persistence. While several studies detected HIV DNA in Tn both in vitro and in vivo 7,34-36,38-45,47,52,53,56, the levels of HIV DNA within
Tn are generally 10-fold less than in memory cells 7,34,39,44,45,47,52,53
suggesting that HIV DNA found in Tn might be due to contaminating memory lymphocytes. Moreover, since Tn are perceived to be more resistant to direct HIV infection in vitro, especially by CCR5 tropic viruses
41, these cells were considered unlikely to play a central role in HIV
pathogenesis. However, HIV often evolves to express CXCR4 tropic envelope suggesting a potential for naïve infection 57. Tn have unique
properties, including longer intermitotic half-life than memory T cells 58 and
resistance to HIV expression after integration 41,49,51,59 and the ability to give
rise to all memory T cell subsets which could lead to distinct hurdles to HIV eradication.
We utilized sorting strategies comparable to prior studies 34,39,48,49,52,53,59 and
intact and defective proviruses. We calculated the absolute levels of intact proviruses in CD4 T cell subsets at 2 and 9 years after ART in two chronically infected individuals. By tracking reservoir composition over time, we provide evidence that infected Tn are a significant reservoir that potentially repopulate the memory reservoir.
Methods
Patients and samples
We utilized samples from two HIV-1 infected individuals whose clinical history and reservoir decay curves were previously described 12. Subjects
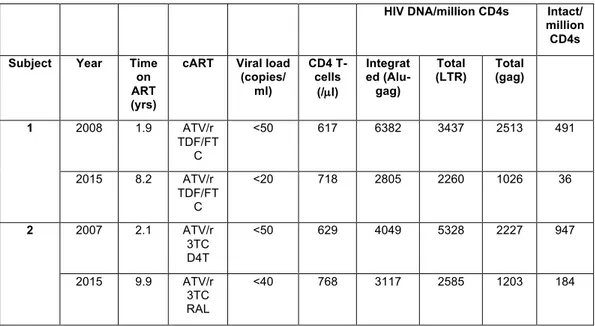
underwent apheresis at the University of Pennsylvania according to protocols #704904, approved by the Institutional Review Board (IRB). Each subject signed an informed written consent to be enrolled in the study. The early time point samples were provided by Dr. Stephen Migueles (National Institute of Health) who follows his institutional protocol with IRB approval. Apheresis samples were collected at two and nine years after initiating ART. Subject 1 had a protracted CD4 T cell decline with only CCR5 tropic proviruses and a nadir of 295 CD4 cells/µL after 21 years of infection. Subject 2 had a more rapid progression with a majority of CXCR4 tropic proviruses and a nadir of 0 CD4 cells/µL after 6 years of infection (see Table S1-2). Both subjects had <20 copies of HIV RNA/mL) at the time of the apheresis.
DNA Isolation and Quantification of HIV DNA
DNA was isolated from PBMCs using the Gentra Puregene Cell Kit (Qiagen). HIV DNA was quantified by total HIV against the LTR (primers LTR F and LTR R, Table 1) or gag regions (primers gag F and gag R, Table 1). Integrated HIV DNA was measured using primers Alu F and gag R, Table 1). First-step PCR reactions were cycled using the Nexus Master Cycler
instrument (ThermoFisher). For total HIV, PCR conditions for the first round were: 95°C for 2 min; then 95°C for 15 s, 64°C for 45 s, 72°C for 1 min for 12 cycles; and then 72°C for 10 min. For Alu-gag measurements the following PCR conditions for the first round were used: 95°C for 2 min; then 95°C for 15 s, 56°C for 45 s, 72°C for 3:30 min for 40 cycles; and then 72°C for 10 min. 15 µl of the first-round PCR reactions were run on the qPCR instrument using the primers LTR F and LTR R for total HIV LTR and Alu-gag reactions and primers Alu-gag F and Alu-gag R for total HIV Alu-gag measurements (Table 1). PCR conditions were: 95°C for 15 s; then 95°C for 10 s, 60°C for 20 s for 40 cycles.
Provirus Amplification and Sequencing
A two-step nested PCR approach was used to reduce non-specific amplification from genomic targets. Primer sets used in both reactions were located within the LTRs and were staggered appropriately to avoid localized LTR amplification as well as LTR-related PCR artifacts while simultaneously capturing nearly the full-length of HIV proviruses (Table 1). We used a long-range and high-fidelity polymerase enzyme for both reactions (Platinum SuperFi PCR Master Mix, ThermoFisher). In the first PCR reaction, PBMC DNA was diluted so that PCR amplification resulted in ≤30% of wells being positive for HIV DNA. The following PCR cycling conditions were used for both rounds: 95°C for 2 min; then 95°C for 15 s, 68°C for 8 min (15 cycles for the first PCR, 40 cycles for the second one); then 72°C for 5 min. Nested
PCR reactions were visualized by gel electrophoresis, and the fraction of reactions containing ≥ 2 bands were excluded from our analysis as these were often found to contain multiple proviruses. PCR amplicons were purified using the DNA Clean & Concentrator kit (Zymogen) and DNA concentration was measured using the Quant-iT dsDNA Broad Range Assay Kit (ThermoFisher). Amplicons were prepared using the Nextera library preparation kit (Illumina) and sequenced on a MiniSeq System using a Mid-output flow cell (Illumina).
Sequence Assembly and Removal of Double Proviruses
Paired reads were trimmed in the program Geneious using the BBDuk plugin, discarding reads from the adaptor, and then merged using Geneious. Again, the reads were trimmed of those with a quality rating under 30, and those under 115 base pairs in length. The reads were then mapped using BBMap to the HXB2 reference sequence, and the reads that aligned to the HIV sequence were extracted. Provirus contigs were made through de novo assembly of the extracted reads. Contigs generated by Spades, Tadpole, and Trinity de novo assemblers were compared. Accuracy of each assembler was evaluated by: 1) its ability to produce a contig matching the length of the region supported by reads when mapped to an HIV reference 2) reads supporting the generated contig. We selected Spades as our default de novo assembler based on these criteria. Reads were de novo assembled using Spades with default settings. When reads gave rise to multiple non-overlapping contigs, the contigs were concatenated into one sequence. The final contig was then mapped back
to HXB2, and annotated with motifs, including splice donor and acceptor sites, and ORFs as described in the Supplementary Methods 2. Finally, in order to determine whether two proviruses had been sequenced together (double proviruses), the extracted reads were aligned to the assembled contig. Double proviruses were identified according to the criteria listed in the Supplementary Methods 1 and discarded from analysis.
Nomenclature
Intact proviruses were defined as those determined to code for nearly complete psi packaging sites with at least 3 stem loops (SL2 has to be intact because it contains D1 60), and 9 complete ORFs for all HIV genes. We
allowed for truncated Nef and Tat genes as commonly identified in infectious strains of HIV 61. Nef was allowed to be truncated up to the extent seen in
NL4-3. We required the presence of Major Donor Site 1 or a GT dinucleotide cryptic donor site located four nucleotides downstream 60 (only found in four
proviruses) and presence of Major Donor Site 4. We also required the presence of splice Acceptor Site A5, A7, either A4a or A4b or A4c as well as an intact Rev-responsive element (RRE) sequence (Supplementary Table 5) 60. We also accepted the sequence GGTAAGT as well as the
canonical donor 1 splice sequence GGTGAGT for the D1 sequence as these sequences binds U1 snRNP equally well 62. Notably this D1 variant
sequence was found in a proviral sequence with no functional ORFs that was present at increasing frequency over time, consistent with clonal expansion.
Deletion Analysis
Provirus consensus sequences were aligned by MAFFT 63 using the
iterative E-INS-i method with a gap penalty opening penalty of 1.8. This facilitates proper alignment of proviruses of different lengths, which is common among proviruses with deletions. Aligned sequences were then exported to an R software environment using the Seqinr Biological Sequence Retrieval and Analysis package. Once in the R software environment, a program removed base pairs within each subject’s proviruses which were insertions relative to the HXB2 HIV sequence. This allowed the alignment of all proviruses to be standardized in length with base pair indices to HXB2. Then, deletions with length more than 100 base pairs were recorded, and a graph was made in R which showed each sequence plotted against the base pair numbers of HXB2, with deletions shown (Fig. 4).
Identification of Hypermutant Sequences
To identify hypermutant HIV sequences, all proviruses for each individual were aligned using MAFFT with the E-INSi algorithm and a 1.8 gap penalty, and an intact HIV sequence was selected as the reference. The aligned proviruses were checked against the reference for hypermutants using the LANL Hypermut 2 program. The provirus with the lowest chance of being a hypermutant as determined by the Hypermut program was selected as the reference, and once again Hypermut 2 was run on the alignment. Proviruses
determined to be hypermutant with p<0.05 were counted as hypermutant ones.
Phylogenies and Identification of Potential Clones
Intact proviral sequences were aligned using MAFFT 63 with the G-INSi
algorithm with a 1.8 gap penalty. A maximum likelihood tree was constructed using PHYML with the general time reversible substitution model, using both SPR and NNI optimization methods for topology, 4 substitution rate categories, and an estimated transition/transversion ratio, proportion of invariable sites, and gamma distribution parameter 64.
As described above, all intact proviruses were aligned in MAFFT using the E-INSi algorithm to find potential clones, defined as proviruses with the same sequence and similar length. We first trimmed the entire 5' end LTR and the 3' end LTR up to the end of nef. This was done to remove any ambiguous nucleotides due to poor assembly at both ends of the proviruses. We then created a phylogeny of the intact proviruses as described above, except those with inversions and large insertions. Proviruses that clustered closely in the phylogeny were then individually aligned with each other and manually checked for identical sequences (with sequence differences highlighted by Geneious).
Proviruses with > 99.99 % sequence identity were considered clones. Identical sequences (clones) were grouped into clonal families. Clones were checked for a second time, this time once again aligning all proviruses with
MAFFT and then among proviruses of a similar length manually identifying proviruses with identical sequences.
Classification of proviral coreceptor usage
Proviral coreceptors were classified by analyzing the V3 region of the HIV envelope protein gp120 using an in-house bioinformatic software with R studio including the Biostrings package. Results were confirmed with the WebPSSM (Post Specific Scoring Matrix) tool 65.
Sorting and purity
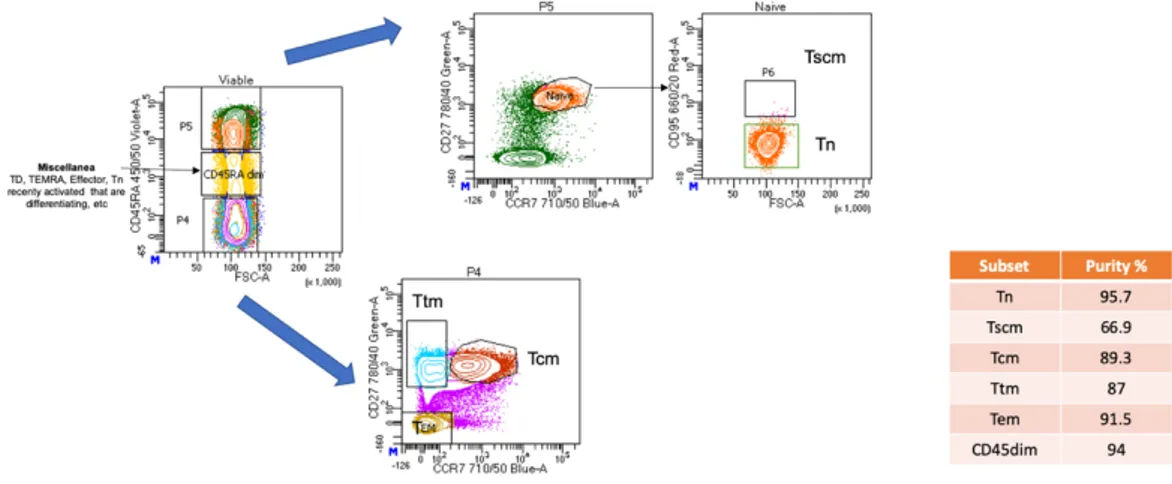
CD3+CD8- T lymphocytes were negatively selected from PBMCs by an immunomagnetic bead-based protocol (Stem Cell Technologies KIT #19052).
T lymphocytes were then sorted by fluorescence activated cell sorting (BD FACS Aria III sorter) into the following subsets: CD3+CD8- Tn (CD45RA+, CCR7+, CD27+), central memory (Tcm) (CD45RA-, CCR7+, CD27+), transitional memory (Ttm) (CD45RA-, CCR7-, CD27+) and effector memory (Tem) (CD45RA-, CCR7-, CD27-) and CD45RA dim cells (Fig.1) using PE-Cy7 anti-CD27 (clone 0323 Invitrogen), BV421 anti-CD45RA (clone 5H9 BD), BB700 anti-CCR7 (clone 3D12 BD) and APC anti-CD95 (clone DX2, BD). An LSRII and FlowJo v10.6 software were utilized to assess purity.
We estimated the percentage of intacts per time point (32 to 118 proviral sequences were available per time point). The contribution of intact proviruses to the reservoir by each subset (Cs) was calculated with the
following formula: !"#$%# '()*+(,-.-/.0 -,1-.# %.22- 𝑥 -,1-.# %.22-/.0 4567 = 𝐶𝑠
The percent contribution of each subset
is (4<"74456=>+?74<%?74<#?74<.?)4- 𝑥 100
The absolute number of intact proviruses is calculated as: 𝐼𝑛𝑡𝑎𝑐𝑡 𝑝𝑟𝑜𝑣𝑖𝑟𝑢𝑠𝑒𝑠 =
𝑡𝑜𝑡𝑎𝑙 𝑅𝑈5 𝐷𝑁𝐴 𝑝𝑒𝑟 𝑠𝑢𝑏𝑠𝑒𝑡 𝑐𝑒𝑙𝑙𝑠 𝑥 % 𝑖𝑛𝑡𝑎𝑐𝑡 𝑖𝑛 𝑡ℎ𝑎𝑡 𝑠𝑢𝑏𝑠𝑒𝑡.
Statistical Analysis and Graphing
Statistical processes were performed using R®, Pass and Microsoft
Results
DNA quantification of CD4 T subsets
We monitored HIV DNA in the major cellular subsets after 2 and 9 years of ART in two individuals in whom we had previously measured reservoir decay 12 (Table 3). Both subjects had undetectable plasma viral load at the
time of the apheresis. We sorted CD3+CD8- T cells by flow cytometry into Tn, Tcm, Ttm, Tem and CD45dim (Fig. 1 and Methods). The percentage of CD3CD4 T cells for each subset is reported in Table 1. Total HIV-DNA per million cells was measured in each subset by RU5 qPCR 12 (see Table 1)
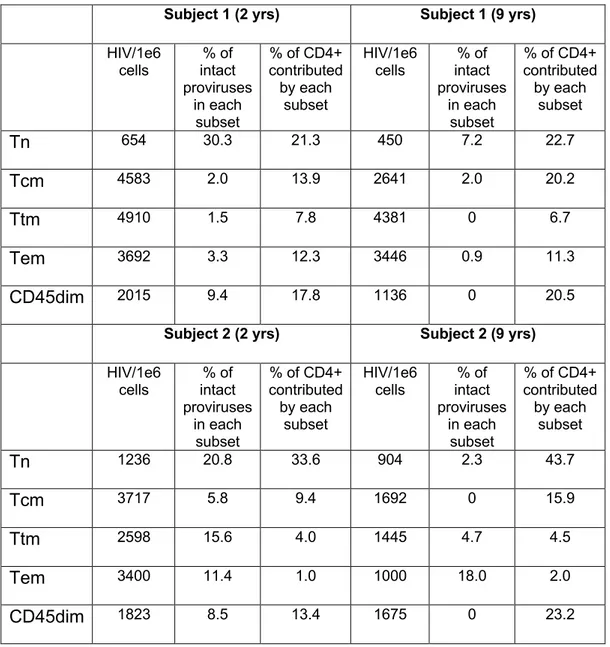
and likely represents integration level since the subjects were suppressed for greater than two years on ART. The levels of HIV DNA declined in Tcm and to a lesser extent in Tn between two and nine years of ART in Subject 1 while the HIV DNA declined in all subsets in Subject 2. Consistent with the literature 7,34,39,44,45,47,52,53, the HIV DNA levels were ~10-fold lower in Tn
compared to the combined memory population (Table 1).
Tn and Tem harbor distinct populations of HIV provirus
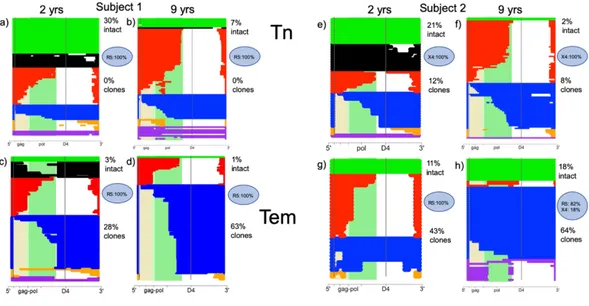
To genetically characterize the HIV reservoir in 5 cellular subsets, we amplified and sequenced 890 full length proviruses from subject 1 and 514 proviruses from subject 2 (Figure 1). We analyzed the sequences obtained by aligning the de novo assembled sequences to HXB2. In Figure 2, each horizontal bar represents one assembled provirus. The majority of the proviruses were defective (95%) and most had large deletions consistent
with recent reports 6-8,12. Proviruses were grouped by their size and the
location of their deletions. These same categories could be defined by the presence and absence of D1 and D4 splice sites: intact (green, D1+D4+), nearly intact (black, D1+D4+), 3’ deleted (red, D1+D4-), 5’ deleted (blue, D1-D4+), massively deleted (yellow, D1-D4-), and hypermutant (purple, D1+/-D4+/-) as described 12.
Consistent with Hiener 7, Tem subset was dominated by distinct clonal
populations at both time points. Curiously, there was a relative increase in proviral clones with 5’ deletions (D1-D4+ proviruses), suggesting a selective advantage for this category of provirus. In both subjects, there was a decline in the absolute level of all D1+ proviruses over time. In Subject 2, there was a relative increase in D1+D4+ intact proviruses, but they were all clones at the second time point. The composition of the proviral DNA was strikingly different in the Tn subset compared to the Tem subsets. Surprisingly, a large fraction of the proviruses in the Tn compartment were intact or nearly intact. These (D1+D4+) proviruses declined over time, while the other defective proviruses within the Tn compartment appeared relatively stable. To summarize, within the Tn subset the intact and nearly intact (D1+D4+) proviruses declined more rapidly relative to other proviral categories while within the Tem subsets, the majority of proviruses had 5’ deletions (D1-D4+) were clonal and exhibited a high turnover rate. Thus, the genetic composition and changes over time in Tn and Tem reservoir were distinct (see also table 5).
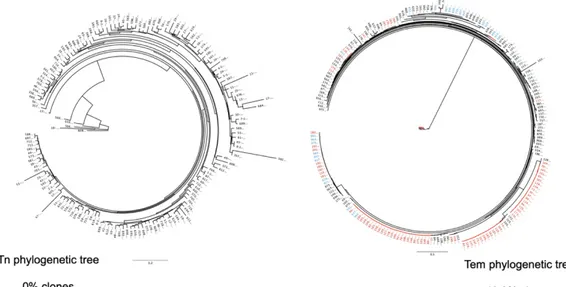
Phylogenetic analysis of proviruses reveals more unique sequences in Tn compared to Tem
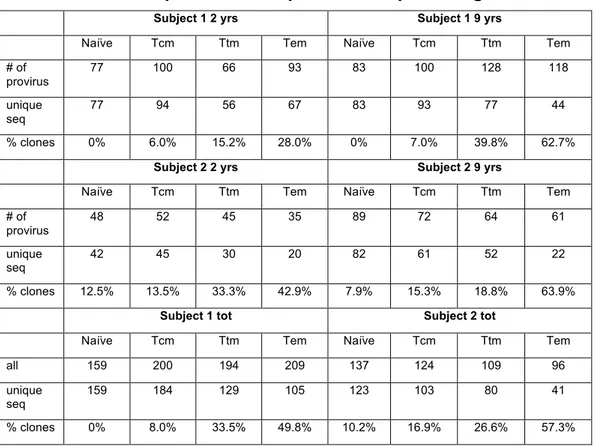
We assembled phylogenetic trees to characterize the extent of clonal proviruses in Tn and Tem (Fig. 3 and Fig. 7). The effect of clonal expansion was restricted by counting clones once, revealing 159 unique sequences out of 159 total sequences for Tn and 105 unique sequences out of a total of 209 for Tem in Subject 1. By this analysis, 50% of proviral sequences in Tem appeared to be clones while no clones were identified in Tn (Fig. 3). Subject 2 followed the same pattern, with 10% of proviruses within Tn and 57% of proviruses in Tem appearing to be clones (Fig. 7). Tem proviruses were found to be significantly more clonal than Tn at both time points in each subject by a two-sample chi-squared test (p<0.001). Moreover, the number of clones were significantly greater at the second time point in Tem (p<0.05), but not in Tn. Overall, Tn and Tem represent two ends of a continuum with a much higher frequency of clonal proviruses as subsets progress from Tn to Tem (see also table 4).
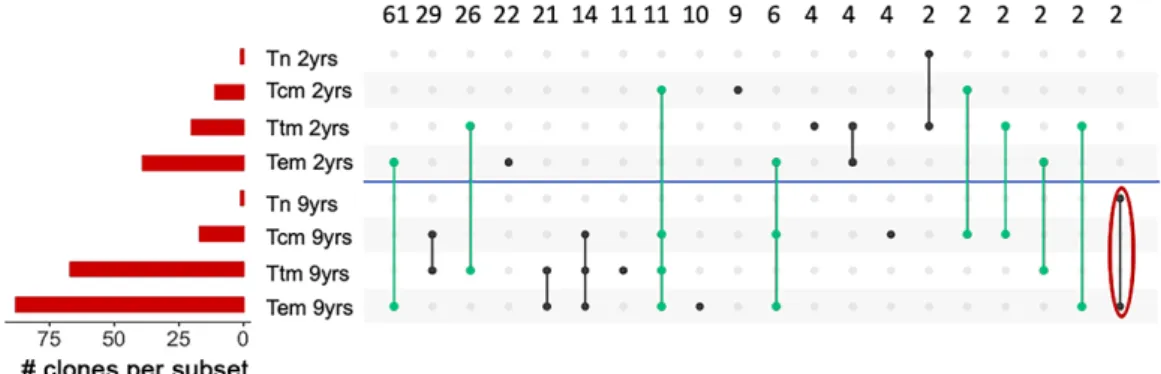
UpSet plot identifies relationships between cellular subset
We studied the relationship between cellular subsets by identifying proviral clones in different cellular subsets. Using the phylogenetic tree of Subject 1 (Fig. 3), 244 proviral clones were identified. These clones were used to create a modified UpSet plot (Fig. 4) which revealed that different subsets often harbored the same clone suggesting the differentiation pathway of T cells from naïve to effector memory lymphocytes could play a role in HIV
persistence. In Fig. 4, clones were grouped based on two criteria: the cellular subset and the time point when the clone was identified. The number of clones in each subset at each time point is shown (red horizontal bar). As an example, in the first column 63 clones were only detected in Tem (9yrs), while in the fourth column, 14 clones were detected at both time points in the Tem subset. Tn at 2 and 9 yrs have only one clone, while the second horizontal bar shows that Tcm have 11 clones at 2yrs and X clones at 9 yrs after ART.
Overall, the number of clones detected increased from 2 years to 9 years after ART consistent with prior reports 12,66, but did not increase with the Tn
subset. A large number of clones (55 of 244) persisted and were detected at both timepoints 7 years apart. Remarkably, at each time point the number of clones progressed from Tn to Tem following the expected pathway of cellular differentiation. Moreover, indirect evidence of the Tn and/or Tcm reservoir repopulating in the Tem reservoir is provided by the analysis of the coreceptors. In Subject 2 at the first timepoint 100% of proviruses in Tem were R5 tropic while in Tn 100% were X4 tropic (figure 2, e and g). At the second timepoint, 18% of proviruses in Tem were X4 tropic (figure 2, h). Thus, it seems likely that X4 tropic proviruses detected at the second timepoint in Tem arose from differentiation of infected Tn and/or Tcm overtime. Alternately, it remains possible that a minor population within the Tem expanded extensively over the 7 years.
Notably, only 2 of the 244 identified clones were intact proviruses (red circle), suggesting that selection against intact proviruses is stronger than
against defective ones due to either direct cytotoxicity or immune pressure (see also Subject 2 figure 8).
In summary, we were able to track clones through cellular differentiation. Our analysis support that Tn differentiate into Tcm then Ttm and Tem consistent with prior studies, showing Tn divide less frequently than Tcm which divide less than Ttm and Tem 58,67.
Naïve CD4 T contribute significantly to the reservoir despite lower levels of HIV DNA
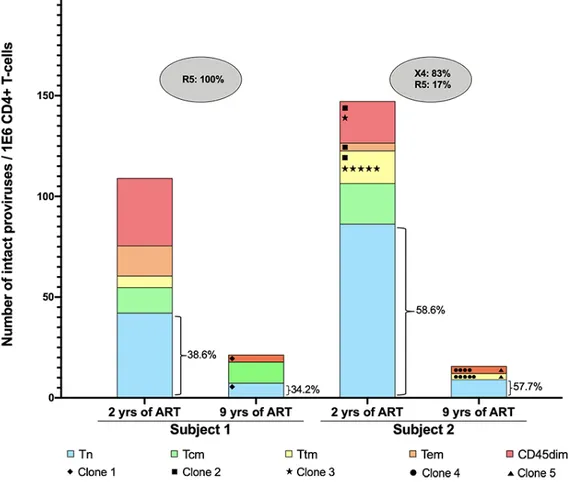
We wanted to determine the number of intact proviruses contributed by each major T cell subset in blood. To do this, we multiplied the total HIV DNA per subset (Table 1) by the fraction of intact per subset Figure 2). We then estimated the contribution of intacts per subset by dividing the number of intacts per subset by the total number of intacts in all subsets (Methods and Table 1). In both subjects, Tn were major contributors. Moreover, the relative contribution of Tn is stable overtime despite reservoir decay (Fig. 5). In Subject 1, Tn contained 39 and 34% of the intact reservoir at the first and second timepoint, respectively. We only detected CCR5 tropic virus in Subject 1 even in Tn. Tn contribute significantly to the HIV reservoir.
Discussion
We embarked on a project to study the character of HIV proviruses that were present in different cellular subsets. In our study with only two individuals we found that the genetic proviral make-up had clear distinct characteristics depending on the phenotype of the infected cell. While every subset had a distinct reservoir composition and showed distinct genetic changes over time (Figure 2 and 6), we focused our comparison on Tn, with the longest intermitotic life, and Tem, with the shortest intermitotic half-life, as they represented two ends of a continuum. Tn have the largest number of unique sequences and the highest percentage of intact proviruses. Tem had the second highest percentage of intact sequences, but also had the most clonal sequences.
Our evidence that Tn may give rise to other subsets include that identical sequences are shared across subsets and the numbers of clones increase as cells become more differentiated (Figure 4), as well increasing frequency of CXCR4 tropic proviruses in Tem in Subject 2 likely deriving from Tn (figure 2). Each clonal population likely arose from a single progenitor infection event. Therefore, the number of unique infection events resulting in a persistent intact provirus in Tem is very small, as most of the intact proviruses in Tem appear to be expanded clones. By contrast, the intact reservoir cells in the Tn group appear to have fewer clones. Thus, a larger fraction of the intact proviruses detected within the Tn may represent
separate successful infection events. From this, we infer that infection events leading to intact persistent reservoir cells are likely more common in Tn cells than previously recognized. Indeed, our evidence that clonal progeny arose from less differentiated subsets suggests, that many of the expanded intact clones in the memory subgroups especially after several years on ART started as Tn (or Tcm) infections.
Tn may be relatively prone to persistence. Evidence is accumulating
that Tn express less RNA and protein in vitro and in vivo 49,51,59,68. Moreover,
Tn have the longest half-life 58,67. These features of Tn may result in less
selection against infected Tn in comparison with memory T cell subsets. Whether Tn reservoir cells will be more resistant to latency reversal will require more studies as only a few studies on naïve infection exist 41 and
fewer still addressed this question 50,69.
The provirus may have a role in Tem expansion. Notably, D1-D4+
proviruses in Tem expanded relative to all proviral categories and were largely clonal. This is remarkable since massively deleted proviruses (D1-D4-) should be enriched over other categories if proviral clonal expansion were only driven by antigen or cytokines (mitotic expansion). Since D1-D4- do not encode HIV proteins they should experience minimal negative selection, yet they were not the most persistent type of provirus. On the other hand, a fraction of D1-D4+ proviruses should make splice products containing the first exon of Tat: a sizeable fraction of splicing events
originating from D4 join to host downstream acceptors 12. Tat expressed
from the first exon of Tat is capable of most Tat functions 61. We speculate
that the enrichment of D1-D4+ proviruses can be explained by either Tat fusion proteins to downstream oncogenes or increased Tat splicing resulting in enhanced expression of downstream oncogenes.
HIV DNA levels in subsets obscures important selection pressures.
Our work consistent with others 7,34,39,44,45,47,52,53 shows that total HIV DNA
measures provide a misleading picture of the reservoir since Tn have the lowest integration levels 7,34,39,44,45,47. To estimate the real contribution by
each subset it is essential to distinguish intact and defective proviruses. Recently, Zerbato et al showed by viral outgrowth there are similar amounts of HIV in Tn and Tcm even though Tcm have higher levels of integrated HIV
52 which suggest indirectly a higher percentage of intact proviruses found in
Tn.
Sorted TN while heterogenous revealed obvious differences in reservoir character and selection from other cellular subsets
One could argue that we should further divide Tn into several subsets based on additional markers, such as CD31, CD95, CCR5, etc. However, the clear and statistically significant phenotypic separation we observe supports the concept that our sorting approach identified meaningful functional separation. Notably, the frequency of CD95+ cells were diminishingly low (0.1-2%). We are aware that among the CD45RA+CCR7+CD27+ cells there
is a population that are not truly naïve. Nonetheless, this population shares characteristic traits including their capacity for recirculation (CCR7+), lack of recent activation (as evident by CD45RA) and a longer half-life compared to memory T cells 70 in comparison to the memory T cells. Historically in the
HIV literature, “naïve T CD4 cells” have been defined using these markers
34,39,48,49,52,53,59.
Limitations: A limitation of our study is the small number of individuals
studied. We made the deliberate decision to sequence many proviruses per cellular subset rather than sequence a few proviruses in many subjects. In this manner, we complement other studies that sorted cellular subsets in larger number of HIV infected individuals, but with fewer sequences per patient and fewer sequences per cellular subset 7.
In conclusion, our work suggests that the contribution of Tn to reservoir persistence should be reevaluated. In two HIV infected individuals representing two extremes of HIV infection (completely R5 and largely X4 tropic infection), we found Tn infection was an important contributor to the replication competent reservoir at two and nine years after initiating ART. We speculate that Tn resist immune clearance and viral cytotoxicity due to their lower viral expression supported by 49,51,59,68. Thus, the Tn reservoir
may be a formidable hurdle to HIV cure due to lower selection pressure. Moreover, infected Tn can give rise to infected memory T cells through
differentiation and thereby continuously repopulate the infected memory subset, obscuring the true decay rate of infected memory cells.
Figures and tables
Figure 1. Sorting strategy. PBMCs from two HIV+ donors on cART at 2 timepoints.
CD4 T lymphocytes were negatively selected by immunomagnetic beads. Tn were enriched by staining and sorting for CD45RA+, CCR7+, CD27+. Tcm were CD45RA-, CCR7+, CD27+, Ttm were CD45RA-, CCR7-, CD27+, while Tem were CD45RA-, CCR7-, CD27-. Finally, CD45dim cells were also collected in an effort to sample almost all CD4 T cells.
Abbreviations: Tn, Naïve CD4 T cells; Tcm, Central memory CD4 cells; Ttm, Transitional memory CD4 T cells; Tem, Effector memory CD4 T cells; Tscm, Stem-cell like memory T cells.
Figure 2. Deletion maps
Intact and defective proviruses from Tn and Tem were aligned to HXB2 at an early and late time point after initiating cART. Green proviruses are intact (D1+, D4+), black proviruses are nearly intact (D1+D4+), red proviruses are 3’ deleted (D1+D4−), blue proviruses are 5’ deleted (D1−D4+), and yellow proviruses are massively deleted (D1−D4-). Hypermutated proviruses are represented in purple. The shaded beige, light green, and dark green regions correspond to the gag, gag-pol, and pol regions of HXB2, respectively. The percentage of intact proviruses, of coreceptor used by the intact proviruses and of the clones are reported on the right side of each plot.
Abbreviations: Tn, Naïve CD4 T cells; Tem, Effector memory CD4 T cells; yrs, years; R5, CCR5-tropic virus; X4, CXCR4-tropic virus.
Figure 3. Phylogenetic trees of the proviruses harbored in Tn and Tem
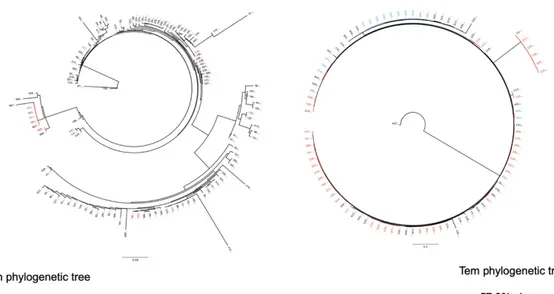
Phylogenetic trees of the proviruses in Tn (on the left) and Tem (on the right) from Subject 1. The unique sequences are in black, while the clones are in light blue if they have been isolated at the first timepoint and red at the second timepoint. In Tn 159 out of 159 sequences were apparently unique, while in Tem only 105 out of 209 appeared to be unique.
Figure 4. Clones UpSet plot (Subject 1)
Clones were identified in each cellular subset at 2 timepoints. We identified 244 clones that were organized by which subsets they were contained in. The red horizontal bars show how many clones were found in each subset. A blue line separates the two timepoints. For those clones that could be detected in multiple subsets a solid line was used to connect the subsets. Black lines represent clones detected at only one time point while green lines represent clones present at two timepoints. The red circle indicates the intact clones.
Abbreviations: Tn, Naïve CD4 T cells; Tcm, Central memory CD4 T cells; Ttm, Transitional memory CD4 T cells; Tem, Effector memory CD4 T cells; yrs, years post treatment.
Figure 5. Tn contribution to HIV reservoir
Contribution of intact proviruses by each subset. The number of intact proviruses per million CD4 T cells is labelled on the y axis. The absolute number of clones within each subset at both time points is shown with unique identifiers. The percentage of Tn to the reservoir is provided.
Abbreviations: Tn, Naïve CD4 T cells; Tem, Effector memory CD4 T cells; yrs, years; R5, CCR5-tropic virus; X4, CXCR4-tropic virus.
Subject 1 (2 yrs) Subject 1 (9 yrs) HIV/1e6 cells intact % of proviruses in each subset % of CD4+ contributed by each subset HIV/1e6 cells intact % of proviruses in each subset % of CD4+ contributed by each subset Tn 654 30.3 21.3 450 7.2 22.7 Tcm 4583 2.0 13.9 2641 2.0 20.2 Ttm 4910 1.5 7.8 4381 0 6.7 Tem 3692 3.3 12.3 3446 0.9 11.3 CD45dim 2015 9.4 17.8 1136 0 20.5
Subject 2 (2 yrs) Subject 2 (9 yrs)
HIV/1e6 cells intact % of proviruses in each subset % of CD4+ contributed by each subset HIV/1e6 cells intact % of proviruses in each subset % of CD4+ contributed by each subset Tn 1236 20.8 33.6 904 2.3 43.7 Tcm 3717 5.8 9.4 1692 0 15.9 Ttm 2598 15.6 4.0 1445 4.7 4.5 Tem 3400 11.4 1.0 1000 18.0 2.0 CD45dim 1823 8.5 13.4 1675 0 23.2
Table 1. Integration level and percentage of intact proviruses in each subset and timepoint
Abbreviations: Tn, Naïve CD4 T cells; Tcm, Central memory CD4 cells; Ttm, Transitional memory CD4 Tcells; Tem, Effector memory CD4 T cells; Tscm, Stem-cell like memory T cells; yrs, years post treatment.
Table 2. Clinical characteristics of the subjects enrolled in the study
Subject Age* Sex Year of
infection CD4 T-cell nadir (cells/µl, year) Viral load zenith (copies/ml, year) Co-receptor 1 47 M 1984 295 (1998) 114,422 (1998) CCR5 2 36 M 1993 0 (1999) 225,000 (2001) CXCR4/CCR5
*Age at the time of first apheresis collection Abbreviations: M, man.
Table 3. Viro-immunological parameters, including HIV DNA at two time points after cART initiation in the subjects enrolled in the study.
HIV DNA/million CD4s Intact/ million CD4s Subject Year Time
on ART (yrs)
cART Viral load (copies/ ml) CD4 T-cells (/µl) Integrat ed (Alu-gag) Total (LTR) Total (gag) 1 2008 1.9 ATV/r TDF/FT C <50 617 6382 3437 2513 491 2015 8.2 ATV/r TDF/FT C <20 718 2805 2260 1026 36 2 2007 2.1 ATV/r 3TC D4T <50 629 4049 5328 2227 947 2015 9.9 ATV/r 3TC RAL <40 768 3117 2585 1203 184
Abbreviations: ABC, abacavir; cART, combined antiretroviral therapy; ATV, atazanavir; D4T, stavudine; r, ritonavir; RAL, raltegravir; TDF/FTC, tenofovir/emtricitabine; 3TC, lamivudine.
Table 4. Number of proviruses sequenced and percentage of clones
Subject 1 2 yrs Subject 1 9 yrs
Naïve Tcm Ttm Tem Naïve Tcm Ttm Tem
# of provirus 77 100 66 93 83 100 128 118 unique seq 77 94 56 67 83 93 77 44 % clones 0% 6.0% 15.2% 28.0% 0% 7.0% 39.8% 62.7%
Subject 2 2 yrs Subject 2 9 yrs
Naïve Tcm Ttm Tem Naïve Tcm Ttm Tem
# of provirus 48 52 45 35 89 72 64 61 unique seq 42 45 30 20 82 61 52 22 % clones 12.5% 13.5% 33.3% 42.9% 7.9% 15.3% 18.8% 63.9%
Subject 1 tot Subject 2 tot
Naïve Tcm Ttm Tem Naïve Tcm Ttm Tem
all 159 200 194 209 137 124 109 96
unique
seq 159 184 129 105 123 103 80 41
% clones 0% 8.0% 33.5% 49.8% 10.2% 16.9% 26.6% 57.3%
Abbreviations: Tn, Naïve T CD4 T cells; Tcm, Central memory T CD4 cells; Ttm, Transitional memory T CD4 cells; Tem, Effector memory T CD4 cells; yrs, years post treatment; seq, sequences.
Table 5. Number of proviruses sequenced divided per categories Subject 1 Intacts D1+D4+ D1+D4- D1-D4+ D1-D4- Hypermutants Tn 2yrs 23 (30%) 9 (12%) 24 (32%) 10 (13%) 7 (9%) 3 (4%) Tcm 2yrs 2 (2%) 1 1%) 61 (61%) 15 (15%) 12 (12%) 9 (9%) Ttm 2yrs 1 (2%) 1 (2%) 39 (63%) 11 (18%) 4 (6%) 6 (10%) Tem 2yrs 3 (3%) 12 (13%) 28 (31%) 39 (43%) 6 (7%) 3 (3%) Tn 9yrs 6 (7%) 2 (2%) 45 (54%) 17 (20%) 5 (6%) 8 (10%) Tcm 9yrs 2 (2%) 0 (0%) 48 (53%) 28 (31%) 5 (5%) 8 (9%) Ttm 9yrs 0 (0%) 5 (4%) 43 (34%) 60 (47%) 17 (13%) 3 (2%) Tem 9yrs 1 (1%) 2 (2%) 26 (22%) 83 (70%) 6 (5%) 0 (0%) Subject 2 Intacts D1+D4+ D1+D4- D1-D4+ D1-D4- Hypermutants Tn 2yrs 10 (21%) 11 (23%) 9 (19%) 14 (29%) 3 (6%) 1 (2%) Tcm 2yrs 3 (6%) 0 (0%) 22 (42%) 13 (25%) 8 (15%) 6 (12%) Ttm 2yrs 7 (16%) 0 (0%) 14 (31%) 8 (18%) 12 (27%) 4 (9%) Tem 2yrs 4 (11%) 0 (0%) 19 (54%) 10 (29%) 2 (6%) 0 (0%) Tn 9yrs 2 (2%) 0 (0%) 46 (52%) 34 (38%) 6 (7%) 1 (1%) Tcm 9yrs 0 (0%) 0 (0%) 31 (43%) 17 (24%) 13 (18%) 11 (15%) Ttm 9yrs 3 (5%) 1 (2%) 15 (23%) 31 (48%) 6 (9%) 8 (13%) Tem 9yrs 11 (18%) 0 (0%) 9 (15%) 37 (61%) 0 (0%) 4 (7%)
Abbreviations: Tn, Naïve T CD4 T cells; Tcm, Central memory T CD4 cells; Ttm, Transitional memory T CD4 cells; Tem, Effector memory T CD4 cells; yrs, years post treatment.
Figure 6. Deletion maps (Tcm and Ttm)
Intact and defective proviruses from Tcm and Ttm were aligned to HXB2 at an early and late time points. Green proviruses are intact D1+D4+, black proviruses are nearly intact D1+D4+, red proviruses are 3’ deleted, D1+D4−, blue proviruses are 5’ deleted, D1−D4+, and yellow proviruses are massively deleted, D1−D4-. Hypermutated proviruses are represented in purple. The shaded beige, light green, and dark green regions correspond to the gag, gag-pol, and pol regions of HXB2, respectively. The percentage of intact proviruses is reported on the up-right corner. The percentage of coreceptor used by the intact proviruses are listed on the side of each deletion map. In the central part of the figure the percentage of clones are listed.
Abbreviations: Tcm, central memoryCD4 T cells; Ttm, Transitional memory CD4 T cells; yrs, years; R5, CCR5-tropic virus; X4, CXCR4-tropic virus.
Figure 7. Phylogenetic trees of the proviruses harbored in Tn and Tem (Subject 2)
Phylogenetic trees of the proviruses in Tn (on the left) and Tem (on the right) from Subject 2. The unique sequences are in black, while the clones are in light blue if they have been isolated at the first timepoint and red at the second timepoint. In Tn 123 out of 137 sequences were apparently unique, while in Tem only 41 out of 96 appeared to be unique.
Figure 8. Clones UpSet plots (Subject 2)
Clones were identified in each cellular subset at 2 timepoints. We identified 191 clones that were organized by which subsets they were contained in. 26 out of 191 of the clones were intact proviruses.
The red horizontal bars show how many clones were found in each subset. A blue line separates the two timepoints. For those clones that could be detected in multiple subsets a solid line was used to connect the subsets. Black lines represent clones detected at only one time point while green lines represent clones present at two timepoints. The red numbers indicate the intact clones in each column.
Abbreviations: Tn, Naïve T CD4 T cells; Tcm, Central memory T CD4 cells; Ttm, Transitional memory T CD4 cells; Tem, Effector memory T CD4 cells; yrs, years post treatment.
References
1. Barré-Sinoussi F, Ross AL, Delfraissy J-F. Past, present and future: 30 years of HIV research. Nat Rev Micro. 2013;11(12):877-883.
doi:10.1038/nrmicro3132.
2. Siliciano JD, Kajdas J, Finzi D, et al. Long-term follow-up studies confirm the stability of the latent reservoir for HIV-1 in resting CD4+ T cells.
Nature Medicine. 2003;9(6):727-728. doi:10.1038/nm880.
3. Finzi D, Blankson J, Siliciano JD, et al. Latent infection of CD4+ T cells provides a mechanism for lifelong persistence of HIV-1, even in patients on effective combination therapy. Nature Medicine. 1999;5(5):512-517. doi:10.1038/8394.
4. Eriksson S, Graf EH, Dahl V, et al. Comparative Analysis of Measures of Viral Reservoirs in HIV-1 Eradication Studies. Douek DC, ed. PLoS
Pathog. 2013;9(2):e1003174–17. doi:10.1371/journal.ppat.1003174.
5. Besson GJ, Lalama CM, Bosch RJ, et al. HIV-1 DNA Decay Dynamics in Blood During More Than a Decade of Suppressive Antiretroviral Therapy.
Clinical Infectious Diseases. 2014;59(9):1312-1321.
6. Bruner KM, Murray AJ, Pollack RA, et al. Defective proviruses rapidly accumulate during acute HIV-1 infection. Nature Medicine.
2016;22(9):1043-1049. doi:10.1038/nm.4156.
7. Hiener B, Horsburgh BA, Eden J-S, et al. Identification of Genetically Intact HIV-1 Proviruses in Specific CD4+ T Cells from Effectively Treated
Participants. Cell Rep. 2017;21(3):813-822. doi:10.1016/j.celrep.2017.09.081.
8. Ho Y-C, Shan L, Hosmane NN, et al. Replication-competent noninduced proviruses in the latent reservoir increase barrier to HIV-1 cure. Cell. 2013;155(3):540-551. doi:10.1016/j.cell.2013.09.020.
9. Imamichi H, Dewar RL, Adelsberger JW, et al. Defective HIV-1 proviruses produce novel protein-coding RNA species in HIV-infected patients on combination antiretroviral therapy. Proceedings of the National Academy
of Sciences. 2016;113(31):8783-8788. doi:10.1073/pnas.1609057113.
10. Lee GQ, Orlova-Fink N, Einkauf K, et al. Clonal expansion of genome-intact HIV-1 in functionally polarized Th1 CD4+ T cells. J Clin Invest. 2017;127(7):2689-2696. doi:10.1172/JCI93289.
11. Pollack RA, Jones RB, Pertea M, et al. Defective HIV-1 Proviruses Are Expressed and Can Be Recognized by Cytotoxic T Lymphocytes, which Shape the Proviral Landscape. Cell Host Microbe. 2017;21(4):494-506.e494. doi:10.1016/j.chom.2017.03.008.
12. Pinzone MR, VanBelzen DJ, Weissman S, et al. Longitudinal HIV
sequencing reveals reservoir expression leading to decay which is obscured by clonal expansion. 2019;10(1):728. doi:10.1038/s41467-019-08431-7.
13. Zhang N, Bevan MJ. CD8(+) T cells: foot soldiers of the immune system.
Immunity. 2011;35(2):161-168. doi:10.1016/j.immuni.2011.07.010.
14. Hammarlund E, Lewis MW, Hansen SG, et al. Duration of antiviral immunity after smallpox vaccination. Nature Medicine. 2003;9(9):1131-1137. doi:10.1038/nm917.
15. Sanders ME, Makgoba MW, Shaw S. Human naive and memory T cells: reinterpretation of helper-inducer and suppressor-inducer subsets. Immunol
Today. 1988;9(7-8):195-199. doi:10.1016/0167-5699(88)91212-1.
16. Cossarizza A, Ortolani C, Paganelli R, et al. CD45 isoforms expression on CD4+ and CD8+ T cells throughout life, from newborns to centenarians: implications for T cell memory. Mech Ageing Dev. 1996;86(3):173-195. doi:10.1016/0047-6374(95)01691-0.
17. Yamada A, Kaneyuki T, Hara A, Rothstein DM, Yokoyama MM. CD45 isoform expression on human neonatal T cells: expression and turnover of CD45 isoforms on neonatal versus adult T cells after activation. Cell
Immunol. 1992;142(1):114-124. doi:10.1016/0008-8749(92)90273-r.
18. Picker LJ, Treer JR, Ferguson-Darnell B, Collins PA, Buck D, Terstappen LW. Control of lymphocyte recirculation in man. I. Differential regulation
of the peripheral lymph node homing receptor L-selectin on T cells during the virgin to memory cell transition. JI. 1993;150(3):1105-1121.
19. Macallan DC, Wallace D, Zhang Y, et al. Rapid turnover of effector-memory CD4(+) T cells in healthy humans. J Exp Med. 2004;200(2):255-260. doi:10.1084/jem.20040341.
20. Sallusto F, Lenig D, Forster R, Lipp M, Lanzavecchia A. Two subsets of memory T lymphocytes with distinct homing potentials and effector functions. Nature. 1999;401(6754):708-712. doi:10.1038/44385.
21. De Rosa SC, Herzenberg LA, Roederer M. 11-color, 13-parameter flow cytometry: identification of human naive T cells by phenotype, function, and T-cell receptor diversity. Nature Medicine. 2001;7(2):245-248. doi:10.1038/84701.
22. Schnittman SM, LANE HC, GREENHOUSE J, JUSTEMENT JS,
BASELER M, Fauci AS. Preferential Infection of Cd4+ Memory T-Cells by Human-Immunodeficiency-Virus Type-1 - Evidence for a Role in the Selective T-Cell Functional Defects Observed in Infected Individuals.
Proceedings of the National Academy of Sciences. 1990;87(16):6058-6062.
doi:10.1073/pnas.87.16.6058.
23. Cayota A, VUILLIER F, SCOTTALGARA D, DIGHIERO G. Preferential Replication of Hiv-1 in Memory Cd4+ Subpopulation. The Lancet.