A A’
1. Geological Map of Mts. Sibillini Area
2. Structural Map of Mt. Vettore - Mt. Bove Fault System
6. Coseismic Surface Parameters
Displacement Distribution Map
Mt. Vettore Mt. Bove Fault System (length: 30 km):
7. Comparison with Global Data
LEGEND
- Stratigraphy:
- Tectonics:
- Other:
LEGEND
8. Comparison of Geologic, Topographic and Coseismic Displacement
h)
(a) Along-strike distribution of the net coseismic displacement (D)
measured after the October 30, M 6.5 shock (cumulative D of the August
24 and October 26 and 30 earthquakes; modified from Brozzetti et al.,
2019). Each fault segment, represented by lines of different colour, shows
a peak of displacement. The Vettoretto - Redentore segment has a very
localized high displacement zone.
(b) Along-strike distribution of the cumulative throw (black line) and
opening (horizontal aperture measured perpendicular to rupture strike; red
lines). The coseismic parameters are listed in the following table. AD
integral is the average D obtained by integrating the D distribution over
the entire length of the surface rupture. AD arithmetic is the arithmetic
mean of all the measured D values.
Coseismic parameters of the 2016 earthquakes compared with empirical relationships MD vs Mw (a), AD vs Mw (b), SRL vs Mw (c), AD vs SRL (d) and MD vs SRL (e) proposed in the literature for global normal faulting earthquakes. Key to abbreviations:
W&C94 = Wells and Coppersmith (1994); Wes 08 = Wesnousky (2008); P&C04 = Pavlides and Caputo (2004); G08 = Galli et al. (2008).
The relations that best fit the 2016 data are those between SRL and Mw. Note that both integral and arithmetic AD are lower than the expected values, while MD is higher than the expected values. Low values of AD are likely caused by attenuation of the coseismic
displacement toward the surface, due to the high segmentation of the fault system. High values of MD are possibly due to localized tectonic phenomena (e.g., back-tilting, see Frame 8) caused by volumetric accommodation of fault irregularities at shallow depths.
f) 2016 cumulative displacement profile, normalized by MD, compared with the envelope of normalized displacement profiles (light blue area) obtained from a set of global normal faulting earthquakes (dashed lines) surface ruptures (from Wesnousky, 2008). Note that
the 2016 profile is at the lower edge of the global data, due to the anomalously high MD.
g) 2016 cumulative displacement profile, normalized by AD (integral), compared with the envelope of normalized displacement profiles (light blue area) obtained from a set of global normal faulting earthquakes (dashed lines) surface ruptures (from Wesnousky, 2008).
Note that the 2016 profile is more consistent with global data compared to the D/MD profile.
h) Mt. Vettore – Mt. Bove D/MD values in comparison with global data obtained from compilations of normal faulting surface ruptures. ADsumm. is the integral mean of the displacement distribution obtained by summing the contribution of all the synthetic and
D D’
Fault
Normal Fault
Jurassic Fault
Thrust
Survey Areas Boundary
Cupi Ussita
Mt. Bove-Mt.Porche
Section Trace (this work)
Section Trace
(Brozzetti et al, 2019)
Colluvial and Slope Deposits: Slope, Landslide and Alluvial deposits
(Holocene)
Fluvio - Lacustrine Deposits (Middle/Upper Pleistocene - Holocene)
Laga: Laga Fm., Schlier Fm., Marne con Cerrogna Fm., Bisciaro Fm.
(Aquitanian - Messinian)
Scaglia: Scaglia Cinerea Fm., Scaglia Variegata Fm., Scaglia Rossa Fm.,
Scaglia Bianca Fm, (Upper Albian p.p. - Aquitanian p.p.)
Marne a Fucoidi Fm. (Upper Aptian - Lower Albian)
Maiolica Fm. (Upper Tithonian - Lower Aptian)
Jurassic complete (Calcari Diasprigni Fm., Calcari a Posidonia Fm.,
Rosso Ammonitico Fm., Marne del Serrone Fm., Corniola Fm.)
and condensed Successions (Bugarone Fm.) (Carixian - Lower Tithonian)
Calcare Massiccio Fm. (Hettangian - Carixian)
Main
Secondary
- Cupi-Ussita Segment (9 km)
a
: Cupi section (4 km); b: Mt. Banditella section (5 km); c: Mt. Rotondo section (3 km).- Mt. Bove-Mt. Porche Segment (12 km)
d: Mt. Bove section (10 km); e: Mt Porche section (4 km).
- Vettoretto-Redentore Segment (10 km)
f: Quarto.S.Lorenzo section (2.5 km); g: Redentore section (2 km); h: Vettoretto section (2 km).
Outcropping
Buried/Uncertain
Outcropping
Buried/Uncertain
4
3
Surface faulting survey area
b
d
e
f
g
h
Fault - Coseismic Throw: 0-20 cm 20-40 cm 40-80 cm 80-160 cm 160-240 cm Mw 5.9 26 October 2016 Mw 5.4 26 October 2016 Mw 6.5 30 October 2016 Mw 6.0 24 August 2016a
c
I I’ M M’ N N’ A A’ B B’ C C’ D D’ E E’ F F’ G G’ H H’ L L’ A A’ B B’ C C’ D D’ E E’ F F’4
3
43°0
′36
″
43°0
′36
″
43°0
′0
″
43°0
′0″
42°59
′24
″
42°59
′24
″
42°58
′48
″
42°58
′48
″
42°58
′12
″
42°58
′12
″
42°
57
′36
″
42°57
′36
″
42°57
′0
″
42°57
′0″
13°5′24″
13°6′0″
13°6′36″
13°7′12″
13°7′48″
13°8′24″
13°9′0″
13°9′36″
13°10′12″
13°10′48″
13°11′24″
13°12′0″
13°12′36″
10
15
15
10
15
15
10
10
10
20
10
10
20
20
11
33
35
15
13
5
15
4
8
20
29
48 42
26
12
30
22
64
23
36
40
16
23
18
14
44
29
29
65
17
17
16
23
5
6
7
20
20
7
11
14
9
22
12
41
23
36
8
5
8
13
21
23
14
24
38
53
33
55
71
63
73
42
10
27
3
23
24
45
20
30
10
10
10
10
10
7
29
14
5
17
26
64
A
'
B
B'
C
C'
D
D'
E'
E
MAI SAA VAS SCC FUC SBI FUC SCC VAS VAS VAS SCC SAA SAA SBI SBI SBI FUC FUC SBI MAI MAI COI CDU MAS CDU POD RAM CDU MAI SAA SAA SAAA
BUG3. Geological Map of the Cupi - Ussita Area
500 m
SCC
VAS
SAA
SBI
FUC
MAI
BUG
CDU
POD
MSE
RAM
COI
MAS
Triassic Evaporites
EV
Stratigraphic Scheme
Light Colours:
Geology from Pierantoni et al (2013)
Dark Colours:
Geology constrained by this work
76
59
87
52
73
87
1
1:25,000
0
1 km
(Field survey on 1:10,000 scale topographic map)
SAA SAA SAA BUG
2g
42°55
′48
″
42°55
′48
″
42°55
′12
″
42°55
′12
″
42°54
′36
″
42°54
′36
″
42°54
′0
″
42°54
′0″
42°53
′24
″
42°53
′24
″
42°52
′48
″
42°52
′48
″
13°7′48″
13°7′48″
13°8′24″
13°8′24″
13°9′0″
13°9′0″
13°9′36″
13°9′36″
13°10′12″
13°10′12″
13°10′48″
13°10′48″
13°11′24″
13°11′24″
13°12′0″
13°12′0″
13°12′36″
13°12′36″
13°13′12″
13°13′12″
13°13′48″
13°13′48″
13°14′24″
13°14′24″
85
71
71
65
54
64
75
F
F'
G'
G
H
I
I'
H'
L
L'
M
M'
10
10
20
25
20
27
12
25
10
29
30
25
40
30
35
35
20
40
20
20
35
20
20
20
45
20
20
40
30
35
10
40
33
26
48
71
33
39
19
18 16
23
30
17
17
13 21
67
55
69
12
27
29
25
31
33
52
9
18
19
15
15
80
15
25
25
20
35
30
20
25
15
10
10
10
16
30
29
52
20
25
5
10
10
19
18
22
28
33
36
27
10
6
27
7
35
13
50
MAI CDU CDU CDU CDU CDU CDU CDU CDU CDU CDU CDU CDU CDU MAI MAI MAI MAI MAI MAI MAI MAI MAI FUC FUC FUC FUC FUC FUC FUC FUC FUC FUC MAI SBI SBI SBI SBI SBI SBI SAA SAA SAA SAA POD POD POD POD POD POD CDU MAS MAS MAS MAS MAS MAS BUG BUG4. Geological Map of the Mt. Bove - Mt. Porche Area
1
1:25,000
0
1 km
(Field survey on 1:10,000 scale topographic map)
MSE COI MSE COI SAA SBI
2f
2e
2d
2c
2a
2b
Point of view of cover page Fig. B (right)
Picture from fig. 2 of the main text
2a
Point of view of cover page Fig. B (left)
Picture from fig. 2 of the main text
2a
NO NEA’
SO NEB
B’
SAA VAS SCC FUC SAA VAS SCC FUC Il Poggiolo Costa Tranquilla Colle S. Giovanni Pian Terrena SAA FUC SBI M. La Banditella SO NEC
C’
SBI VAS SCC SO NED
D’
MAI SAA FUC SBI FUC MAI SAA SBI VAS FUC MAI SAA SBI FUC SAA FUC SO NEF
F’
SAA SBI MAI CDU POD POD CDU MAI RSA COI MAS MAS POD CDU MAI RSA COI Pian Dell’Arco M. Bove Nord MAI SO NEG
G’
SAA SBI MAI CDU POD FUC MAS EV CDU POD COI RSA M. Cornaccione M. Bicco MAI CDU POD RSA COI MAS MAJ SO NEH
SAA BU MAI CDU POD FUC MAS CDU POD CDU CDU MAI COI SAA SBI FUC MSEH’
M.Bove Sud M.Cornaccione MAI CDU POD BUG MAS MAI MSE CDU POD MAS COI POD CDU MAI COI MSE MSE POD CDU COI MAS EV SO NEI
I’
Passo Cattivo SOL’
Colle La Croce Cima Cannafuso MAI CDU POD MSE COI FUC SBI SAA MAI CDU POD MSE COI SO NEM
M’
MAI F. Nera CDU POD MSE COI MAS MAI CDU POD MSE FUC SBI SAA MAI SAA POD POD SAA SBI FUC MAI CDU SON
N’
M. Porche ? SBI MAI CDU FUC MAI MAI500
1000
1500
0
A
2000
500
1000
1500
0
2000
500
1000
1500
0
2000
2500
500
1000
1500
0
2000
2500
-500
500
1000
1500
0
2000
2500
NE500
1000
1500
0
2000
2500
NE SBI SBIL
M. Rotondo M. PrataLight Colours:
Geology from Pierantoni et al (2013)
Geology constrained by this work
Dark Colours:
Th ~ 130 m Th ~ 250 m Th ~ 120 m Th ~ 500 m Th ~100 m Th ~ 100 m Th ~160 m Th ~ 50 m Th ~ 470 m Th ~ 300 m Th ~ 450 m Th ~ 250 m Th ~ 300 m Th ~ 500 m Th ~ 500 m Th ~ 550 m Th ~ 500 m Th ~ 500 m Th ~ 420 m Th ~ 420 m Th ~ 500 m Th ~ 400 m SO
E
E’
NE MAI FUC SBI SAA MAI MAITh = 20m
2100 2200 2300 2100 2200 2300 2100 2200 2300 2400 2100 2200 2300 2400Th = 21 m
Th = 12 m
2100 2200 2300 2400 2100 2200 2300 2400Th = 17.5 m
Profile 1 2100 2000 2100 2000Th = 12.5 m
Pro le 3 2100 2200 2000 2300 2100 2200 2000 2300Th = 9.5 m
Profile 4Th = 8 m
2100 2200 2000 2300 2100 2200 2000 2300 Profile 5Th = 18 m
2100 2200 2000 2300 1900 2100 2200 2000 2300 1900 Profile 6 1900 1800 2000 1900 1800 2000 1700 1700Th = 10 m
1900 1800 2000 2100 1900 1800 2000 2100 Pro le 2c)
Tn T Tbtά
1ά
2ά
3Geometric model
Scarp profile from laser scanning
T = Throw on main fault; Tn = Net throw;
Tbt = Throw caused by back - tilting;
, = Far field slope; = back-tilting; = Slip vector.
ά
1ά
3ά
2A
20.3
B
16.5
3.5
≈
18.5
19.0
3.5
≈
17.5
22.5
T (m) Tn (m) Tbt (m) Back-tilting (%)Topographic Profile (Scale 1:10,000)
A1
A2
Area 1 (A1) = Area 2 (A2)
100
120
0 5000 10000 15000 20000 25000 300001
0.8
0.6
0.4
0.2
0
50
100
150
200
250
300
0
10
20
30
40
Maximum Displacement (cm)Surface Rupture Length (km)
0
20
40
60
80
0
10
20
3040
Average Displacement (cm)Surface Rupture Length (km)
W&C94 (N) log(AD) = -1.99 + 1.24 log(SRL)
Wes 08 (N) AD = 0.03 SRL
W&C94 (N) log (MD) = -1.98 + 1.51 log(SRL)
Wes 08 (N) MD = 0.09 SRL
0
50
100
150
200
250
300
5.5
6.0
7
0
10
20
30
40
50
60
70
80
90
100
W&C94 (N) log(AD) = -4.45 + 0.63 MwW&C94
30 Oct.
24 Aug.
W&C94 (N) log(MD) = -5.9 + 0.89 MwP&C04 log(MD) = 1.14 Ms - 7.82 (assum. Ms=Mw)
0
5
10
15
20
25
30
35
40
7
Mw Average Displacement (cm) Maximum Displacement (cm) Surface Rupture Length (k m)P&C04
6.5
6.5
6.7
5.5
6.0
6.5
7
5.5
6.0
Cumulative
W&C94
6.7
Mw24 Aug.
Cumulative
24 Aug.
P&C04
6.7
Mw30 Oct.
24 Aug.
Cumulative
W&C94
W&C94
W&C94 (N) log (SRL) = -2.01 + 0.5 MwP&C04 log(SRL) = 0.78 Ms - 3.93 (assum. Ms=Mw)
30 Oct.
Cumulative
W&C94
G08 G08 Mw = 4.7248 (SRL) 0.1046Cumulative
24 Aug.
A-A’
B-B’
C-C’
D-D’
E-E’
F-F’
G-G’
H-H’
I-I’
D-D’
L-L’
M-M’
N-N’
B-B’
A-A’ C-C’ E-E’
F-F’
P.1 P.2 P.3 P.4 P.5 P.6P.7 P.8 P.9Brozzetti et al, 2019
Geological Thorw Brozzetti el al, 2019 Coseismic Throw Topog raphic Throw0
0.1
0.2
0.3
0.4
AD
/MD
McC&S
W
es08
ADa/MD
ADi/MD
ADs/MD
ADl.t./MDl.t.
Global Data
(Normal Faulting)
2016 cumulative
Long term Data
(Post LGM)
STRUCTURAL (LONG TERM) DATA
MD - SRL
AD - SRL
SRL -Mw
AD - Mw
MD - Mw
geologic fault coseismic rupturecovered by rock slide
Cupi - Ussita Segment
Mt. Bove - Mt. Porche Segment
Vettoretto - Redentore Segment
1.0
2.0
3.0
4.0
5.0
6.0
0.0
0.0
0.2
0.4
0.6
0.8
1.0
Normalized Length
D/AD
7.0
(Wesnousky, 2008)
0.0
0.2
0.4
0.6
0.8
0.0
0.2
0.4
0.6
0.8
1.0
D/MD
1.0
Normalized Length
f)
(Wesnousky, 2008)
McC&S = Mc Calpin & Slemmons (1998) Wes08 = Wesnousky (2008)
ADa/MD = AD arithmetic/MD ADi/MD = AD integral/MD ADs/Md = AD summ/MD ADl.t./MDl.t. (long term)
ADi/MD(24A) = AD integral / MD (24 August)
COSEISMIC PARAMETERS SRL MD AD integral AD arithmetic 30 km (<32 km) ≥ 22 km 240 cm 222 cm 36 cm 37 cm 24 August (Mw 6.0) 5.8 km 28.5 cm 12.7 cm 30 October (Mw 6.5) Cumulative (Mw 6.7)
Net Displacement (cm)
2016 (cumulative)
Global normal faulting surface ruptures
(Wesnousky, 2008)
Along Strike Distribution of Cumulative Net Displacement
Solid: Principal Fault
Dashed: Secondary Fault
SW
- Dipping
NE - Dipping
g)
2016 (cumulative)
Global normal faulting surface ruptures
(Wesnousky, 2008)
Cupi
Section Mt. Banditella Section
Mt. Rotondo Section
Mt. Bove
Section
Mt.Porche
Section
Quarto S. Lortenzo
Section
Redentore
Section
Vettoretto
Section
Cupi Section Mt. Banditella Section Mt. Rotondo Section Mt. Bove SectionMt. Porche Section Q. S. Lortenzo Section
Redentore Section Vettoretto Section
a)
b)
c)
d)
e)
a)
c)
0.5
ADi/MD(24A)
24 August
Distance (km)
Along Strike Distribution of Cumulative Throw and Opening (Principal Fault)
Throw
Solid: Principal fault
Opening
Dashed: Secondary Fault
Throw / Opening (cm)
b)
0
5
10
15
20
25
30
0
5
10
15
20
25
30
SW
- Dipping
NE - Dipping
BP Segment Geological Throw Coseismic ThrowCupi - Ussita Segment
Mt. Bove - Mt. Porche Segment
Vettoretto - Redentore Segment
Average fault attitude: 225/65
Average slip vector: 231/59
Slip vector Average slip vector
Average fault attitude: 232/65
Average slip vector: 239/62
Average fault attitude: 232/65
Average slip vector: 232/65
CU Segment VR Segment
SRL = Surface Rupture Length
MD = Maximum Displacement
AD = Average Displacement
44°
44°
2°
42°
12°
12°
14°
14°
4
10°
FUC SOE
E’
SAA SBI NECroce Di Monte Rotondo
CDU POD RSA MAS SAA SBI MAI FUC CDU BUG CDU Th ~ 20 m Th ~ 200 m POD RSA ?
Vertical component of 2016 cumulative coseismic displacement (throw) compared with geologic (a) and topographic (b) throws. The throw
values were normalized to the maximum throw in order to make coseismic, topographic and geologic data comparable. Topographic throw is
interpreted to be the throw accumulated after the Late Glacial Maximum (post-LGM; e.g., Roberts and Michetti, 2004).
Topographic profiles are realized from a 50 cm – resolution Digital Surface Model (DSM) obtained from Pléiades Images (©CNES_2016)
(from CEOS Seismic Hazard Pilot group, IPGP, France). Topographic throw was calculated by measuring the vertical offset of the far-field
topographic slope across the fault scarp.
The geologic throw along the Cupi-Ussita and Mt. Bove – Mt. Porche segments was calculated from geologic sections in Frame 5. The
geologic throw along the Vettoretto – Redentore segment is from Brozzetti et al. (2019).
b)
Normalized Throw
(Throw/Throw Max)
Normalized Throw
(Throw/Throw Max)
DISTANCE (m)
0
5000
10000
15000
20000
25000
30000
1
0.8
0.6
0.4
0.2
a)
2250 1950 2000 2200 215029 °
27 °
Hangingwall
Footwall
Change in slope
Fault
Eroded scarp
Far
field
slop
e
2050
1
Location Map of Topographic Profiles
A B A A’
Rotated Fault
Fault
Thrust
Section traces
Reactivated Normal Fault
Uncertain/Buried Reactivated Normal Fault
Not Reactived Normal Fault
- Conrtinental Deposits:
Slope Deposits: Well sorted or heterometric unconsolidated deposits of variable size. Clasts are
angular to moderately rounded. (Pleistocene - Holocene)
Alluvial Deposits: Fluvial calcareous gravel deposits. (Pleistocene - Holocene)
- Marine Succession:
Scaglia Cinerea (SCC): Grey and green calcareous marls, marls and clayey marls in medium thin beds.
In the lower part there are marly limestones levels. 200 m of thickness
(Bartonian p.p. - Aquitanian p.p.)
Scaglia Variegata (VAS): Alternation of gray, red and green coulored limestones and marly limeston in
thin to medium beds and red and grey calcareous marls. 50 m of thickness.
(Lutetian p.p. - Bartonian p.p.)
Scaglia Rossa (SAA): Limestons and marly limestones, pink, red and rarely withe coloured, in
medium beds, with thin pelitic levels. There are also nodules and ribbons of red and pink chert,
in the lower and upper parts. 250 - 400 m of thickness. (Lower Turonian p.p. - Lutetian p.p.)
Scaglia Bianca (SBI): Withe limestones and marly limestones in medium beds, with black chert in the
upper part and pink chert in the lower one. In the uppermost part, a 1.5 m thick level made of black
anoxic organic-rich shales named “Livello Bonarelli” is present. 50 - 70 m of thickness.
(Upper Albian p.p. - Lower Turonian p.p.)
Marne a Fucoidi (FUC): Marls, shaly marls, marly limestone grey, green and red coulored with
organic-rich clay levels. In the upper part, marly limeston prevails and green chert is present.
50 - 80 m of thickness. (Lower Aptian - Upper Albian)
Maiolica (MAI): White mudstones in thin-medium beds with gray or white chert in the lower part and
black chert in the upper part. 150 -450 m of thickness. (Upper Tithonian - Lower Aptian)
- Complete Jurassic Succession:
Calcari Diasprigni (CDU): The lower part is made up of thinly bedded green, red and gray siliceous
mudstones with green, red or gray chert and marly levels. Clastic and bioclastic limestones are also
present. The upper part is named “Calcari ad Aptici”, and is composed of grey, green and red cherty
limestones in medium - thin beds with aptychi. 150 m of thickness. (Upper Bajocian - Lower Titonian)
Calcari a Posidonia (POD): Whitish - brown limestones and marly limestones in medium beds, sometimes
nodular. Posidonia filaments are abundant. Clastic and bioclastic limestones are present and
chert increases upward. 200 m of thickness. (Upper Toarcian p.p. - Lower Bajocian)
Rosso Ammonitico (RAM): Pink and red nodular limestones and marly limestones in medium to thin beds
alternating with red marls and shaly marls. The unit can be partially or totally replaced by the
“Marne del Serrone” Formation. 40 m of thickness. (Toarciano p.p.)
Marne del Serrone (MSE): Green and grey marly limestones of various thickness, marls and shaly marls
and clastic limestones in medium beds. Variable thickess, from a few to 150 m.
(Pleinsbachian p.p. - Toarcian p.p.)
Corniola (COI): Grey and brown limestones in thin to thick beds. Gray and white nodules or ribbons of chert
are present. Olistoliths of Calcare Massiccio are present. The upper part can be replaced by the “Marne
del Serrone” Formation. Thickness of 500 m or more. (Lower Sinemurian p.p. Lower Toarcian p.p.)
- Condensed Jurassic Succession
Bugarone Group (BUG): Nodular and locally dolomitized grey, brown or pink mudstones in medium beds.
Marls are present in the middle part. There are ammonites, crinoids and brachiopods.
40 m of thickness. (Carixian p.p. - Lower Titonian)
Calcare Massiccio (MAS): White, or more rarely gray or brown grainstones, packstones and sometimes
wackstones, massive or coarsely bedded with cyclothemic features. Ooid and bioclastic grainstones are
present in the uppermost part. Maximum 700 m of thickness. (Hettangian - Carixian)
LEGEND
2
3
4
5
6
7
9
8
Horizontal Bedding
Overturned Bedding
Vertical Bedding
53 A BTopographic profiles in fig. c
Mapping the geology of the 2016 Central Italy earthquake fault (Mt. Vettore - Mt. Bove fault, Sibillini Mts.): geological
details on the Cupi - Ussita and Mt. Bove - Mt. Porche segments and overall pattern of coseismic surface faulting
.
Alessio Testa
1
, Paolo Boncio
1
, Michele Di Donato
1
, Giovanni Mataloni
2
,
Francesco Brozzetti
1
, Daniele Cirillo
1
1
CRUTS DiSPUTer, University G. D’Annunzio of Chieti - Pescara, Via dei Vestini 31, 66100, Chieti, Italy
2
Dipartimento di Architettura, University G. D’Annunzio of Chieti - Pescara, Viale Pindaro 65127, Pescara, Italy
Profile A
2100
2250
2200
Profile B
Topographic profiles from Laser Scanning and
DSM from Pléiades Images (©CNES_2016)
2200
2050
2250
2100
20.3 m
16.5 m
3.8 m
21 m
17.3 m
3.7 m
Pléiades DSM
(average of 4 profiles)
Laser scanning
Laser scanning
Pléiades DSM
(average of 4 profiles)
≈ 40 m
≈ 40 m
https://doi.org/10.3301/GFT.2019.03Mapping the geology of the 2016 Central Italy earthquake
fault (Mt. Vettore – Mt. Bove fault, Sibillini Mts.):
geological details on the Cupi – Ussita and Mt. Bove –
Mt. Porche segments and overall pattern of coseismic
surface faulting
G
e o l o g i c a l
F
i e l d
T
r i p s
a n d
M
a p s
Società Geologica
Italiana
I S P R A
SERVIZIO GEOLOGICO D’ITALIA
Organo Cartografico dello Stato (legge n°68 del 2-2-1960) Dipartimento per il
ISSN: 2038-4947
2019
Vol. 11 (2.1)
GFT&M
- Geological Field Trips and Maps
Periodico semestrale del Servizio Geologico d’Italia - ISPRA e della Società Geologica Italiana Geol. F. Trips Maps, Vol.11 No.2.1 (2019), 13 pp., 2 Figs. (https://doi.org/10.3301/GFT.2019.03)
Mapping the geology of the 2016 Central Italy earthquake fault
(Mt. Vettore – Mt. Bove fault, Sibillini Mts.): geological details on the Cupi –
Ussita and Mt. Bove – Mt. Porche segments and overall pattern of coseismic
surface faulting
The Geological Survey of Italy, the Società Geologica Italiana and the Editorial group are not responsible for the ideas, opinions and contents of the guides published; the Authors of each paper are responsible for the ideas, opinions and contents published.
Il Servizio Geologico d’Italia, la Società Geologica Italiana e il Gruppo editoriale non sono responsabili delle opinioni espresse e delle affermazioni pubblicate nella guida; l’Autore/i è/sono il/i solo/i responsabile/i.
http://gftm.socgeol.it/
ISSN: 2038-4947 [online]Alessio Testa
1, Paolo Boncio
1, Michele Di Donato
1, Giovanni Mataloni
2, Francesco
Brozzetti
1and Daniele Cirillo
11 CRUST-DiSPUTer, University “G. D’Annunzio” of Chieti-Pescara, Via dei Vestini 31, 66100, Chieti, Italy
2 Dipartimento di Architettura, University “G. D’Annunzio” of Chieti-Pescara, Viale Pindaro 42, 65127, Pescara, Italy
Corresponding Author e-mail address: [email protected]
Responsible Director
Claudio Campobasso (ISPRA-Roma)
Editor in Chief
Andrea Zanchi (Università di Milano-Bicocca)
Editorial Manager
Mauro Roma (ISPRA-Roma) - corresponding manager
Silvana Falcetti (ISPRA-Roma), Fabio Massimo Petti (Società Geologica Italiana - Roma), Maria Luisa Vatovec (ISPRA-Roma), Alessandro Zuccari (Società Geologica Italiana - Roma)
Associate Editors
M. Berti (Università di Bologna), M. Della Seta (Sapienza Università di Roma), P. Gianolla (Università di Ferrara), G. Giordano (Università Roma Tre), M. Massironi
(Università di Padova), M.L. Pampaloni (ISPRA–Roma), M. Pantaloni (ISPRA-Roma),
M. Scambelluri (Università di Genova), S. Tavani (Università di Napoli Federico II)
Editorial Advisory Board
D. Bernoulli, F. Calamita, W. Cavazza, F.L. Chiocci, R. Compagnoni, D. Cosentino, S. Critelli, G.V. Dal Piaz, P. Di Stefano, C. Doglioni, E. Erba, R. Fantoni, M. Marino, M. Mellini,
S. Milli, E. Chiarini, V. Pascucci, L. Passeri, A. Peccerillo, L. Pomar, P. Ronchi, B.C. Schreiber, L. Simone, I. Spalla, L.H. Tanner, C. Venturini, G. Zuffa.
Cover page Figure A
Panoramic view of the Sibillini Mountains from SW. Red arrows locate approximately the 2016 coseismic ruptures along the trace of the Mt. Vettore – Mt. Bove fault (highlighted by prominent morphologic fault scarps). The Piano Grande di Castelluccio tectonic depression in foreground is “filled in” by dense fog.
Cover page Figure B
INDEX
Abstract: ... 4
Introduction ... 4
Methods and techniques ... 6
Content description ... 7
Discussion and Conclusions ... 10
Abstract
We present the results of a field survey performed in the central-northern portion of the Mt. Vettore – Mt. Bove normal fault (VBF), reactivated during the 2016 central Italy earthquake sequence (24 August, Mw 6.0; 26 October Mw5.4 and Mw 5.9; 30 October Mw 6.5). The field survey was carried out by means of digital mapping techniques, and traditional methods on 1:10,000-scale topographic maps. The field work had two main aims: 1) to detail the geology of the central-northern VBF, and to constrain the segmentation and displacement distribution of the entire VBF system; and 2) to map in detail the ruptures of the 26 and 30 October events, filling in the gaps left by previous studies, and provide constraints on the coseismic parameters of the 2016 earthquakes.
The results are summarized in a composite geological map, organized in 8 frames showing: the structural architecture in map view of the VBF system (frames 1 and 2); 1:25,000-scale geological maps of the Cupi-Ussita (frame 3) and Mt. Bove – Mt. Porche (frame 4) sectors of the VBF; twelve 1:25,000-scale geological sections for computing the geological displacements (frame 5); a summary of the coseismic parameters of the 2016 earthquakes (diagrams of net displacement, throw and opening; Surface Rupture Length, SRL; Maximum Displacement, MD and Average Displacement, AD) (frame 6); a comparison of the 2016 coseismic parameters with normal faulting earthquakes occurred globally (frame 7); and a computation of the morphological displacement (post-Last Glacial Maximum, LGM) across the VBF, a comparison among geological, morphological and coseismic displacements, and a quantification of the tectonic back-tilting in the area of maximum coseismic displacement (frame 8). Some implications are discussed in this accompanying note, such as the role of fault segmentation deduced from structural geology and tectonic geomorphology in controlling the coseismic displacement, the role of back-tilting in amplifying the coseismic displacement and the limits of empirical regressions in predicting the relations between rupture parameters and Mw in case of segmented normal faults.
Keywords: Geological map, Umbria-Marche Apennines, 2016 central Italy earthquakes, normal fault, coseismic surface faulting, coseismic parameters, segmentation.
Introduction
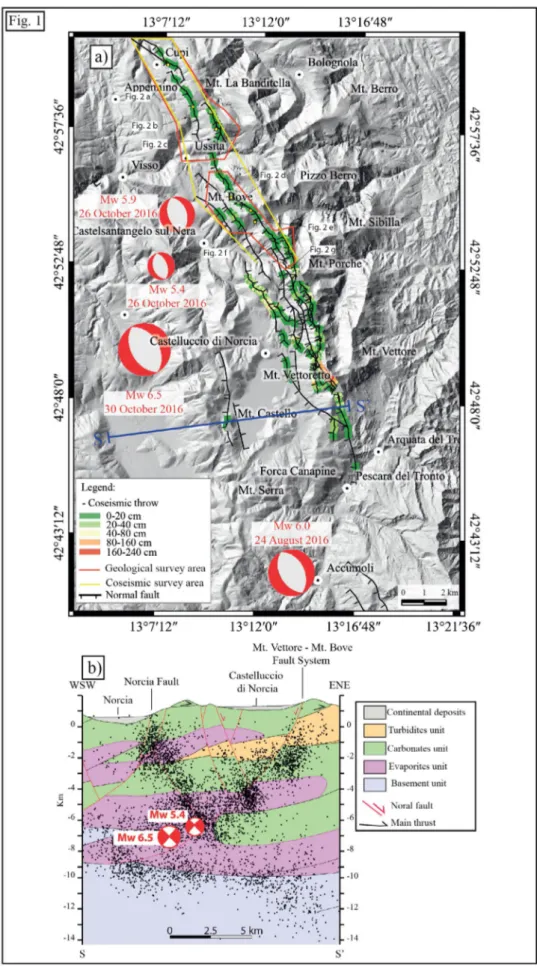
The 2016 earthquake sequence in central Italy started on August 24 with a Mw 6.0 shock located 9 km NW of the Amatrice town. Two Mw 5.4 and Mw 5.9 earthquakes occurred on October 26, 25 km further North. The largest shock (Mw 6.5) occurred on October 30, between the August 24 and October 26 events, close to the Norcia town (Fig. 1).
At the time of this work, several papers have been published on the earthquake geology, seismology and engineering of the sequence. It is not the intention of this short note to provide a complete reference list of all the published papers. Only a limited number of papers that we considered representative for the issues dealt
within this note will be acknowledged in the following. All the events are normal faulting earthquakes, reactivating NW-SE striking, SW-dipping normal faults (Chiaraluce et al., 2017; Porreca et al., 2018). The first event nucleated between the Mt. Gorzano and Mt. Vettore – Mt. Bove faults, and ruptured up to the surface along the southern segment of the Mt. Vettore – Mt. Bove fault (VBF) for a surface rupture length (SRL) of nearly 6 km (Lavecchia et al., 2016). The second and the third shocks ruptured up to the surface the entire VBF for a total length of nearly 30 km, reactivating the fault segment previously faulted by the 24 August event (Brozzetti et al., 2019), and causing a high value of maximum displacement (MD) in the southern VBF, with oblique normal slip with a right-lateral component (Perouse et al., 2018). The VBF was previously mapped as an active fault (Calamita and Pizzi, 1993; Galadini and Galli, 2003; Boncio et al., 2004; Ercoli et al., 2014), silent since 1500-1600 yrs (Galli et al., 2019).
The international research group Open EMERGEO (Civico et al., 2018; Villani et al., 2018) performed the survey of coseismic effects starting few hours after the main events, also thanks to a photographic survey from helicopter flights. Nevertheless, the northern area of the fault system was only partially covered by the Open EMERGEO survey, due to logistic difficulties and dense vegetation cover. The result was a map with several gaps of coseismic surface faulting data, particularly about coseismic displacement. The surface rupture length (SRL), the along-strike displacement distribution and the average coseismic displacement (AD) are parameters that best represent the surface expression of the seismogenic fault, but need a good coverage of measurements all along the fault trace. The other parameter used for sizing a surface faulting earthquake is the maximum coseismic displacement (MD), which is often restricted to very short stretches of the fault. MD can be affected by local tectonic or non-tectonic amplifications (e.g., McCalpin, 2009), and can thus be affected by large uncertainties.
Therefore, we decided to perform additional field work along the central-northern part of the VBF in order to fill in the gaps of rupture mapping/measuring, and obtain robust constraints on the coseismic rupture parameters. Moreover, we detailed the surface geology by basic geological field mapping, obtaining geological maps of the Cupi – Ussita and Mt. Bove – Mt. Porche areas, the geology of which was less constrained than the central-southern VBF system. The maps were used for realizing several geologic sections across the VBF, in order to constrain the long-term geologic displacement. The field survey was performed after melting of the 2016-2017 snow cover, from Spring to Fall 2017.
The area is located in the Sibillini Mts. ridge, among the Provinces of Ascoli Piceno, Fermo, Macerata and
Fig. 1 – a) Synthetic tectonic map of the VBF with along-fault variation of coseismic displacement (different colors from green to red) and location of main shocks of the 2016 seismic sequence with focal mechanisms. Red frames outline the areas of geological survey. Yellow frame outlines the area of coseismic ruptures survey. Black arrows show the location of pictures in Fig. 1. b) Geological cross section S-S’ from Porreca et al. (2018) with projected hypocenters and focal mechanisms of the
Perugia. The area is covered by a 1:40,000 geologic map published in 2013, which represents a good, updated reference base map for the Sibillini Mts. (Pierantoni et al., 2013). The Sibillini Mts. ridge is part of the Umbria-Marche Apennines, a Neogene NE-verging fold-and-thrust belt developed during the convergence between the African and European plates (e.g., Barchi et al., 2012). The geologic structures cropping out in the Sibilini Mts. area are formed by Meso-Cenozoic sedimentary successions well described in the literature (e.g., Cresta et al., 1989), consisting of thick (ca. 700 m) lower Liassic shallow-water limestone (Calcare Massiccio) overlain by an upper Liassic - Paleogene carbonate multilayer of pelagic origin. Jurassic sin-sedimentary normal faults originated differences between thick, complete successions of deep basin environment and condensed (reduced thickness) successions of structural high, with corresponding thicknesses of the upper Liassic – lower Miocene successions ranging from ca. 850 m to 1500 m, or even more in highly subsiding areas. Neogene pre-flysch marls and sin-orogenic siliciclastic flysch turbidites overlay the carbonate succession. Quaternary coarse-grained moraine and slope-derived deposits are widespread along the mountain slopes. Quaternary fluvial-lacustrine sediments fill in intra-mountain depressions, such as the Piano Grande di
Castelluccio (Coltorti and Farabollini, 1995).
The Sibillini Mts. thrust is the major tectonic feature of the area (Koopman, 1983; Lavecchia, 1985), overthrusting the Umbria-Marche folded carbonates over the Messinian Laga flysch. The compressional deformation is post-dated by Quaternary normal and transtensional faults, dipping mostly to the SW, including the VBF and Norcia active normal faults (Calamita and Pizzi, 1993; Brozzetti and Lavecchia, 1994; Cello et al., 1997; Galadini and Galli, 2000; Boncio and Lavecchia, 2000). A number of strong historical earthquakes are interpreted to be sourced by the Norcia normal fault, such as the 1328 M 6.5, January 1703 M 6.9, and 1979 M5.9 earthquakes, while the VBF was silent in historical times (Galli et al., 2017).
The map published here is not a classical geological map, it is instead a composite map, organized in eight different frames. Frames 1 and 2 contain a simplified geological map of the Sibillini Mts. and a structural map with hierarchical organization of the VBF. Frames 3, 4 and 5 contain the principal contribution of this work, consisting of 1:25,000-scale geologic maps of the Cupi-Ussita (Frame 3) and Mt. Bove – Mt. Porche (Frame 4) areas, and twelve geologic sections across the VBF (Frame 5). Frame 6 summarizes the principal coseismic parameters (along-strike distribution of net slip, throw and opening; SRL, MD and AD). Frame 7
compares the 2016 coseismic parameters with global historical normal faulting earthquakes. In Frame 8, the coseismic slip distribution is compared with the long-term slip obtained from geologic sections and topographic profiles.
Methods and techniques
Considering that the main aim of this work is a complete survey of the 2016 coseismic parameters and a detailed geological mapping of the central-northern part of the VBF system, most of the effort was for direct field survey. In addition to traditional survey methods on 1:10,000-scale topographic maps, we performed a digital field survey and mapping by using the Field Move (©Midland Valley) software on smartphone and tablet. The software is equipped with digital compass, clinometer and mapping tools. Thanks to the integrated GPS, the data are automatically georeferenced and it is possible to check the position in real time on satellite images. It is possible to import customized maps. In particular, SAR interferometry maps (e.g., Sentinel 1 InSAR maps from http://comet.nerc.ac.uk/ and http://insarap. org/) and maps with rupture traces from helicopter flights (Civico et al, 2018) were used to orient the survey of coseismic ruptures. Photos and notes can complete the data collection. Advanced drawing tools are included and it is possible to represent different kinds of data with different colors and symbols. All the collected data can be analyzed in the integrated stereonet tool. Finally, the work can be easily exported in GIS, Google Earth and Move compatible formats. Along the coseismic ruptures we collected throw, opening (the horizontal aperture perpendicular to rupture strike), net displacement and slip vector of the surface faulting. Considering that the field survey was performed after 6-to-12 months after the mainshock, displacement parameters were collected only on well preserved, unambiguous piercing points. In case of poorly preserved (eroded, covered) ruptures, we mapped only the point/trace on the map, and the strike whenever possible.
Topographic profiles across fault scarps were realized on a 50 cm – resolution Digital Surface Model obtained from Pléiades Images (©CNES_2016) (from CEOS Seismic Hazard Pilot group, IPGP, France). Topographic throw was calculated by measuring the vertical offset of the far-field topographic slope across the fault scarp, which can be inferred to be the throw accumulated by the fault after the Late Glacial Maximum (post-LGM throw; i.e., post 18-12 kyrs ago) according to the methodology explained in Roberts and Michetti (2004).
The freeware QGIS software (Version 3.0.3 Girona) was used to realize all the maps. The base map in Frames 1 and 2 is a 10 m-resolution Digital Elevation Model from Tarquini et al. (2007). The topographic base map used in Frames 3 and 4 is the topographic map of the Marche Regional Authority (Carta Tecnica Regionale, CTR, Regione Marche) at a scale of 1:10,000 (http:// www.regione.marche.it/Regione-Utile/Paesaggio-Territorio Urbanistica/Cartografia/Repertorio/ Cartatecnicanumerica110000). All the coordinates are in WGS 84 coordinate system.
Content description
The composite geological map attached to this note is organized in eight frames.
Frame 1 contains a synthetic geological map of the
Sibillini Mts. area, which is realized by integrating the geological map of the Sibillini Mts. published by Pierantoni et al. (2013) with that of the Mt. Vettore area presented in Brozzetti et al. (2019) and the new, original geological maps realized in this work. On this map, the traces of the original geological sections produced in this work plus the traces of six geological sections from Brozzetti et al. (2019) are reported. The location of the mapped areas is also shown.
Frame 2 contains a structural map showing the
hierarchical organization of the VBF system. The VBF is a NNW-SSE-striking, SW-dipping normal fault, about 30 km long. It is divided into segments and sections, based on fault trace continuity, amount of geological throw, variation of throw along-strike and geometrical-structural complexities (gaps, step-overs, bends). The term segment is used here as a purely descriptive term, without behavioral meanings (i.e., it is not synonymous of “earthquake segment”, often used in the earthquake geology literature). We divide the VBF in three segments, which are represented with different colors: Cupi – Ussita (CU), Mt. Bove – Mt. Porche (BP) and Vettoretto - Redentore – (VR) segments.
The CU segment is about 9 km-long. It can be divided in three sections: the 4 km-long Cupi section, separated by a right step-over with an overlap of about 700 m from the Mt. Banditella section, and the Mt. Rotondo section, nearly parallel to the Mt. Banditella section. In the field, it is not clear if the CU and BP segments are separated by a gap or linked together. In any case, there is an evident minimum in both the coseismic and geologic displacement profiles (Frame 8) that allowed us to separate them. The 12 km-long BP segment, the longest of the system, is separated into the Mt. Bove and Mt. Porche sections by a left step-over having 3
km of overlap and 0.5 km of separation. The Mt. Bove section is longer and more continuous than the Mt. Porche one.
The VR segment, the southernmost of the system, is divided from the BP segment by a step-over and a minimum in the geological displacement profile. The VR segment is about 10 km long and is formed by the Quarto S. Lorenzo, Redentore and Vettoretto sections. The Quarto S. Lorenzo and Redentore sections are divided by a bend. Both sections are about 2 km long. The Vettoretto section is separated from the Redentore section by a right step-over of about 500 m.
Except CU, each segment shows a complex pattern of secondary synthetic and antithetic faults.
Frames 3, 4 and 5 contain the geological maps of the
Cupi - Ussita and Mt. Bove – Mt. Porche areas, and twelve geological cross sections at a scale of 1:25,000. The Cupi – Ussita area (Frame 3) includes the three sections of the CU segment. This fault was only partially mapped as uncertain (dashed fault) in previously published maps (the Cupi section was not mapped before; Pierantoni et al., 2013). The field survey allowed us to map precisely the fault trace. The stratigraphy includes a Jurassic condensed succession, cropping out in the southern part of the area. Five geological sections (from A-A’ to E-E’) show gentle folds dislocated by the CU normal fault. The Marne
a Fucoidi were used as a marker to measure the
geological displacement due to normal faulting, with maximum throw of 470 m measured on section D-D’, in the central part of the Mt. Banditella section. Field view examples of surface faulting along the Cupi, Mt. Banditella and Mt. Rotondo sections are reported in Figures 2a, 2b and 2c, respectively.
The Mt. Bove – Mt. Porche area (Frame 4) includes the Mt. Bove section and the northernmost part of Mt. Porche section of the BP segment. In literature (e.g., Pierantoni et al, 2013) the Mt. Bove fault was poorly constrained. The 2016 coseismic ruptures allowed us to map the fault with continuity all along the foot of the Mt. Bove Nord, Mt. Bicco and Mt. Bove Sud western slopes, where the fault trace is often covered by Holocene scree. The scree was breached by the coseismic surface faulting in 2016 (Fig. 2d). Only locally the fault is characterized by a well-detectable fault plane, rejuvenated at the base by the 2016 surface faulting (Fig. 2e). Uncertainties on fault trace remain where the rupture is covered by coseismic rock slides (Fig. 2f). The displacement accumulated by the normal faults was measured along the cross sections F-F’ to M-M’. The estimated maximum throw on the Mt. Bove section, which is the fault section entirely reactivated with continuity in 2016, is about 550 m (section H-H’). There are two synthetic normal faults in the hanging wall of the Mt. Bove fault section, cropping out west of Mt.
Fig. 2 – Field view examples of surface ruptures from each fault section of the central-northern VBF. a) Surface rupture within slope deposits and fault breccia along the Cupi section; b) Surface rupture in slope deposits along the Mt. Banditella section (note the stretched roots); c) Surface rupture in slope deposits along the Mt. Rotondo section. d) Maximum coseismic displacement of the Mt. Bove section (about 90 cm); e) Exposed free face along Mt. Bove fault; f) Coseismic rock slides covering the surface faulting near Passo cattivo; g) Well-preserved, vertical-to-overhanging surface ruptures within clay-rich soil (eluvium of Marne a Fucoidi) in the northernmost part of the Mt. Porche section. Location in Figure 1 and in Frames 3 and 4; visiting these sites is suggested to people interested in a field trip along the central-northern trace of the 2016 coseismic
Cornaccione (see section H-H’), both having maximum throw on the order of 500 m. The two synthetic hanging wall faults were partially, discontinuously reactivated in 2016 (see Frame 6), suggesting that the Mt. Bove is the principal fault and the two hanging wall faults are either a) synthetic splays, connected at depth with the principal fault, along which part of the coseismic displacement was distributed, or b) pre-existing faults partially reactivated by triggered slip (sympathetic faulting in the earthquake geology literature; e.g., Yeats et al., 1997). There are uncertainties in estimating the displacement of the Mt. Bove fault in sections F-F’ and G-G’, due to the difficulty in constraining the bottom of the Calcare Massiccio. Sections L-L’ and M-M’ show an East-verging overturned anticline in the hanging wall of a thrust that is a secondary structure related to the Sibillini Mts. thrust. Cross section N-N’ was realized south of the surveyed areas by using the geological map published by Pierantoni et al. (2013).
Frame 6 summarizes all the collected coseismic
rupture data. The area surveyed in this work was crossed by the ruptures of the 26 October Mw 5.9 and 30 October Mw 6.5 events. Field examples of coseismic ruptures are reported in Figure 2. The location of these field views is reported in Frames 3 and 4. For people potentially interested in doing a field trip along the central-northern trace of the 2016 coseismic surface faulting, we suggest to visit these stops (getting to stops 2d and 2e imply difficult hiking), even though all the traces of the reactivated faults are plenty of good field evidence that probably will preserve for several years.
We could not separate the components of the 26 and 30 October events. Moreover, we could not solve the uncertainty on how long the total surface rupture of the 26 October event was (approximately 14 km; Brozzetti et al., 2019), and how long and how much the 30 October event overprinted the 26 October ruptures. Therefore, we can provide only the cumulative displacement of the 26 and 30 October events. The displacement due to the 24 August event, and its overprinting by the 30 October event are outside the area surveyed in this work (southern part of the VBF). In order to build a complete displacement diagram along the entire VBF (diagrams (a) and (b) in Frame 6), the data collected in this work were integrated with data collected along the central-southern part of the VBF (south of Mt. Porche) by previous authors (Civico et al., 2018; Villani et al., 2018; Brozzetti et al., 2019). Principal fault ruptures are distinguished in this work on the basis of longer continuity and larger displacement compared to distributed (i.e., secondary) faults. It is interesting to observe that in the diagrams of the along-strike distribution of coseismic displacement, each fault section has its own maximum, tapering at
fault tips. A similar feature, even at lower resolution, was highlighted by the distribution of the long term geological and morphological displacements (see Frame 8).
The computed coseismic parameters are the surface rupture length (SRL), maximum displacement (MD) and average displacement (AD). SRL was measured by GIS as the length in map view of the surface trace of principal fault ruptures, SW-dipping, without summing overlapping fault sections. MD corresponds to the single-point maximum measured displacement (without averaging topmost values). AD was calculated as both arithmetic and integral (area subtended by the displacement curve divided by rupture length) means. The SRL, MD and AD parameters are listed in a table in Frame 6. The cumulative SRL is 30 km (32 km if a set of a very discontinuous, poor-quality ruptures along the southern continuation of the VBS is considered); MD is 240 cm, AD arithmetic 37 cm and AD integral 36 cm.
Frame 7 contains a comparison of the 2016 coseismic
parameters with global normal faulting data analyzed in various works in the literature. We compared SRL, MD and AD with values predicted by empirical regressions among Mw and fault parameters (Wells and Coppersmith, 1994; Pavlides and Caputo, 2004; Wesnousky, 2008; Galli et al, 2008). For the 2016 cumulative SRL and displacement, we used a cumulative magnitude Mw = 6.7, which is the magnitude calculated from the entire seismic moment released by the Mw>5.0 ruptures on the VBF from August 24 to October 30. We also computed normalized displacement diagrams (D/MD and D/AD vs the normalized length L/SRL) and we compared them with analogous normalized displacement diagrams of global normal faulting earthquakes obtained by using data compiled in Wesnousky (2008). The using of normalized displacement diagrams allowed us to compare earthquakes with different sizes. Finally, the 24 August and cumulative 2016 AD/MD ratio is compared with data from literature (0.33-0.35 for global normal faulting data and 0.5-0.4 for all kinematics earthquakes; Wells and Coppersmith, 1994; McCalpin and Slemmons, 1998; Wesnousky, 2008). The AD/MD ratio calculated from topographic displacements (post-LGM displacement) is also added for comparison. The possible meaning of divergences and convergences emerging from this comparison will be discussed in the next section.
Frame 8 contains nine topographic profiles at a scale of
1:10,000 across the principal fault scarp. These profiles were used to estimate the post-LGM displacement. The coseismic displacement is thus compared with the long-term geological (figure a) and post-LGM (figure b) displacements. The comparison is made by means of normalized throw profiles.
The geological throw profile shows four relative maxima. The first maximum corresponds to the northern CU segment, the two central correspond to the Mt. Bove and Mt. Porche sections of the BP segment, and the southern one corresponds to the VR segment. The Mt. Bove throw is the maximum value of the entire system (550 m), even though there is a large uncertainty in this estimate due to the difficulty in constraining the bottom of the Calcare Massiccio. The topographic throw profile shows two clear maxima, corresponding to the Mt. Bove section and VR segment. A second possible maximum can be inferred in the central part of the Mt. Porche section. The profile lacks of throw data for the northern CU segment.
There is a good correspondence among the location of coseismic MD, the maximum topographic throw, and the maximum geological throw of the VR segment. All of them occur in the central VR segment. At the scale on the entire throw profile, there is a broad correspondence of the relative maxima in the coseismic displacement and the relative maxima in the long-term displacements.
In figure (c) we quantify the amount of back-tilting in the zone of MD. Back-tilting is a process that might occur in the proximity of the fault to accommodate volumetric problems in the hanging wall of a normal fault (e.g., geometric irregularities of the principal fault such as down-dip fault jogs). It is one of the causes for formation of complex fault scarps during normal faulting surface ruptures (e.g., McCalpin, 2009). Cumulative, post-LGM back-tilting in the zone of the 2016 MD was proposed by Di Donato et al. (2018) on the basis of a terrestrial laser scanning. Here we quantify the long-term back-tilting by combining profiles from laser scanning (Di Donato et al., 2018) with topographic profiles from a 50 cm-resolution DSM derived from Pléiades images (©CNES_2016; from CEOS Seismic Hazard Pilot group, IPGP, France), which provide good coverage of both hanging wall and footwall slopes. We estimate that about 18% of the morphologic throw is due to back-tilting (average from two profiles). This value refers to the long-term displacement, cumulated after the LGM. It is likely that a comparable amount occurred during the 2016 coseismic displacement, exaggerating the displacement on the principal fault. Therefore, at least part of the very high MD can be due to back-tilting.
Discussion and Conclusions
The 1:25,000-scale geological maps of the Cupi - Ussita and Mt. Bove - Mt. Porche areas and the associated geological cross sections allowed us to better constrain the characteristics of the VBF compared to the existing
literature, with new data on the along-strike variation of geologic displacement and segmentation of the system. We also present original data on the along-strike variation of post-LGM topographic displacement. The systematic field survey of the coseismic faulting along the central-northern part of the VBF allowed us to constrain the coseismic parameters of the 2016 earthquakes (along-strike displacement distribution; cumulative 2016 SRL = 30 km, MD = 240 cm, and AD = 36-37 cm).
The good correspondence between coseismic and long-term (geologic, topographic) MD in the central part of the VR segment indicates that the coseismic MD recurred systematically in the same position over the past seismic cycles, determining the long-term maximum. In general, the first-order correspondence of the relative maxima in the coseismic displacement profile with the relative maxima in the long-term displacement profiles indicates that the long-term segmentation strongly controls the seismogenic process. This segmentation pattern can be deduced from geological and morphological features.
As far as the comparison with global data is concerned, it is worth noting that the parameters of the 24 August Mw 6.0 event, which ruptured 5.8 km of the 10.5 km-long VR segment, are in good agreement with the values predicted by empirical regressions. Instead, the cumulative parameters are poorly predicted by the regressions. Only the Galli et al.’s (2008) regression, obtained from Italian surface ruptures, fits well the SRL. In general, regressions on SRL fit the data better than those on MD or AD vs Mw.
MD is much higher than the predicted value for a cumulative magnitude Mw = 6.7. The 2016 D/MD normalized profile (Frame 7) plots close to the bottom of global normal faulting earthquakes. This is due to the “anomalously”-high MD value. The divergence of the MD value can be reasonably explained by the fact that it occurred on a very short portion of the VBF, suggesting that local amplifications of tectonic faulting occurred. Back-tilting can explain, at least in part, this amplification. Iezzi et al. (2018) interpreted the “anomalously”-high MD value as due to the change in strike (bend) of the Redentore fault section compared to adjacent sections. This explanation is based on a model predicting that the throw rate in fault bends increases in order to preserve the horizontal strain rate the entire fault must accommodate (Faure Walker et al., 2009). Thus, the high MD measured in the Redentore section could combine the effects of both back-tilting and fault bend.
Di Naccio et al. (2019) hypothesize that a component of coseismic displacement is due to shaking-induced gravitational sliding, particularly along the steepest slopes of Mt. Vettore. Certainly, ground shaking
might have amplified the coseismic displacement in places. The OPEN EMERGEO Working Group mapped several shaking-induced landslides along the VBF system (Civico et al., 2018). Concerning the site of maximum displacement discussed here, the small amount of coseismic opening compared to the large net displacement (Frame 6) seems to be poorly consistent with the shallow gravitational sliding of the scree/colluvial deposits proposed by Di Naccio et al. (2019) (translational sliding on a 27-35°-dipping surface at depths shallower than 15 m). The geometric irregularity proposed here to explain the back-tilting should locate at depths not compatible with such a shallow gravitational sliding (Frame 8). Moreover, careful mapping of the area allowed us to exclude significant gravitational sliding. The most plausible mechanism explaining the coseismic displacement is of primary (tectonic) origin.
Interestingly, AD is lower than the predicted value. The divergence of the cumulative AD compared to the empirical regressions was unexpected. The 2016 D/AD normalized profile (Frame 7) agrees with global normal faulting earthquakes better that the D/MD profile. This indicates that AD probably represents the 2016 surface displacement better than MD. Nevertheless, both the integral and arithmetic AD are significantly lower than the global averages. This apparent anomaly is proposed here to be caused by the segmentation of the fault system. The VBF is formed by several fault segments, sections, and associated synthetic and antithetic secondary splays. If the rupture occurs on a single segment, the seismic moment is released by a rupture on a relatively simple fault surface, with characteristics more close to global averages (e.g., the 24 August rupture on the VR segment). But if the rupture involves several segments and secondary faults, the displacement is distributed on a number of fault surfaces, connected at seismogenic depths but not fully linked from depth to surface. This structural architecture might determine an attenuation of the coseismic displacement at shallow depths. Therefore,
the “anomalous” low AD can be related to the high segmented nature of the VBF system.
The implications for seismic hazard assessment are discussed in Brozzetti et al. (2019). In general, caution is needed in using regressions for AD and MD for highly-segmented faults such as the VBF. Regressions on SRL seem to be more reliable. Moreover, in using slip rate (SR) for calculating the average recurrence interval (T) of the expected earthquake on a fault (e.g., T = AD/SR, assuming regular recurrence), it is very important to know where the SR was calculated. SR calculated in sites close to MD can be much higher than SR obtained in other sites of the same fault. Their use without considering these possible large differences can seriously underestimate or overestimate the expected recurrence intervals. It is important to use displacement-per-event values and SR deriving from the same site of the fault.
The low AD and high MD concur in determining the very low values of cumulative AD/MD. The “single-segment” 24 August rupture has AD/MD values in line with global averages. Interestingly, the long-term (post-LGM) AD/MD approaches the global coseismic averages. This might suggest that the low coseismic AD is recovered during the long term, perhaps by moderate magnitude earthquakes on single segments (i.e., 24 August-like), or by aseismic deformation, or by a combination of both processes.
Acknowledgment
We are grateful to Società Geologica Italiana and Associazione
Bergamo Scienza for the studentship “Scienza oltre l’emergenza
- Your heartquake makes the difference”, Year 2017, with which
field activity of A. Testa was funded. The work was supported by DiSPUTer Departmental Research grants 2017/18 (Resp. P. Boncio). We are grateful to the CEOS Seismic Hazard Pilot group (IPGP, France) for kindly providing us the Pléiades Images (©CNES_2016). We also thank Jacopo Fabrizio and Mattia De Luca who accompanied A. Testa during the field work. We warmly acknowledge Roberto Remigi, for his friendly logistic support. Two anonymous Reviewers are acknowledged for their constructive review.
References
Barchi M. R., Alvarez W. and Shimabukuro D. D. (2012) - The Umbria-Marche Apennines as a Double Orogen: Observations and hypotheses. Ital. J. Geosci. (Boll. Soc. Geol. It.), Vol. 131, No. 2 (2012), pp. 258-271, 11 Figs. (https://doi.org/10.3301/IJG.2012.17) Società Geologica Italiana, Roma 2012
Boncio P., Lavecchia G. (2000) - A geological model for the Colfiorito earthquakes (September-October 1997, central Italy). Journal of Seismology, 4(4):345-356. https://doi.org/10.1023/A:1026509717771
Boncio P., Lavecchia G., Milana G., Rozzi B. (2004) - Seismogenesis in Central Apennines, Italy: An integrated analysis of minor earthquake sequences and structural data in the Amatrice- Campotosto area, Ann. Geophys., 47(6), 1723–1742.
Brozzetti F. and Lavecchia G. (1994) - Seismicity and related extensional stress field: the case of the Norcia Seismic Zone (Italy). ANNALES TECTONICAE, 8, 36-57. Brozzetti F., Boncio P., Cirillo D., Ferrarini F., De Nardis
R., Testa A., Liberi F., Lavecchia G. (2019) - High resolution field mapping and analysis of the August – October 2016 coseismic surface faulting (Central Italy Earthquakes): slip distribution, parameterization and comparison with global earthquakes. https://doi. org/10.1029/2018TC005305
Calamita F. and Pizzi A. (1993) - Tettonica quaternaria nella dorsale appenninica umbro-marchigiana e bacini intrappenninici asso- ciati. Studi Geol. Camerti, Vol. speciale 1992/1, 17-26.
Calamita F., Pizzi A., Roscioni M. (1993) - I “fasci” di faglie recenti ed attive di M. Vettore-M. Bove e di M. Castello-M. Cardosa (Appen- nino umbro-marchigiano). Studi Geol. Camerti, Vol. speciale, 1992/1, 81-95.
Cello G., Mazzoli S., Tondi E., Turco E. (1997) - Active tectonics in the central Apennines and possible implications for seismic hazard analysis in peninsular Italy. Tectonophysics, 272, 43-68.
Chiaraluce L., Di Stefano R., Tinti E., Scognamiglio L., Michele M., Casarotti E., Cattaneo M., De Gori P., Chiarabba C., Monachesi G., Lombardi A., Valoroso L., Latorre D., Marzorati S. (2017) - The 2016 Central Italy seismic sequence: A first look at the mainshocks, aftershocks and source models. Seismol. Res. Lett., 88(3), https://doi.org/10.1785/0220160221.
Civico R., Pucci S., Villani F., Pizzimenti L., De Martini P.M., Nappi R. and Open OPEN EMERGEO Working group (2018) - Surface Ruptures following the 30 October 2016 Mw 6.5 Norcia earthquake, Central Italy. Journal of Maps, 2018VOL. 14, NO. 2, 151–160 https:// doi.org/10.1080/17445647.2018.1441756
Coltorti M. and Farabollini P. (1995) - Quaternary Evolution of the “Castelluccio di Norcia” Basin (Umbro-Marchean Appennines, Central Italy). Il Quaternario, 8(1), 1995, 149-166.
Cresta S., Monecchi S., Parisi G. (1989) - Stratigrafia del Mesozoico e Cenozoico nell’area umbro-marchigiana.
Itinerari geologici sull’appennino Umbro-Marchigiano (Italia): Memorie descrittive della carta Geologica d’Italia, v. 39, 185p.
Di Donato M., Boncio P., Mataloni G., Testa A., Palumbo D., Le Donne L. (2018) - Evidenze di paleodislocazioni cosismiche lungo la faglia di m. vettore (Italia centrale) rivelate da analisi topografiche di dettaglio della scarpata di faglia su roccia. Gruppo Nazionale di Geofisica della Terra Solida 19-21 Novembre 2018. Di Naccio D., Kastelic V., Carafa M. M. C., Esposito
C., Milillo P., Di Lorenzo C. (2019) - Gravity versus tectonics: The case of 2016 Amatrice and Norcia (central Italy) earthquakes surface coseismic fractures. Journal of Geophysical Research: Earth Surface, 124, https://doi.org/10.1029/ 2018JF004762.
Ercoli M., Pauselli C., Frigeri A., Forte E., Federico C. (2014) - 3-D GPR data analysis for high-resolution imaging of shallow subsurface faults: The Mt Vettore case study (Central Apennines, Italy). Geophys. J. Int., 198(1), https://doi.org/10.1093/gji/ggu156.
Faure Walker, J. P., Roberts, G. P., Cowie, P. A., Papanikolaou, I. D., Sammonds, P. R., Michetti, A. M., Phillips, R. J. (2009). Horizontal strain-rates and throw-rates across breached relay zones, Central Italy: Implications for the preservation of throw deficits at points of normal fault linkage. Journal of Structural Geology, 31(10), 1145–1160. https://doi.org/10.1016/j. jsg.2009.06.011.
Galadini F., and Galli P. (2000) - Active Tectonics in the Central Apennines (Italy) – Input Data for Seismic Hazard Assessment. Natural Hazards, 22(3): 225-268 https://doi.org/10.1023/A:1008149531980
Galadini F., and Galli P. (2003) - Paleoseismology of silent faults in the Central Apennines (Italy): the Mt. Vettore and Laga Mts. Faults. Annals Geophy. 46(5), 815–836. Galli P., Castenetto S., Peronace E. (2017) - The
macroseismic intensity dis- tribution of the 30 October 2016 earth- quake in central Italy (Mw 6.6): Seismotectonic implications. Tectonics, 36. https://doi. org/10.1002/ 2017TC004583
Galli P., Galadini F., Pantosti D. (2008) - Twenty years of paleoseismology in Italy, Earth Sci. Rev., 88(1–2), 89– 117, https://doi.org/10.1016/j. earscirev.2008.01.001. Galli P., Galderisi A., Peronace E., Giaccio B., Hajdas
I., Messina P., Pileggi D., Polpetta F. (2019) - The awakening of the dormant Mt Vettore fault (2016 central Italy earthquake, Mw 6.6). Paleoseismic clues on its millennial silences. Tectonics, https://doi. org/10.1029/2018TC005326
Iezzi, F., Mildon, Z., Walker, J. F., Roberts,G., Goodall, H., Wilkinson, M., Robertson, J. (2018) - Coseismic throw variation across along-strike bends on active normal faults: Implications for displacement versus length scaling of earthquake ruptures. Journal of Geophysical Research: Solid Earth, 123, https://doi. org/10.1029/2018JB016732.
Koopmann A. (1983) - Detacment tectonics in the central Apennines, Italy. Geol. Ultraiectina, 30, 1-55.