75 1941-1960
76 1961-1996
77 1997-2017
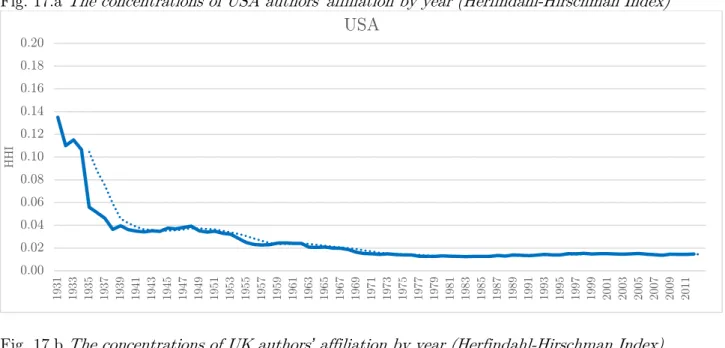
Fig. 17.a The concentrations of USA authors’ affiliation by year (Herfindahl-Hirschman Index)
Fig. 17.b The concentrations of UK authors’ affiliation by year (Herfindahl-Hirschman Index)
Fig. 17.c The concentrations of authors’ affiliation by year (Herfindahl-Hirschman Index)
Sources: elaborations on our own database. Notes: Herfindhal index is computed on ten-year rolling windows.
0.00 0.02 0.04 0.06 0.08 0.10 0.12 0.14 0.16 0.18 0.20 1 9 3 1 1 9 3 3 1 9 3 5 1 9 3 7 1 9 3 9 1 9 4 1 1 9 4 3 1 9 4 5 1 9 4 7 1 9 4 9 1 9 5 1 1 9 5 3 1 9 5 5 1 9 5 7 1 9 5 9 1 9 6 1 19 63 1 9 6 5 1 9 6 7 1 9 6 9 1 9 7 1 1 9 7 3 1 9 7 5 1 9 7 7 1 9 7 9 1 9 8 1 1 9 8 3 1 9 8 5 1 9 8 7 1 9 8 9 1 9 9 1 1 9 9 3 1 9 9 5 1 9 9 7 19 99 2 0 0 1 2 0 0 3 2 0 0 5 2 0 0 7 2 0 0 9 2 0 1 1 HHI USA 0.02 0.04 0.06 0.08 0.10 0.12 0.14 0.16 1 9 3 1 19 33 1 9 3 5 1 9 3 7 1 9 3 9 1 9 4 1 1 9 4 3 1 9 4 5 1 9 4 7 1 9 4 9 1 9 5 1 1 9 5 3 1 9 5 5 1 9 5 7 1 9 5 9 1 9 6 1 1 9 6 3 1 9 6 5 1 9 6 7 1 9 6 9 19 71 1 9 7 3 1 9 7 5 1 9 7 7 1 9 7 9 1 9 8 1 1 9 8 3 1 9 8 5 1 9 8 7 1 9 8 9 1 9 9 1 1 9 9 3 1 9 9 5 1 9 9 7 1 9 9 9 2 0 0 1 2 0 0 3 2 0 0 5 2 0 0 7 20 09 2 0 1 1 HHI UK 0.00 0.01 0.02 0.03 0.04 0.05 0.06 0.07 0.08 1 9 3 1 1 9 3 3 1 9 3 5 1 9 3 7 1 9 3 9 1 9 4 1 1 9 4 3 1 9 4 5 1 9 4 7 1 9 4 9 1 9 5 1 1 9 5 3 1 9 5 5 1 9 5 7 1 9 5 9 1 9 6 1 1 9 6 3 1 9 6 5 1 9 6 7 1 9 6 9 1 9 7 1 1 9 7 3 1 9 7 5 1 9 7 7 1 9 7 9 1 9 8 1 1 9 8 3 19 85 1 9 8 7 1 9 8 9 1 9 9 1 1 9 9 3 1 9 9 5 1 9 9 7 1 9 9 9 2 0 0 1 2 0 0 3 2 0 0 5 2 0 0 7 2 0 0 9 2 0 1 1 HHI
79
Fig. 18. Average number of citations received per article (after 2, 5 and 10 years from publication)
Sources: elaborations on our own database. Notes: data start from the 1970 cohort.
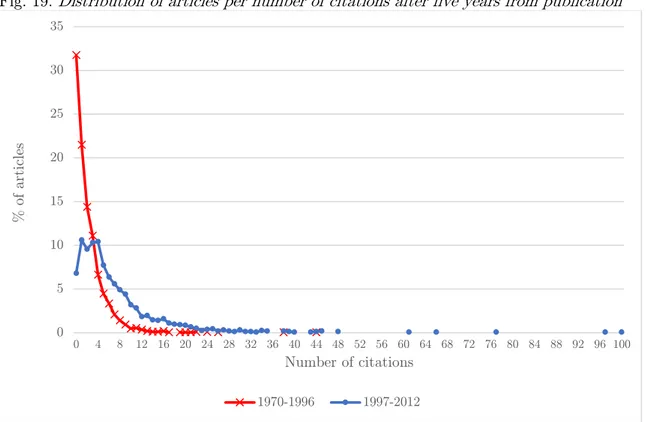
Fig. 19. Distribution of articles per number of citations after five years from publication
Sources: elaborations on our own database.
0 2 4 6 8 10 12 14 16 18 20 1 9 7 0 1 9 7 1 1 9 7 2 1 9 7 3 1 9 7 4 1 9 7 5 1 9 7 6 1 9 7 7 1 9 7 8 1 9 7 9 1 9 8 0 1 9 8 1 1 9 8 2 1 9 8 3 1 9 8 4 1 9 8 5 1 9 8 6 1 9 8 7 1 9 8 8 1 9 8 9 1 9 9 0 1 9 9 1 1 9 9 2 1 9 9 3 1 9 9 4 1 9 9 5 1 9 9 6 1 9 9 7 1 9 9 8 1 9 9 9 2 0 0 0 2 0 0 1 2 0 0 2 2 0 0 3 2 0 0 4 2 0 0 5 2 0 0 6 2 0 0 7 2 0 0 8 2 0 0 9 2 0 1 0 2 0 1 1 2 0 1 2 2 0 1 3 2 0 1 4 2 0 1 5 Av er a g e n umber
Average number of citations (t+2) Average number of citations (t+5) Average number of citations (t+10)
0 5 10 15 20 25 30 35 0 4 8 12 16 20 24 28 32 36 40 44 48 52 56 60 64 68 72 76 80 84 88 92 96 100 % o f a rt icl es Number of citations 1970-1996 1997-2012
80
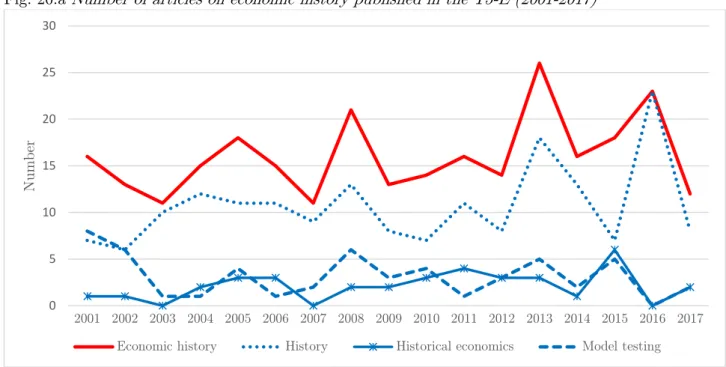
Fig. 20.a Number of articles on economic history published in the T5-E (2001-2017)
Fig. 20.b Share of articles on economic history published in the T5-E (2001-2017)
Sources: elaborations on our own databases.
0 5 10 15 20 25 30 2001 2002 2003 2004 2005 2006 2007 2008 2009 2010 2011 2012 2013 2014 2015 2016 2017 Number
Economic history History Historical economics Model testing
0 1 2 3 4 5 6 7 2001 2002 2003 2004 2005 2006 2007 2008 2009 2010 2011 2012 2013 2014 2015 2016 2017 % o n T o ta l a rt icl es
81
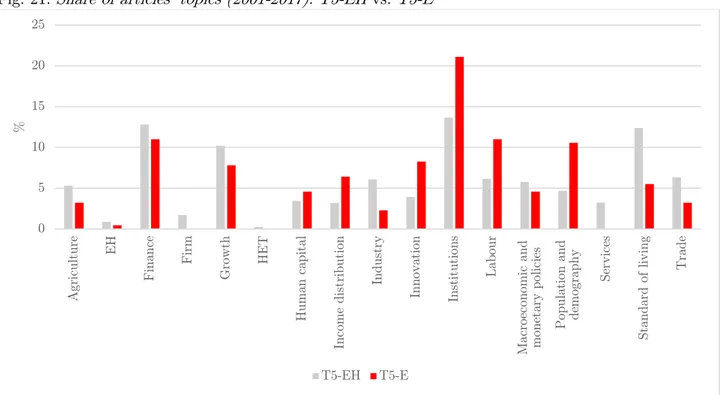
Fig. 21. Share of articles' topics (2001-2017): T5-EH vs. T5-E
Sources: elaborations on our own databases.
Fig. 22. Share of articles by continent (2001-2017): T5-EH vs. T5-E
Sources: elaborations on our own databases.
0 5 10 15 20 25 Ag ri cult ur e EH F ina nc e Fi rm G ro wt h HET Huma n ca pit a l Inc o me dist ri bu ti o n Ind us tr y Inn o v a ti o n Ins ti tu ti o ns La b o ur M a cr o ec o n o mi c a n d mon et a ry po li ci es Pop ul a ti o n a nd de m o g ra ph y Se rv ic es St a nd a rd o f li v ing Tr a de % T5-EH T5-E 0 10 20 30 40 50 60 70
Africa America Europe Asia + Oceania
%