U N I V E R S I T À D E G L I S T U D I D I C A T A N I A
FACOLTÀ DI MEDICINA E CHIRURGIA
DOTTORATO DI RICERCA IN ONCOLOGIA
XXIV CICLO
Coordinatore: Prof.ssa Franca Stivala
Dott.ssa Emilia Caputo
ANALISI MOLECOLARE del MELANOMA
TESI di DOTTORATO di RICERCA
Relatore:
Chiar.mo Prof. Salvatore Travali
INDEX
Introduction………..pag. 2
Materials and Methods………pag. 4
Results………..pag. 7
Discussion………pag. 19
3
INTRODUCTION
Melanoma, the most aggressive form of skin cancer, is increasing faster than that of any other cancer; according to the World Health Organization (WHO) the number of melanoma cases is doubling every 10-20 years.1 Approximately 80% of melanoma patients can be cured by surgical excision when diagnosed at early stage of disease; but, metastatic malignant melanoma is refractory to current therapies with a median survival rate of 6 months.2
To date, no prospective evidence exists to demonstrate clearly the efficacy of prevention and early detection of this tumor. In addition, neither the clinical nor the histological diagnosis of melanoma is 100% accurate.2 Although, recent discoveries in the complex networks involved in melanoma development, have created many opportunities for new therapeutic approaches, still there is a need for improving the response rate to treatments and survival in melanoma patients.3-6
Cancer cell types differ in their susceptibility to chemotherapy, and malignant melanoma, one of the most difficult cancers to treat, is largely unresponsive to conventional chemotherapy resulting in low 5-year survival rates.1,7,8 A detailed understanding of the molecular mechanisms associated with melanoma development and progression is critical for development of efficient therapeutic strategies.
In this study, we analysed the molecular properties of melanoma by using an in vitro model. Taking advantage of the availability of melanoma cell lines and melanocytes, we analysed their protein profiles by a combination of 2D-PAGE and LC-MS/MS mass spectrometry.9 We used two human melanoma cell lines: the A375 cell line, derived from a metastatic melanoma patient10 and the 526 cell line,
4 derived from surgically removed metastatic melanoma lesions of a patient from NCI (Bethesda, MD).11 Both melanoma cell lines are HLA-A2 phenotype; however, while 526 cells were shown to have a high expression of two melanoma associated antigens, MART-1/MelanA and Pmel17/gp100, A375 were shown to have lost the expression of these molecules.11 Furthermore, it has been previously reported that A375 cells show an amelanotic phenotype compared to the 526 cell line. The melanocyte cell line, FOM78, was used as reference in our study.10
We observed differences in protein profiles, relative concentrations and isoform composition, between both melanoma cell lines and melanocyte cells, and also differences in the protein patterns between the two melanoma cell lines. This characterization could be used as a starting point for further studies on the elucidation of molecular mechanisms leading to melanoma development and progression. In addition further studies on the relations between differentially expressed proteins in each cell line and melanocytes will contribute to the identification of molecular pathways differentially altered in different melanomas, which could explain the various response to existing therapeutic treatments for this cancer.
5
MATERIALS and METHODS
Cell lines. Three cell lines were included in this study. FOM 78 was used as
the primary melanocyte cell line10. A375 and 526 were the melanoma cell lines, kindly provided by Dr. F. M. Marincola and Dr. M. Bettinotti (NIH, Bethesda, USA). The melanocyte cell line was cultured in MBM-4 (Lonza) cell medium, according to the manufacturer’s procedures. The melanoma cell lines were cultured in RPMI 1640 medium (Invitrogen-GIBCO), supplemented with 3 mM L-glutamine (Invitrogen-GIBCO), 2 % penicillin/streptomycin, and 10 % FBS (EuroClone). All cell cultures were incubated at 37 °C in a humidified 5 % CO2 atmosphere. Cells were harvested at 80% confluence and protein extraction was performed for further examination.
Cell lysate and two-dimensional gel electrophoresis. Cells were washed
with PBS (pH 7.4) and lysed in 1% Nonidet P-40, 150 mmol/L NaCl, 10 mmol/L Tris (pH 7.4), 1 mmol/L EDTA, 1 mmol/L EGTA (pH 8), 0.2 mmol/L sodium orthovanadate, 0.2 mmol/L phenylmethylsulfonylfluoride buffer for 30 minutes at 4 °C withconstant agitation. The cell lysates were then subjected to a centrifugation (16,000 x g at 4 °C) for 15 minutes to remove insoluble materials. The protein concentrations of supernatants were measured by the Bradford assay. One hundred microgramsof the protein extract from each cell line were first subjected to clean up procedure, using the Clean-up kit (Bio-Rad), as described by the supplier. The resulting protein pellets were then solubilised in 125 µL GE Healthcare rehydration buffer for separation by isoelectrical focusing. Ready-made, 7-cm, isoelectric-focusing, immobilized pH gradient (IPG) strips with a linear gradient of pH 3 to 10 (Bio-Rad) were used. Rehydration of the IPG strips was
6 performed overnight, after which proteins were focused at 8000 volt-hours on a PROTEAN IEF apparatus (Bio-Rad). Before the second dimension, IPG strips were equilibrated in 1% dithiothreitol (wt/vol) followed by 2.5% iodoacetamide (wt/vol), both in 50 mM Tris-HCl (pH 8.8), 6 M urea, 30% glycerol, and 2% SDS, for 15 minutes. After this procedure, the strips were placed on top of 12.5 % polyacrylamide gel and run at 5 W/gel for 1 hour and subsequently 15 W/gel until the bromophenol blue dye front reached the bottom of the gels. Proteins were visualized with either silver or Coomassie G250 staining and scanned by the ChemiDoc XRS system (Bio-Rad Laboratories). If not indicated, chemicals were molecularbiology grade from Sigma.
Image Analysis. Protein spots were analyzed and quantified for differential
expression patterns between gels, using Image Master 2D Platinum software 7.0 (Amersham Biosciences). Protein spots from different gels were matched to each other and represented in a virtual image, called the Master Image, that includes all information about all the spots in all the gels. Quantitative variations in protein expression levels were calculated as the volume of the spot. To correct for differences between gels in gel staining, spot volumes relative to the sum of the volume of all spots on each gel (% Vol) were calculated by the software. In addition individual spot % Vol was normalized for the actin % Vol value for comparative profiling.
Mass Spectrometry.Protein spots of interest were excised from the gel and digested with modified trypsin (Sigma), as previously described.85 All samples were run on a Thermo Scientific LTQ mass spectrometer. Each sample was loaded onto a Biobasic C18 PicofritTM column and was separated by an
7 increasing ACN gradient. An MS scan was performed to select the 5 most intense ions prior to MS/MS analysis. The raw mass spectral data was analysed using Bioworks Browser 3.3.1 SP1, a proteomic analysis platform. All MS/MS spectra were sequence database searched using the algorithm TurboSEQUEST. The MS/MS spectra were searched against the IPI v3.59 database (80128 entries). Protein and peptide probabilities were calculated by the Protein and Peptide Prophet algorithms (Trans Proteomic Pipeline, Institute of System Biology, Seattle, USA). Peptide identifications were accepted if they could be established at greater than 95.0% probability as specified by Peptide Prophet algorithm. Protein identifications were accepted if they could be established at greater than 99.5% probability and contained at least 2 identified peptides.
Western Blot Analysis. For the analysis of the reactivity of protein extracts
against anti-galectin-1 antibody, the protein extracts (4 g) were separated by 2D-PAGE to resolve the different isoforms, and then electro-transferred to Immobilon-P membranes (Millipore), according to standard procedures. For the analysis of reactivity against anti-PP2A antibody, the protein extracts (4 g) were separated by SDS-PAGE. A rabbit polyclonal antibody against galectin-1, diluted 1/10,000 (ab25138; Abcam), a mouse monoclonal antibody against PP2A protein, diluted 1/1000 (05-421; Upstate) and a rabbit polyclonal to actin, diluted 1/ 10,000 (ab37063; Abcam) were used. The visualization was done by horseradish peroxidase-labeled anti-rabbit and anti-mouse antibodies (Cell Signaling) and the ECL chemiluminescence detection system (Amersham Pharmacia Biotech). The image analysis of the detected spots after western blot was performed by Image J software.
8
RESULTS
Protein Analysis of A375, 526, and Melanocytes cells. Protein patterns of
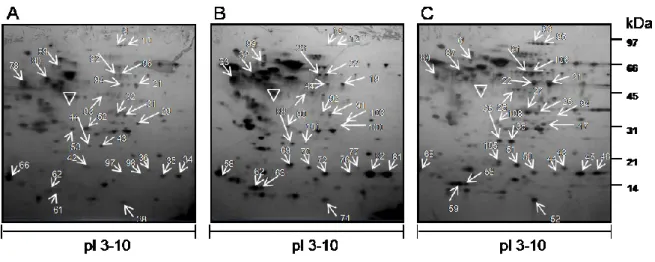
two distinct human melanoma cell lines, A375 and 526, and of the primary melanocyte cell line, FOM 78 were compared in the pH range 3-10, to obtain a global representation of protein patterns on 2D-PAGE. To minimize gel-to-gel variations in the resulting proteome patterns, a set of four gels from each of the A375, 526 and FOM-78 were run simultaneously. Silver mass-compatible methodology was utilized to detect individual protein spots in each gel. Only gels resulting in very well-resolved protein patterns were used for subsequent quantitative analysis sets. A representative 2D-PAGE map for each cell line is shown in Fig. 1.
Fig. 1. Protein profiles of Melanocyte and Melanoma cell lines. 100 g of cellular protein extracts were loaded on immobilized pH gradient strip (pH 3–10) in the first dimension. The second dimension was 12.5% SDS-PAGE. The proteins were visualized by silver mass-compatible staining and evaluated by Image Master 2D Platinum software 7.0. Panel (A) melanocytes; (B) 526; (C) A375 cells. The proteins identified in each gel are annotated by numbers. Protein names are found in Table 1. This symbol indicated the Actin protein on each gel.
9 Spots showing a fold intensity increase value ≥ 2, with respect to the intensity of the corresponding spot in comparator gels, after normalization, were considered differentially expressed in our study. Gel plugs containing the protein spots of interest were picked from the 2-D gels for trypsin digestion and LC-MS/MS analysis. The proteins identified with high score, as described in Materials and Methods, are reported in Table 1.
Comparative analysis of observed and calculated molecular mass and pI values obtained from the database generally showed a strong correlation for each of the identified proteins, which ensured the validity of the individual protein matches. Interestingly, several highly basic proteins appeared in the gel as more acidic variants, which could be an indication of pronounced protein phosphorylation. Examples of potentially phosphorylated proteins included galectin-1, isoform alfa-enolase of alfa-enolase, cofilin-1, elongation factor 2, cyclophilin A, inosine-5'-monophosphate dehydrogenase 2 and annexin a1.
10 Table 1. List of 2D-PAGE separated proteins identified by LC-MS/MS from Melanocytes, 526 and
A375 cell line. All the identifications have a minimum probability of 1 as given by ProteinProphetTM
software. The protein spot, the percentage coverage and the SwissProt Accession number for each identification is reported. Different isoforms of the same protein are indicated by alphabetical letters, starting from the more acidic one. ND indicated spot not detected on gel by image analysis and NI indicated protein not identified by LC-MS/MS.
11
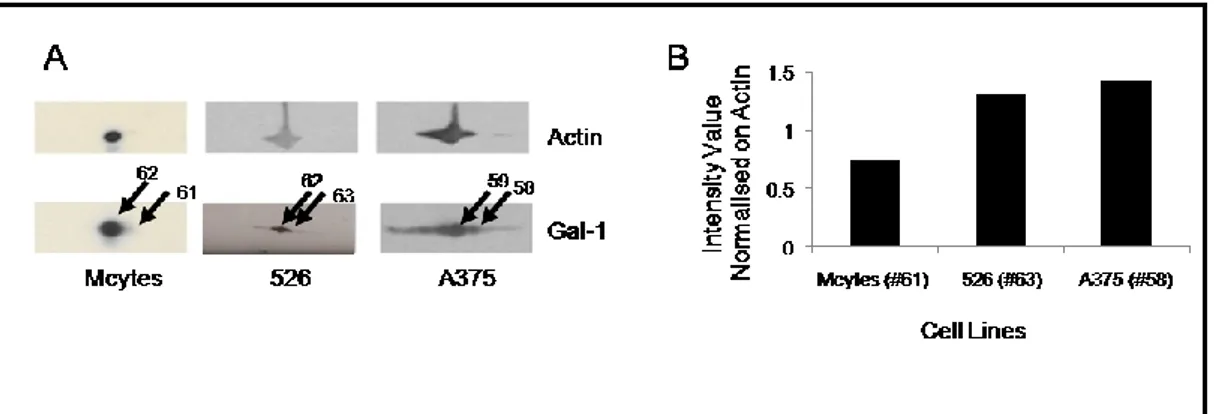
Proteins differentially expressed in Melanoma vs Melanocytes. Six proteins
showed significant differences in spot intensity between melanoma and melanocytes (Fig. 2).
We identified differential expression of galectin-1 in melanocytes vs melanoma cells. As shown in Fig. 2, panel A, Gal-1 expression was increased approximately 13-fold in A375 line [spot #58] and 11-fold in 526 [spot #63] cells, as compared to melanocytes [spot #61]. The same protein was also identified in spot #62 of melanocytes, corresponding to spot #62 in 526 and spot #59 in A375 cells (Fig. 2; tab. 1). These latter spots, that may represent a more acidic post-translationally modified form of the protein, showed an intensity increase in melanoma cells compared to melanocytes less than 2-fold (approximately 1.7-fold in 526 cells and 1.9-fold in A375 cells, respectively). Thus, differential increase in expression of two forms of Gal-1 occurs in melanoma cells.
We also observed, in the melanoma cell lines, an increased expression of the spots identified with high score as protein DJ-1 (Fig. 2, Panel B). Here again, we found two distinct forms of protein DJ-1. These spots [spot #43 and #44 on the melanocytes gel, #35 and #36 on the A375 gel and # 88 and # 101 on the 526 gel] were at the same molecular weight, but different isoelectric points. We observed a significant difference in intensity for the more acidic form in both melanoma cell lines compared to melanocytes. In addition, we found that the basic and acidic forms gave similar intensity in A375 cells and in melanocytes, while in 526 the acidic form predominated over the basic one, as calculated by image analysis.
Three proteins, identified as cyclophilin A [CypA], inosine-5’-monophosphate dehydrogenase 2 [IMPDH2] and serine/threonine-protein phosphatase 2A 65 kDa regulatory subunit A alpha isoform [PP2A], were also
12 more abundant in both melanoma cell lines compared to the melanocytes (Fig. 2 panel C, D and E).
Panel C showed the presence of four different isoforms of CypA in all cell lines. The major difference in the expression of these isoforms between the melanoma and melanocytes cells was found for the isoform indicated as CypAc. It was increased approximately 6.4-fold in 526 [spot #82] and 4.5-fold in A375 [spot #45] compared to melanocytes [spot #35].
IMPDH2 was increased approximately 2.4-fold in 526 [spot #23] and 2.2-fold in A375 [spot #91] compared to melanocytes [spot #92] and PP2A approximately 7.7-fold in 526 [spot #99] and 11.3-fold in A375 [spot #6] compared to melanocytes [spot #89], (panel D and E, respectively).
Quite disparate spots were identified as cofilin-1 from the A375 gel [spots #105, #51 and #43] and the 526 gel [spots #69, #70 and #77] (Fig. 2, panel F), suggesting that three different forms of cofilin-1 were present in both melanoma cell lines, presumably due to differences in post-translational modifications. Here, we indicated these forms as cofilin-1a, cofilin-1b and cofilin-1c, starting from the more acidic one. However, only two spots [#42 and #36], corresponding to cofilin-1a and cofilin-1c, were found in the melanocyte gel. Thus, the cofilin-1b form seems to be mainly present in melanoma cells and not in melanocytes.
13 Fig. 2. Proteins more highly expressed in 526 and A375 melanoma cell lines than in melanocytes.
Protein spots are marked on the gel from each cell line. The histogram represents the intensity value for the indicated spot, calculated by Image Master 2D platinum software and normalised on actin intensity value. When present, the different isoforms of the same protein are indicated by alphabetical letters, starting from the more acidic one.
14
Proteins differentially expressed between the two melanoma cell lines.
Specific increases were also noted in the normalized intensity values of some spots, derived from the A375 cell line only, compared to corresponding spots from the melanocyte gel. These spots were identified as: s-methyl-5-thioadenosine phosphorylase, [MTAP], ubiquitin and ribosomal protein S27 a precursor [RPS27A], the basic isoform of protein DJ-1 [DJ-1b], annexin a1 [AnxA1], proliferation associated protein 2g4 [PA2G4], isoform alfa-enolase of alfa-enolase [ENO1], protein disulfide-isomerase precursor [PDI] and elongation factor 2 [eEF2] (Fig. 3). For most of these proteins, corresponding spots were also detected in the 526 gels, but they had equivalent or even lower intensity than the spots from the melanocyte gel.
MTAP was identified in spot #47 from the A375 gel and in spot #100 from the 526 gel, but not detected in melanocytes (Fig. 3, Panel A). Spot intensity was 5-fold higher in A375 compared to the corresponding spot in the 526 gel.
Similarly, PA2G4 was detected at a low intensity in melanocytes than A375, but was absent in the 526 gel.
15 Fig. 3. Proteins more highly expressed in A375 compared to 526 cell lines. Protein spots are
marked on the gel from each cell line. The histogram represents the intensity value for the indicated spot, calculated by Image Master 2D platinum software and normalised on actin intensity value.
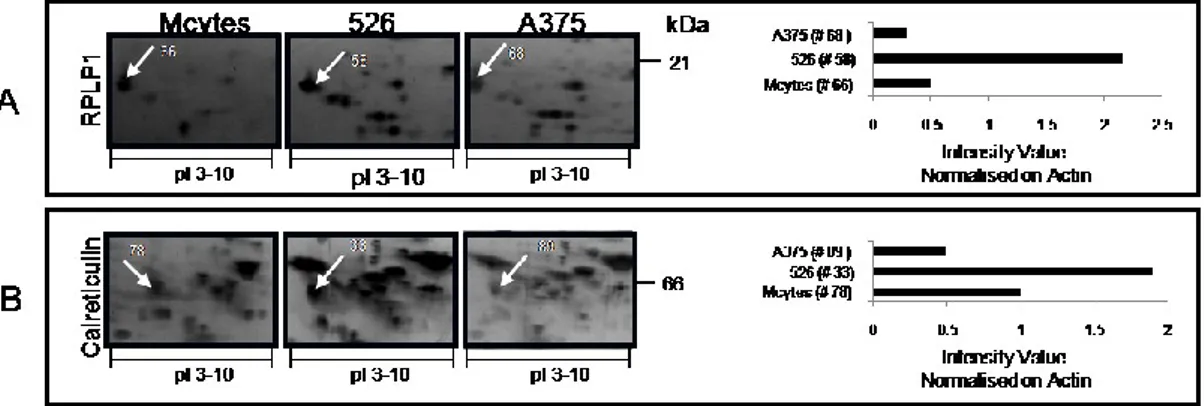
16 Two proteins were also identified that were present in higher concentrations in 526 cells over the levels seen in melanocytes and A375 cells. These were the 60s acidic ribosomal protein p1 [RPLP1] and calreticulin precursor [CALR] (Fig. 4).
Fig. 4. Proteins more highly expressed in 526 compared to A375 cell lines. Protein spots are
marked on the gel from each cell line. The histogram represents the intensity value for the indicated spot, calculated by Image Master 2D platinum software and normalised on actin intensity value.
17
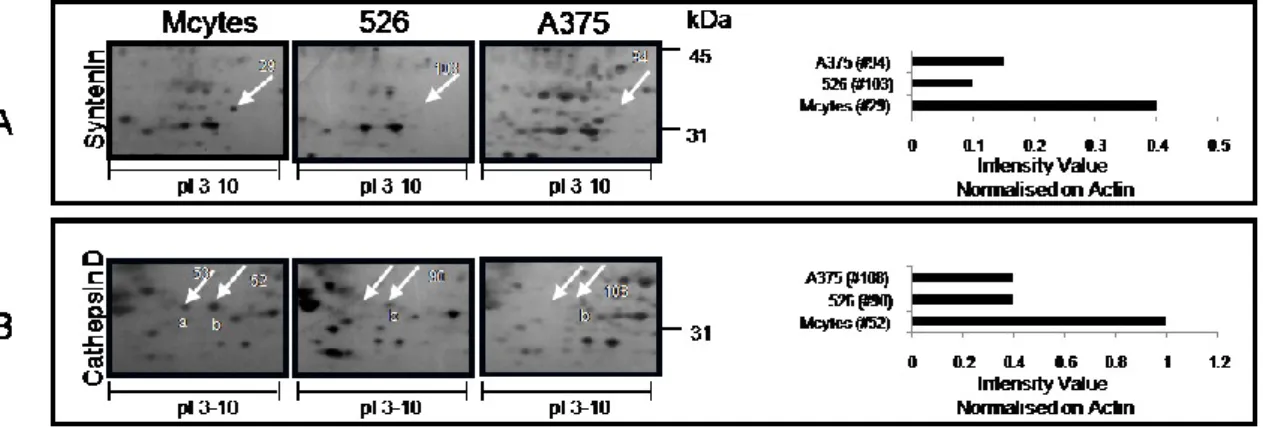
Proteins mainly expressed in melanocytes. Of particular interest, we
observed the synthenin1 protein with 3-4-fold higher expression in melanocytes [spot #29] compared to spot #103 on 526 gel and spot #94 on A375 gel (Fig. 5, panel A). In addition, cathepsin D was found in two protein spots in melanocytes [spots #53 and #52]; both had masses corresponding to the 34-kDa form and showed increased intensities in melanocytes compared to the melanoma cell lines (Fig. 5, panel B).
Fig. 5. Proteins more highly expressed in melanocytes than in melanoma cell lines. Protein spots
are marked on the gel from each cell line. The histogram represents the intensity value for the indicated spot, calculated by Image Master 2D platinum software and normalised on actin intensity value.
18
Validation of LC- MS/MS data by Western Blot. In order to confirm some of
the data obtained by LC-MS/MS, we analysed the protein extracts from the melanocytes, and the 526 and A375 melanoma cell lines for their reactivity against the anti-Gal-1 and anti-PP2A antibodies.
We probed Gal-1 after 2D-PAGE separation. We found that Gal-1 was present in melanocytes mainly as the acidic form (Fig. 6 A), confirming the previous obtained data [spot #62 in melanocytes corresponding to spot #62 in 526 and to spot #59 in A375 cells] (Fig. 2 panel A). The densitometry analysis revealed small differences in the intensity value for Gal-1a in both melanoma cell lines vs melanocytes (histogram not shown), while we observed a strong intensity increase in spots corresponding to the basic form [Gal-1b] in both melanoma cell lines vs melanocytes, as reported in the histogram (Fig. 6 B). In addition, other more acidic forms of Gal-1 were detected by western blot only in melanoma cell lines, suggesting that Gal-1 conformational changes or post-translational modifications may play a role in melanoma development.
Fig. 6. Western Blot analysis of protein extracts derived from Melanocytes, 526 and A375 cell lines
against anti-Galectin-1 Ab. Protein reactivity against anti-Galectin-1 polyclonal antibodies was
examined after 2D-PAGE. Electrophoretic conditions were the same as those in Fig. 1 (A). A histogram representing the intensity values for the detected spots calculated by densitometric analysis was reported (B). Normalization on actin was performed.
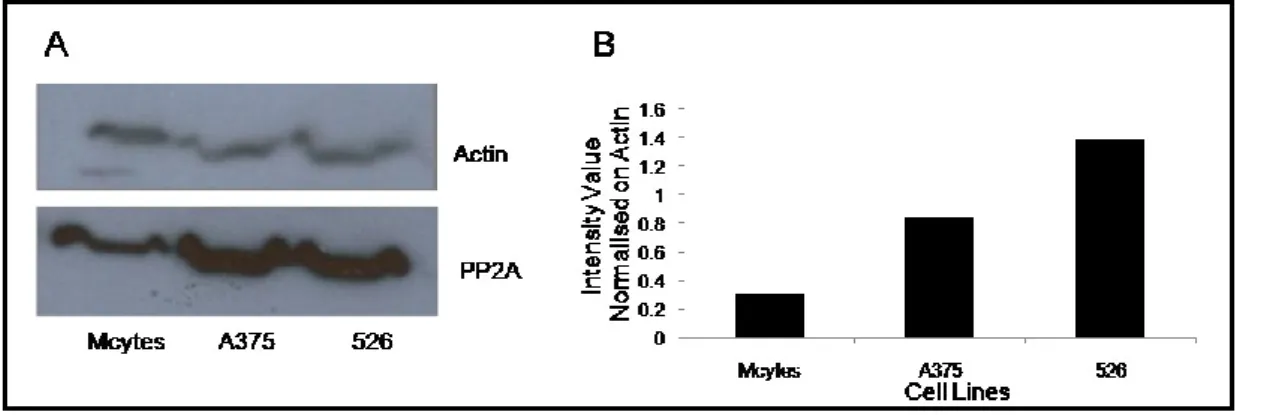
19 We also were able to detect PP2A in the cell extracts after 1D-PAGE and to confirm the 2D-PAGE findings where higher levels of this protein was found in melanoma cell lines compared to melanocytes (Fig. 7).
Fig. 7. Western Blot analysis of protein extracts derived from Melanocytes, 526 and A375 cell lines
against anti-PP2A Ab. Protein reactivity against anti-PP2A antibodies was examined after
SDS-PAGE (A). A histogram representing the intensity values for the detected bands calculated by densitometry analysis was reported (B). Normalization on actin was performed.
20
DISCUSSION
In this study, by comparative proteome analysis, we identified several proteins differentially expressed in melanoma cell lines compared to melanocyte cells, which may be further exploited as individual biomarkers or as a biomarker panel and/or therapeutic targets for this cancer.
In particular, we identified galectin-1 [Gal-1], cyclophilin A [CypA], protein DJ-1, inosine-5'-monophosphate dehydrogenase 2 [IMPDH2], serine/threonine-protein phosphatase 2A 65 kDa regulatory subunit A alpha isoform [PP2A] and cofilin-1, as potential components of a molecular signature in melanoma.
Gal-1, a proto-type member of galectin family, has recently emerged, together with Gal-3, to play a critical role in tumor progression and metastasis, modulating different biological events.12,13 Its ability to interact with glycoproteins is
responsible for the homotypic aggregation of tumor cells and emboli formation, underlying mechanisms for hematogenous metastasis formation and immune escape.14 In addition to its carbohydrate-binding ability, Gal-1 is involved in several protein-protein interactions15 and seems to promote programmed cell death and apoptosis in activated T cells.16 Gal-1 has recently been reported to be implicated
in temozolomide resistance in a mouse metastatic melanoma model.17 Furthermore, it seems to have a novel growth factor–like function, including the promotion of tumor neo-angiogenesis, by increasing both endothelial cell viability and adhesion.18
We show, for the first time, the presence of different Gal-1 isoforms in melanoma cell lines, with only one prevalent form observed in melanocytes. The existence of these isoforms was already suggested by the analysis of the primary sequence revealing potential phosphorylation and/or acetylation sites.19, 20 Although the nature of these post-translational modifications is not yet known,
21 these findings could lead to the targeting of individual galectins, without interfering with the functions of other members. All together these data indicate Gal-1 as an excellent target for combined cancer therapy.
CypA, found in this study to be mainly expressed in melanoma cells, has been previously demonstrated to be over-expressed in several cancers with its high expression levels correlating with poor patient outcome.21-24 CypA has peptidylprolyl cis-trans isomerase activity and seems to play key roles in protein folding, immune-modulation and cell signaling. We describe, for the first time the presence of four CypA isoforms in melanoma, the probable result of post-translational modifications,20 with a major increase of the CypAc isoform. The mechanism by which this protein contributes to cancer progression appears to involve a complex interplay of proteins and pathways, including the membrane receptor for CypA, CD147, and CypA binding partners inside the cells, such as calreticulin [CALR], HSP90 and histone deacetylase.25, 26 However, which of the different CypA isoforms interacts with these proteins is unknown.
Interestingly, we found CALR predominantly expressed in the 526 melanoma cells, suggesting a different equilibrium between CALR and CypA in 526 cells compared to A375 cells, that may alter specific molecular pathways in these two melanoma cell lines. Recently, CypA was found to be more abundant in metastatic melanoma compared with primary melanoma and normal fibroblasts. 27
CypA is also a highly selective binding partner of cyclosporine A [CsA], which activates apoptotic pathways in primary and metastatic melanoma cells; higher CypA levels may lead to a decrease in free CsA, leading to tumor growth and metastasis. 28-30 These data, together with a more detailed knowledge of CypA pathways, may lead to novel therapeutic strategies in melanoma.
22 DJ-1 was also found to be differently modulated in melanoma cell lines and melanocytes. Up-regulation of DJ-1 in several cancers, including prostate, ovarian, breast and lung carcinomas, is interestingly associated with decreased level of autophagy.31 DJ-1 is able to directly bind to nuclear p53, repressing its transcriptional activity, but it also seems that DJ-1 regulates autophagy through the Beclin-1 pathway in a p53 independent manner. DJ-1 regulates Beclin-1 transcription via ASK1/JNK pathway in stress conditions, down-regulating both mRNA and protein levels. Beclin-1 seems to possess a tumor suppressor role for autophagy, since in many tumor cell lines restoration of Beclin-1 promotes autophagy and represses tumorigenesis.31
The acidic form of DJ-1 has been previously demonstrated to regulate the phosphatidylinositol-3,4,5-trisphosphate 3-phosphatase [PTEN] activity, leading to cell proliferation and transformation.32 We describe a specific increase of the acidic form of protein DJ-1 in both melanoma cell lines. An increase of the acidic form [oxidized] compared to the basic one [reduced] has been previously described in human pneumocytes after H2O2 induced-stress.33 Since we also found a low
expression level of the basic isoform in 526 cells, we suggest that 526 and A375 cells may adopt these two DJ-1 forms differently under stress conditions.
Finally, DJ-1 protein has been described as a potential noninvasive biomarker for uveal malignant melanoma.34
Another interesting protein we found differentially expressed in melanoma cells is IMPDH2, a rate-limiting enzyme of the branched purine nucleotide synthetic pathway that provides guanylates including GTP and dGTP. Two isoforms of IMPDH have been described: type 1 is constitutive while type 2 is expressed in highly proliferating cells, such as cancer.35 IMPDH2 was reported in colorectal cancer36 and its direct involvement in osteosarcoma chemo-resistance
23 to cisplatin and methotrexate has been described.37 Thus, IMPDH2 has been proposed as a novel, promising tumor biomarker and therapeutic target: its inhibition results in the depletion of guanine nucleotide pools, induction of p53 activity, cell growth inhibition, cell cycle arrest/block, differentiation, and/or cell death. However, although trials of IMPDH2 inhibitors, such as tiazofurin and benzamide riboside, have been conducted in patients with leukemia and multiple myeloma with very promising results, studies were terminated due to neurotoxic side effects.38
No data are available on the use of specific IMPDH2 inhibitors for melanoma treatment.
PP2A is a trimeric serine/threonine phosphatase: the regulatory subunit B is recruited by a C-A dimer, composed of the catalytic subunit C and the structural subunit A. PP2A activity is regulated by posttranslational modification such as phosphorylation or methylation.39,40 PP2A is one of the major regulators of the Akt/PKB pathway, by Akt dephosphorylation.41, 42 The Akt/PKB pathway is implicated in cell proliferation, protein synthesis, resistance to apoptosis and is often mutated in cancer. 41-43
It has been recently demonstrated, in B16 melanoma cells, that PP2A, depending on its methylation status, regulates cell proliferation, through the down-regulation of Akt and Myc oncoproteins, and tumor aggressiveness; PP2A is also strongly activated during the primary response to DNA damage.44 These data suggested that agents with PP2A pro-methylating activity might be candidates for anticancer drug development.
Moreover, fostriecin, an antibiotic produced by Streptomyces pulveraceus, has been utilized as PP2A-selective inhibitor in a phase I clinical study showing promise as cancer-killing agent. 45, 46 Unfortunately, fostriecin was found to be
24 highly susceptible to oxidation, and the phase I clinical trials were suspended because of drug instability and inadequate purity of the naturally produced compound for clinical supply.45 Our finding of significant increases of PP2A in
melanoma support the continuation of efforts to discover more effective inhibitors of this enzyme.
PP2A is also a putative binding molecule for cofilin-1.47
In this study, we found cofilin-1, a regulator of actin-polymerization initiation, highly expressed in both melanoma cell lines as cofilin-1b, while cofilin-1a and c isoforms were found in melanocytes. The binding properties of these three isoforms of cofilin-1 is unknown, neither is it known if the altered equilibrium among these isoforms could affect the activity of the cofin-1 pathway, particularly in melanoma cells.48, 49
Cofilin-1 mRNA and protein expression are negative prognostic factors in several cancer types, such as epithelial ovarian cancer or non-small cell lung cancer, due to the capacity to enhance cell motility and metastasis and to confer resistance to alkylating drug treatment. 50, 51
Besides proteins that were more highly expressed in melanoma cells compared to melanocytes, we found interesting differences between the two melanoma cell lines, that may help to understand the heterogeneity of melanomas. Two proteins were identified that were more highly expressed in 526 cells than in melanocytes and even more markedly than in A375 cells: 60s acidic ribosomal protein p1 [RPLP1] and calreticulin [CALR].
RPLP1 has not been studied in melanoma, but its expression increases upon selection for resistance to paclitaxel in breast cancer cell lines.52
CALR is a component of the antigen-processing machinery [APM] and changes in its expression level may affect immune response in melanoma
25 patients.53 It has been found to be over-expressed in other tumors, such as lung adenocarcinoma where it could play a role as transcriptional regulator54 and in hepatocellular carcinoma where it has been related to poor prognosis.55 CALR
may also regulate cell migration and proliferation, as demonstrated for keratinocytes and fibroblasts;56 after antitumoral treatment, low CALR expression levels accompany inhibition of cell proliferation, although, according to its ability to modulate several immunological mechanisms, neoplastic cells may be protected from phagocytosis and antitumor immunity.57, 58
Eight proteins were more highly expressed in A375 cells compared to melanocytes and 526 cells.
s-Methyl-5-thioadenosine phosphorylase [MTAP], a constitutively expressed enzyme in most normal cells and tissues, plays a significant role in polyamine metabolism catalysing the phosphorylation of methylthioadenosine [MTA]. Lack of MTAP activity was shown in several malignant diseases and a significant inverse association has been found between MTAP protein expression and progression of melanocytic tumors.59
In contrast, we did not detect MTAP in normal melanocyte cells and levels of this protein were 5.22-fold higher in A375 cells than in the 526 melanoma cell line. This discrepancy could be due to the different methodology utilized for the MTAP detection; in fact, we identified MTAP by LC-MS/MS in spot #47 in A375 gel and spot #100 in 526 gel, and there was no corresponding spot in melanocytes. However, we cannot exclude the presence of this protein in other spots.
MTAP may represent a highly promising immunohistochemical marker for prognosis and interferon response in malignant melanoma patients, although clinical trials are needed to validate its predictive value.59 Our results should be
26 further investigated in order to evaluate differences in MTAP expression and/or activity and disease variability.
An increase of both acidic and basic annexin-a1 [AnxA1] isoforms were found in A375 compared to melanocytes and 526 cells.
AnxA1 has been identified in mouse melanoma cell lines by comparative proteomic studies and it seems to enhance invasion and melanoma dissemination.60 Moreover, recently it has been demonstrated that tumor growth and metastasis are significantly decreased by using AnxA1-KO mice,61 suggesting a crucial role in vascular endothelial cell sprouting, wound healing, and tumor growth and metastasis. Therefore, AnxA1 may be exploited as a new functional target for repairing damaged tissue and treating diseases such as cancer.
Another protein mainly expressed in A375 cell line is alpha-enolase [ENO1], a well known enzyme involved in glycolysis, found as multiple distinct spots on the 2D-PAGE, presumably due to post-translational modifications.
Genes of the glycolytic pathway are over-expressed in more than 70 % of human cancer cases62 and antibodies against this protein have been identified in patients with melanoma, making this factor attractive for the design of novel diagnostic tools for the early detection of cancer.63 High ENO1 levels may result in accelerated ATP production, acting as a metabolic tumor promoter and conferring a selective growth advantage. It has recently been reported that retinoic acid [RA] treatment causes the down-regulation of ENO1 in human follicular thyroid carcinoma cell lines causing Myc oncoprotein down-regulation and reduction in cell invasiveness.64 These data suggest that this pathway could be investigated as
a novel targeting pathway for supportive RA therapies in thyroid cancer. These would also be worth testing in melanoma.
27 Also for the eukaryotic elongation factor 2, eEF2, serum antibodies have been identified in patients with melanoma.63 In this study, we found eEF2 highly expressed in the A375 melanoma cell line. This protein has been previously reported to be involved in promoting G2/M progression and to enhance the in vitro and in vivo growth of gastrointestinal cancers.65
Among the proteins highly expressed in A375 cell line, we also found the ubiquitin and ribosomal protein S27a [RPS27a], a molecule that plays critical roles in protein biosynthesis, being indispensable for translation. This multifunctional ribosomal protein is expressed at high levels in a wide variety of actively proliferating cells and tumor tissues. Although a precise functional role for this protein is largely unknown, many ribosomal proteins have extra-ribosomal functions66 and it has been already reported as a useful marker for melanocytic lesions at immunohistochemical level.67
The stress–response chaperone, PDI, was also expressed at higher level in A375 melanoma cell line. PDI levels were reported to correlate with cancer invasion, metastasis, and drug resistance in other tumor types68–70 and have been found over-expressed in melanoma,71, 72 suggesting a potential use as therapeutic target.73
Also highly expressed in A375 is PA2G4, known as ErbB3-binding protein 1 or EBP1, a proliferation-associated protein, that has been shown to be expressed at high levels in breast cancer patients with poor clinical outcomes.74
PA2G4 was shown to be expressed at higher levels in breast cancer stem cells, where along with other proteins it was thought to contribute to chemotherapy resistance, suggesting that PA2G4 could be considered as future therapeutic target in breast cancer.75
28 This protein has been also identified in colorectal tumors, as tumor associated antigen, and a possible role as target for anti-cancer immunotherapy has been suggested.76
Finally, some proteins were found that were down-regulated in melanoma cell lines compared to melanocytes. Syntenin1, also known as MDA-9 protein [Melanoma Differentiation Associated gene-9], is a tandem PDZ protein that has been reported to be over-expressed in several cancer cells and tissues, melanoma included, and that might play an active role in tumour cell invasion and metastasis.77-80 In our experimental model, we observed that this molecule is expressed in normal cells but not in melanoma.
As previously reported,81 we found cathepsin D [CTSD] more highly expressed in melanocytes compared to melanoma cells. CTSD is a ubiquitous lysosomal aspartyl endoproteinase, which is processed from an inactive procathepsin D to an active 48-kDa single-chain molecule.82 Controversial data are reported on the expression of CTSD and on its role in cancer progression, especially in melanoma.81,82 The lower presence of this enzyme in melanoma cells may not be the result of a down-regulation of this factor, but rather the effect of a major secretion in the secretome of tumor cells. The lysosomal acid proteinase cathepsin D is believed to be associated with proteolytic processes leading to the invasion and seeding of tumor cells. An association between CTSD tissue concentration and aggressiveness of tumors has also been detected in different cancer types, as well as in metastatic melanomas;83 recently CTSD secretion has been reported to be related to uveal melanoma invasion potential in vitro.84
We describe two isoforms of CTSD, which could reflect different N-glycosylation of the molecule on its two potential N-N-glycosylation sites. Further
29 investigation on these two isoforms, their location and their proteolytic activity may help to explain the controversial data on the role of CTSD in melanoma.
In conclusion, this study provides new insights into melanoma, which could be useful for diagnostic marker and therapeutic target development. Furthermore, the characterization of these cell lines make them useful as a model in vitro for further functional studies in the field of melanoma biology.
30
REFERENCES
1. Gray-Schopfer V, Wellbrock C & Marais R. Melanoma biology and new targeted
therapy. Nature 2007; 445: 851-7.
2. Korn EL, Liu PY, Lee SJ, Chapman JA, Niedzwiecki D, Suman VJ, et al.
Meta-analysis of phase II cooperative group trials in metastatic stage IV melanoma to determine progression-free and overall survival benchmarks for future phase II trials. J Clin Oncol. 2008; 26: 527-34.
3. Villares GJ, Zigler M and Bar-Eli M. The Emerging Role of the Thrombin
Receptor (PAR-1) in Melanoma Metastasis - a Possible Therapeutic Target. Oncotarget 2011; 2: 8 – 17.
4. Kuo MT, Savaraj N, and Feun LG. Targeted cellular metabolism for cancer
chemotherapy with recombinant arginine-degrading enzymes. Oncotarget. 2010; 1: 246–51.
5. Beloueche-Babari M, Arunan V, Jackson LE, Perusinghe N, Sharp SY,
Workman P, and Leach MO. Modulation of melanoma cell phospholipid metabolism in response to heat shock protein 90 inhibition. Oncotarget. 2010; 1: 185–97.
6. Haferkamp S, Tran SL, Becker TM, Scurr LL, Kefford RF and Rizos H. The
relative contributions of the p53 and pRb pathways in oncogene‐ induced melanocyte senescence. AGING 2009. 1: 542-56.
7. Schmidt P and Abken H. The beating heart of melanomas: a minor subset of
cancer cells sustains tumor growth. Oncotarget 2011; 2: 313 – 320.
8. Koomen JM, & Smalley KSM. Using quantitative proteomic analysis to
understand genotype specific intrinsic drug resistance in melanoma. Oncotarget 2011; 2: 329 – 35.
31
9. Chamrad D & MeyerHE. Valid data from large-scale proteomics studies. Nature Methods 2005; 2: 647-8.
10. Herlyn M, Thurin J, Balaban G, Bennicelli JL, Herlyn D, Elder DE, et al.
Characteristics of cultured human melanocytes isolated from different stages of tumor progression. Cancer Res. 1985; 45: 5670-76.
11. Cormier JN, Panelli, MC, Hackett JA, Bettinotti MP, Mixon A, Wunderlich J, et
al. Natural variation of the expression of HLA and endogenous antigen modulates CTL recognition in an in vitro melanoma model. Int. J. Cancer 1999; 80: 781-90.
12. Toscano MA, Ilarregui JM, Bianco GA, Campagna L, Croci DO, Salatino M, et
al. Dissecting the pathophysiologic role of endogenous lectins: glycan-binding proteins with cytokine-like activity?Cytokine Growth Factor Rev. 2007; 18: 57-71.
13.
Perillo NL,
Marcus ME, Baum LG. Galectins: versatile modulators of cell
adhesion, cell proliferation and cell death. J Mol Med. 1998; 76: 402-12.
14. Iurisci I, Cumashi A, Sherman AA, Tsvetkov YE, Tinari N, Piccolo E, et al; Consorzio Interuniversitario Nazionale Per la Bio-Oncologia. Synthetic Inhibitors of Galectin-1 and -3 Selectively Modulate Homotypic Cell Aggregation and Tumor Cell Apoptosis, Anticancer Res 2009; 29: 403-10.
15. Camby I, Le Mercier M, Lefranc F, Kiss R. Galectin-1: a small protein with major functions. Glycobiology 2006; 16[11]: 137R-57R.
16. Matarrese P, Tinari A, Mormone E, Bianco GA, Toscano MA, Ascione B, et al. Galectin-1 sensitizes resting human T lymphocytes to Fas CD95-mediated cell death via mitochondrial hyperpolarization, budding and fission. J Biol Chem. 2005; 280[8]: 6969-85.
17.
Mathieu V, Le Mercier M, De Neve N, Sauvage S, Gras T, Roland I,
32 mouse metastatic melanoma model.
J Invest Dermatol. 2007; 127[10]:
2399-410.18. Thijssen VL, Barkan B, Shoji H, Aries IM, Mathieu V, Deltour L, et al. Tumor Cells Secrete Galectin-1 to Enhance Endothelial Cell Activity, Cancer Res 2010; 70: 6216-24.
19. Heibeck TH, Ding SJ, Opresko LK, Zhao R, Schepmoes AA, Yang F, et al. An
extensive survey of tyrosine phosphorylation revealing new sites in human mammary epithelial cells. J Proteome Res. 2009; 8[8]: 3852-61.
20. Choudhary C, Kumar C, Gnad F, Nielsen ML, Rehman M, Walther TC, et al.
Lysine acetylation targets protein complexes and co-regulates major cellular functions. Science 2009; 14: 834-40.
21. Li Z, Zhao X, Bai S, Wang Z, Chen L, Wei Y, et al. Proteomics identification of cyclophilin a as a potential prognostic factor and therapeutic target in endometrial carcinoma. Mol Cell Proteomics 2008; 7[10]: 1810-23.
22.
Howard BA,
Furumai R,
Campa MJ,
Rabbani ZN,
Vujaskovic Z,
Wang XF,
et al.
Stable RNA interference-mediated suppression of cyclophilin Adiminishes non-small-cell lung tumor growth in vivo. Cancer Res. 2005; 65[19]: 8853-60.
23. Yang H, Chen J, Yang J, Qiao S, Zhao S, Yu L. Cyclophilin A is upregulated in small cell lung cancer and activates ERK1/2 signal. Biochem Biophys Res Commun. 2007; 361[3]: 763-7.
24. Zheng J, Koblinski JE, Dutson LV, Feeney YB, Clevenger CV. Prolyl
isomerase cyclophilin A regulation of Janus-activated kinase 2 and the progression of human breast cancer. Cancer Res. 2008; 68[19]: 7769-78.
33
25.
Reddy PA,
Atreya CD. Identification of simian cyclophilin A as a
calreticulin-binding protein in yeast two-hybrid screen and demonstration of cyclophilin A interaction with calreticulin. Int J Biol Macromol. 1999; 25[4]: 345-51.
26.
Nadeau K,
Das A,
Walsh CT. Hsp90 chaperonins possess ATPase
activity and bind heat shock transcription factors and peptidyl prolyl isomerases. J
Biol Chem. 1993; 268[2]: 1479-87.
27. Al-Ghoul M, Bruck T, Lauer-Fields J, Asirvatham V, Zapata C, Kerr R, et al. Comparative Proteomic Analysis of Matched Primary and Metastatic Melanoma Cell Lines. J Proteome Res. 2008; 7: 4107-18.
28. Morvillo V, Bover L, Mordoh J. Identification and characterization of a 14 kDa immunosuppressive protein derived from IIB-MEL-J, a human melanoma cell line. Cell Mol Biol. 1996; 42: 779–95.
29. Ciechomska I, Legat M, Golab J, Wesolowska A, Kurzaj Z, Mackiewicz A, et al. Cyclosporine A and its non-immunosuppressive derivative NIM811 induce apoptosis of malignant melanoma cells in in vitro and in vivo studies. Int J Cancer 2005; 117: 59–67.
30. Semba S, Huebner K. Protein expression profiling identifies cyclophilin A as a molecular target in Fhit-mediated tumor suppression. Mol Cancer Res. 2006; 4: 529–38.
31. Ren H, Fu K, Mu C, Li B, Wang D, Wang G. DJ-1, a cancer and Parkinson’s disease associated protein, regulates autophagy through JNK pathway in cancer cells. Cancer Letters 2010; 297: 101-8.
34
32.
Kim YC,
Kitaura H,
Taira T,
Iguchi-Ariga SM,
Ariga H. Oxidation of
DJ-1-dependent cell transformation through direct binding of DJ-1 to PTEN.
Int J
Oncol. 2009; 35: 1331-41.
33. Duan X, Kelsen SG, Merali S. Proteomic analysis of oxidative stress-responsive proteins in human pneumocytes: insight into the regulation of DJ-1 expression. J Proteome Res. 2008; 7: 4955-61.
34. Pardo M, Garcia A, Thomas B, Pineiro A, Akoulitchev A, Dwek RA et al. The characterization of the invasion phenotype of uveal melanoma tumour cells shows the presence of MUC18 and HMG-1 metastasis markers and leads to the identification of DJ-1 as a potential serum biomarker. Int. J. Cancer 2006; 119: 1014-22.
35. Gharehbaghi K, Grünberger W, Jayaram HN. Studies on the mechanism of action of benzamide riboside: a novel inhibitor of IMP dehydrogenase. Curr Med Chem. 2002; 9: 743-48.
36. He Y, Mou Z, Li W, Liu B, Fu T, Zhao S, et al. Identification of IMPDH2 as a tumor-associated antigen in colorectal cancer using immunoproteomics analysis. Int J Colorectal Dis. 2009; 24: 1271-79.
37. Fellenberg J, Kunz P, Sähr H, Depeweg D. Overexpression of Inosine 59-Monophosphate Dehydrogenase Type II Mediates Chemoresistance to Human Osteosarcoma Cells. PlosOne 2010; 8:e12179.
38. Fellenberg J, Bernd L, Delling G, Witte D, Zahlten-Hinguranage A. Prognostic
significance of drug-regulated genes in high-grade osteosarcoma. Modern Pathology 2007; 20: 1085-94.
39. Grillo MA and Colombatto S: S-adenosylmethionine and protein methylation. Amino Acids 2005; 28: 357-62.
35
40. Janssens V and Goris J: Protein phosphatase 2A: a highly regulated family of serine/threonine phosphatases implicated in cell growth and signaling. Biochem J. 2001; 353: 417-39.
41. Bellacosa A, Kumar CC, Di Cristofano A and Testa JR: Activation of Akt kinases in cancer: implication for therapeutic targeting. Adv Cancer Res 2005; 94: 29-86.
42. Altomare DA and Testa JR: Perturbations of the AKT signaling pathway in human cancer. Oncogene 2005; 24: 7455-64.
43. Tokunaga E, Kimura Y, Oki E, Ueda N, Futatsugi M, Mashino K, et al. Akt is
frequently activated in HER2/neu-positive breast cancers and associated with poor prognosis among hormone-treated patients. Int J Cancer 2006; 118: 284-9.
44. Guénin S, Schwartz L, Morvan D, Steyaert JM, Poignet A, Madelmont JC et al. PP2A activity is controlled by methylation and regulates oncoprotein expression in melanoma cells: A mechanism which participates in growth inhibition induced by chloroethylnitrosourea treatment. International Journal of Oncology 2008; 32: 49-57.
45. Lewy DS, Gauss CM, Soenen DR, Boger DL. Fostriecin: chemistry and biology. Curr Med Chem. 2002; 9: 2005-32.
46. Honkanen RE, Golden T. Regulators of serine/threonine protein phosphatases at the dawn of a clinical era? Curr Med Chem. 2002; 9[22]: 2055-75.
47. Quintela-Fandino M, Arpaia E, Brenner D, Goh T, Yeung FA, Blaser H, et al. HUNK suppresses metastasis of basal type breast cancers by disrupting the interaction between PP2A and cofilin-1. Proc Natl Acad Sci U S A. 2010; 107: 2622-7.
48. van Rheenen J, Condeelis J, Glogauer M. A common cofilin activity cycle in invasive tumor cells and inflammatory cells. J Cell Sci. 2009; 122: 305-11.
36
49. Wang W, Eddy R, Condeelis J. The cofilin pathway in breast cancer invasion and metastasis. Nat Rev Cancer. 2007; 7: 429-40.
50. Nishimura S, Tsuda H, Kataoka F, Arao T, Nomura H, Chiyoda T, et al.
Overexpression of cofilin 1 can predict progression-free survival in patients with epithelial ovarian cancer receiving standard therapy. Human Pathology Article in press.
51. Castro M, Dal-Pizzol F, Zdanov S, Soares M, Muller C, Lopes F, et al. CFL1
Expression Levels as a Prognostic and Drug Resistance Marker in Nonsmall Cell Lung Cancer. Cancer 2010; 116: 3645-55.
52. Villeneuve DJ, Hembruff SL, Veitch Z, Cecchetto M, Dew WA, Parissenti AM.
cDNA microarray analysis of isogenic paclitaxel- and doxorubicin-resistant breast tumor cell lines reveals distinct drug-specific genetic signatures of resistance. Breast Cancer Research and Treatment. 2006; 96: 17-39.
53. Anichini A, Mortarini R, Nonaka D, Molla A, Vegetti C, Montaldi E, et al.
Association of Antigen-Processing Machinery and HLA Antigen Phenotype of Melanoma Cells with Survival in American Joint Committee on Cancer Stage III and IV Melanoma Patients. Cancer Res. 2006; 66: 6405-11.
54. Li R, Wang H, Bekele BN, Yin Z, Caraway NP, Katz RL, et al. Identification of
putative oncogenes in lung adenocarcinoma by a comprehensive functional genomic approach. Oncogene 2006; 25: 2628-35.
55. Archer K, Mas V, David K, et al. Identifying Genes for Establishing a Multigenic
Test for Hepatocellular Carcinoma Surveillance in Hepatitis C Virus-Positive Cirrhotic Patients. Cancer Epidemiol Biomarkers Prev. 2009; 18[11]: 2929-32.
56. Nanney LB, Woodrell CD, Greives MR, Cardwell NL, Pollins AC, Bancroft TA,
et al. Calreticulin enhances porcine wound repair by diverse biological effects. Am J Pathol. 2008; 173[3]: 610-30.
37
57. Rodrigues-Lisoni F, Peitl P, Vidotto A, Polachini G, Maniglia J,
Carmona-Raphe J, et al. Genomics and proteomics approaches to the study of cancer-stroma interactions. BMC Medical Genomics 2010; 3: 14.
58. Cornforth A, Fowler A, Carbonell D. Resistance to the proapoptotic effects of
interferon-gamma on melanoma cells used in patient-specific dendritic cell immunotherapy is associated with improved overall survival. Cancer Immunol Immunother. 2010; 60[1]: 123-31.
59. Meyer S, Wild PJ, Vogt T, Bataille F, Ehret C, Gantner S, et al. Methylthioadenosine phosphorylase represents a predictive marker for response to adjuvant interferon therapy in patients with malignant melanoma. Experimental Dermatology 2010; 19: 251-7.
60.
Rondepierre F,
Bouchon B,
Papon J,
Bonnet-Duquennoy M,
Kintossou R,
Moins N, et al. Proteomic studies of B16 lines: involvement of
annexin A1 in melanoma dissemination.Biochim Biophys Acta. 2009;
1794[1]: 61-9.61.
Yi M,
Schnitzer JE. Impaired tumor growth, metastasis, angiogenesis and
wound healing in annexin A1-null mice.
Proc Natl Acad Sci U S A. 2009;
106[42]: 17886-91.62. Altenberg B, Greulich KO. Genes of glycolysis are ubiquitously overexpressed in 24 cancer classes. Genomics 2004; 84: 1014-20.
63. Suzuki A, Iizuka A, Komiyama M, Takikawa M, Kume A, Tai S, et al.
Identification of melanoma antigens using a Serological Proteome Approach [SERPA]. Cancer Genomics Proteomics. 2010; 7[1]: 17-23.
64. Trojanowicz B, Winkler A, Hammje K, Chen Z, Sekulla C, Glanz D, et al.
38 decreased invasiveness of the follicular thyroid carcinoma cell lines. J Mol Endocrinol. 2009; 42[3]: 249-60.
65. Nakamura J, Aoyagi S, Nanchi I, Nakatsuka S, Hirata E, Shibata S, et al.
Overexpression of eukaryotic elongation factor eEF2 in gastrointestinal cancers and its involvement in G2/M progression in the cell cycle. Int J Oncol. 2009; 34[5]: 1181-9.
66. Ye JL, Zhang YZ. The connection between tumor and ubiquitin-ribosomal
protein S27a, ubiquitin and ribosomal protein. Sheng Wu Gong Cheng Xue Bao.
2007; 23[6]: 982-8.
67. Santa Cruz DJ, Hamilton PD, Klos DJ, Fernandez-Pol JA. Differential
expression of metallopanstimulin/S27 ribosomal protein in melanocytic lesions of the skin. Journal of Cutaneous Pathology 1997; 24: 533-42.
68. Tager M, Kroning H, Thiel U, Ansorge S. Membrane bound protein disulfide
isomerase [PDI] is involved in regulation of surface expression of thiols and drug sensitivity of B-CLL cells. Exp Hematol. 1997; 25: 601-7.
69. Goplen D, Wang J, Enger PO, et al. Protein disulphide isomerase expression
is related to the invasive properties of malignant glioma. Cancer Res. 2006; 66:9895-902.
70. Gumireddy K, Sun F, Klein-Szanto AJ, et al. In vivo selection of metastasis
promoting genes in the mouse. Proc Natl Acad Sci U S A. 2007; 104: 6696-701.
71. Clauser KR, Hall SC, Smith DM, et al. Rapid mass spectrometric peptide
sequencing and mass matching for characterization of human melanoma proteins isolated by two-dimensional PAGE. Proc Natl Acad Sci U S A. 1995; 92: 5072-6.
72. Carta F, Demuro PP, Zanini C, et al. Analysis of candidate genes through a
proteomics-based approach in primary cell lines from malignant melanomas and their metastases. Melanoma Res. 2005; 15: 235-44.
39
73. Lovat PE, Corazzari M, Armstrong JL, Martin S, Pagliarini V, Hill D, et al.
Increasing Melanoma Cell Death Using Inhibitors of Protein Disulfide Isomerases to Abrogate Survival Responses to Endoplasmic Reticulum Stress. Cancer Res. 2008; 68: 5363-69.
74. Ou K, Kesuma D, Ganesan K, Yu K, Soon SY, Lee SY, et al. Quantitative
profiling of drug associated proteomic alterations by combined 2-nitrobenzenesulfenylchloride[NBS] isotope labeling and 2DE/MS identification. J Proteome Res. 2006; 5: 2194-206.
75. Steiniger SC, Coppinger JA, Krüger JA, Yates J 3rd, Janda KD. Quantitative
mass spectrometry identifies drug targets in cancer stem cell-containing side population. Stem Cells 2008; 26: 3037-46.
76. Santegoets SJAM, Schreurs MWJ, Reurs AW, Lindenberg JJ, Kueter EWM,
van den Eertwegh AJM, et al.Identification and Characterization of ErbB-3-Binding Protein-1 as a Target for Immunotherapy. The Journal of Immunology 2007; 179:2005-12.
77. Rondepierre F, Bouchon B, Bonnet M, Moins N, Chezal JM, D'Incan M, et al.
B16 melanoma secretomes and in vitro invasiveness: syntenin as an invasion modulator. Melanoma Res. 2010; 20: 77-84.
78. Boukerche H, Su ZZ, Prévot C, Sarkar D, Fisher PB. mda-9/Syntenin
promotes metastasis in human melanoma cells by activating c-Src. Proc Natl Acad Sci U S A. 2008; 105: 15914-19.
79. Sarkar D, Boukerche H, Su ZZ, Fisher PB. mda-9/Syntenin: more than just a
simple adapter protein when it comes to cancer metastasis. Cancer Res. 2008; 68: 3087-93.
40
80. Sarkar D, Boukerche H, Su ZZ, Fisher PB. mda-9/syntenin: recent insights into
a novel cell signaling and metastasis-associated gene. Pharmacol Ther. 2004; 104: 101-15.
81. Bernard K, Litman E, Fitzpatrick JL, Shellman YG, Argast G, Polvinen K, et al.
Functional Proteomic Analysis of Melanoma Progression. Cancer Research 2003; 63:6716-25.
82. Rochefort H, Liaudet E, Garcia M. Alterations and role of human cathepsin D
in cancer metastasis. Enzyme Protein 1996; 49: 106-16.
83. Bartenjev I, Rudolf Z, Stabuc B, Vrhovec I, Perkovic T, Kansky A. Cathepsin D
expression in early cutaneous malignant melanoma. Int. J. Dermatol. 2000; 39: 599-602.
84. Pardo M, Garcıa A, Antrobus R, Blanco MJ, Dwek RA, and Zitzmann N.
Biomarker Discovery from Uveal Melanoma Secretomes: Identification of gp100 and Cathepsin D in Patient Serum. Journal of Proteome Research 2007; 6: 2802-11.
85. Wilm M, Shevchenko A, Houthaeve T, Breit S, Schweigerer L, Fotsis T, et al.
Femtomole sequencing of proteins from polyacrylamide gels by nano‐ electrospray mass spectrometry. Nature 1996; 379: 466‐ 9.