feasibility Study of MRi Muscles
Molecular imaging in evaluation of
early post-Mortem interval
Daniela Sapienza
1*, Alessio Asmundo
1, Salvatore Silipigni
2, Ugo Barbaro
2,
Antonella cinquegrani
2, francesca Granata
2, Valeria Barresi
3, patrizia Gualniera
1,
Antonio Bottari
2& Michele Gaeta
2Estimating early postmortem interval (EPI) is a difficult task in daily forensic activity due to limitations of accurate and reliable methods. The aim of the present work is to describe a novel approach in the estimation of epi based on quantitative magnetic resonance molecular imaging (qMRMi) using a pig phantom since post-mortem degradation of pig meat is similar to that of human muscles. on a pig phantom maintained at 20° degree, using a 1.5 T MRI scanner we performed 10 scans (every 4 hours) monitoring apparent diffusion coefficient (ADC), fractional anisotropy (FA) magnetization transfer ration (MTR), tractography and susceptibility weighted changes in muscles until 36 hours after death. cooling of the phantom during the experiment was recorded. Histology was also obtained. pearson’s test was carried out for time correlation between post-mortem interval and MRi data. We found a significative inverse correlation between ADC, FA, MT values and PMI. Our preliminary data shows that post-mortem qMRMi is a potential powerful tool in accurately determining epi and is worth of further investigation.
Determination of the postmortem interval (PMI) and early postmortem interval (EPI) is one of the most chal-lenging and difficult task in daily forensic activity due to limitations of accurate and reliable methods.
Since its introduction 30 years back, the normogram method by Henßge has been established as the standard procedure of temperature-based death time determination in the early post-mortem period1–3.
However the validity of the normogram method seems to be problematic, death time estimates – and particu-larly their 95% - confidence interval limits - have to be interpreted carefully since systematic overestimation of the post-mortem interval in bodies of high mass and large surface area must be taken into account4.
Other alterations after death include the development and regression of rigor mortis, the progression of livor mortis and algor mortis5. Although these methods are employed to delimitate the PMI in everyday forensic work,
there are still great inaccuracies and limitations in many cases. Therefore, novel methods for time of death estima-tion that comply with the requirements of practice are still of high demand. Recently new promising approaches have been tested to characterize changes within the EPI including laboratoristic analysis on postmortem bio-chemistry6, changes in oxidant/antioxidant parameters (malondialdehyde MDA, nitric oxide NO, total thiol as
well as the activity of glutathione reductase GR, glutathione S transferase, and catalase)7, and postmortem muscle
protein degradation8–10.
Modern imaging techniques (CT and MRI) are diagnostic tools of increasing importance for the forensic and legal medicine in post-mortem investigations, as an adjunct or as an alternative to autopsy. Although post-mortem imaging has some well-known limitations, today pre-autopsy post-mortem CT (PMCT) and/or post-mortem MR (PMMR) are considered useful procedures in many forensic institutes world-wide11,12 with good performances
for depicting cause of death, traumatic findings in corpses and in the definition of post-mortem interval11,13–15.
Although MRI is widely used in clinical medicine, its routine diffusion into forensic medicine has been lim-ited14 by the longer acquisition time in comparison with PMCT and higher cost. In spite of this, in the last decade,
1Department of Biomedical and Dental Sciences,and of Morphological and Functional Images, Section of Legal Medicine, University of Messina, Via Consolare Valeria 1, 98125, Messina, Italy. 2Department of Biomedical and Dental Sciences,and of Morphological and Functional Images, Section of Radiological Sciences, University of Messina, Messina, Italy. 3Department of Human Pathology in Adulthood and Evolutive Age, University of Messina, Messina, Italy. *email: [email protected]
www.nature.com/scientificreports
www.nature.com/scientificreports/
PMMR has been emerging as a powerful tool in forensic death investigations and has the ability to enhance autopsy and uncover otherwise undetectable findings.
On the other hand, until now, PMMR has been largely based on conventional “morphological” MR T1 and T2 weighted and short-tau inversion recovery (STIR) sequences, which produce magnitude images whose signal mainly depends on proton density (PD), T1 and T2 relaxation times of tissues. In addition, such images allow only qualitative evaluation and are consequently strongly linked to the subjective judgment and variable experi-ence of radiologists.
In the last years, the role of quantitative MR molecular imaging (qMRMI) has emerged in clinical practice as a fundamental approach for the detection and diagnosis of diseases. For example diffusion weighted imaging has become the fundamental tool for early diagnosis of cerebral ischemia, allowing to display changes due to ischemia as early as 20 minutes after the stroke, and it is also a powerful diagnostic weapon in cancer16,17.
qMRMI allows to obtain numerical data and generates images whose signal depends on bio-physical tissue properties other than PD, T1 and T2 relaxation times, e.g. diffusion weighted sequence measures mobility of water molecules due to random Brownian motion within a tissue voxel. Besides information on isotropic and anisotropic water diffusion, obtained from Diffusion Weighted Imaging (DWI) and Fractional Anisotropy (FA), status of the macromolecular compartment including protein, obtained from Magnetization Transfer (MT), and presence of microscopic amount of air in tissues due to early putrefaction, estimated with Susceptibility Weighted Imaging (SWI), can be obtained in a fast and reliable way. Molecular imaging is a quantitative and objective method based on numeric values, which is independent from experience of radiologists. The role of quantitative MR molecular imaging is raising in clinical practice18.
The aim of our study has been to evaluate the early post-mortem changes in muscles using qMRMI on a pig phantom in order to explore the potential usefulness of this non-invasive novel approach in the early post-mortem interval. To the best of our knowledge, no previous paper has been published on this topic in the scientific literature.
Results
Apparent diffusion coefficient.
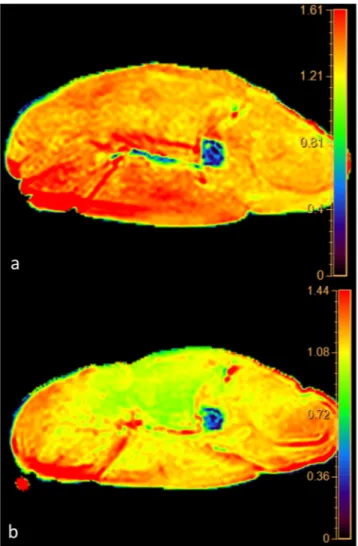
We found a highly significative inverse time correlation between apparent diffusion coefficient (ADC) and PMI (significance level P < 0.0001, correlation coefficient −0.96, 95% confidence interval for r −0.99 to 0.85).The data obtained from ADC map showed a progressive decrease of the ADC value from 1.55 × 10⁻³mm2/sec at 0 hours up to 0.93 × 10⁻³ mm2/sec at 36 hours (Fig. 1). ADC decrease was 40% and it was well depicted in the color-coded maps (Fig. 2). It is noteworthy that the slope of the curve was not constant and was greater in the first 12 hours (22.6%) than in the following 24 hours (17.4%). This behavior correlates very well with histology since the first histological post-mortem sample (time 0) showed normal fibers and regular cellular structure.
In the sample taken at 12 hours, muscle fibers were swollen and some “giant” cells could be seen. Intercellular spaces were tight (Fig. 3a) explaining the reduction of water molecules movement and the strong increase of restriction in this phase. On the other hand, in the sample taken 36 hours, muscle fibers were shrunk and enlargement of intercellular spaces could be seen. Some fibers were missing and replaced by fluid-filled channels (Fig. 3b). Such a pattern of cellular degradation explain the lesser decrease of tissue restriction since in this phase reduction of water movement is due only to decrease of temperature.
Magnetization transfer ratio.
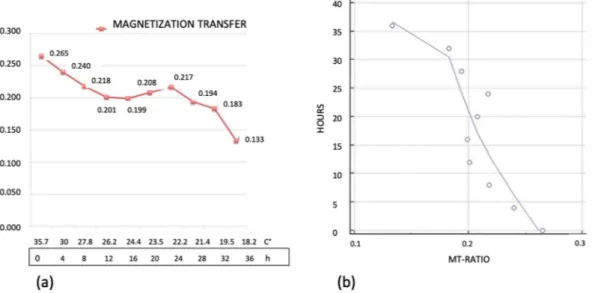
We found a significative inverse time correlation between MTR and PMI (significance level P < 0.0012, correlation coefficient −0.86, 95% confidence interval for r: −0.96 to 0.52). Figure 1. (a) Graphic of the changes of ADC. On the axis of abscissas are represented the time and the changes of temperature. (b) Graphic of the correlation evaluated by Pearson’s Test between ADC data and post-mortem timing.The values of MTR changed from 0.265 at 0 hour up to 0.133 at 36 hours with overall reduction of 49.8% (Fig. 4). In the curve 3 segments could be seen. The first segment between 0 and 12 hours was characterized by a constant decrease of the MTR values equal to 24,1%. In the second segment, between 12 and 28 hours, the Figure 2. Panel of the color coded maps obtained at time 0 (upper map) and at 36 hours (lower map). Note the change of color from red to yellow-green representing decrease of the water diffusion in muscles.
Figure 3. (a) Histological transverse section of pig muscle at 12 hours. Muscle fibers are swollen and
surrounded by edematous spaces (Haematoxylin and eosin stain; original magnification, x100). (b) Histological transverse section of pig muscle at 36 hours. Muscle fibers are shrunk or missing and replaced by fluid-filled channels (Haematoxylin and eosin stain; original magnification, x100).
www.nature.com/scientificreports
www.nature.com/scientificreports/
decrease of MTR almost halted (from 24.1 up to 26.8%). Finally between 28 and 36 hours a rapid decrease of MTR values was detected (from 26.8% to 49.8%).
fractional anisotropy and tractography.
We found a significative inverse time correlation between FA and PMI (significance level P < 0.0002, correlation coefficient −0.91, 95% confidence interval for r: −0.97 to 0.66).FA dropped from 0.32 at 0 hour to 0.25 at 36 hours (21.9%). The slope curve showed 3 segments (Fig. 5):
1) First segment from 0 to 12 hours characterized by a decrease of 12.5% 2) Second segment from 12 to 28 hours without variation
3) Third segment from 28 to 36 hours with a further drop of 9.4% from 0.28 to 0.25
Tractography also demonstrated the decrease of FA as an evident loss of the number of muscular tracts (Fig. 6a,b).
Figure 4. (a) Graphic of the changes of Magnetization Transfer Ratio. On the axis of abscissas are represented the time and the changes of temperature. (b) Graphic of the correlation evaluated by Pearson’s Test between Magnetization Transfer Ratio data and post-mortem timing.
Figure 5. (a) Graphic of the changes of Fractional Anisotropy. On the axis of abscissas are represented the time and the changes of temperature. (b) Graphic of the correlation evaluated by Pearson’s Test between Fractional Anisotropy data and post-mortem timing.
Susceptibility.
SW images allowed detecting air in the vessels already in the first scan at 0 hour. Air was seen within the muscles after 12 hours (Fig. 7) but was never seen on standard T1 weighted imagestemperature.
During the time of the experiment temperature of the phantom decreased from 35.7 up to 18.2 Celsius degrees (49%). Decrease of temperature was faster in the first 12 hours than in the following 24 hours. These data are in keeping with the post-mortem cooling of the human tissues19.K factor (mathematical model).
The curve derived (Fig. 8) from our mathematical model confirms that the method is sensitive to molecular post-mortem changes also after ADC correction for temperature changes. Since temperature changes of the corpses is nowdays the basis for practical estimation of PMI, molecular imaging could add further temperature - independent data for this scope.Discussion
Diffusion and apparent diffusion coefficient.
Diffusion-weighted imaging (DWI) is a form of molecular MR imaging based on the random Brownian motion of water molecules within a voxel of tissue20–22. Diffusion isfundamentally a thermodynamic phenomenon as demonstrated by Einstein23. The state of extracellular space in
tissues is the most important factor that regulates diffusion. Free movement of the water molecules in extracellu-lar space is mainly restricted by the presence of celluextracellu-lar membranes. Highly celluextracellu-lar tissues or those with celluextracellu-lar swelling due to ischemia produce narrowing of the extracellular space and consequently exhibit lower diffusion movement, which can be measured by DWI, appearing as a reduction of ADC values. ADC is a quantitative parameter that is calculated from the DWI, it allows an objective evaluation of the water movement in tissue. For this reason diffusion MRI is particularly useful in diagnosis of malignant neoplasia and cerebral ischemia because of the high cellular tissue in malignant neoplasia and the cellular swelling due to anoxia in ischemia cause reduc-tion of extracellular space and drop of ADC values.
The structure of muscle fibers generates anisotropy in the water diffusion in a similar way than axons in brain. So anisotropic diffusion represents a useful tool in evaluation of normal and diseased muscles24,25.
In our study we demonstrated that ADC values decreases of 40% in 36 hours and correlates very well with PMI (Figs. 1 and 2).
Decrease of ADC values was greater in the first 12 hours (22.6%) with respect to the second 24 hours (17.4%). Comparison with histology allows us to explain this behavior since water restriction was influenced in the first post-mortem 12 hours by two synergic phenomena: 1) swelling of ischemic cells, and 2) decreasing temperature. On the other end 36 hours histology shows cells shrinkage and enlargement of the intercellular spaces which causes increasing of the water molecules movement, so in this phase reduction of ADC values is due only to Figure 6. (a) Tractography obtained from diffusion tensor sequence at time 0. The fiber muscles are well depicted and appear quite compact (b). Tractography obtained at 36 hours shows a dramatic loss of muscles fibers. The tractography correlates very well with histology shown in Fig. 3b.
www.nature.com/scientificreports
www.nature.com/scientificreports/
decrease of temperature according to the Einstein – Stokes equation D = kT/6phr where k is the Boltzmann con-stant, T is the absolute temperature in degrees Kelvin, h is the viscosity of the medium, and r is the radius of the molecule23.
Anisotropic diffusion and fractional anisotropy.
Anisotropic diffusion occurs in highly structured bio-logical tissues that have different diffusion coefficients along different directions. White matter and muscles are highly anisotropic because of the parallel orientation of white matter and muscle fibers tracts24. The degree ofanisotropic diffusion can be evaluated with diffusion tensor imaging (DTI) and it is well expressed by fractional anisotropy (FA), which is an index for the amount of asymmetrical diffusion within a voxel. The value of FA varies between 0 and 1. For perfect isotropic diffusion FA is 0. With progressive diffusion anisotropy, the FA → 1. Damage of the normal structure of an anisotropic diffusion can cause reduction of the FA with tendency of FA to move near 0.
Since DTI is sensitive to the orientation and density of cellular structures that hinder water diffusion, the local tissue microstructure can be evaluated with fractional anisotropy, which correlates with muscle fibers loss25.
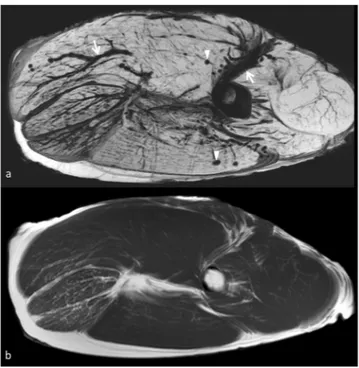
Anisotropic diffusion can be encoded to generate tractography images, which allow to represent white matter and muscle fibers as colored tracts. Therefore, loss of FA due to muscle damage causes changes in the tractography Figure 7. Panel depicting the high sensititivity of susceptibility weighted imaging in demonstrating air in the vessels and tissue. Susceptibility weighted image shows with great advantage air in the intramuscular and intermuscular vessels (arrows) and in the muscles (arrowheads). In T1 weighted image obtained in the same session (lower image) intravascular air cannot be seen.
Figure 8. The curve of the K factor shows that ADC, FA e MTR are temperature independent variables sensitive to PMI.
images. We observed a reduction of the FA up to 22%. This data correlates with histology showing gradual loss of muscle cells and enlargement of the intercellular space, that causes reduction of the muscle FA. Tractography demonstrates with better advantages the loss of muscle fibers (Figs. 3 and 6).
Magnetization transfer ratio.
Magnetization transfer ratio (MTR) is an MRI technique that allow to enhance contrast between tissues where hydrogen protons are present in two states1: bound to macromolecules 2: in free water
MT is based on the application of an off-resonance RF pulse, which saturates protons bound to macromol-ecules but not those in free water. The saturated protons from the macromolecule partially transfer their mag-netization to protons in free water that in this way become partially saturated. When another radiofrequency pulse is applied, the signal from the free water is reduced due to the pre-saturation of this free-water protons. The difference between the signals achieved with and without the off-resonance pulse can be calculated and is referred as MTR26.
MTR is a powerful tool in evaluating macromolecular compartment since damage of macromolecules causes decrease of the MTR. E.g., decrease in the magnetization transfer ratio have been shown to correlate well with the degree of myelin loss and axonal damage in patients with multiple sclerosis27.
The MTR allows a quantitative evaluation of the ability of protons bound to macromolecules to exchange mag-netization with the surrounding free water and, consequently, is able to detect damages of these macromolecules. In our experiment MTR is reduced by half after 36 hours (Fig. 4). These data correlates well with alterations of the proteome profile which occurs few hours after death both in human and pig muscles. In samples of human muscles stored at 25° some proteins started to degrade after few hours28.
Pittner et al.9. showed that in pig muscles stored at 21 °C proteins degraded in a regular and predictable
fash-ion. Early change in the first 36 h post mortem interval affected some proteins as Titina 1, desmin dp2, 1200 KDa and calpain 1.
The time-dependent changes in muscle histology are one of the useful indices for determining the postmor-tem interval. Vacuolization and autolysis occurred as early as 6 h when the muscle tissues were stored at 25 °C29,30.
Degradation of myofibrils by various proteases has been thought to be an important mechanism leading to post-mortem vacuolization and autolysis in skeletal muscles29,30.
Susceptibility.
Magnetic susceptibility corresponds to the internal magnetization of a tissue resulting from the interactions with an external magnetic field. Although human body is mainly diamagnetic, it contains para-magnetic substances as deoxy-hemoglobin. Moreover, tissue can contain pathological amount of parapara-magnetic substances e.g. blood degradation products as hemosiderin or ferritin. Finally, when two tissues with different magnetic susceptibilities are juxtaposed, local distortions in the magnetic field were seen. There are such natural interfaces between air and tissue.Susceptibility weighted imaging (SWI) is an MRI Gradient Echo Steady State T2/T1 weighted sequence which is particularly sensitive to compounds that distort the local magnetic field31–33.
The presence of paramagnetic substances or air in tissue causes large distortions in the magnetic field and significant susceptibility artifacts since the local field inhomogeneity accelerates transverse relaxation and signal decay (Fig. 7).
For this reason SWI is a tool with an extraordinary ability for detecting microscopic quantity of substances causing susceptibility artifact in tissues including air.
Presence of air in the vessels and tissue can be correlated to several conditions occurred before (e.g. trauma, infection, gas embolism) or after death (e.g. resuscitation procedures, putrefaction) and is considered a useful complementary tool in estimating post-mortem interval15.
In our phantom SWI was able to detect air in vessels since the first scan due to exsanguination. Air in the ves-sels could be seen only in SWI but not in other sequences (Fig. 7). We believe that SWI could become the method of choice for detecting micro-bubbles in tissues as an early marker of putrefaction. Further study with corpses in more advanced stage of decomposition are necessary to confirm this hypothesis.
It is necessary to point out the limitations of our study.
The single experiment is its main limitation. However our data shows that the method is sensitive to early post-mortem changes in muscles and that is worth of consideration and further study.
In addition, our data were collected only with phantom stored at 20° Celsius. Since the temperature storage is very important in causing post-mortem cellular changes, other data scanning muscles at different temperature storage should be acquired.
Of course, a big database should be acquired at different temperature and times in order to evaluate the appli-cability of the method to daily forensic practice.
Another limitation is that we obtained our data from a pig phantom and not from human muscles. However literature data shows that pig’s muscles are very similar to human muscles8, so we can suppose that our results can
be considered predictive of post-mortem qMMRI in humans.
Moreover, a phantom is different than a whole body exposed to gastrointestinal bacteria spread, since the intestinal bacteria could influence the kinetic of post mortem changes in muscle. In addition, other factors than can influence the PMI estimation, such as gender, age, cause of death and so on, also cannot be evaluated on a pig phantom.
Finally we have not performed H1-MRspectroscopy that is another molecular imaging potentially useful for PMI evaluation. Only few papers exist on this topic33–35.
www.nature.com/scientificreports
www.nature.com/scientificreports/
In spite of these drawbacks, we believe that our study demonstrates that multiparametric qMRMI is sensitive to early post-mortem muscular changes due to cooling, damages of proteome probed by MTR and muscle fibers loss due to cell death showed by ADC and FA.
Consequently qMRMI has a potential for being a useful tool in forensic EPI delimitation with a high level of precision because the behavior of MRI signal is linked to the bio-physical post-mortem changes of tissues. This novel MRI approach also provides the following important advantages: it is a fast and relatively inexpensive method, and its results are not dependent from radiologist’s subjective evaluation.
conclusion
In conclusion, qMRMI has the potential to evaluate EPI supporting other existing techniques. qMRMI could be included in a post-mortem multidisciplinary scenario in which, integrating data from different medical branches, a reliable (as it were “mathematical”) estimation of PMI could be obtained36. We want to highlight that our work
is a very preliminary study showing only that the MRI molecular imaging is sensitive to tissue post mortem changes. It could be a useful starting point in the developing this idea, scanning more phantoms or human bodies in further studies.
Material and Methods
A pig hind leg weighting 24 kg was used as a phantom. The pig was slaughtered according to standard procedure for food chain, under animal physician control. The pig, bred in a farm, was healthy with a well-developed muscle mass. In forensic science, pigs are commonly used as phantoms due to their comparable body size and physiology to humans37,38. Particularly the choice of a pig as a phantom was based on the demonstration that postmortem
muscle protein degradation is similar in time and temperature to that observed in humans9.
The leg was considered the best anatomic place of sample since muscles of this region are the largest both in pig and human body and so are ideal for MRI data acquisition.
No permission by our Ethic Committee was necessary because the phantom was obtained from the commer-cial food chain.
Time of pig death was recorded. The specimen was placed in rooms maintained at a constant temperature of 20° Celsius with a 40% of humidity from the first minutes after death until the end of the experiment, monitoring them with an ambient temperature-humidity CE device.
The first MRI scan was performed 3 hours after death. The last scan was carried out 36 hours after the first one. A total of 10 scans were obtained with an interval of 4 hours between each scan.
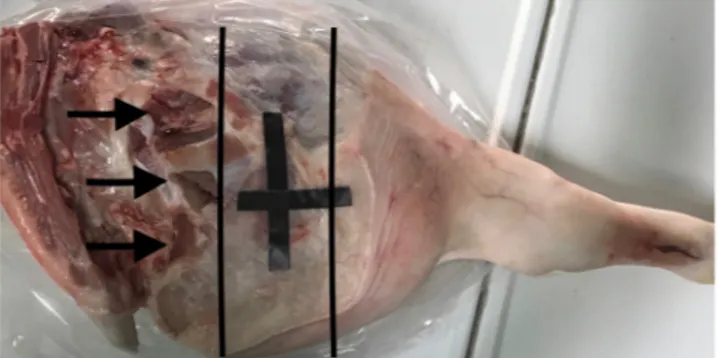
All the sequences were centered on the same axial axis of the pig leg localized using a superficial marker (adhe-sive plastic tape). The axial thickness of the muscles included into MRI scan was 15 cm (Fig. 9).
Immediately before each MRI examination, both superficial and deep temperature of muscles were measured at the mid thickness of the pig leg with a CE digital thermometer TP101 by using a sharp probe which tempera-ture measure range from −50° to 300°. This was done in order to measure the decrease of the post-mortem mus-cle temperature (PMMT), which is a consecutive cadaveric phenomenon, linked to environmental and cadaveric factors. Measurements were performed close to the area included in the MRI scan (Fig. 9).
All MRI examinations were carried out with a 1.5 Tesla scanner (Ingenia, Philips, The Netherlands) using a 16-channel body coil.
Measurements of isotropic and anisotropic diffusion20,21, magnetization transfer ratio (MTR)39, and tissue
susceptibility31 were obtained using sequences widely validated in clinical MRI, and correlated with PMMT and
histological findings.
MRI examination protocol included:
1. T1-weighted Spin Echo sequence: TR 684 ms, TE 10 ms, NSA 1, matrix 308 × 183 mm, slice thickness (SL) 10 mm, scan duration 2m07s. This images were used as anatomical evaluation.
2. Magnetization transfer (MT) T1 sequence: magnetization transfer TR 684 ms, TE 10 ms, NSA 1, matrix 308 × 183, slice thickness (SL) 10 mm, acquisition time 2m07s.
3. Susceptibility weighted imaging (SWI): 4echoes, TR 51 ms, TE First 12 ms, flip angle 20, echo spacing 10 ms, matrix 304 × 224. Scan duration 3 minutes.
Figure 9. Picture of the pig leg. Black lines shows the area scanned with MRI. Arrows indicates the points used to carry out biopsies and temperature measurements.
4. Diffusion weighted imaging (DWI): TR 2230 ms TE 77 ms, matrix 124 × 103 mm, SL 10 mm, b factor 3 (0,500,1000), NSA 2, scan duration 1m13s, fat suppression SPIR.
5. Diffusion tensor imaging (DTI): TR 3979 ms, TE 88 ms, matrix 160 × 128 mm, SL 2.2 mm, directional resolution 32 scan duration 8m53s.
Total acquisition time was 18 minutes.
The post-processing was performed with a complementary console (IntelliSpaceTM portal 7.0) by a radiologist (MG) with a twenty year experience in MR imaging and ten year experience in MR molecular imaging40–42.
The following molecular imaging values of the muscles were obtained from the analysis of the MRI sequences for each scan:
1) Apparent diffusion coefficient (ADC) from DWI was automatically calculated by the accessory and meas-ured using ROIs.
2) Fractional anisotropy (FA) from DTI was automatically calculated by the accessory and measured using ROIs
3) Magnetization transfer ratio (MTR) was computed as T1s + MTs/T1s where T1s is the magnitude of tissue signal before the MT pulse and MTs is the signal after the MT pulse has been applied
4) SWI sequence
Calculation of all molecular imaging values was made using measurements acquired in the same regions of interest (ROIs) drawn on T1 weighted images and spread on the other sequences with copy and paste tools. The ROI was drawn including the largest part of the muscles and excluding large vessels, bones and subcutaneous tissue.
Color-coded ADC maps were also obtained.
Tractography of the muscles was carried out using the post processing program of the Philips complementary console.
Finally MinIP reconstructions of the SWI sequences were carried out in order to detect the presence of air within vessels and muscles and compared with standard anatomical T1 weighted images.
At 0, 12, 24 and 36 hours from the beginning of the MRI study, four histological samples were obtained in order to correlate MRI findings with histological post-mortem changes.
Samples were fixed in 10% neutral buffered formalin for 24 hours at room temperature. Thereafter, they were transversally cut and paraffin embedded. 4 µm thick sections were cut from each paraffin block and stained with haematoxylin and eosin stain for evaluation at light microscopy.
Mathematical Model
In order to simplify the comprehension of our data we propose a simple mathematical model which synthetizes in a formula the three different molecular variables acquired:
= + Δ
K [a (a T%)]bc where a = ADC, b = MT, c = FA.
Since all this parameters (A, B, C) are inversely proportional to post-mortem timing, value of K is expected to decrease when PMI increases. Since MT is a ratio and FA is a percentage they are not significantly influenced by temperature variations. On the other hand diffusion is dependent from two different factors: 1) size and number of muscle cells and 2) temperature of tissue.
So the impact of thermodynamic effect due to body’s cooling on the ADC values is important and its influence can be reduced calculating the percentage of decrease of ADC values due to the cooling. Thus, the correction of the ADC value obtained in this way allows to focus on the effect of muscle cells degradation. This correc-tion of ADC by cooling is represented in the formula by [a + (a ΔT%)] which can be indicated ad corrected ADC (ADCc). The model is a simplified version of the model described by Szafer et al.43. where we consider a
linear dependence of ADC as a function of the temperature difference (in percentage), according to the Stokes – Einstein equation for diffusion23.
time correlation
Pearson test (carried out with MedCalc Statistical Software version 15.8 (MedCalc Software bvba, Ostend, Belgium; https://www.medcalc.org; 2015) was used for evaluating time correlation between post-mortem inter-val and MRI data.
Received: 23 November 2018; Accepted: 29 December 2019; Published: xx xx xxxx
References
1. Henßge, C. Todeszeitschätzungen durch die mathematische Beschreibung der rektalen Leichenabkühlung unter verschiedenen Abkühlungsbedingungen. Z Rechtsmed. 87, 147–178, https://doi.org/10.1007/BF00204763 (1981).
2. Henßge, C. et al. Experiences with a compound method for estimating the time since death. I. Rectal temperature nomogram for time since death. Int J Legal Med. 113, 303–319 (2000).
3. Mall, G. & Eisenmenger, W. Estimation of time since death by heat-flow Finite-Element model part II: application to non-standard cooling conditions and preliminary results in practical casework. Leg Med (Tokyo) 7, 69–80, https://doi.org/10.1016/j. legalmed.2004.06.007 (2005).
4. Hubig, M., Muggenthaler, H., Sinicina, I. & Mall, G. Temperature based forensic death time estimation: The standard model in experimental test. Leg Med (Tokyo) 17, 381–387, https://doi.org/10.1016/j.legalmed.2015.05.005 (2015).
www.nature.com/scientificreports
www.nature.com/scientificreports/
5. Mathur, A. & Agrawal, Y. K. An overview of methods used for estimation of time since death. Australian Journal of Forensic Sciences
43, 275–285, https://doi.org/10.1080/00450618.2011.568970 (2011).
6. Palmiere, C. & Mangin, P. Urea nitrogen, creatinine, and uric acid levels in postmortem serum, vitreous humor, and pericardial fluid. International Journal of Legal Medicine. 129, 301–305, https://doi.org/10.1007/s00414-014-1076-z (2015).
7. Abo El-Noor, M. M., Elhosary, N. M., Khedr, N. F. & El-Desouky, K. I. Estimation of Early Postmortem Interval Through Biochemical and Pathological Changes in Rat Heart and Kidney. Am J Forensic Med Pathol 37, 40–46, https://doi.org/10.1097/ PAF.0000000000000214 (2016).
8. Ehrenfellner, B. et al. Are animal models predictive for human postmortem muscle protein degradation? International Journal of
Legal Medicine 131, 1615–1621, https://doi.org/10.1007/s00414-017-1643-1 (2017).
9. Pittner, S. et al. Postmortem degradation of skeletal muscle proteins: a novel approach to determine the time since death.
International Journal of Legal Medicine 130, 421–431, https://doi.org/10.1007/s00414-015-1210-6 (2016).
10. Pittner, S. et al. Postmortem muscle protein degradation in humans as a tool for PMI delimitation. International Journal of Legal
Medicine 130, 1547–1555, https://doi.org/10.1007/s00414-016-1349-9 (2016).
11. Ruder, T. D., Thali, M. J. & Hatch, G. M. Essentials of forensic post-mortem MR imaging in adults. The British Journal of Radiology
87, 20130567, https://doi.org/10.1259/bjr.20130567 (2014).
12. Rutty, G. N. et al. Forensic institutes across the world place CT or MRI scanners or both into their mortuaries. JTrauma 65, 493–494, https://doi.org/10.1097/TA.0b013e31817de420 (2008).
13. Ross, S. et al. Postmortem Whole-Body MRI in Traumatic Causes of Death. American Journal of Roentgenology 199, 1186–1192, https://doi.org/10.2214/AJR.12.8767 (2012).
14. Grabherr, S. et al. Modern post-mortem imaging: an update on recent developments. Forensic Sciences Research 2, 52–64, https://doi. org/10.1080/20961790.2017.1330738 (2017).
15. Sapienza, D. et al. Post mortem CT of intrahepatic gas distribution in twenty-seven victims of a flood: Patterns and timing. Legal
Medicine 29, 18–21, https://doi.org/10.1016/j.legalmed.2017.09.002 (2017).
16. Le Bihan, D. & Iima, M. Diffusion Magnetic Resonance Imaging: What Water Tells Us about Biological Tissues. PLOS Biology 13, e1002203, https://doi.org/10.1371/journal.pbio.1002203 (2015).
17. Ma, D. et al. Magnetic resonance fingerprinting. Nature 495, 187–192, https://doi.org/10.1038/nature11971 (2013).
18. Gallagher, F. A. An introduction to functional and molecular imaging with MRI. Clin Radiol 65, 557–566, https://doi.org/10.1016/j. crad.2010.04.006 (2010).
19. Kaliszan, M., Hauser, R. & Kernbach-Wighton, G. Estimation of the time of death based on the assessment of post mortem processes with emphasis on body cooling. Leg Med (Tokyo) 11, 111–117, https://doi.org/10.1016/j.legalmed.2008.12.002 (2009).
20. Dietrich, O., Biffar, A., Baur-Melnyk, A. & Reiser, M. F. Technical aspects of MR diffusion imaging of the body. European Journal of
Radiology 76, 314–322, https://doi.org/10.1016/j.ejrad.2010.02.018 (2010).
21. Mukherjee, P. et al. Diffusion Tensor MR Imaging and Fiber Tractography: Theoretic Underpinnings. American Journal of
Neuroradiology 29, 632–641, https://doi.org/10.3174/ajnr.A1051 (2008).
22. Minati, L. & Węglarz, W. P. Physical foundations, models, and methods of diffusion magnetic resonance imaging of the brain: A review. Concepts in Magnetic Resonance Part A 30A, 278–307, https://doi.org/10.1002/cmr.a.20094 (2007).
23. Einstein, A. Über die von der molekularkinetischen Theorie der Wärme geforderte Bewegung von in ruhenden Flüssigkeiten suspendierten Teilchen [AdP 17, 549 (1905)]. Annalen der Physik 14, 182–193, https://doi.org/10.1002/andp.200590005 (2005). 24. Zaraiskaya, T., Kumbhare, D. & Noseworthy, M. D. Diffusion tensor imaging in evaluation of human skeletal muscle injury. Journal
of Magnetic Resonance Imaging 24, 402–408, https://doi.org/10.1002/jmri.20651 (2006).
25. Li, G. D. et al. Diffusion-Tensor Imaging of Thigh Muscles in Duchenne Muscular Dystrophy: Correlation of Apparent Diffusion Coefficient and Fractional Anisotropy Values With Fatty Infiltration. American Journal of Roentgenology 206, 867–870, https://doi. org/10.2214/AJR.15.15028 (2016).
26. Schmierer, K. et al. Magnetization transfer ratio and myelin in postmortem multiple sclerosis brain. Ann Neurol 56, 407–415, https:// doi.org/10.1002/ana.20202 (2004).
27. Wattjes, M. P. et al. Evidence-based guidelines: MAGNIMS consensus guidelines on the use of MRI in multiple sclerosis–establishing disease prognosis and monitoring patients. Nat Rev Neurol 11, 597–606, https://doi.org/10.1038/nrneurol.2015.157 (2015). 28. Tavichakorntrakool, R. et al. Serial analyses of postmortem changes in human skeletal muscle: A case study of alterations in
proteome profile, histology, electrolyte contents, water composition, and enzyme activity. Proteomics - Clinical Applications 2, 1255–1264, https://doi.org/10.1002/prca.200800051 (2008).
29. Tomita, Y., Nihira, M., Ohno, Y. & Sato, S. Histological study of early postmortem changes in various organs: comparison of the paraffin embedding method and the epoxy resin embedding method. Nihon Hoigaku Zasshi 53, 207–217 (1999).
30. Takeichi, S. et al. Mechanism of postmortem autolysis of skeletal muscle. Biochemical Medicine 32, 341–348, https://doi. org/10.1016/0006-2944(84)90040-1 (1984).
31. Liu, S. et al. Susceptibility-weighted imaging: current status and future directions: SWI Review. NMR in Biomedicine 30, e3552, https://doi.org/10.1002/nbm.3552 (2017).
32. Duyn, J. MR susceptibility imaging. Journal of Magnetic Resonance 229, 198–207, https://doi.org/10.1016/j.jmr.2012.11.013 (2013). 33. Haacke, E. M. et al. Susceptibility-weighted imaging: technical aspects and clinical applications, part 1. AJNR Am J Neuroradiol 30,
19–30, https://doi.org/10.3174/ajnr.A1400 (2009).
34. Banaschak, S. 1, Rzanny, R., Reichenbach, J. R., Kaiser, W. A. & Klein, A. Estimation of postmortem metabolic changes in porcine brain tissue using 1H-MR spectroscopy-preliminary results. Int J Legal Med. Mar 119(2), 77–9 (2005).
35. Ntziachristos, V., Kreis, R., Boesch, C. & Quistorff, B. Dipolar Resonance Frequency Shifts in H1 MR Spectra of Skeletal Muscle: Confirmation in Rats at 4.7 T in Vivo and Observation of Changes Postmortem Magn Reson Med. Jul 38(1), 33–9 (1997). 36. Maile, A. E., Inoue, C. G., Barksdale, L. E. & Carter, D. O. Toward a universal equation to estimate postmortem interval. Forensic
Science International 272, 150–153, https://doi.org/10.1016/j.forsciint.2017.01.013 (2017).
37. Marhoff, S. J., Fahey, P., Forbes, S. L. & Green, H. Estimating post-mortem interval using accumulated degree-days and a degree of decomposition index in Australia: a validation study. Aust J Forensic Sci. 48, 24–36, https://doi.org/10.1080/00450618.2015.1021378 (2016).
38. Armstrong, P., Nizio, K. D., Perrault, K. A. & Forbes, S. L. Establishing the volatile profile of pig carcasses as analogues for human decomposition during the early postmortem period. Heliyon. https://doi.org/10.1016/j.heliyon.2016.e00070 (2016).
39. Henkelman, R. M., Stanisz, G. J. & Graham, S. J. Magnetization transfer in MRI: a review. NMR Biomed 14, 57–64 (2001). 40. Siracusano, G., La Corte, A., Gaeta, M. & Finocchio, G. A data-oriented self-calibration and robust chemical-shift encoding by using
clusterization (OSCAR): Theory, optimization and clinical validation in neuromuscular disorders. Magnetic Resonance Imaging 45, 84–96, https://doi.org/10.1016/j.mri.2017.09.018 (2018).
41. Gaeta, M. et al. Use of Diffusion-weighted, Intravoxel Incoherent Motion, and Dynamic Contrast-enhanced MR Imaging in the Assessment of Response to Radiotherapy of Lytic Bone Metastases from Breast Cancer. Academic Radiology 21, 1286–1293, https:// doi.org/10.1016/j.acra.2014.05.021 (2014).
42. Milardi, D. et al. Basal ganglia network by constrained spherical deconvolution: A possible cortico-pallidal pathway?: Direct Cortico-Pallidal Pathway. Movement Disorders 30, 342–349, https://doi.org/10.1002/mds.25995 (2015).
43. Szafer, A. 1, Zhong, J. & Gore, J. C. Theoretical model for water diffusion in tissues. Magn Reson Med 33(5), 697–712, https://doi. org/10.1002/mrm.1910330516 (1995).
Author contributions
Daniela Sapienza, Michele Gaeta, Alessio Asmundo: guarantors of integrity of entire study; study concepts and design; Daniela Sapienza, Salvatore Silipigni, Ugo Barbaro, Antonella Cinquegrani, Patrizia Gualniera: literature research; Daniela Sapienza, Michele Gaeta, Salvatore Silipigni, Ugo Barbaro, Antonella Cinquegrani: data analysis/interpretation; Valeria Barresi: histological data; Salvatore Silipigni, Antonio Bottari: statistical analysis; Salvatore Silipigni, Ugo Barbaro, Antonella Cinquegrani, Francesca Granata: manuscript preparation; All Authors: manuscript final version approval. All authors read and approved the final manuscript and they confirm that there are no other persons who satisfied the criteria for authorship but are not listed. The Authors further confirm that the order of authors listed in the manuscript has been approved by all of us.
competing interests
The authors declare no competing interests.
Additional information
Correspondence and requests for materials should be addressed to D.S. Reprints and permissions information is available at www.nature.com/reprints.
Publisher’s note Springer Nature remains neutral with regard to jurisdictional claims in published maps and institutional affiliations.
Open Access This article is licensed under a Creative Commons Attribution 4.0 International License, which permits use, sharing, adaptation, distribution and reproduction in any medium or format, as long as you give appropriate credit to the original author(s) and the source, provide a link to the Cre-ative Commons license, and indicate if changes were made. The images or other third party material in this article are included in the article’s Creative Commons license, unless indicated otherwise in a credit line to the material. If material is not included in the article’s Creative Commons license and your intended use is not per-mitted by statutory regulation or exceeds the perper-mitted use, you will need to obtain permission directly from the copyright holder. To view a copy of this license, visit http://creativecommons.org/licenses/by/4.0/.