See discussions, stats, and author profiles for this publication at: https://www.researchgate.net/publication/333673029
R-454C, R-459B, R-457A and R-455A as low-GWP replacements of R-404A:
Experimental evaluation and optimization
Article in International Journal of Refrigeration · June 2019
DOI: 10.1016/j.ijrefrig.2019.06.013 CITATIONS 6 READS 564 6 authors, including:
Some of the authors of this publication are also working on these related projects:
Commercial refrigeration systems of high energy efficiency and low GWP refrigerantsView project
Special Issue: Frontiers in Energy Research: Advances in Refrigeration Technologies for Climate Change MitigationView project Rodrigo Llopis Doménech
Universitat Jaume I
131 PUBLICATIONS 1,519 CITATIONS SEE PROFILE
Daniel Calleja Anta
Universitat Jaume I 13 PUBLICATIONS 31 CITATIONS SEE PROFILE Daniel Sánchez Universitat Jaume I 111 PUBLICATIONS 1,316 CITATIONS SEE PROFILE
Laura Nebot Andres
Universitat Jaume I
49 PUBLICATIONS 334 CITATIONS SEE PROFILE
All content following this page was uploaded by Rodrigo Llopis Doménech on 23 June 2019.
1
R-454C, R-459B, R-457A and R-455A as low-GWP replacements of
R-404A: Experimental evaluation and optimization.
Rodrigo Llopis
IIR,*, Daniel Calleja-Anta, Daniel Sánchez
IIR,
Laura Nebot-Andrés, Jesús Catalán-Gil, Ramón Cabello
Thermal Engineering Group, Mechanical Engineering and Construction Department, Jaume I University, Spain
*Corresponding author: [email protected], +34 964 718136
Abstract
This work evaluates R-454C, R-459B, R-457A and R-455A as R-404A low-GWP substitutes in a stand-alone commercial refrigeration system for fresh product under ISO 23953-2. System is tested with and without receiver. Charge was optimized based on energy consumption tests in climatic chamber. A significant increment of the evaporating temperature of the new mixtures has been observed, which mitigate the negative effects associated to the large glide. Operation is compatible with R-404A for this system, offering energy consumption reductions for optimized charges without receiver of: 2.07% with R-454C, 10.76% with R-459B, 10.48% with R-457A and 2.95% R-455A. Energy consumption reductions with receiver are of 2.45% with R-454C, 11.55% with R-459B, 10.69% with R-457A and 2.9% with R-455A. In most of the cases the optimum refrigerant charge was below R-404A one. It is concluded that R-404A low-GWP substitutes can reduce refrigerant charge and improve energy performance in relation to R-404A.
Keywords
R-404A; R-454C; R-459B; R-457A; R-455A; mass charge reduction
2
Nomenclature
COP coefficient of performance
E energy consumption, kWh
EEV electronic expansion valve
Glide temperature difference in a constant pressure phase-change, K GWP 100 year global warming potential
h enthalpy, kJ·kg-1
m refrigerant mass flow rate, kg·s-1
M molecular mass, g·mol-1
NBP normal boiling point, ºC
p absolute pressure, bar
PC power consumption, kW
RH relative humidity, %
s entropy, kJ·kg-1·K-1
SH degree of superheat at evaporator, K SUB degree of subcooling at condenser, K
t temperature, ºC and time, s
VCC volumetric cooling capacity, kJ·m-3
xv vapour title
Greek symbols
∆ increment 𝑣 specific volume, m3·kg-1λ latent heat of phase change, kJ·kg-1
σ standard deviation
Subscripts
a airc critical point
cam climatic chamber
dis compressor discharge
exp expansion valve
ihx internal heat exchanger imp impulsion in inlet K condensing level max maximum min minimum O evaporating level out outlet
on when compressor is in operation
p product
R / ref reference test. R-404A with 1500g and liquid receiver. ret return
s isentropic process
3
1. Introduction
Commercial refrigeration sector includes hermetic stand-alone, condensing unit and multipack refrigeration systems, accounting for approximately 32% of world HFC consumption. Hermetic stand-alone appliances reached 32 million units plus 20.5 million vending machines in 2011, and they usually rely on R-22, R-134a, R-404A and R-507A or in small new equipment on R-290, however, the most used refrigerant for commercial plug-in display cases for all temperature levels is still R-404A (UNEP, 2015). Although plug-in display cases are supposed to present a low annual leakage rate, of 2% according to Defra (2012), Europe has fixed a GWP limit of 2500 from 01/01/2020 on and of 150 from 01/01/2022 on to the refrigerant used in refrigerators and freezers for commercial used hermetically sealed, which results in the end of use of R-404A and other high GWP refrigerants (European Commission, 2014).
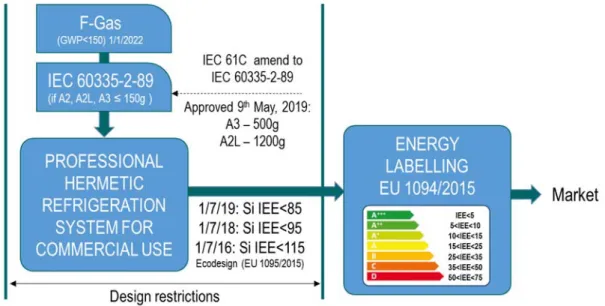
This segment of appliances is facing a difficult situation that is schematized in Figure 1 for Europe. First, the F-Gas Regulation fixes the GWP limit to 150g from 01/01/2022 on, which implies the use of A2, A2L or A3 refrigerants, since no A1 alternatives exist at the moment (McLinden et al., 2017) except of CO2, which is not considered by industry because the increment in cost of the system and because it reaches low energy efficiency using single-stage cycles. Second, the maximum permitted refrigerant charge with A2, A2L or A3 refrigerants is still of 150g now in European countries regulations (International Electrotechnical Commission., 2010), generally insufficient for medium-size plug-in cases for commercial use. And then, they must accomplish with the Eco-design Directive (European Commission, 2015b) and the Energy labelling Directive (European Commission, 2015a). However, the International Electrotechnical Commission has been evaluating the increment of maximum allowed refrigerant charge to 500g for A3 refrigerants and to 1200g for A2 or A2L refrigerants (Kopchick and Scancarello, 2017), which will increase the possibilities for this segment of refrigeration systems. Recently, on 9th May 2019, IEC announced that the increment of charge limit (500g of A3 and 1200g of A2 and A2L) has been approved (International Electrotechnical Commission, 2019), however the adaptation of state regulations is still pending. Accordingly, research on new available refrigerants is needed to explore the possibilities of R-404A substitution in stand-alone systems.
4
Figure 1. European design restrictions to hermetic refrigeration systems for commercial use
Table 1 summarises the evolution of most known R-404A substitutes classified according to their GWP
value. They can be also considered as substitutes of R-507A due to their similar properties (Llopis et al., 2010). R-422A and R-417B were designed as drop-ins for R-22, however, they were also used as substitutes of R-404A. Later, the A1 mixtures R-407A and R-407F, with GWP between 1500 to 2500, were ideated as drop-in replacements (compatible with F-Gas until 01/01/2020). And R-452A was designed as R-404A substitute for transport applications (Kujak S. et al., 2015) .R-407A matched the efficiency but presented nearly 10% reduction in capacity in relation to R-404A (Yana Motta S. et al., 2014). R-407F presented 10% approximately increment in capacity and performance in relation to R-404A (Bortolini et al., 2015; Yana Motta S. et al., 2014). The next group of R-404A drop-in refrigerants, R-407H, R-449A and R-448A, based on HFC-32 and HFC-125 as main components and still presenting an A1 security classification, had a GWP value ranging from 500 to 1500. R-407H was tested in a single-stage low-temperature direct expansion system, where 7.7% reduction in energy consumption in reference to R-404A was measured (Llopis et al., 2017). R-449A was evaluated in a retrofit process in an indirect supermarket refrigeration system at MT, where it was observed a 12.8% reduction in capacity and 3.6% COP decrement in relation to R-404A (Makhnatch et al., 2017). For R-448A, Yana Motta S. et al. (2014) with a walk-in cooler at freezing temperatures observed it presented higher efficiency (≈10%) and similar capacity than R-404A, however, using a single-stage test rig at evaporating temperatures from -33.5 to -8.1ºC, Mota-Babiloni et al. (2015) measured increments on COP from 5 to 20% with capacity reductions from 10 to 25% approximately. Finally, the group of R-404A substitutes with most interest at the moment for stand-alone systems which are in agreement with the F-Gas Regulation are those with GWP values below 150. Those mixtures, whose main components are HFC-32, HFO-1234yf and HFO-1234ze(E) present an A2L ASHRAE security classification. In consequence, the maximum allowed charge limit is of 150g at the moment, but it is expected to rise to 1200g during 2019 (Kopchick and Scancarello, 2017). R-454C, mixture of R-32 and R-1234yf, was
5
tested in a single-stage test rig at evaporating temperatures from -30 to -15 ºC approx. by Mota-Babiloni et al. (2018) measuring slightly lower capacity but COP increments between 10 to 15% in relation to R-404A. Bella et al. (2018) using a scroll compressor measured reductions in capacity of R-454C near 15% in MT and LT and COP increments of 5% at MT (not reported at LT). R-455A, mixture of HFC-32/HFO-1234yf with 3% of CO2, was also tested by the last two authors in the same plants, who reached similar COP and capacity modifications than for R-454C. However, no experimental reports have been found by the authors in relation to R-457A, mixture of 1234yf/HFC-152a and R-459B, blend of HFC-32/HFO-1234yf/HFO-1234ze(E).
Since experimental research on R-404A substitutes with GWP below 150 is scattered and incomplete and no works have been found using real systems, this work aims to contribute by presenting the experimental evaluation of R-454C, R-455A, R457A and R-459B as R-404A substitutes for stand-alone hermetic systems in a real application. An open type plug-in case for commercial use at MT (5ºC) using a single-stage cycle with a hermetic compressor and designed for R-404A, has been subjected to refrigerant charge optimization and evaluated according to ISO 23953-2:2015 (2015) under 24-hour energy consumption tests.
6
2. Thermodynamic approach
Properties of R-404A substitutes considered in this work are detailed in Table 2. Main components of mixtures are HFC-32 and HFO-1234yf, with small proportions of CO2 (R-455A), HFC-152a (R-457A) or HFO-1234ze(E) (R-459B). They all present a GWP below 150 and had an A2L ASHRAE security classification. Pressure-enthalpy diagrams are presented in Figure 2, where it can be observed that the blends in relation to R-404A present a similar bubble saturation line, higher critical pressure/temperature, larger latent heat of phase change (between 27.8 to 38.4% at t=40ºC and 17.8 to 24.9% at t=-7ºC) and higher specific suction volume (between 24.4 to 56.1%, saturation at t=-7ºC). In addition, one common characteristic is that the blends present a large glide due to the association of components with very different NBP, it varying between 6.1 to 9.9 K at t=40ºC and between 7.0 to 12.15 K at t=-7ºC. The large glide could have influence in the thermal performance of evaporator and condenser, since large temperature difference in phase-change processes generally lowers the heat transfer coefficients.
Figure 2. Pressure-enthalpy diagram of low-GWP alternative refrigerants
Figure 3 relates a theoretical comparison of the main properties of an ideal single-stage VCS working with the blends in relation to R-404A, which parameters are backgrounded in grey, at tO=-7ºC, tK=40ºC, SH=10K and SUB=2K. For the calculation, in order to consider the glide effect, the condensing pressure has been evaluated with a vapour title of 50%, Eq. (1), and the evaporating one with the average enthalpy in the evaporator, Eq. (2), considering an isenthalpic expansion process. For these pressures, VCC [Eq. (3)], COP [Eq.(4)], 𝑥 , , [Eq. (4)], 𝑡 , , and effective glide in evaporator [Eq.(6)] and condenser [Eq. (7)] are
7 𝑝 𝑓 𝑡 , 𝑥 0.5 (1) 𝑝 𝑓 𝑡 ,ℎ , ℎ , 2 (2) 𝑉𝐶𝐶 ℎ , ℎ , 𝑣 , (3) 𝐶𝑂𝑃 ℎ , ℎ , ℎ , 𝑝 , 𝑠 , ℎ , (4) 𝑥 , , 𝑓 𝑝 , ℎ , (5) 𝐺𝑙𝑖𝑑𝑒 𝑡 𝑝 , 𝑥 1 𝑡 𝑝 , 𝑥 , , (6) 𝐺𝑙𝑖𝑑𝑒 𝑡 𝑝 , 𝑥 1 𝑡 𝑝 , 𝑥 0 (7)
In Figure 3 it is observed that the four substitutes offer theoretically a COP increment (R-454C 5.3%, R-459B 5.8%, R-457A 7.4%, R-455A 5.8%) but different behaviour in terms of VCC (R-454C -8.4%, R-459B -10.5%, 457A -15.4%, 455A +0.9%). Despite the large effective glide in evaporator (from 4.5K of 457A to 7.23K of 455A), the four blends present lower vapour quality at the inlet of the evaporator (for R-404A 𝑥 , , = 0.39). The lower vapour quality at the evaporator inlet could compensate the reduction of local heat transfer coefficients of the zeotropic mixtures and maintain a similar thermal behaviour in the evaporator. All mixtures present a large glide in condenser (from 6.14K R-457A to 9.86K R-455A), which will have effect in the condensing temperatures. And all they present similar isentropic discharge temperatures to R-404A.
8
Figure 3. Theoretical thermodynamic performance of low-GWP refrigerants at tO = -7ºC, tK = 40ºC, SH = 10K, SUB = 2K (in grey R-404A values) (IPCC, 2014)
3. Material and methods
This section describes the experimental system in subsection 3.1 and the experimental procedure in subsection 3.2 used for the evaluation of the refrigerants in a real application.
3.1. Experimental system
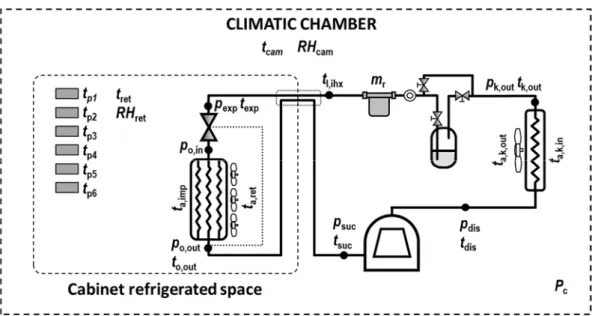
The evaluation considered an open-fronted vertical display cabinet with a frontal air curtain for refrigerated food, which uses a single-stage vapour compression system to maintain the desired product temperature, being its schematic diagram represented in Figure 4. The refrigeration system is driven by a hermetic compressor of 22.37cm3 displacement designed for R-404A. Condensation is performed with a minichannel air condenser and at the exit of the condenser is placed the liquid receiver. For the purpose of this work, the system has the possibility to operate with and without receiver using manual sectioning valves. Then, liquid refrigerant pipe enters into the refrigerated section of the cabinet in contact to the vapour pipe, thus there is a small heat transfer between the liquid and vapour lines. The refrigerant is expanded using an EEV that
9
controls the degree of superheat at the evaporator exit. The driver of the EEV can be customized for any kind of mixture by programming the bubble and dew point curves. Next, refrigerant is evaporated in a finned tube evaporator using three high-efficient fans. Air is suctioned at the front part of the cabinet, then passes through the evaporator and it is driven through the rear part of the cabinet. The air current is propelled from the top of the cabinet, creating the air current that isolates the refrigerated space from the surroundings. The rest of the components are placed at the bottom of the refrigerated space. Details about the components of the refrigeration cycle are given in Table 3.
The cabinet is instrumented to obtain the thermodynamic states of refrigerant and to measure the operating temperatures. As presented in Figure 4, 6 surface T-type surface thermocouples are used in the cycle and 4 T-type probe thermocouples measure the inlet and outlet air temperatures from evaporator and condenser. A thermo-hygrometer is placed at the evaporator air return to obtain the temperature and humidity in the refrigerated space and another above the cabinet to measure the surrounding temperature and humidity. Product temperature is measured using 6 M-test packages according to ISO 25953-2. The cycle has three low and three high-pressure gauges, and a Coriolis mass flow meter at the exit of the receiver. Energy consumption is measured using a digital wattmeter. Measuring range and uncertainties of the measurement system is described in Table 4.
Figure 4. Schematic diagram of the refrigeration cycle of the display cabinet
3.2. Experimental procedure
This work aims to explore the possibilities of new refrigerant options with GWP below 150 to substitute R-404A in medium temperature applications, thus results are based on energy consumption tests according to ISO 23953-2:2015 (ISO 23953-2:2015, 2015). Additionally, since alternatives have A2L ASHRAE classification, we aim to quantify the refrigerant charge that minimizes energy consumption. This charge must be in agreement with the future charge limit that will be established by the standard IEC60335-2-89
10
(International Electrotechnical Commission., 2010). The last proposal for the IEC modification was 1200g of A2L as maximum charge for stand-alone systems (Kopchick and Scancarello, 2017).
Two types of 24-hour energy consumption tests were performed:
Operation without receiver: refrigerant charge optimized (100g step) in terms of 24h energy consumption.
Operation with liquid receiver (denoted with R): the system was evaluated working with the receiver ensuring liquid at the inlet of the EEV.
The tests were performed inside a climatic chamber at 25.5ºC and 50% of relative humidity, corresponding to a 3-climate class approximately, maximum deviations were ±0.8K and ±7% respectively during the 24h. The target temperature of the product was established at 5ºC (average of six M-test packages during 24h). Regulation of the cabinet was the following:
Compressor: ON/OFF operation, activated by air return temperature to the evaporator. Set-point was adjusted (0.7 – 1.1ºC) to obtain the required product temperature. Hysteresis of the regulator was set at 2.5K.
EEV: superheating set point set at 10K.
Defrosting: one defrosting each six hours was set. It was done with electrical resistors (540W) and ended when the air return temperature to the evaporator was of 14.5ºC. When resistors were activated, both compressor and EEV were not in operation.
Figure 5 details the reference temperatures in a 24-hour test of the cabinet working without receiver and
11
12
4. Experimental results
First, in Section 4.1 the results of charge optimization are discussed and second, in Section 4.2, the operation of the cabinet is analysed for the optimized configurations.
4.1. Optimization results
Cabinet was subjected to a charge optimization process working without liquid receiver with charge steps of 100g. Refrigerant charge was done subsequently, being the measuring error of the balance of 2g. Charge uncertainty is presented in Table 5. For each charge, if the cabinet was able to maintain the product target temperature (5ºC), its energy consumption during 24 hours was calculated. Reference parameters were kept constant in the tests, as summarized in Table 5. Energy consumption (kWh) was computed using cabinet’s power consumption measurement and operating time according to Eq. (8) using a trapezoid integration method. In Eq. (8), PC is the power consumption of the cabinet and ‘j’ each sampled data. The sampling step was of 5 seconds.
𝑬𝒊 𝟑𝟔 𝟏𝟎𝟏 𝟓 𝑷𝑪 𝒕 𝒅𝒕 𝟐𝟒𝒉 𝟎 𝟏 𝟑𝟔 𝟏𝟎𝟓 𝑷𝑪 𝒋 𝑷𝑪 𝒋 𝟏 𝟐 𝒕 𝒋 𝒕 𝒋 𝟏 𝟐𝟒𝒉 𝒋 𝟏 (8) When the optimization process ended, the refrigeration cycle was evaluated using the receiver configuration, where it was verified that the inlet pipe to the EEV was filled with liquid in all the tests.
As reference, the test with 1500g of R-404A working with liquid receiver was considered, since it was the optimum refrigerant charge working with receiver for R-404A according to the manufacturer.
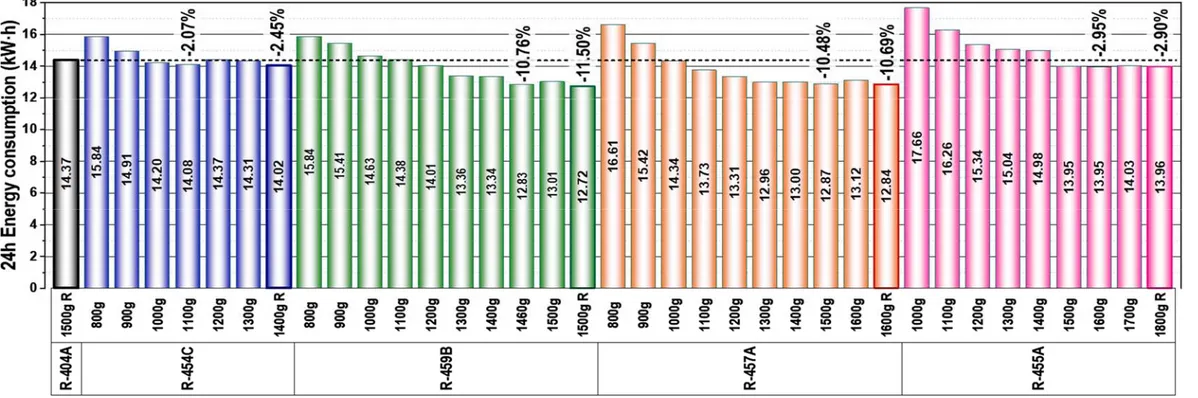
Energy consumption in the optimization process is presented in Figure 6. As it can be observed, when working without liquid receiver the energy consumption is reduced for increased refrigerant charge until reaching a minimum, then it increases, as observed in similar systems (Maiorino et al., 2018). The optimization process revealed that the optimum refrigerant charges for the substitute were: 1100g R-454C, 1460g R-459B, 1500g R-457A and 1600g R-455A. All mixtures, with optimized refrigerant charge, were able to reduce energy consumption in relation to the R-404A configuration. Also, denoted with ‘R’ the energy consumption of the cabinet with receiver is presented, where it can also be observed that all refrigerants improve energy performance in relation to the reference.
In relation to the possible future charge limit for stand alone systems, 1200g for an A2L refrigerant (Kopchick and Scancarello, 2017), the unique optimized refrigerant charge that will accomplish this limit is R-454A, with a reduction in energy consumption of 2.07%. However, with 1200g of R-459B the energy consumption reduction will be of 2.51%, with 1200g of R-457A of 7.42% and with 1200g of R-455A will be incremented by 6.73%.
13
14
4.2. Optimized configurations results
This section analyses the operating results of the cabinet for the optimized configurations and with receiver. Temperature and pressure parameters
Evaporating temperature was computed with Eq. (9) considering the outlet pressure of the evaporator and the average enthalpy between the inlet conditions and saturated vapour at the outlet pressure of the evaporator. This value was averaged during all the test, since the evaporator fans were in constant operation. A increment in the average evaporating temperature was measured for all the substitutes in relation to R-404A: 3.5 to 3.7K for R-454C, 4.6 to 4.8K for R-459B, 3.9 to 4.9K for R-457A and 5.7 to 6.5K for R-455A (Figure 7). That indicates that evaporator’s thermal performance improved with the mixtures, thus the negative effects of the glide (reduction of local heat transfer coefficients) are compensated by lower vapour quality at the inlet of the evaporator, as commented in section 2.
In relation to the condensing temperature, evaluated with Eq. (10) and averaged only when the compressor was in operation, in general there was an increment of this value for all the mixtures except for R-454C. The highest increment was measured with R-455A (4.8 to 6.4K), it being related with the presence of CO2 in the mixture.
𝑡 𝑓 𝑝 , ; ℎ ℎ , ℎ , ,
2 (9)
𝑡 𝑓 𝑝 , 𝑥 50% (10)
Figure 7. Average phase-change temperatures during 24h (tK when compressor ON)
Figure 8 reflects the average and maximum compressor’s discharge temperatures during the 24h when the compressor was in operation. Deviations in relation to R-404A are low, except for R-455A which registered
15
an increment between 3.6 to 5.3K for the average value and between 4.7 to 6.4K for the maximum value. This increment is significative, since according to the duty cycle of R-455A (≈47%), for systems with longer duty cycle the maximum compressor’s discharge temperature could have highest increments that could affect the lubricant. Again, this increment can be related to the CO2 presence in the mixture.
Figure 8. Average and maximum compressor’s discharge temperature during 24h (when compressor ON) Another important aspect in the substitution process is the operating pressure. Figure 9 presents the maximum discharge and minimum suction pressures during the tests. Configurations without receiver always operate at highest pressures in relation to receiver ones, allowing to operate with higher subcooling (Table 5). Discharge pressures were lower for R-454C, R-459B and R-457A and higher for R-455A, nonetheless the variations were low. In relation to minimum suction pressure, R-454C, R-459B and R-457A operated with a similar minimum pressure than R-404A, however, the minimum pressure for R-455A was 0.42 to 0.63 bar higher.
16
Figure 9. Maximum discharge and minimum suction pressures during 24h Energy parameters
Energy consumption is the combination of the power consumption and the operating time of the compressor and auxiliary elements, Eq. (8). Figure 10 presents compressor duty cycle and average cabinet power consumption (only when compressor in operation) during the tests and Figure 11 the disaggregated energy consumption during the 24h for the optimized configurations.
R-454C, in relation to R-404A, presents longer duty cycle and reduced compressor’s consumption, it being in agreement with the thermodynamic approach (Figure 3), since lower VCC and higher COP were predicted. In addition, defrosting period average time of R-454C [19.3min, 16.0min (R)] was similar to that of R-404A [19.3 min (R)].
For R-459B, the theoretical approach predicted reduced VCC and highest COP. Experimentally, both duty cycle and average power consumption were reduced, resulting in lowest energy consumption in relation to R-404A. Discrepancy between theoretical and experimental results are related to the shorter defrosting average time or R-459B [13.5min, 12.1min (R)], which reduces the thermal load of the cabinet. This reduction in time is caused by the increased evaporating temperature (Figure 7).
R-457A, with predicted reduction in VCC and increment in COP, presented a similar duty cycle and reduced compressor power consumption in relation to R-404A. Again, the similar duty cycle among them is related to the shortest defrosting period [13.3min, 12.6min (R)].
Finally, R-455A with predicted similar VCC and highest COP, presented a reduction in the duty cycle and increased compressor power consumption in relation to R-404A, resulting in similar energy consumption. In
17
terms of average defrosting time, with this mixture the shortest periods were measured [10.2min, 11.3min (R)]. Those shortest periods are related to the highest evaporating level (Figure 7).
Figure 10. Compressor duty cycle and average cabinet power consumption during 24h
18
5. Conclusions
Experimental and theoretical substitution process of R-404A by the low-GWP alternatives R-454C, R459-B, R-457A and R-455A has been addressed with an open-fronted vertical cabinet for fresh product (5ºC) according to energy consumption tests based on ISO 25953-2.
Thermodynamic approach indicates that the substitutes offer similar VCC and a slight increase in COP for the operation at tO=-7ºC and tK=40ºC. A relevant reduction of the inlet vapour quality to the evaporator is predicted, which will compensate the negative effect of glide of the mixtures.
For the cabinet without receiver, optimized refrigerant charges offered energy consumption reductions in relation to R-404A: 2.07% R-454C (1100g), 10.76% R-459B (1460g), 10.48% R-457A (1500g) and 2.95% R-455A (1600g). Those improvements were slightly larger when working with receiver: 2.45% R-454C (1400g), 11.55% R-459B (1500g), 10.69% R-457A (1600g) and 2.9% R-455A (1800g).
For both system configurations, an increase in the evaporating level was measured for all the mixtures, indicating an improvement of the evaporator’s thermal performance, which is not much affected by the glide of the mixtures. The increased evaporating level resulted in general in shorter defrosting periods, which reduced the thermal load to the cabinet. Compressor discharge temperatures and pressures were similar to R-404A ones; thus, no difficulties are expected in the substitution process for similar systems.
Additionally, if the proposed refrigerant charge limit of 1200g for A2L refrigerants in stand-alone systems is considered, the configuration without receiver offers energy consumption differences in relation to R-404A of: -2.07% R-454C (1100g), -2.51% R-459B (1200g) and -7.42% R-457A (1200g). Energy consumption with 1200g of R-455A resulted in an energy consumption increment of 6.73%.
From the theoretical approach and the experimentation, it is concluded that it is possible to substitute R-404A by the new low-GWP refrigerant mixtures in stand-alone systems similar to this, with reduced refrigerant charges and with reduced energy consumption.
Acknowledgements
Authors gratefully acknowledge Conselleria d’Educació, Investigació, Cultura i Esport de la Generalitat Valenciana for financing this research work (project AICO/2018/058) and to Frost-Trol S.A. (www.frost-trol.com) for supplying the original cabinet.
19
References
Bella, B., Pham, H., Rajendran, R., 2018. Sustainable refrigerants for comfort and refrigeration, 1st IIR International conference on the application of HFO refrigerants, Birmingham, UK. Int. Inst. Refrigeration,, Birmingham, UK.
Bolaji, B.O., Oyelaran, O.A., Okoye, O.C., 2017. Thermodynamic study of environment-friendly R429A, R435A AND R457A refrigerants as substitutes for ozone depleting r22 in refrigeration and air-conditioning systems. Pomorstvo 31, 45-52.
Bortolini, M., Gamberi, M., Gamberini, R., Graziani, A., Lolli, F., Regattieri, A., 2015. Retrofitting of R404A commercial refrigeration systems using R410A and R407F refrigerants. International Journal of Refrigeration 55, 142-152.
Defra, 2012. 2012 Guidelines to Defra / DECC’s GHG conversion factors for company reporting: methodology paper for emission factors. Department for Environment, Food and Rural Affairs, London, UK. European Commission, 2014. Regulation (EU) No 517/2014 of the European Parliament and of the Council of 16 April 2014 on fluorinated greenhouse gases and repealing Regulation (EC) No 842/2006.
European Commission, 2015a. COMMISSION DELEGATED REGULATION (EU) 2015/1094 of 5 May 2015 supplementing Directive 2010/30/EU of the European Parliament and of the Council with regard to the energy labelling of professional refrigerated storage cabinets.
European Commission, 2015b. COMMISSION REGULATION (EU) 2015/1095 of 5 May 2015 implementing Directive 2009/125/EC of the European Parliament and of the Council with regard to ecodesign requirements for professional refrigerated storage cabinets, blast cabinets, condensing units and process chillers. Fernández-Seara, J., Uhía, F.J., Diz, R., Dopazo, J.A., 2010. Vapour condensation of R22 retrofit substitutes R417A, R422A and R422D on CuNi turbo C tubes. International Journal of Refrigeration 33, 148-157. International Electrotechnical Commission., 2010. IEC 60335-2-89:2010. Household and similar electrical appliances - Safety - Part 2-89: Particular requirements for commercial refrigerating appliances with an incorporated or remote refrigerant unit or compressor.
International Electrotechnical Commission. Voting Result 61C/792/FDIS, SC 61C Safety of refrigeration appliances for household and commercial use. . 2019; Available from: https://www.iec.ch/dyn/www/f?p=103:52:0::::FSP_ORG_ID,FSP_DOC_ID,FSP_DOC_PIECE_ID:1349,101 7377,326940 (last access 15/05/2019).
20
IPCC, 2014. Climate Change 2014: Synthesis Report. Contribution of Working Groups I, II and III to the Fifth Assessment Report of the Intergovernmental Panel on Climate Change [Core Writing Team, R.K. Pachauri and L.A. Meyer (eds.)]. IPCC, Geneva, Switzerland, 151 pp.
ISO 23953-2:2015, 2015. Refrigerated display cabinets - Part 2: Classification, requirements and test conditions.
Kopchick, S., Scancarello, M., 2017. New refrigerants designation and safety classifications, E360 Forum, Chicago, IL, USA. (https://climate.emerson.com/documents/chicago-%E2%80%93-new-refrigerants-designation-safety-classifications-en-us-3663334.pdf) (last access: November 2018).
Kujak, S., et al. Assessment of next generation refrigerant R452A to replace R404A for transport refrigeration products. in Refrigeration Science and Technology. 2015.
Lemmon E. W., I.H., B., L., H.M., O., M.M., 2018. NIST Standard Reference Database 23: Reference Fluid Thermodynamic and Transport Properties-REFPROP, Version 10.0, National Institute of Standards and Technology.
Llopis, R., Cabello, R., Sánchez, D., Torrella, E., Patiño, J., Sánchez, J.G., 2011. Experimental evaluation of HCFC-22 replacement by the drop-in fluids HFC-422A and HFC-417B for low temperature refrigeration applications. Applied Thermal Engineering 31, 1323-1331.
Llopis, R., Sánchez, D., Cabello, R., Nebot-Andrés, L., Catalán-Gil, J., 2017. R-407H as drop-in of R-404A. Experimental analysis in a low temperature direct expansion commercial refrigeration system. International Journal of Refrigeration 80, 11-23.
Llopis, R., Torrella, E., Cabello, R., Sánchez, D., 2010. Performance evaluation of R404A and R507A refrigerant mixtures in an experimental double-stage vapour compression plant. Applied Energy 87, 1546-1553.
Maiorino, A., Aprea, C., Del Duca, M.G., Llopis, R., Sánchez, D., Cabello, R., 2018. R-152a as an alternative refrigerant to R-134a in domestic refrigerators: An experimental analysis. International Journal of Refrigeration 96, 106-116.
Makhnatch, P., Mota-Babiloni, A., Rogstam, J., Khodabandeh, R., 2017. Retrofit of lower GWP alternative R449A into an existing R404A indirect supermarket refrigeration system. International Journal of Refrigeration 76, 184-192.
McLinden, M.O., Brown, J.S., Brignoli, R., Kazakov, A.F., Domanski, P.A., 2017. Limited options for low-global-warming-potential refrigerants. Nature Communications 8, 14476.
21
Mota-Babiloni, A., Haro-Ortuño, J., Navarro-Esbrí, J., Barragán-Cervera, Á., 2018. Experimental drop-in replacement of R404A for warm countries using the low GWP mixtures R454C and R455A. International Journal of Refrigeration 91, 136-145.
Mota-Babiloni, A., Navarro-Esbrí, J., Peris, B., Molés, F., Verdú, G., 2015. Experimental evaluation of R448A as R404A lower-GWP alternative in refrigeration systems. Energy Conversion and Management 105, 756-762.
UNEP, 2015. 2014 Report of the refrigeration air conditioning and heat pumps technical options committee. 2014 Assessment., Kenya.
Yana Motta S., Pottker G., Spatz M., Kebby R., 2014. Low GWP replacements for R404A in commercial refrigeration applications., 3rd IIR International Conference on Sustainability and the Cold Chain. Proceedings. International Institute of Refrigeration, London, UK.
22
TABLES
Table 1. R-404A/R-507A drop-in substitutes MIXTURE
NAME Composition ( % by mass) GWP (AR4) GWP (AR5) SECURITY CLASS. Energy tests
R-404A HFC-125/ HFC-134a/ HFC-143a (44/4/52) 3922 3945 A1 (Llopis et al., 2010)
R-507A HFC-125/ HFC-143a (50/50) 3985 3987 A1 (Llopis et al., 2010)
2500 < GWP < 3000
R-422A HFC-125/ HFC-134a/HC-600a (85.1/11.5/3.4) 3144 2847 A1 (Fernández-Seara et al., 2010)
R-417B HFC-125/HFC-134a/HC-600 (79/18.25/2.75) 3027 2741 A1 (Llopis et al., 2011)
1500 < GWP < 2500
R-452A HFC-32/HFC-125/HFO-1234yf (11/59/30) 2140 1945 A1 (Kujak S. et al, 2015)
R-407A HFC-32/HFC-125/HFC-134a (20/40/40) 2107 1923 A1 (Yana Motta S. et al., 2014)
R-407F HFC-32/HFC-125/HFC-134a (30/30/40) 1825 1674 A1 (Bortolini et al., 2015; Yana Motta S. et al., 2014)
500 < GWP < 1500
R-407H HFC-32/HFC-125/HFC-134a (32.5/15/52.5) 1495 1378 A1 (Llopis et al., 2017)
R-449A HFC-32/HFC-125/HFO-1234yf/HFC-134a (24.3/24.7/25.3/25.7) 1396 1282 A1 (Makhnatch et al., 2017)
R-448A HFC-32/HFC-125/HFC-134a/HFO-1234yf/HFO-1234ze(E) (26/26/20/21/7) 1372 1260 A1 (Mota-Babiloni et al., 2015; Yana Motta S. et al., 2014)
GWP < 150
R-454C HFC-32/HFO-1234yf (21.5/78.5) 146 146 A2L (Mota-Babiloni et al., 2018) (Bella et al., 2018)
R-455A CO2/HFC-32/HFO-1234yf (3.0/21.5/75.5) 146 146 A2L (Mota-Babiloni et al., 2018) (Bella et al., 2018)
23
R-459B HFC-32/HFO-1234yf/HFO-1234ze(E) (21.0/69.0/10.0) 143 143 A2L -
Table 2. Physical, environmental and safety characteristics of low-GWP drop-ins of R-404A considered in this work
R-404A R-454C R-455A R-457A R-459B
Composition (% wt) R-125 – 44.0% R-32 – 21.5% R-744 – 3.0% R-32 – 18.0% R-32 – 21.0%
R-143a – 52.0% R-1234yf – 78.5% R-32 – 21.5% R-1234yf – 70.0% R-1234yf – 69.0%
R-134a – 4.0% R-1234yf – 75.5% R-152a – 12.0% R-1234ze(E) – 10.0%
M (g·mol-1) 97.6 90.8 87.5 87.6 91.2 NBP (ºC) -46.2 -45.6 -52.0 -42.6 -45.0 tC (ºC) 72 85.7 85.6 91.3 87.5 pC (bar) 37.2 43.2 46.5 43.4 43.6 Glide at 40ºC (K) 0.34 6.82 9.86 6.14 7.04 Glide a -7ºC (K) 0.54 7.82 12.15 7.01 8.13 λ a t = 40°C (kJ · kg-1) 120.5 154.0 160.0 166.8 156.2 λ a t = -7°C (kJ · kg-1) 172.31 202.73 211.83 215.18 204.17 ν a t=-7°C (m3 · kg-1) 0.041 0.054 0.051 0.064 0.056 GWP100 years (IPCC, 2014) 3943 146 146 139 143
25 Table 3. Main components of the cabinet and refrigeration cycle
Component Characteristics
Cabinet Open-fronted vertical display cabinet
Compressor Hermetic, Embraco NT6226GK, 22.37 cm3, POE22
Expansion valve Electronic, Carel E2V11, configurable driver
Evaporator Finned tube, 1074mm length, 360mm width, 150mm height, 1/2’’ tube, 3 circuits, 1.51mvolume 2 refrigerant surface area, 5.63 litre inner
Condenser Minichannel air condenser, 531mm length, 240mm width, 60mm height, 4.6x19mm channels, 0.5mlitre inner volume 2 refrigerant surface area, 1.15
Receiver 1.1 litre
Discharge line 1/4’’ tube, 0.75 m length
Liquid line 1/4’’ tube, 3.01 m length
26 Table 4. Technical specifications of the instrumentation
Variable Number Sensor Measuring range Uncertainty
Temperature 6 Surface T-type thermocouple -200 – 350ºC ± 0.5 K
Temperature 4 Probe T-type thermocouple -200 – 350ºC ± 0.5 K
Temperature / humidity 2 Thermo-hygrometer
5 – 98% -20 – 80ºC
± 2% RH ± 0.2 K
Package temperature 6 M-test package with T-type thermocouple -200 – 350ºC ± 0.5 K
Low pressure 3 Pressure gauge -1 – 15 bar ± 0.3%
High pressure 3 Pressure gauge 0 – 30 bar ± 0.3%
Power consumption 1 Digital wattmeter 0 – 2500 W ± 0.5%
27 Table 5. Reference, operating and energy parameters of the evaluation of the refrigerants
28
Reference parameters Operating parameters cycle Duty Energy parameters
Charge (g) Charge uncertainty (%) tP (ºC) σ(K) t,P t(ºC) cam σ t,cam (K) RH cam (%) σ RH,cam (%) t(ºC) K,on (ºC) tO t dis,on (ºC) SH on (K) SUB(K) on p dis,max (bar) p suc,min (bar) Comp (%) P C (W) E 24h (kWh) (E – Eref ) / Eref·100 (%) R-404A 1500 0.13 5.0 0.4 25.3 0.7 53.3 7.0 41.5 -9.0 83.2 10.1 12.9 21.9 2.8 53 992 14.37 0.0 R-454C 800 0.25 5.0 0.4 25.2 0.6 55.3 5.9 38.4 -4.7 81.8 9.8 7.6 16.7 3.1 63 947 15.84 10.17 900 0.31 5.0 0.4 25.1 0.6 55.6 6.1 39.3 -5.5 82.2 10.0 8.8 17.3 2.8 59 935 14.91 3.73 1000 0.45 5.0 0.4 25.4 0.8 53.6 6.7 40.2 -5.7 82.7 10.3 9.9 17.3 2.8 56 938 14.20 -1.18 1100 0.57 5.0 0.4 25.6 0.8 52.8 6.7 41.1 -5.3 83.1 10.0 10.9 18.4 2.9 55 948 14.08 -2.07 1200 0.69 5.0 0.5 25.6 0.9 53.3 6.7 42.3 -5.2 83.4 11.9 12.2 20.4 2.9 54 959 14.37 -0.01 1300 0.78 4.8 0.5 25.7 0.9 53.4 5.9 44.1 -4.9 84.5 9.2 13.8 19.1 3.0 54 970 14.31 -0.44 1400 R 0.87 4.9 0.4 25.6 0.8 54.7 5.1 40.4 -5.6 81.6 11.8 8.4 18.2 2.8 55 940 14.02 -2.45 R-459B 800 0.25 5.0 0.3 25.2 0.5 53.9 4.6 40.8 -5.6 87.8 5.2 9.7 17.4 2.8 65 936 15.84 10.19 900 0.31 5.0 0.4 25.5 0.7 51.4 5.9 41.1 -6.0 87.4 5.2 9.5 17.6 2.8 63 934 15.41 7.23 1000 0.45 5.0 0.4 25.5 0.8 51.1 5.7 41.7 -5.4 86.6 9.1 9.5 17.7 2.9 58 941 14.63 1.80 1100 0.57 5.0 0.4 25.6 0.8 51.3 5.4 42.0 -5.3 86.4 9.8 9.6 17.8 2.9 57 947 14.38 0.02 1200 0.69 4.9 0.3 25.6 0.8 51.2 5.3 42.0 -5.1 85.1 10.3 9.8 17.8 2.9 55 942 14.01 -2.51 1300 0.78 5.0 0.3 25.6 0.8 51.0 5.4 42.5 -4.6 84.4 9.2 10.8 18.3 2.9 52 948 13.36 -7.04 1400 0.87 5.0 0.3 25.7 0.8 51.3 5.3 43.6 -4.5 84.6 11.4 12.1 18.7 2.9 51 959 13.34 -7.18 1460 0.97 4.9 0.3 25.6 0.8 49.7 6.0 44.7 -4.2 84.3 10.9 13.8 19.7 2.9 48 966 12.83 -10.76 1500 1.07 5.0 0.3 25.6 0.8 50.2 5.8 45.9 -4.3 85.0 10.0 15.5 20.3 2.9 49 981 13.01 -9.52 1500 R 1.07 5.0 0.3 25.6 0.8 50.2 5.7 41.2 -4.5 81.9 13.1 8.9 17.8 2.8 50 938 12.72 -11.50 R-457A 800 0.25 5.0 0.2 25.2 0.5 53.2 4.6 38.9 -5.3 83.3 9.4 7.7 15.1 3.0 72 904 16.61 15.54 900 0.31 4.9 0.4 25.2 0.5 52.7 5.4 39.5 -5.9 83.7 8.3 8.1 15.6 2.8 66 888 15.42 7.25 1000 0.45 5.0 0.4 25.4 0.6 51.9 5.6 40.2 -5.9 83.9 9.5 8.5 15.9 2.7 61 883 14.34 -0.27 1100 0.57 5.0 0.3 25.4 0.7 51.0 5.6 40.7 -5.3 83.5 10.4 9.0 16.4 2.7 58 887 13.73 -4.46 1200 0.69 5.0 0.3 25.5 0.8 50.1 5.7 41.2 -4.7 83.0 11.2 9.5 16.4 2.7 55 895 13.31 -7.42 1300 0.78 5.0 0.3 25.5 0.8 50.1 5.6 42.3 -4.5 83.0 12.1 11.0 16.7 2.7 53 906 12.96 -9.81 1400 0.87 5.0 0.3 25.6 0.8 50.0 5.6 43.8 -4.4 83.6 11.1 12.6 17.8 2.7 52 918 13.00 -9.58 1500 0.94 5.0 0.3 25.5 0.8 50.2 5.6 45.5 -4.2 84.1 10.1 15.0 18.4 2.8 51 933 12.87 -10.48 1600 1.01 4.9 0.3 25.5 0.8 50.1 5.7 49.0 -4.0 86.4 10.2 19.4 20.7 2.8 50 959 13.12 -8.76 1600 R 1.01 4.9 0.3 25.5 0.8 50.5 5.5 40.6 -5.2 81.0 9.9 8.5 16.4 2.5 53 892 12.84 -10.69 R-455A 1000 0.4 5.0 0.2 25.6 0.8 49.4 6.0 40.7 -1.8 83.9 7.7 9.0 18.9 3.6 63 1080 17.66 22.83
29 1100 0.6 5.0 0.3 25.6 0.8 49.1 5.8 42.1 -1.4 85.5 6.4 9.7 19.4 3.8 57 1078 16.26 13.14 1200 0.7 5.0 0.3 25.6 0.8 49.5 5.5 43.5 -2.0 86.7 10.4 10.6 20.0 3.6 54 1073 15.34 6.73 1300 0.8 5.0 0.3 25.6 0.9 50.0 5.6 45.0 -2.7 88.9 7.1 12.5 21.1 3.4 52 1075 15.04 4.61 1400 0.9 4.9 0.3 25.6 0.8 50.1 5.6 45.3 -3.0 88.9 7.1 12.8 21.4 3.4 52 1075 14.98 4.19 1500 0.9 5.0 0.2 25.4 0.7 50.3 5.2 46.0 -2.5 87.7 8.1 14.2 21.6 3.4 48 1083 13.95 -2.94 1600 1.0 5.0 0.2 25.5 0.8 49.3 4.9 47.9 -2.6 88.5 7.2 16.1 23.7 3.4 47 1100 13.95 -2.95 1700 1.1 5.0 0.2 25.4 0.6 53.9 6.5 49.3 -2.9 88.4 7.7 17.7 23.4 3.4 47 1110 14.03 -2.36 1800 R 1.1 4.9 0.2 26.2 0.7 53.7 6.8 46.3 -3.3 86.8 7.4 13.7 21.6 3.2 48 1079 14.0 -2.90