n
THORACIC IMAGING
and Emphysema:
3D
Time-resolved MR Angiographic
Evaluation of Pulmonary Arterial
Mean Transit Time and Time to Peak
Enhancement
1
Gianluigi Sergiacomi , MD Francesca Bolacchi , MD Marcello Cadioli , PhD Maria Luigia Angeli , MD Francesco Fucci , MD Sonia Crusco , MD Paola Rogliani , MD Gabriella Pezzuto , MD Francesco Romeo , MD Enrica Mariano , MD Giovanni Simonetti , MD
Purpose: To correlate conventional invasive pressure indexes of pulmonary circulation with pulmonary fi rst-order arterial mean transit time (MTT) and time to peak enhancement (TTP) measured by means of three-dimensional time-resolved magnetic resonance (MR) angiography in pa-tients with combined pulmonary fi brosis and emphysema (CPFE).
Materials and Methods:
The study was institutional review board approved. All subjects involved in the study provided written informed consent. Eighteen patients with CPFE were enrolled in this study. Thirteen healthy individuals matched for age and sex served as control subjects. Three-dimensional time-resolved MR angiography was performed by using a 3.0-T MR imager. Regions of interest (ROIs) were drawn manu-ally on fi rst-order pulmonary arteries. Within the ROIs, signal intensity–versus-time curves refl ecting the fi rst pass of the contrast agent bolus in the pulmonary vessels were obtained. MTT and TTP were calculated. Pulmonary ar-terial pressure and pulmonary capillary wedge pressure were measured with a double-lumen, balloon-tipped cath-eter that was positioned in the pulmonary artery. The mean pulmonary arterial pressure (mPAP) and the pul-monary vascular resistance (PVR) were determined.
Results: MTT and TTP values were prolonged signifi cantly in patients with CPFE compared with those in the control subjects ( P , .001). Mean TTP and mean MTT correlated directly with mPAP and PVR index ( P , .005). At multiple linear regression analysis, MTT was the only factor independently associated with PVR index and mPAP.
Conclusion: Three-dimensional time-resolved MR angiography enables determination of pulmonary hemodynamic parameters that correlate signifi cantly with the pulmonary hemody-namic parameters obtained with invasive methods and may represent a complementary tool for evaluating pul-monary hypertension in patients with CPFE.
© RSNA, 2010
1 From the Department of Diagnostic and Molecular Imaging, Radiation Therapy and Interventional Radiology (G. Sergiacomi, F.B., M.L.A., F.F., S.C., G. Simonetti); Depart-ment of Internal Medicine, Pulmonary Division (P.R., G.P.); and Department of Internal Medicine, Cardiology Division (F.R., E.M.), University Hospital Policlinico Tor Vergata, Viale Oxford 81, 00133 Rome, Italy; and Philips Healthcare, Monza, Italy (M.C.). Received August 28, 2008; revision requested October 17; revision received March 2, 2009; accepted April 8; fi nal version accepted September 2. Address correspondence to F.B. (e -mail: [email protected] ).
pulmonary circulation with pulmonary fi rst-order arterial MTT and TTP mea-sured by means of three-dimensional (3D) time-resolved MR angiography in patients with CPFE.
Materials and Methods
Patients
This study was approved by the insti-tutional review board. All patients and control subjects involved in the study provided written informed consent. Eighteen patients with CPFE (12 men,
mean age 6 standard deviation: 63
years 6 4; six women, mean age: 62
years 6 6) were included in the study. Inclusion criteria were emphysema at CT, defi ned as well-demarcated areas of decreased attenuation (compared with contiguous normal lung) marginated by a thin (1-mm) wall or no wall, and/or multiple bullae and diffuse parenchymal lung disease with clinically important pulmonary fi brosis at CT, defi ned as reticular opacities, honeycombing, ar-chitectural distortion, and/or traction bronchiectasis or bronchiolectasis. Ex-clusion criteria were collagen vascular diseases; cardiac dysfunction, including myocardial infarction; and/or blood cell the major determinant of the prognosis.
The prevalence of pulmonary arterial hypertension is particularly high in pa-tients with CPFE and is higher than that reported with idiopathic pulmonary fi -brosis, chronic obstructive pulmonary disease, or pulmonary emphysema ( 3 ).
Although pulmonary hemodynamic parameters such as pulmonary vascu-lar resistance (PVR) and mean pulmo-nary arterial pressure (mPAP) can be assessed accurately by means of right-sided heart catheterization ( 8 ), a sim-ple, reliable, and noninvasive method to evaluate the pulmonary vascular hemo-dynamics in patients with CPFE would be preferable. Doppler echocardiogra-phy commonly is used to estimate the systolic pulmonary arterial pressure ( 8 ). However, echocardiographic fi ndings may be inaccurate and thus lead to con-siderable overdiagnosis of pulmonary arterial hypertension, and they do not enable direct measurement of PVR ( 9 ). The diagnostic usefulness of measuring the size of the main pulmonary arterial diameter within 3 cm of the bifurcation on computed tomographic (CT) scans, which has been proposed as having 84% sensitivity and 75% specifi city— albeit without having direct correlation with pulmonary arterial pressure ( 10 )— has not been confi rmed in subsequent larger studies ( 11 ). Time-resolved mag-netic resonance (MR) angiography is a noninvasive technique that enables not only anatomic imaging of the pulmonary vasculature but also evaluation of the
hemodynamics ( 12,13 ). In particular,
analysis of the MR angiographic signal intensity curves of pulmonary vessels could yield two parameters of vascu-lar physiologic relevance: time to peak enhancement (TTP) and mean transit time (MTT) ( 14 ). The purpose of the present study was to correlate con-ventional invasive pressure indexes of
I
diopathic pulmonary fi brosis is themost common among the interstitial lung diseases of unknown cause that are defi ned according to the 2001 Amer-ican Thoracic Society/European Respi-ratory Society international multidisci-plinary consensus classifi cation system as idiopathic interstitial pneumonias, which include several disease
manifes-tations ( 1 ). Emphysema is a chronic
lung condition in which alveoli, or air sacs, are morphologically altered ( 2 ). A number of observations have indicated that vascular abnormalities, including pulmonary arterial hypertension, may be important in idiopathic pulmonary fi brosis and emphysema ( 2 ). The oc-currence of both emphysema and pul-monary fi brosis in the same patient has received increased attention. The syn-drome of combined pulmonary fi brosis and emphysema (CPFE) has been char-acterized as an individual entity that is separate from both idiopathic pulmo-nary fi brosis and pulmopulmo-nary emphy-sema ( 3 ). Despite subnormal spiromet-ric results, which may be responsible for the underrecognition of CPFE, this combination syndrome is a severe entity. This entity generally is characterized by emphysema of the upper lung zones and diffuse parenchymal disease with fi brosis of the lower lung zones, mainly in current or previous heavy smokers ( 4 ). Although emphysema and fi brosis have been presumed to be two different diseases, data now implicate common cell and molecular activation pathways ( 5,6 ). The presence and extent of em-physema have a profound infl uence on physiologic function in terms of pulmo-nary functional impairment ( 7 ). Thus, the incidence of fi nding evidence of both emphysema and pulmonary fi brosis in the same patient has received increased attention ( 7 ). In patients with CPFE, the pulmonary hemodynamic profi le is
Implication for Patient Care
MR angiography of arterial pulmo-n
nary vessels may facilitate the non-invasive evaluation and monitoring of pulmonary arterial hypertension in patients with combined pulmo-nary fi brosis and emphysema.
Advance in Knowledge
Arterial pulmonary mean transit n
time and time to peak enhance-ment, as assessed by means of three-dimensional MR angiogra-phy, correlate with pulmonary invasive pressure measurements.
Published online 10.1148/radiol.09081546
Radiology 2010; 254:601–608
Abbreviations:
CPFE = combined pulmonary fi brosis and emphysema mPAP = mean pulmonary arterial pressure MTT = mean transit time
PVR = pulmonary vascular resistance PVRI = PVR index
ROI = region of interest 3D = three-dimensional TTP = time to peak enhancement
Author contributions:
Guarantors of integrity of entire study, G. Sergiacomi, F.B., M.L.A., F.F., P.R., G.P., F.R., E.M., G. Simonetti; study concepts/study design or data acquisition or data analysis/ interpretation, all authors; manuscript drafting or manu-script revision for important intellectual content, all authors; manuscript fi nal version approval, all authors; literature research, all authors; clinical studies, G. Sergiacomi, F.B., M.L.A., F.F., S.C., P.R., G.P., F.R., E.M., G. Simonetti; statisti-cal analysis, G. Sergiacomi, F.B., M.L.A., F.F., S.C., P.R., G.P., F.R., E.M., G. Simonetti; and manuscript editing, all authors
MR Imaging
MR imaging was performed with a 3.0-T MR imager (Achieva 3T; Philips
Healthcare, Best, the Netherlands ).
A six-element phased-array thorax coil was used. A 20-gauge cannula was sited in the left antecubital vein and connected to an electronic power injector (MR Spectris; Medrad, Pittsburgh, Pa). After scout images were obtained, 3D time-resolved contrast material–enchanced MR angiography was performed. The fi rst volume was acquired with the pa-tient holding his or her breath before starting the contrast medium injection and was used as the reference for sub-traction. Four milliliters of gadopen-tetate dimeglumine (Magnevist; Bayer HealthCare, Wayne, NJ) was injected at 4 mL/sec and followed by a 20-mL saline fl ush administered at the same injection rate. Simultaneously with the start of the injection, a continuous fast free-breathing transverse two-dimensional T1-weighted gradient-echo sequence (fl uoroscopic MR angiography ) across the right ventricle was performed to track the arrival of the bolus of gadolinium-based contrast material in the right ventricle. When the contrast material was visualized at the level of the right ventricle, the breath-hold dynamic 3D time-resolved MR sequence was reenabled and transverse contrast-enhanced dynamic images were acquired. We used a transverse 3D T1-weighted turbo fi eld-echo sequence with the fol-lowing parameters: 2.6/1.3 (repetition time msec/echo time msec), 10° fl ip angle, turbo factor of 40, sensitivity-encoding factor of three, fi eld of view of 435 3 326 mm, and reconstruction
matrix of 256 3 256. We covered a
slab of 150 mm divided in 30 overcon-tiguous partitions leading to a section thickness of 5 mm. The imaging time for each dynamic sequence was 1.5 seconds. We repeated the sequence 12 times, for a breath-hold imaging time of 18 seconds. The breath-hold sequence was then repeated three times with the subject asked to breathe for 2 seconds
after each sequence . Thus, the total
examination time was 60 seconds. Breath holding was performed at end expiration.
Hg/L/min/m 2 ), which was calculated as
the PVR divided by the body surface area (in square meters).
Standard Echocardiography
All control subjects underwent standard echocardiography (Sequoia C256 ultra-sonography machine; Acuson, Mountain View, Calif) with a 2.5–3.5-MHz trans-ducer. Echocardiography was performed according to the recommendations of the American Society of Echocardiog-raphy ( 15,16 ). Images were stored digi-tally and recalled for analysis by using an offl ine measuring system (KinetDx; Acuson). Analyses were performed by a single echocardiographer with 8 years of experience in echocardiographic imaging (E.M.).
Right ventricular diameters and left ventricular septal and posterior wall thicknesses were measured from the M mode. Mitral infl ow velocity was determined by means of pulsed-wave Doppler imaging. Left ventricu-lar isovolumetric relaxation time was recorded by means of continuous-wave Doppler echocardiography. Left ven-tricular diastolic and left atrial volume measurements were obtained with two-dimensional measurements by using the modifi ed Simpson rule and were normalized to body surface area. The maximal tricuspid regurgitation velocity was recorded by means of continuous-wave Doppler echocardiography. The estimated pulmonary arterial systolic pressure was equal to the sum of the tricuspid gradient calculated by means of a modifi ed Bernoulli equation from tricuspid regurgitation velocity and an assumed right atrial pressure of 5 mm Hg ( 17 ). Right ventricular function was evaluated with the Tei index, which ex-presses global cardiac function , defi ned as the sum of the isovolumic contrac-tion time plus the isovolumic relaxacontrac-tion time divided by ejection time ( 18 ). Right ventricular eccentricity index, a measure of septal displacement, was measured at both end systole and end diastole by us-ing the method of Ryan et al ( 19 ). Cutoff values for echocardiographic measure-ments were obtained from published echocardiographic reference values ( 15–19 ) and are reported in Table 1 . malignancies. All patients with CPFE
underwent right-sided heart catheter-ization and MR angiography at their ini-tial work-up while breathing room air. Right-sided heart catheterization was performed within 3 days prior to or fol-lowing MR angiography. At the time of right-sided heart catheterization or MR angiography, none of the patients had a fever, evidence of other infectious dis-eases or infl ammatory disorders, or any malignancy. Thirteen healthy volunteers who matched the enrolled patients in age and sex served as control subjects. No control subjects had a history of smoking; interstitial lung disease such as drug toxicity, environmental exposure– related illness, or collagen vascular dis-ease; cardiac dysfunction; or blood cell malignancies. Estimates of cardiac and pulmonary function based on echocar-diographic evaluation were obtained noninvasively in the control subjects. Right-sided Heart Catheterization Pulmonary arterial pressure and pul-monary capillary wedge pressure were measured with a 7-F double-lumen, balloon-tipped catheter (Swan-Arrow Catheter [Arrow International, Read-ing, Pa] or Swan-Abbott Catheter [Abbott Critical Care Systems, Moun-tain View, Calif] ) that was positioned in the pulmonary artery. Stroke volume and cardiac output were measured by means of thermodilution. The mPAP (in millimeters of mercury) was de-termined as follows: mPAP = PAP dias
+ [(PAP sys-dias )/3], where PAP dias is the
diastolic pulmonary arterial pressure and PAP sys-dias is the difference between
the systolic and diastolic pulmonary arterial pressure. The PVR (in mm Hg/L/min) was determined as follows: PVR = (mPAP 2 mPCWP)/CO, where mPCWP is the mean pulmonary cap-illary wedge pressure and CO is the cardiac output. Since pressure is in-dependent of the size of the system, the mPAP values of various subjects were compared without the need to take into account potential differences in body size. Conversely, since PVR is proportional to the size of the system, for comparative purposes, the PVR was expressed as a PVR index (PVRI, in mm
relative to the back ground signal in-tensity (phase before administration of contrast material) and is expressed by the following formula: E k = I k ( R ) 2
[ I 0 ( R )/ I 0 ( R )] ·100 · k · e (1, n series), where I k is the examined image, k is
the series index, I 0 is the corresponding precontrast image, and R is the
user-selected ROI ( 20 ). The corresponding
relative maximal signal intensity projec-tion color-coded maps were generated by using an automated process at the workstation according to this formula. The relative maximal signal intensity values are coded according to color (blue, green, yellow, and red). The in-crease in signal intensity (relative maxi-mal signal intensity values) is refl ected in the color. The bottom and top val-ues on the color-coded scale were 0% (blue) and 1500% (red), respectively.
Two radiologists (G. Sergiacomi and F.B., with 7 and 4 years, respectively, of experience in MR angiography) who were blinded to the patients’ clinical data man-ually drew the ROIs (typically 3 pixels) over the arterial fi rst-order pulmonary vessels within the hot spots (red) on the color-coded maps in consensus. ROIs were then superimposed electronically over the anatomic contrast-enhanced images, and the signal intensity–versus-time curves were generated throughout one cardiac cycle (fi rst bolus pass) ( Fig 2 ). Subsequently, the TTP and MTT were calculated automatically. Since the num-ber of hot spots varied from patient to patient, the number of ROIs varied accordingly. Thus, a mean of 15 ROIs enhanced images for region-of-interest
(ROI) placement ( Fig 1 ).
The relative maximal signal inten-sity projection value ( E k ) represents the percentage increase in signal in-tensity (contrast agent concentration) Data Processing
Data were processed at a workstation (ViewForum; Philips Healthcare). The relative maximal signal intensity color-coded maps were used for guidance together with the anatomic
contrast-Table 1
Echocardiographic Variables for Control Subjects
Echocardiographic Measurement Control Subject Value* Cutoff Value Left ventricle
IVRT (msec)† 78 6 3 (76, 81) 60–90
Mitral E/A‡ 1.12 6 0.04 (1.1, 1.2) ,1.5
Septal thickness (cm) 0.76 6 0.11 (0.68, 0.82) ,1.1 Posterior wall thickness (cm) 0.74 6 0.09 (0.69, 0.80) ,1.1 Diastolic volume/body surface area (mL/m2) 54 6 12 (46, 72) ,76
Left atrial volume/body surface area (mL/m2) 21 6 3 (19, 24) ,29
Pulmonary artery diameter (cm) 1.76 6 0.22 (1.6, 1.9) ,2.2 Right ventricle
Basal diameter (cm) 2.3 6 0.38 (2.16, 2.63) ,2.9 Middle diameter (cm) 2.9 6 0.27 (2.79, 3.12) ,3.4 Base-to-apex length (cm) 7.45 6 0.29 (7.30, 7.66) ,8 Free wall thickness (mm) 3.11 6 0.36 (2.88, 3.34) ,5 Systolic eccentricity index 1.01 6 0.01 (1.00, 1.01) 1 Diastolic eccentricity index 1.00 6 0.01 (1.00, 1.01) 1 Tei index 0.27 6 0.02 (0.26, 0.28) ,0.3 Tricuspid regurgitation velocity (m/sec) 1.8 6 0.3 (1.6, 2.0) ,3 Pulmonary arterial systolic pressure (mm Hg) 18 6 4.3 (15, 21) ,25
* Data are means 6 standard deviations, with 95% confi dence intervals in parentheses.
† IVRT = isovolumetric relaxation time, defi ned as the interval between aortic valve closure and mitral valve opening.
‡ E is the peak early-fi lling (E-wave) velocity, and A is the late diastolic fi lling (A-wave) velocity.
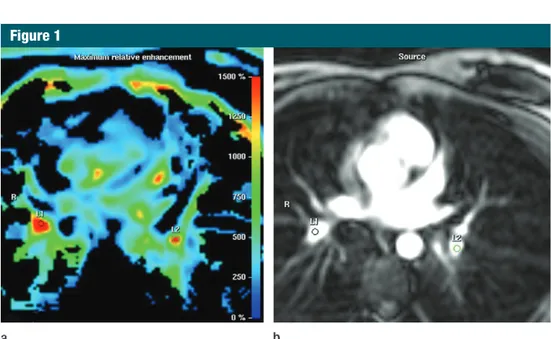
Figure 1
Figure 1: Transverse MR images in 58-year-old woman with CPFE show ROI positioning. (a) ROIs were drawn manually on the color-coded maps over the areas of the pulmonary vessels showing the highest rela-tive maximal signal intensity projection values (red). (b) ROIs were then superimposed electronically over the anatomic contrast-enhanced images. L1 and L2 are the manually drawn ROIs. R = right.
Figure 2
Figure 2: Signal intensity–versus-time curves gener-ated throughout one cardiac cycle. Green represents curve for 50-year-old male control subject. Red represents curve for 68-year-old man with CPFE.
confi dence interval [CI]: 29 seconds, 35
seconds; mean TTP, 38 seconds 6 3;
95% CI: 36 seconds, 39 seconds) com-pared with those in the control subjects
(mean MTT, 8.38 seconds 6 4; 95%
CI: 6 seconds, 11 seconds; mean TTP,
16 seconds 6 5; 95% CI: 13 seconds,
19 seconds) ( Fig 3 ). Signifi cant corre-lations were observed between mPAP and both mean TTP and mean MTT (mean TTP: r = 0.71; 95% CI: 0.33, 0.88; P , .005; mean MTT: r = 0.71; 95% CI: 0.34, 0.88; P = .001). Signifi cant
cor-relations between PVRI and both mean TTP and mean MTT also were observed (mean TTP: r = 0.70; 95% CI: 0.34, 0.88;
P = .001; mean MTT: r = 0.74; 95%
CI: 0.40, 0.90; P , .001) ( Fig 4 ). We per-formed multiple linear regression analysis to assess which, between MTT and TTP, correlated independently with PVRI and mPAP. As shown in Table 2 , MTT was the only variable that correlated independently with PVRI and mPAP ( P , .050).
Discussion
In this study, we measured the fi rst-order pulmonary arterial MTT and TTP in patients with CPFE by using 3D time-resolved MR angiography. MTT and TTP were prolonged signifi cantly in the patients with CPFE compared with those in the control subjects and cor-related directly with mPAP and PVRI. Pulmonary vascular resistance is a useful parameter for assessing poten-tial small-vessel disease ( 8 ). Pulmonary hypertension in patients with CPFE may refl ect the increased PVR due to hypoxia and the reduction of the capil-lary bed secondary to both emphysema and fi brosis. The PVR may be fi xed and/ or potentially reversible: Arterial oblit-eration and remodeling are responsible for the fi xed component, whereas ac-tive increases in vascular tone are re-sponsible for the reversible component, which can be treated pharmacologically ( 8 ). In patients with CPFE, increased PVRI may refl ect both the presence of hypoxia and the reduction of the capil-lary bed secondary to emphysema and fi brosis ( 8 ). Morphologic changes in the vessel wall, decreased segmental arterial compliance, and changes in compliance with mPAP and PVRI values were
evalu-ated with the Spearman nonparametric test. To assess the independent value of MTT and TTP with respect to mPAP and PVRI, we performed a multiple linear regression analysis. P , .05 was considered to indicate statistical signifi -cance. Data were expressed as means 6 standard deviations. Statistical analy-sis was performed with commercially available software (InStat, version 3.01, and Prism, version 4.7; GraphPad, San Diego, Calif).
Results
Cardiac catheterization was performed successfully in all patients with CPFE. The mPAP was 27 mm Hg 6 5 (range, 19–35 mm Hg); the mean PVRI was 302 6 61 (range, 210–400). Echocardiograms in control subjects were of adequate technical quality for the evaluation of cardiac and pulmonary function. Maxi-mal tricuspid regurgitant jet velocity was measurable in all 13 control subjects. No control subjects showed signs of car-diac impairment or pulmonary systolic hypertension according to the echocar-diographic measurements ( Table 1 ). Dy-namic MR angiograms of the pulmonary vasculature were obtained successfully in all of the study participants. Mean MTT and TTP values were prolonged signifi -cantly ( P , .001) in the patients with
CPFE (mean MTT, 32 seconds 6 6; 95% (range, 10 to 25) were drawn manually
for each patient.
To have a single noninvasive hemo-dynamic parameter value refl ecting changes in whole fi rst-order pulmonary arterial segments to be compared with the single values obtained with the in-vasive pressure measurements (mPAP and PVRI), we averaged the MTT and TTP values calculated for each ROI to obtain a single mean fi rst-order pulmo-nary arterial hemodynamic value (mean MTT, mean TTP) for each subject. MTT was defi ned as the interval between the wash-in time and the washout time ( 14 ). The wash-in time was defi ned as the point where the tangent to the signal intensity–versus-time curve between the arrival time of the contrast material and the maximal signal intensity time had the maximal slope ( 14–21 ). The washout time was defi ned as the point where the tangent to the signal intensity–versus-time curve between the maximal signal inten-sity time and the end had the minimal slope ( 21 ). TTP was defi ned as the time between the arrival of the contrast me-dium and the maximal signal intensity ( 14–21 ).
Statistical Analyses
Patients with CPFE were compared with healthy control subjects with re-spect to MTT and TTP by using the nonparametric Mann-Whitney test. Cor-relations of mean MTT and mean TTP
Figure 3
Figure 3: Comparisons of MR angiography–derived (a) mean MTT ( mMTT ) and (b) mean TTP ( mTTP ) for fi rst-order pulmonary arteries between patients with CPFE and control subjects. Median, range, and interquartile range values are shown. Signifi cant differences (P , .001) in mean MTT and mean TTP were observed. The line inside each box represents the median value. The ends of the vertical lines represent minimal and maximal data values. The upper hinge of each box represents the 75th percentile of the data set. The lower hinge of each box indicates the 25th percentile.
ing may enable quantitative assessment of regional pulmonary perfusion abnor-malities and disease severity identifi ed according to PVR and mPAP. However, investigators in most pulmonary per-fusion studies have evaluated primary pulmonary hypertension or secondary pulmonary hypertension due to either chronic pulmonary thromboembolism or chronic obstructive pulmonary dis-ease. In these groups of patients, pa-renchymal perfusion evaluation seems to be valuable, since the pulmonary pa-renchymal architecture is not substan-tially altered, and the eventual signal loss recorded may indicate peripheral small-vessel alterations, thus providing valuable information about pulmonary circulation, including regional blood volume, regional blood fl ow, and MTT ( 23–26 ). On the contrary, in patients with CPFE, the diffuse destruction of lung parenchyma (emphysema) or the increase in parenchymal density (fi bro-sis), either of which is more prominent than that in patients with chronic ob-structive pulmonary disease, may be responsible for the signal loss or gain and can confound measurement of per-fusion. Despite severe architectural dis-tortion due to fi brosis and emphysema, only 47% of patients with CPFE develop pulmonary hypertension (3) .
The angiographic technique described in this study yields time-resolved im-ages of the pulmonary circulation, from which physiologic information can be derived. In patients with CPFE, the MTT for fi rst-order pulmonary arter-ies provides insight into the functional status of the pulmonary circulation and becomes a tool for identifying patients with CPFE who have pulmonary hy-pertension. An advantage of the MR angiographic technique is the minimal contrast material requirement. In ac-cordance with a previous study ( 14 ), we used only a 4-mL dose of gadopentetate dimeglumine, which can be injected within 1 second, greatly improving the shape of the input function compared with that yielded in protocols that re-quire input across several seconds. Phase-contrast MR imaging is a well-established and validated technique for measuring blood fl ow ( 27 ). Results of vascular MTT and TTP were correlated
with invasive pulmonary arterial pres-sure meapres-surements. Previous contrast-enhanced MR studies on pulmonary hypertension have focused on parenchy-mal perfusion alterations. Several au-thors have found a correlation between perfusion parameters and invasive pul-monary pressure measurements ( 23–26 ).
To our knowledge, Ohno et al ( 24 )
were the fi rst to show that 3D dynamic contrast-enhanced perfusion MR imag-in response to vasodilators have been
demonstrated in patients with pulmo-nary hypertensive disease ( 22 ). The pro-gressive increase in MTT and TTP val-ues measured with the increasing PVRI observed in our study may refl ect these morphologic changes. However, multiple linear regression analysis showed that MTT is the only variable independently correlated with mPAP and PVRI.
To our knowledge, this study is the fi rst in which MR angiography–derived
Figure 4
Figure 4: Plots show Spearman correlations: (a) mPAP versus mean TTP ( mTTP ), (b) mPAP versus mean MTT ( mMTT ), (c) PVRI versus mean TTP, and (d) PVRI versus mean MTT.
Table 2
Multiple Linear Regression Analysis Results
Variable* Coeffi cient b Standard Error T Value P Value
With respect to mPAP
MTT 0.42 0.18 2.3 .04
TTP 0.57 0.38 1.5 .15
With respect to PVRI
MTT 5.23 2.20 2.4 .03
TTP 6.06 4.50 1.4 .20
sema . Proc Am Thorac Soc 2006 ; 3 ( 8 ): 696 – 702 .
6 . Cottin V , Fabien N , Khouatra C , Moreira A , Cordier JF . Anti-elastin autoantibodies are not present in combined pulmonary fi brosis and emphysema . Eur Respir J 2009 ; 33 ( 1 ): 219 – 221 .
7 . Mura M , Zompatori M , Pacilli AM . The presence of emphysema further impairs physiologic function in patients with id-iopathic pulmonary fi brosis . Respir Care 2006 ; 51 ( 3 ): 257 – 265 .
8 . Chemla D , Castelain V , Hervé P , Lecar-pentier Y , Brimioulle S . Haemodynamic evaluation of pulmonary hypertension . Eur Respir J 2002 ; 20 ( 5 ): 1314 – 1331 . 9 . Bossone E , Bodini BD , Mazza A , Allegra L .
Pulmonary arterial hypertension: the key role of echocardiography . Chest 2005 ; 127 ( 5 ): 1836 – 1843 .
10 . Tan RT , Kuzo R , Goodman LR , Siegel R , Haasler GB , Presberg KW . Utility of CT scan evaluation for predicting pulmo-nary hypertension in patients with paren-chymal lung disease: Medical College of Wisconsin Lung Transplant Group . Chest 1998 ; 113 ( 5 ): 1250 – 1256 .
11 . Zisman DA , Karlamangla AS , Ross DJ , et al . High-resolution chest computed tomog-raphy fi ndings do not predict the presence of pulmonary hypertension in advanced idiopathic pulmonary fi brosis . Chest 2007 ; 132 ( 3 ): 773 – 779 .
12 . Arcasoy SM , Christie JD , Ferrari VA , et al . Echocardiographic assessment of pulmo-nary hypertension in patients with advanced lung disease . Am J Respir Crit Care Med 2003 ; 167 ( 5 ): 735 – 740 .
13 . Yucel EK , Anderson CM , Edelman RR , et al . AHA scientifi c statement: magnetic reso-nance angiography—update on applica-tions for extracranial arteries . Circulation 1999 ; 100 ( 22 ): 2284 – 2301 .
14 . Nael K , Michaely HJ , Kramer U , et al . Pulmonary circulation: contrast-enhanced 3.0-T MR angiography—initial results . Ra-diology 2006 ; 240 ( 3 ): 858 – 868 .
15 . Lang RM , Bierig M , Devereux RB , et al . Recommendations for chamber quantifi -cation: a report from the American Soci-ety of Echocardiography’s Guidelines and Standards Committee and the Chamber Quantifi cation Writing Group, developed in conjunction with the European Associa-tion of Echocardiography, a branch of the European Society of Cardiology . J Am Soc Echocardiogr 2005 ; 18 ( 12 ): 1440 – 1463 . 16 . Oh JK , Appleton CP , Hatle LK , Nishimura RA ,
Seward JB , Tajik AJ . The noninvasive
spatial variation in noise described by a geometric factor known as the g factor ( 37 ). Moreover, MR angiography was performed with breath holding, the phase of which may infl uence bolus kinetics and prolong circulation times ( 38 ). To minimize this possible bias, we instructed all study participants, in a standardized fashion, to hold their breath at end expiration.
We did not evaluate the inter- and intraobserver agreement of the method described, although this would be nec-essary before using the method for clinical follow-up in individual patients. Similarly, technique reproducibility was not evaluated. Additional studies with larger cohorts of patients are required to further establish the interobserver variability and assess the intraobserver variability and reproducibility of the method. In conclusion, 3D time-resolved MR angiography enables determination of the pulmonary hemodynamic param-eters that signifi cantly correlate with the pulmonary hemodynamic param-eters obtained with invasive methods and may represent a complementary tool for evaluating pulmonary hyperten-sion in patients with CPFE.
Acknowledgment: The authors thank technolo-gist Maurizio Ferretti for technical expertise and availability.
References
1 . Demedts M , Costabel U . ATS/ERS inter-national multidisciplinary consensus clas-sifi cation of the idiopathic interstitial pneu-monias . Eur Respir J 2002 ; 19 ( 5 ): 794 – 796 . 2 . Cassandro R , Harari S . Pulmonary arterial hypertension secondary to chronic lung diseases: pathogenesis and medical treat-ment . Sarcoidosis Vasc Diffuse Lung Dis 2006 ; 23 ( 3 ): 163 – 179 .
3 . Cottin V , Nunes H , Brillet PY , et al . Com-bined pulmonary fi brosis and emphysema: a distinct underrecognised entity . Eur Re-spir J 2005 ; 26 ( 4 ): 586 – 593 .
4 . Jankowich MD , Polsky M , Klein M , Rounds S . Heterogeneity in combined pulmonary fi brosis and emphysema . Respiration 2008 ; 75 ( 4 ): 411 – 417 .
5 . Gauldie J , Kolb M , Ask K , Martin G , Bonniaud P , Warburton D . Smad3 signaling involved in pulmonary fi brosis and
emphy-several studies have shown the poten-tial use of a variety of phase-contrast MR imaging–derived parameters in the evaluation of pulmonary hyperten-sion ( 28,29 ). A combined MR proto-col, which might include pulmonary fl ow information derived from phase-contrast imaging in addition to per-fusion and angiographic information provided by contrast-enhanced tech-niques, may be helpful for assessing the global pulmonary circulation status in patients with different types of pul-monary hypertension.
Contrast-enhanced high-temporal-resolution MR angiography of the pul-monary circulation at 3.0 T has been described previously, with results re-vealing that time-resolved contrast-enhanced MR angiography at 3.0 T can depict the pulmonary vasculature in en-couraging detail ( 14 ). Several technical approaches for acquiring time-resolved MR angiograms have been described ( 30,31 ). In our study, to increase the data acquisition speed, we used the
sensitivity-encoding technique ( 32 ).
Although sensitivity encoding can im-prove temporal and spatial resolution, the reduction in the signal-to-noise ratio may become a limiting factor , depend-ing on the degree of k-space undersam-pling ( 33 ). The main advantage of MR imaging at 3.0 T is the signal-to-noise ratio gain that scales approximately lin-early with fi eld strength. Willinek et al
( 34 ) and Campeau et al ( 35 ) showed
that a higher signal-to-noise ratio at 3.0 T is an important element for increas-ing the spatial resolution and is likely to improve visualization of small-blood-vessel segments.
Our study had limitations. The enhancement curves generated by us-ing ROI methods are prone to partial volume errors and are sensitive to ROI
selection and placement ( 36 ). We did
not assess the noise level in any ROI. Image noise at MR imaging generally is characterized by the noise level mea-sured in regions outside of the object of interest on the image. However, in our study, noise measured in one region on the image did not correspond to the noise elsewhere, since the parallel im-aging technique that we used causes a
assessment of left ventricular diastolic function with two-dimensional and Doppler echocardiography . J Am Soc Echocardiogr 1997 ; 10 ( 3 ): 246 – 270 .
17 . Bossone E , Rubenfi re M , Bach DS , Ricciardi M , Armstrong WF . Range of tricuspid regurgitation velocity at rest and during exercise in normal adult men: implica-tions for the diagnosis of pulmonary hy-pertension . J Am Coll Cardiol 1999 ; 33 ( 6 ): 1662 – 1666 .
18 . Tei C , Dujardin KS , Hodge DO , et al . Doppler echocardiographic index for assessment of global right ventricular function . J Am Soc Echocardiogr 1996 ; 9 ( 6 ): 838 – 847 . 19 . Ryan T , Petrovic O , Dillon JC , Feigenbaum H ,
Conley MJ , Armstrong WF . An echocar-diographic index for separation of right ventricular volume and pressure overload . J Am Coll Cardiol 1985 ; 5 ( 4 ): 918 – 927 . 20 . Kaiser WA , Zeitler E . MR imaging of the
breast: fast imaging sequences with and without Gd-DTPA: preliminary observations . Radiology 1989 ; 170 ( 3 pt 1 ): 681 – 686 . 21 . Moulopoulos LA , Maris TG , Papanikolaou N ,
Panagi G , Vlahos L , Dimopoulos MA . Detection of malignant bone marrow in-volvement with dynamic contrast-enhanced magnetic resonance imaging . Ann Oncol 2003 ; 14 ( 1 ): 152 – 158 .
22 . Muthurangu V , Atkinson D , Sermesant M , et al . Measurement of total pulmonary arterial compliance using invasive pres-sure monitoring and MR fl ow quantifi ca-tion during MR guided cardiac catheter-ization . Am J Physiol Heart Circ Physiol 2005 ; 289 ( 3 ): H1301 – H1306 .
23 . Nikolaou K , Schoenberg SO , Attenberger U , et al . Pulmonary arterial hypertension: diagnosis with fast perfusion MR imaging and
high-spatial-resolution MR angiography— preliminary experience . Radiology 2005 ; 236 ( 2 ): 694 – 703 .
24 . Ohno Y , Hatabu H , Murase K , et al . Primary pulmonary hypertension: 3D dynamic per-fusion MRI for quantitative analysis of regional pulmonary perfusion . AJR Am J Roentgenol 2007 ; 188 ( 1 ): 48 – 56 .
25 . Ley S , Mereles D , Risse F , et al . Quantita-tive 3D pulmonary MR-perfusion in patients with pulmonary arterial hypertension: cor-relation with invasive pressure measure-ments . Eur J Radiol 2007 ; 61 ( 2 ): 251 – 255 . 26 . Jang YM , Oh YM , Seo JB , et al . Quantita-tively assessed dynamic contrast-enhanced magnetic resonance imaging in patients with chronic obstructive pulmonary dis-ease: correlation of perfusion parameters with pulmonary function test and quanti-tative computed tomography . Invest Radiol 2008 ; 43 ( 6 ): 403 – 410 .
27 . Lotz J , Meier C , Leppert A , Galanski M . Cardiovascular fl ow measurement with phase-contrast MR imaging: basic facts and implementation . RadioGraphics 2002 ; 22 ( 3 ): 651 – 671 .
28 . Sanz J , Kuschnir P , Rius T , et al . Pulmo-nary arterial hypertension: noninvasive detection with phase-contrast MR imaging . Radiology 2007 ; 243 ( 1 ): 70 – 79 .
29 . Ley S , Mereles D , Puderbach M , et al . Value of MR phase-contrast fl ow measure-ments for functional assessment of pul-monary arterial hypertension . Eur Radiol 2007 ; 17 ( 7 ): 1892 – 1897 .
30 . Finn JP , Baskaran V , Carr JC , et al . Tho-rax: low-dose contrast-enhanced three-dimensional MR angiography with subsecond temporal resolution—initial results . Radiol-ogy 2002 ; 224 ( 3 ): 896 – 904 .
31 . Juluru K , Vogel-Claussen J , Macura KJ , Kamel IR , Steever A , Bluemke DA . MR imaging in patients at risk for develop-ing nephrogenic systemic fi brosis: proto-cols, practices, and imaging techniques to maximize patient safety . RadioGraphics 2009 ; 29 ( 1 ): 9 – 22 .
32 . Goyen M , Laub G , Ladd ME , et al . Dynamic 3D MR angiography of the pulmonary arteries in under four seconds . J Magn Reson Imaging 2001 ; 13 ( 3 ): 372 – 377 . 33 . Sodickson DK , McKenzie CA , Li W , Wolff S ,
Manning WJ , Edelman RR . enhanced 3D MR angiography with simul-taneous acquisition of spatial harmonics: a pilot study . Radiology 2000 ; 217 ( 1 ): 284 – 289 .
34 . Willinek WA , Born M , Simon B , et al . Time-of-fl ight MR angiography: comparison of 3.0-T imaging and 1.5-T imaging—initial ex-perience . Radiology 2003 ; 229 ( 3 ): 913 – 920 . 35 . Campeau NG , Huston J 3rd , Bernstein MA ,
Lin C , Gibbs GF . Magnetic resonance angiography at 3.0 Tesla: initial clini-cal experience . Top Magn Reson Imaging 2001 ; 12 ( 3 ): 183 – 204 .
36 . Tofts PS . The measurement process: MR data collection and image analysis . In: Tofts P , ed. Quantitative MRI of the brain: mea-suring changes caused by disease . Chich-ester, England : Wiley , 2003 ; 17 – 54 . 37 . Pruessmann KP , Weiger M , Scheidegger
MB , Boesiger P . SENSE: sensitivity encoding for fast MRI . Magn Reson Med 1999 ; 42 ( 5 ): 952 – 962 .
38 . Fink C , Ley S , Risse F , et al . Effect of in-spiratory and expiratory breathhold on pulmonary perfusion: assessment by pul-monary perfusion magnetic resonance im-aging . Invest Radiol 2005 ; 40 ( 2 ): 72 – 79 .