U
ni
ve
rs
ità
d
eg
li
S
tu
di
d
i N
ap
ol
i F
ed
er
ic
o
II
XXXI Ph.D. Programme
in Industrial Product and Process Engineering
Mariano Di Domenico
P
H
.D.
P
ROGRAM
IN
I
NDUSTRIAL
P
RODUCT AND
P
ROCESS
E
NGINEERING
C
OORDINATOR
P
ROF
.
G
IUSEPPE
M
ENSITIERI
XXXI
C
YCLE
M
ARIANO
D
I
D
OMENICO
P
H
.D.
T
HESIS
Out-of-plane seismic response and modelling
of unreinforced masonry infill walls
T
UTOR
P
ROF
.
A.
P
ROTA
P
ROF
.
G.M.
V
ERDERAME
P
ROF
.
P.
R
ICCI
Acknowledgements/Ringraziamenti
“Sentir, riprese, e meditar: di poco
Esser contento: da la meta mai Non torcer gli occhi: conservar la mano Pura e la mente: de le umane cose Tanto sperimentar, quanto ti basti Per non curarle: non ti far mai servo: Non far tregua coi vili: il santo Vero Mai non tradir: né proferir mai verbo Che plauda al vizio, o la virtù derida.”
Alessandro Manzoni
Sin da bambino, studiare è stata la cosa che più ho amato fare e non ho timore di scrivere che è stato lo studio, insieme a qualcuno, a salvarmi la vita. Per questo motivo, negli ultimi anni di Università, ho coltivato il desiderio di partecipare ad un programma di dottorato di ricerca. Realizzare questo desiderio nel 2015 è stata una delle più grandi gioie che ho vissuto e completare questa esperienza, oggi, rappresenta per me un grande orgoglio. Vorrei ringraziare chi ha reso possibile tutto questo e chi ha contribuito a rendere meravigliosa questa esperienza.
Vorrei ringraziare il professore Gerardo Verderame, del cui gruppo di ricerca faccio orgogliosamente parte. La sua grande sensibilità scientifica e umana sono state e saranno per me di esempio e fonte di ispirazione. Queste sue qualità mi hanno insegnato a guardare oltre ciò che è visibile, una dote estremamente rara e assolutamente imprescindibile per un buon ricercatore. Vorrei inoltre ringraziare il professore Andrea Prota, per avermi dato la possibilità di entrare a far parte della grande famiglia del DIST. Vorrei ringraziare i revisori di questa tesi per il loro contributo cortese, attento e costruttivo.
Vorrei ringraziare ancora una volta tutti gli insegnanti che hanno contribuito alla mia formazione e a rendermi la persona, l’ingegnere e il ricercatore che sono. In rappresentanza di tutti loro vorrei ringraziare in particolare i professori Luciano Nunziante, Maria Rosaria Irace, Maria Pia Tanucci.
l’equilibrio che mi ha testimoniato e Maria Teresa De Risi per la sua gentilezza nell’ascoltare e comprendere. Sono infinitamente grato ad entrambi per la loro amicizia e per non avermi mai fatto sentire solo.
Vorrei ringraziare i colleghi/amici del DIST con cui ho condiviso momenti indimenticabili di confronto, divertimento, risate: Andrea Miano, Costantino Menna, Marco Gaetani, Paolino Cassese, Pasquale Cito, Stefano Carozza e Maddalena Cimmino. Ringrazio di cuore, inoltre, gli studenti e tesisti che con le loro domande e la loro collaborazione mi hanno arricchito molto, come uomo e come ricercatore. Ringrazio Alessandra, per la nostra quasi decennale e sincera amicizia.
Vorrei ringraziare i miei zii Salvatore e Olga per essermi stati vicino in questi anni, allo stesso tempo belli e difficili, in cui ho iniziato ad assumere alcune delle responsabilità di adulto. Il loro sostegno non mi è mai mancato e so che mi accompagnerà per tutta la vita.
L’eccezionale uomo che mi ha guidato in questi tre anni è il professore Paolo Ricci, a cui devo ogni cosa. Non esisterà mai nessuna parola scritta, o detta, che possa esprimere la stima e la gratitudine che provo per lui, né che possa raccontare a chi legge l’irripetibile fortuna che ho avuto nel conoscerlo. A lui dedico la fatica e la dedizione del passato, la gioia e l’orgoglio di questo giorno, le speranze e le attese del futuro.
Napoli, 11 dicembre 2018
Information
The Author would like to acknowledge engineer Giuseppe Campanella for the scientific and technical support during the execution of the experimental tests described in Chapter III.
The Author would like to acknowledge the staff of the ScOPE Datacenter of University of Naples Federico II, whose support has been crucial for carrying out the numerical analyses described in Chapters VII and VIII.
The experimental, analytical and numerical results of this thesis contributed to the achievement of the goals of METROPOLIS (Metodologie e tecnologie integrate e sostenibili per l'adattamento e la sicurezza di sistemi urbani - PON Ricerca e Competitività 2007-2013) project and ReLUIS-DPC 2014-2018 project funded by the Italian Department of Civil Protection (DPC). These supports are gratefully acknowledged.
Part of the content of this thesis has been already published on research journals, as reported in the list below.
P. Ricci, M. Di Domenico, G. M. Verderame, 2018. Empirical-based out-of-plane URM infill wall model accounting for the interaction with in-plane demand. Earthquake Engineering and Structural Dynamics 2018;47.3:802-827. doi:
10.1002/eqe.2992
M. Di Domenico, P. Ricci, G.M. Verderame, 2018. Experimental assessment of the influence of boundary conditions on the out-of-plane response of unreinforced
masonry infill walls. Journal of Earthquake Engineering. doi:
10.1080/13632469.2018.1453411
P. Ricci, M. Di Domenico, G. M. Verderame, 2018. Experimental assessment of the in-plane/out-of-plane interaction in unreinforced masonry infill walls. Engineering Structures. 2018;173:960-978. doi: 10.1016/j.engstruct.2018.07.033
P. Ricci, M. Di Domenico, G. M. Verderame, 2018. Experimental investigation of the influence of slenderness ratio and of the in-plane/out-of-plane interaction on the out-of-plane strength of URM infill walls. Construction and Building Materials 2018;191:507-5222. doi: https://doi.org/10.1016/j.conbuildmat.2018.10.011.
Table of Contents
Introduction p. 1
PART I – OUT-OF-PLANE BEHAVIOUR OF URM INFILLS
Chapter I – Out-of-plane strength, stiffness and displacement capacity
models……….... p. 5
1.1 Introduction……… p. 5
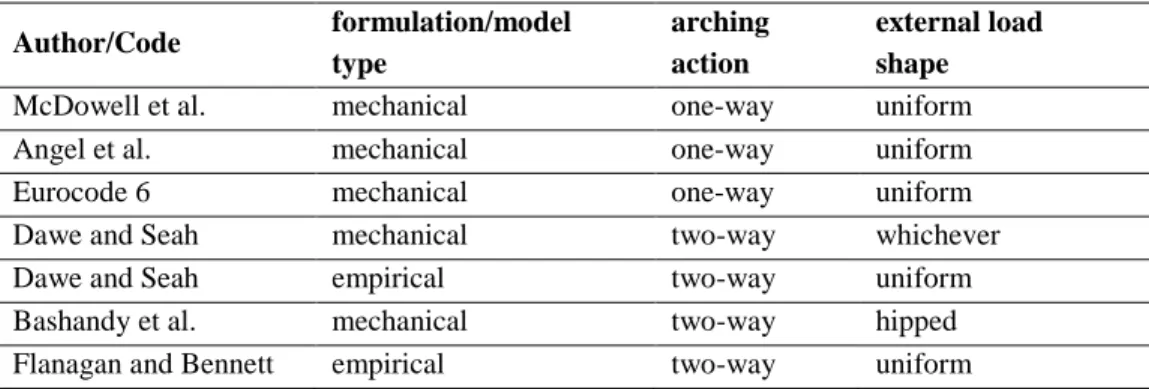
1.2 OOP strength models based on arching action………... p. 7
1.2.1. Strength models based on one-way arching action……….. p. 9
1.2.2. Strength models based on two-way arching action……….. p. 14
1.2.3. Influence of the load shape on the theoretical OOP strength of
infills……….. p. 26
1.3. OOP stiffness models……… p. 32
1.4. OOP displacement capacity models……….. p. 34
1.5. IP/OOP interaction modelling formulations……….. p. 38
1.6. IP/OOP interaction modelling strategies ……….. p. 40
References………. p. 44
Chapter II – Experimental state-of-the-art………. p. 47
2.1 Introduction………. p. 47
2.2. Experimental tests on 2E infills………. p. 48
2.2.1. da Porto et al., 2007……….. p. 48
2.2.2. Hak et al., 2014………. p. 50
2.3. Experimental tests on 4E infills……….. p. 52
2.3.1. Dawe and Seah, 1989………... p. 52
2.3.2. Angel et al., 1994 ……….. p. 55
2.3.3. Flanagan and Bennett, 1999……….. p. 58
2.3.4. Calvi and Bolognini, 2001………. p. 60
2.3.5. Varela-Rivera et al., 2012……….. p. 62
2.3.6. Guidi et al., 2016……… p. 65
2.3.7. Hak et al., 2014……….. p. 67
2.3.8. Furtado et al., 2016………. p. 69
2.4.1. Beconcini, 1997……….. p. 72
2.4.2. Griffith and Vaculik, 2007……….. p. 73
2.4.3. Pereira et al., 2011………... p. 75
References……… p. 76
Chapter III – DIST-UNINA experimental program……….. p. 79
3.1. Introduction………... p. 79
3.2. Experimental program general information……….. p. 81
3.2.1. Specimens’ description and construction materials’ properties…... p. 82
3.2.2. Test setup and loading system………. p. 85
3.2.3. Instrumentation layout………. p. 89
3.3. Reference tests……….. p. 90
3.3.1. Pilot test……… p. 90
3.3.2. Test 80_OOP_4E………. p. 92
3.3.3. Test 120_OOP_4E………... p. 95
3.4. Combined IP/OOP tests………. p. 99
3.4.1. Test 80_IP+OOP_L………... p. 100
3.4.2. Test 80_IP+OOP_M……… p. 104
3.4.3. Test 80_IP+OOP_H………. p. 108
3.4.4. General considerations on the results of tests on the 80 mm thick
infills………... p. 112 3.4.5. Test 120_IP+OOP_L……… p. 114 3.4.6. Test 120_IP+OOP_M………... p. 118 3.4.7. Test 120_IP+OOP_H……… p. 122 3.4.8. General considerations on the results of tests on the 120 mm thick
infills………... p. 126 3.5. OOP tests on infills with different boundary conditions……… p. 128 3.5.1. Test 80_OOP_3E……….. p. 129 3.5.2. Test 80_OOP_3Eb……… p. 133 3.5.3. Test 80_OOP_2E……….. p. 136 3.5.4. Test 120_OOP_3E……… p. 140 3.5.5. Test 120_OOP_2E……… p. 143 3.5.6. General considerations on tests’ results……… p. 146
3.6. OOP cyclic test……….. p. 152
3.6.2. Test 120_OOP_4E_cyclic……… p. 154 References………. p. 158
Chapter IV – Experimental database analysis and modelling proposals p. 161 4.1. Introduction……… p. 161 4.2. Definition of the experimental database……… p. 162 4.2.1. Database of pure OOP tests……….. p. 162 4.2.2. Databased of combined IP/OOP tests………... p. 164 4.3. Assessment of the OOP stiffness………... p. 165 4.3.1 Prediction of secant stiffness at first macro-cracking……… p. 165 4.3.2. Prediction of secant stiffness at peak load……… p. 168
4.3.3. Modelling proposals………. p. 169
4.4. Assessment of the OOP strength………... p. 170 4.4.1. Prediction of the OOP strength of 2E infills………. p. 175 4.4.2. Prediction of the OOP strength of 4E infills………. p. 177 4.4.3. Final remarks on the predictive capacity of literature
formulations/models………... p. 183
4.4.4. Some considerations on the OOP strength of infills under seismic
load………. p. 186
4.4.5. Proposed direct mechanical-based formulations……….. p. 188
4.4.6. Modelling proposals………. p. 196
4.5. Assessment of the OOP displacement capacity………. p. 197 4.6. Assessment of the IP/OOP interaction effects………... p. 201 4.6.1. Assessment of literature formulations………... p. 201 4.6.2. Modelling proposals (IP effects on OOP)………. p. 204 4.6.3. Modelling proposals (OOP effects on IP)………. p. 214 4.7. Summary of the proposed OOP model for URM infills……… p. 216 References………. p. 219
PART II – EFFECT OF THE OUT-OF-PLANE COLLAPSE OF URM INFILLS ON THE SEISMIC PERFORMANCE OF RC BUILDINGS
Chapter V – Out-of-plane code-based safety assessment of URM infills p. 223 5.1. Introduction……… p. 223 5.2. General considerations on the seismic safety assessment of URM
infills………. p. 224 5.3. OOP strength models in building codes………. p. 226
5.3.1. Eurocode 6 strength model………... p. 226
5.3.2. FEMA 306 strength model………... p. 227
5.3.3. FEMA 356 and ASCE/SEI 41-13 strength model……….... p. 228 5.3.4. NZSEE 2017 strength model……… p. 229 5.4. OOP demand models in building codes………. p. 230 5.4.1. Eurocode 8 demand model……… p. 231 5.4.2. ASCE/SEI 7-10 demand model……….... p. 232 5.4.3. NZSEE 2017 demand model……… p. 233 5.5. Critical aspects and open issues………. p. 235 5.5.1. OOP vibration period of URM infills………... p. 236 5.5.2. OOP behaviour factor………... p. 238 References………. p. 240
Chapter VI – Description of the case-study RC buildings………. p. 243
6.1. Introduction……… p. 243 6.2. Design procedure of the case-study buildings………... p. 244 6.2.1. Materials’ properties………. p. 245 6.2.2. Elastic and design response spectra……….. p. 247 6.2.3. Basic design and modelling criteria……….. p. 248 6.2.4. Dimensioning of structural elements……….... p. 249
6.2.5. Gravity load determination and combination………... p. 249
6.2.6. Global verifications of the case-study buildings……….. p. 251
6.2.7. Design of beams……… p. 253 6.2.8. Design of columns……… p. 254
6.3. Some considerations on the design results……….... p. 254
6.3.1. Results of modal analysis………. p. 254
6.3.2. A proposal for dimensioning criteria……… p. 256 6.3.3. Stuctural members’ characteristics……… p. 257 References………. p. 264
Chapter VII – Out-of-plane seismic safety assessment of URM infills in
a non-linear static framework………... p. 265
7.1. Introduction……….... p. 265 7.2. Description of the procedures applied for the assessment of the
collapse PGA……… p. 266
7.2.2. Reference Approach (RA)……… p. 268 7.3. Modelling of the case-study buildings………... p. 273
7.4. Application of DA and RA procedures………. p. 276
7.4.1. Designer Approach (DA) application and results………. p. 276 7.4.2. Reference Approach (RA) application and results………... p. 280 7.4.3. Comparison of DA and RA results………... p. 287 7.5. OOP safety check of infills in a linear elastic framework………. p. 289 7.6. When is the OOP safety check of infills necessary?... p. 294 7.7. Conclusive remarks……… p. 301 References………. p. 303
Chapter VIII – Seismic assessment of infilled RC buildings in a non-linear dynamic framework accounting for the in-plane/out-of-plane
interaction………... p. 305
8.1. Introduction……… p. 305 8.2. IP/OOP interaction modelling strategy……….. p. 307 8.3. Modelling of the case-study buildings………... p. 316
8.4. Analysis procedure……….... p. 319
8.5. Global response of the case-study buildings……….. p. 323 8.6. Assessment of the OOP collapse PGA and IDR……… p. 327
8.6.1. PGAc assessment……….. p. 328
8.6.2. IDRc assessment………... p. 336
8.6.3. Location of the first OOP collapse……… p. 345 8.7. Assessment of the OOP behaviour factor and effective stiffness of
URM infills………... p. 347 8.7.1. Straightforward approaches for the evaluation of the q-factor……. p. 349 8.7.2. Practice-oriented approach for the evaluation of the q-factor…….. p. 355 8.7.3. Evaluation of the q-factor based on the OOP effective stiffness….. p. 359 8.7.4. Final remarks and proposals………. p. 370
References……… p. 373
Appendix A – Analytical derivation of mechanical-based OOP strength
models………. p. 375
A.1. Introduction……….. p. 375
A.2. OOP strength models based on one-way arching action……….. p. 375
A.2.2. Angel et al.’s strength model………... p. 380 A.2.3. Eurocode 6 strength model……….. p. 390 A.3. OOP strength model based on two-way arching action……… p. 392 References………. p. 397
Appendix B – Specimens’ cracking patterns and damage evolution….... p. 399 Appendix C – DIST-UNINA experimental tests’ results………... p. 425
List of Figures
Figure 1.1. One-way arching action according to McDowell et al. (1956). p. 10
Figure 1.2. Deformed shape of a type A and type B stripes divided by
fracture lines in separate parts rigidly rotating about their ends. On the right,
a particular of a stripe single part. p. 15
Figure 1.3. Global and local reference systems that should be used to
correctly define the f value for each stripe. p. 18
Figure 1.4. Partitioned deformability matrix. p. 21
Figure 1.5. Deformability coefficient for the RC frame shown in Figure
1.4. In the above Equations, a=EIb/EIc and b=w/h. EIb and EIc are the
flexural stiffness of the beam and of the columns’ cross sections,
respectively. p. 22
Figure 1.6. Collapse mechanism considered by Bashandy et al. p. 24
Figure 1.7. Assumed deformed shape at maximum for 2E infills. p. 28
Figure 1.8. Load shapes considered for the calculation of the external
virtual work. p. 28
Figure 1.9. Conversion factor of OOP strength under hipped load to
uniformly distributed load (a), to concentrated 4 points with γ=1/3 load (b)
and to concentrated 1 point load (c). p. 31
Figure 1.10. Cracked masonry stripe deformed shape at arching action
occurrence (a) and masonry segment detail (b). p. 35
Figure 1.11. IP/OOP interaction represented through IP pushover curves at
assigned OOP forces (a) and through a static IP/OOP interaction domain
(b). Adapted from Hashemi and Mosalam (2007). p. 40
Figure 1.12. IP/OOP interaction domains in terms of forces (a) and
displacements (b). Adapted from Kadysiewski and Mosalam (2009). p. 41
Figure 1.13. IP/OOP interaction domain in terms of forces. Adapted from
Dolatshahi et al. (2014). p. 42
Figure 1.14. IP/OOP interaction experimental domains in terms of force.
Adapted from Maheri and Najafgholipour (2012). p. 43
Figure 2.1. Experimental setup by da Porto et al. (2007). p. 50
Figure 2.3. Effect of boundary conditions at the edges of infills on their
deformed shape and OOP response. Adapted from Dawe and Seah (1989). p. 54
Figure 2.4. Concrete Masonry Unit (CMU). p. 55
Figure 2.5. State of specimen 23 by Flanagan and Bennett at the end of the
test. p. 59
Figure 2.6. Murfor reinforcing system. Picture from:
www.ilnuovocantiere.it. p. 61
Figure 2.7. Specimens’ state at the end of the OOP tests by Varela-Rivera
et al. (2012). p. 64
Figure 2.8. Reinforcement layout used for thick infills by Guidi et al.
(2013). Adapted from Guidi et al. (2013). p. 65
Figure 2.9. State of specimen TA5 at the end of the OOP test by Hak et al.
(2014). p. 68
Figure 2.10. IP-undamaged Inf_01 (left) and Inf_02 (right) specimens by
Furtado et al. (2016) at the end of tests. p. 70
Figure 2.11. IP-damaged specimen Inf_03 by Furtado et al. (2016) at the
end of test. p. 71
Figure 2.12. Some specimens by Beconcini (1997) after tests. p. 73
Figure 2.13. Experimental setup by Griffith and Vaculik (2007). p. 74
Figure 2.14. OOP incipient collapse for REF specimen by Pereira et al.
(2011). p. 76
Figure 3.1. Overview of the experimental program carried-out at the
Department of Structures for Engineering and Architecture of the
University of Naples Federico II. p. 80
Figure 3.2. Construction drawings of the RC frame specimen. p. 83
Figure 3.3. Picture of the 250x250x80 mm3 clay bricks used for this study. p. 83 Figure 3.4. Picture of the 250x250x120 mm3 clay bricks used for this study. p. 84 Figure 3.5. Picture of an infilled RC frame used for this study. p. 85
Figure 3.6. Rendering of the experimental setup. p. 86
Figure 3.7. Picture of the experimental setup. p. 87
Figure 3.8. Instrumentation layout. p. 89
Figure 3.9. OOP force vs infill’s central displacement for the pilot
specimen. p. 91
Figure 3.11. OOP force vs infill’s central displacement for specimen
80_OOP_4E. p. 93
Figure 3.12. Cracking pattern evolution at first macro-cracking (a), peak
load (b) and at the end of the test (c) for specimen 80_OOP_4E. p. 94
Figure 3.13. Deformed shape evolution along vertical and horizontal
alignments (see the instruments’ layout in Figure 3.8) for specimen 80_OOP_4E at the end of each one of the five phases individuated in Figure 3.11. The deformed shape corresponding to the attainment of peak load is
highlighted with a red line. p. 95
Figure 3.14. Specimen 80_OOP_4E at the end of test. p. 95
Figure 3.15. OOP force vs infill’s central displacement for specimen
120_OOP_4E. p. 97
Figure 3.16. Deformed shape evolution along vertical and horizontal
alignments (see the instruments’ layout in Figure 3.8) for specimen 120_OOP_4E at the end of each one of the five phases individuated in Figure 3.15. The deformed shape corresponding to the attainment of peak
load is highlighted with a red line. p. 97
Figure 3.17. Cracking pattern evolution at first macro-cracking (a), peak
load (b) and at the end of the test (c) for specimen 120_OOP_4E. p. 98
Figure 3.18. Specimen 120_OOP_4E at the end of test. p. 99
Figure 3.19. IP (a) and OOP (b) response of specimen 80_IP+OOP_L. p. 101
Figure 3.20. Cracking pattern evolution during the IP test at first
macro-cracking (a), peak load (b) and at the end of the test (c) for specimen
80_IP+OOP_L. p. 102
Figure 3.21. Cracking pattern evolution during the OOP test at first
macro-cracking (a), peak load (b) and at the end of the test (c) for specimen
80_IP+OOP_L. p. 103
Figure 3.22. Specimen 80_IP+OOP_L at the end of test. p. 104
Figure 3.23. IP (a) and OOP (b) response of specimen 80_IP+OOP_M. p. 105
Figure 3.24. Cracking pattern evolution during the IP test at first
macro-cracking (a), peak load (b) and at the end of the test (c) for specimen
80_IP+OOP_M. p. 106
Figure 3.25. Cracking pattern evolution during the OOP test at first
macro-cracking (a), peak load (b) and at the end of the test (c) for specimen
Figure 3.26. Specimen 80_IP+OOP_M at the end of test. p. 108
Figure 3.27. IP (a) and OOP (b) response of specimen 80_IP+OOP_H. p. 109
Figure 3.28. Cracking pattern evolution during the IP test at first
macro-cracking (a), peak load (b) and at the end of the test (c) for specimen
80_IP+OOP_H. p. 110
Figure 3.29. Cracking pattern evolution during the OOP test at first
macro-cracking (a), peak load (b) and at the end of the test (c) for specimen
80_IP+OOP_H. p. 111
Figure 3.30. Specimen 80_IP+OOP_H at the end of test. p. 112
Figure 3.31. Comparison of the IP responses of the 80 mm thick infills. p. 113
Figure 3.32. Comparison of the OOP responses of the 80 mm thick infills. p. 114
Figure 3.33. IP (a) and OOP (b) response of specimen 120_IP+OOP_L. p. 115
Figure 3.34. Cracking pattern evolution during the IP test at first
macro-cracking (a), peak load (b) and at the end of the test (c) for specimen
120_IP+OOP_L. p. 116
Figure 3.35. Cracking pattern evolution during the OOP test at first
macro-cracking (a), peak load (b) and at the end of the test (c) for specimen
120_IP+OOP_L. p. 117
Figure 3.36. Specimen 120_IP+OOP_L at the end of test. p. 118
Figure 3.37. IP (a) and OOP (b) response of specimen 120_IP+OOP_M. p. 119
Figure 3.38. Cracking pattern evolution during the IP test at first
macro-cracking (a), peak load (b) and at the end of the test (c) for specimen
120_IP+OOP_M. p. 120
Figure 3.39. Cracking pattern evolution during the OOP test at first
macro-cracking (a), peak load (b) and at the end of the test (c) for specimen
120_IP+OOP_M. p. 121
Figure 3.40. Specimen 120_IP+OOP_M at the end of test. p. 122
Figure 3.41. IP (a) and OOP (b) response of specimen 120_IP+OOP_H. p. 123
Figure 3.42. Cracking pattern evolution during the IP test at first
macro-cracking (a), peak load (b) and at the end of the test (c) for specimen
120_IP+OOP_H. p. 124
Figure 3.43. Cracking pattern evolution during the OOP test at first
macro-cracking (a), peak load (b) and at the end of the test (c) for specimen
120_IP+OOP_H. p. 125
Figure 3.45. Comparison of the IP responses of the 120 mm thick infills. p. 127
Figure 3.46. Comparison of the OOP responses of the 120 mm thick infills. p. 128
Figure 3.47. OOP force vs infill’s central displacement for specimen
80_OOP_3E. p. 131
Figure 3.48. Cracking pattern evolution at first macro-cracking (a), peak
load (b) and at the end of the test (c) for specimen 80_OOP_3E. p. 132
Figure 3.49. Deformed shape evolution along vertical and horizontal
alignments (see the instruments’ layout in Figure 3.8) for specimen 80_OOP_3E at the end of each one of the five phases individuated in Figure 3.47. The deformed shape corresponding to the attainment of peak load is
highlighted with a red line. p. 133
Figure 3.50. Specimen 80_OOP_3E at the end of test. p. 133
Figure 3.51. OOP force vs infill’s central displacement for specimen
80_OOP_3Eb. p. 134
Figure 3.52. Cracking pattern evolution at first macro-cracking (a), peak
load (b) and at the end of the test (c) for specimen 80_OOP_3Eb. p. 135
Figure 3.53. Deformed shape evolution along vertical and horizontal
alignments (see the instruments’ layout in Figure 3.8) for specimen 80_OOP_3Eb at the end of each one of the five phases individuated in Figure 3.51. The deformed shape corresponding to the attainment of peak load is highlighted with a red line. Some readings are missing as some
instruments reached the end of their measuring range. p. 136
Figure 3.54. Specimen 80_OOP_3Eb at the end of test. p. 136
Figure 3.55. OOP force vs infill’s central displacement for specimen
80_OOP_2E. p. 137
Figure 3.56. Cracking pattern evolution at first macro-cracking (a), peak
load (b) and at the end of the test (c) for specimen 80_OOP_2E. p. 138
Figure 3.57. Deformed shape evolution along vertical and horizontal
alignments (see the instruments’ layout in Figure 3.8) for specimen 80_OOP_2E at the end of each one of the three phases individuated in Figure 3.55. The deformed shape corresponding to the attainment of peak
load is highlighted with a red line. p. 139
Figure 3.58. Specimen 80_OOP_2E at the end of test. p. 139
Figure 3.60. OOP force vs infill’s central displacement for specimen
120_OOP_3E. p. 141
Figure 3.61. Cracking pattern evolution at first macro-cracking (a), peak
load (b) and at the end of the test (c) for specimen 120_OOP_3E. p. 142
Figure 3.62. Deformed shape evolution along vertical and horizontal
alignments (see the instruments’ layout in Figure 3.8) for specimen 120_OOP_3E at the end of each one of the three phases individuated in Figure 3.60. The deformed shape corresponding to the attainment of peak load is highlighted with a red line. Some readings are missing as some
instruments reached the end of their measuring range. p. 143
Figure 3.63. Specimen 120_OOP_3E at the end of test. p. 143
Figure 3.64. OOP force vs infill’s central displacement for specimen
120_OOP_2E. p. 144
Figure 3.65. Cracking pattern evolution at first macro-cracking (a), peak
load (b) and at the end of the test (c) for specimen 120_OOP_2E. p. 145
Figure 3.66. Deformed shape evolution along vertical and horizontal
alignments (see the instruments’ layout in Figure 3.8) for specimen 120_OOP_2E at the end of each one of the four phases individuated in Figure 3.64. The deformed shape corresponding to the attainment of peak
load is highlighted with a red line. p. 146
Figure 3.67. Specimen 120_OOP_2E at the end of test. p. 146
Figure 3.68. Experimental response of the 80 mm-thick specimens (a) and
of the 120 mm-thick specimens (b). p. 147
Figure 3.69. Axial stress-strain relationships for some of the masonry
wallets tested for the mechanical characterization of test specimens’ masonry. Results for wallets tested under compressive load perpendicularly
to bricks’ holes (a) and parallel to bricks’ holes (b). p. 148
Figure 3.70. Experimental response of the specimens bounded along four
(a) three (b) and two (c) edges. p. 151
Figure 3.71. Back (a) and front (b) view of the specimen tested under cyclic
pure OOP load. p. 153
Figure 3.72. OOP force vs infill’s central displacement for specimen
120_OOP_4E_cyclic (black line) compared with the monotonic response
Figure 3.73. Cracking pattern evolution at first macro-cracking (a), peak
load (b) and at the end of the test (c) for specimen 120_OOP_4E_cyclic. p. 156
Figure 3.74. Specimen 120_OOP_4E_cyclic at the end of test. p. 157
Figure 4.1. OOP Elastic vs secant at first macro-cracking stiffness of URM
infills. p. 166
Figure 4.2. Regularized and idealized deformed shapes of the infills of the
experimental database collected. p. 172
Figure 4.3. Trends of the experimental value of the OOP strength of the
specimens included in the database with the specimens’ thickness (a),
vertical slenderness (b) and masonry vertical compressive strength (c). p. 175
Figure 4.4. First mode sinusoid deformed shape of an infill bounded along
all edges. p. 188
Figure 4.5. Comparison of the experimental and predicted values of the Rd
deformability factor for infills in RC frames (a) and in steel frames (c). Comparison of the experimental and predicted values of the OOP strength
of specimens in RC frames (b) and of specimens in steel frames (d). p. 194
Figure 4.6. Normalized OOP force-displacement diagrams (dOOP
normalized with respect to dmax) and position of the candidate collapse
displacements described in Chapter I. p. 198
Figure 4.7. Normalized OOP force-displacement diagrams (dOOP
normalized with respect to t) and position of the candidate collapse
displacements described in Chapter I. p. 199
Figure 4.8. Normalized OOP force-displacement diagrams (dOOP
normalized with respect to dmax) and position of the OOP displacement at
20% strength degradation. p. 200
Figure 4.9. Normalized OOP force-displacement diagrams (dOOP
normalized with respect to t) and position of the OOP displacement at 20%
strength degradation. p. 200
Figure 4.10. Comparison of the R factor of DIST-UNINA specimens with
those predicted by applying Angel et al.’s formulation. p. 203
Figure 4.11. Comparison of the R factors calculated for the entire database
with those predicted by applying Morandi et al.’s and Verlato et al.’s
Figure 4.12. Experimental values of the reduction factors for secant
stiffness and force at first macro-cracking and at peak load for
DIST-UNINA specimens. p. 205
Figure 4.13. Experimental strength reduction factors reported in Table 10. p. 207
Figure 4.14. Comparison of the experimental values of the reduction
factors for secant stiffness and force at first macro-cracking and at peak load for the entire database collected. Black curves are obtained by means of Equation 13 referred to specimens with slenderness ratio equal to or greater than 20.4. Blue curves are obtained by means of Equation 13 referred to specimens with slenderness ratio equal to 15.2. Red curves are determined independently on h/t. For the experimental points, see the legend in Figure
4.13. p. 208
Figure 4.15. Values of the IDR at the onset of the reduction of the OOP
strength as a function of the slenderness ratio. p. 210
Figure 4.16. Experimental and predicted R ratios accounting also for Guidi
et al.’s tests. The pink curve is associated with h/t=8.8, the blue curve to
h/t=15.2 and the black curve to h/t≥20.4. p. 212
Figure 4.17. Conventional OOP collapse displacement for IP-damaged
infills (a) and relation with the IDR of the damaged ductility over the
undamaged ductility (b). p. 213
Figure 4.18. Extrapolated IP force degradation based on Flanagan and
Bennett’s specimens 2 and 23 behaviour (b) shown in (a). p. 215
Figure 4.19. Proposed OOP response model for undamaged and
IP-damaged infills. p. 217
Figure 5.1. Ratio of the OOP strength provided by Eurocode 6 and ASCE
models at varying h/t values. p. 239
Figure 6.1. Structural plan of the case-study buildings, together with the
names of the 6 frames parallel to the Z axis and of the 4 frames parallel to
the X axis. p. 244
Figure 6.2. Elastic response spectra at LS and DL p. 247
Figure 6.3. Design response spectra at LS. p. 248
Figure 6.4. Centre of mass positions assumed in the design process. p. 251
Figure 6.5. Points for the calculation of the buildings’ displacements for
Figure 6.6. First vibration period in X and Z directions of the case-study
buildings. p. 255
Figure 6.7. Average depth of beams’ cross-sections. p. 258
Figure 6.8. Average top reinforcement ratio of beams’ cross-sections. p. 259
Figure 6.9. Average bottom reinforcement ratio of beams’ cross-sections. p. 260
Figure 6.10. Average area of columns’ cross-sections. p. 262
Figure 6.11. Average total reinforcement ratio of columns’ cross-sections. p. 263
Figure 7.1. OOP response curve of the 80 mm- and 120 mm-thick infills
predicted by using Dawe and Seah’s model. p. 269
Figure 7.2. Floor distribution of demand acceleration for given PGA equal
to 1.00 g (a) and PSA evolution at increasing PGA for the last storey (b) of a 6-storey case-study building obtained by applying Vukobratovic and
Fajfar’s and Eurocode 8’s floor spectrum. p. 270
Figure 7.3. Reference approach schematic representation: definition of IP
displacement demand as a function of the IP PGA and definition of the
degraded OOP strength of infills corresponding to that IP PGA. p. 272
Figure 7.4. Reference approach schematic representation: definition of
OOP demand (a) and matching of OOP capacity and demand (b). p. 273
Figure 7.5. Comparison of the OOP PGAc in X and Z directions for all
case-study buildings obtained by applying the DA. p. 277
Figure 7.6. Comparison of the OOP PGAc for all case-study buildings
obtained by applying the DA. Effect of the design PGA. p. 278
Figure 7.7. Comparison of the OOP PGAc for all case-study buildings
obtained by applying the DA. Effect of the number of storeys. p. 279
Figure 7.8. PGAc variation with z/H for fixed Ta/T1 ratios. p. 279 Figure 7.9. Comparison of the OOP PGAc in X and Z directions for all
case-study buildings obtained by applying the RA. p. 281
Figure 7.10. Frequency distribution for floor at which the first OOP
collapse occurs for all case-study buildings. p. 282
Figure 7.11. Comparison of the OOP PGAc for all case-study buildings
obtained by applying the DA. Effect of the number of storeys. p. 283
Figure 7.12. Comparison of the OOP PGAc for all case-study buildings
Figure 7.13. Comparison of the PGAc for all case-study buildings with
respect to structural failure and non-structural OOP failure with respect to
LS. p. 285
Figure 7.14. Comparison of the fragility curves (continuous lines) in terms
of IDR with respect to the attainment of LS for OOP failure of infills of all case-study buildings for different infill layouts. Dashed vertical lines represent the IDR corresponding to the IP collapse of the infill, according
to Panagiotakos and Fardis’s model. p. 286
Figure 7.15. Comparison of the OOP PGAc for all case-study buildings
obtained by applying the DA and RA. p. 288
Figure 7.16. Comparison of the fragility curves in terms of PGA, obtained
by using the DA and RA, with respect to the attainment of LS for OOP
failure of infills of all case-study buildings for different infill layouts. p. 289
Figure 7.17. IDR distribution in Z direction for all case-study buildings
with WL infills obtained by means of RSA (red line) and non-linear static
analysis (black line) for PGA=PGAc,RA. p. 291
Figure 7.18. Top displacement demand at PGA=PGAc,RA for the infilled
and bare frame building. The static pushover of the infilled building is reported in blue, the SPO2IDA for the same building in green. The incremental response of the elastic bare frame is reported in black
(schematic representation). p. 292
Figure 7.19. Comparison of the OOP PGAc for all case-study buildings
obtained by applying the DA, RA and SDA. p. 293
Figure 7.20. Conceptual example of predicted PGAc,OOP/PGAc,IP ratio
surface (dark grey) with limit state curve (blue) separating the h/t-fm couples
for which the IP collapse foreruns the OOP collapse from those for which
the OOP collapse foreruns the IP collapse. p. 296
Figure 7.21. OOP safety domains in terms of slenderness ratio and masonry
compressive strength obtained for the 2-storey case study buildings by
applying the RA. p. 297
Figure 7.22. OOP safety domains in terms of slenderness ratio and masonry
compressive strength obtained for the 4-storey case study buildings by
Figure 7.23. OOP safety domains in terms of slenderness ratio and masonry
compressive strength obtained for the 6-storey case study buildings by
applying the RA p. 299
Figure 7.24. OOP safety domains in terms of slenderness ratio and masonry
compressive strength obtained for the 8-storey case study buildings by
applying the RA p. 300
Figure 7.25. Limit state curves for all case-study buildings and their linear
safety-sided simplification. The shaded area covers all the OOP safe h/t-fm
couples. p. 301
Figure 8.1. Potential physically unexplainable issues deriving from
modelling a degrading behaviour for the IP-undamaged infill and a plastic
behaviour for the IP-damaged infill. p. 308
Figure 8.2. Graphical representation of the proposed modelling strategy. p. 310
Figure 8.3. Simplified schema of the routine aimed at trespassing from one
backbone to another. p. 311
Figure 8.4. Modelling strategy workflow. p. 315
Figure 8.5. Selected records response spectra for NS components (a) and
EW components (b). Response spectra of the selected records matched to
EC8 design spectrum at LS with PGA equal to 0.15 g (c). p. 321
Figure 8.6. Mode frequencies, OOP frequency of the SL infill, control
modes and Rayleigh damping ratios for the 4P05_SL case-study building. p. 323
Figure 8.7. IDA curves for building 8P35_WL in the X (a-c) and Z (b-d)
directions for the W/ (a-b) and the W/O (c-d) models. p. 324
Figure 8.8. IDA curves for building 8P35_ML in the X (a-c) and Z (b-d)
directions for the W/ (a-b) and the W/O (c-d) models. p. 326
Figure 8.9. IDA curves for building 8P35_SL in the X (a-c) and Z (b-d)
directions for the W/ (a-b) and the W/O (c-d) models. p. 327
Figure 8.10. Mean PGAc values on the W/O models for all case-study
buildings. p. 330
Figure 8.11. Mean PGAc values on the W/O models for all case-study
buildings. p. 330
Figure 8.12. Mean PGAc values on the W/ models for all case-study
buildings. p. 333
Figure 8.13. Mean PGAc values on the W/ models for all case-study
Figure 8.14. Fragility curves (PGAc): comparison of the results obtained by
means of non-linear time-history analyses on W/ models (continuous lines)
and on W/O models (dashed lines) for all the case-study buildings. p. 335
Figure 8.15. Fragility curves (PGAc): comparison of the results obtained by
means of non-linear time-history analyses (continuous lines) with those
obtained by means of non-linear static analyses (dashed lines). p. 336
Figure 8.16. Mean IDRc values on the W/O models for all case-study
buildings. p. 339
Figure 8.17. Mean IDRc values on the W/O models for all case-study
buildings. p. 339
Figure 8.18. Mean IDRc values on the W/ models for all case-study
buildings. p. 342
Figure 8.19. Mean IDRc values on the W/ models for all case-study
buildings. p. 342
Figure 8.20. Fragility curves (IDRc): comparison of the results obtained by
means of non-linear time-history analyses on W/ models (continuous lines)
and on W/O models (dashed lines) for all the case-study buildings. p. 344
Figure 8.21. Fragility curves (IDRc): comparison of the results obtained by
means of non-linear time-history analyses (continuous lines) with those
obtained by means of non-linear static analyses (dashed lines). p. 345
Figure 8.22. Frequency distributions of OOP collapses for all the
case-study buildings. p. 347
Figure 8.23. Determination of the behaviour factor for the W/O and the W/
model with reference to the OOP elastic stiffness of the IP-undamaged
(W/O model) and of the IP-damaged (W/ model) infill. p. 349
Figure 8.24. Mean q-factor values on the W/O models for all case-study
buildings (straightforward approach). p. 351
Figure 8.25. Mean q-factor values on the W/O models for all case-study
buildings (straightforward approach) p. 352
Figure 8.26. Mean q-factor values on the W/ models for all case-study
buildings (straightforward approach). p. 354
Figure 8.27. Mean q-factor values on the W/ models for all case-study
buildings (straightforward approach) p. 355
Figure 8.28. Determination of the behaviour factor for the W/ model with
Figure 8.29. Mean q-factor values on the W/ models for all case-study
buildings (practice-oriented approach). p. 358
Figure 8.30. Mean q-factor values on the W/ models for all case-study
buildings (practice-oriented approach). p. 359
Figure 8.31. Determination of the behaviour factor for the W/O and the W/
model with reference to the OOP effective stiffness. p. 360
Figure 8.32. Mean q-factor values on the W/O models for all case-study
buildings (effective stiffness approach). p. 364
Figure 8.33. Mean q-factor values on the W/O models for all case-study
buildings (effective stiffness approach). p. 365
Figure 8.34. Mean q-factor values on the W/ models for all case-study
buildings (effective stiffness approach). p. 369
Figure 8.35. Mean q-factor values on the W/ models for all case-study
buildings (effective stiffness approach). p. 370
Figure A.1. McDowell et al.’s masonry stripe at the initial stage. p. 376
Figure A.2. McDowell et al.’s arching mechanism for a single masonry
part. p. 378
Figure A.3. Collapse mechanism for McDowell et al.’s masonry stripe. p. 379
Figure A.4. Angel et al.’s arching mechanism. p. 380
Figure A.5. Stresses and forces acting at one end of the upper masonry part
according to Angel et al. p. 381
Figure A.6. Stresses and forces acting at one end of the upper masonry part
according to Angel et al. p. 382
Figure A.7. Calculation of Angel et al.’s contact length b and θ and γ angles
based on geometrical considerations. p. 383
Figure A.8. Bashandy et al.’s OOP collapse mechanism. p. 392
Figure A.9. Bashandy et al.’s stripe model. p. 393
Figure B.1. OOP test 80_OOP_4E. p. 400
Figure B.2. OOP test 80_OOP_3E. p. 401
Figure B.3. OOP test 80_OOP_3Eb. p. 402
Figure B.4. OOP test 80_OOP_2E. p. 403
Figure B.5. IP test 80_IP+OOP_L. p. 404
Figure B.6. OOP test 80_IP+OOP_L. p. 405
Figure B.7. IP test 80_IP+OOP_M. p. 406
Figure B.9a. IP test 80_IP+OOP_H (1st to 4th cycle). p. 408 Figure B.9b. IP test 80_IP+OOP_H (5th and 6th cycles). p. 409
Figure B.10. OOP test 80_IP+OOP_H. p. 410
Figure B.11. OOP test 120_ OOP_4E. p. 411
Figure B.12. OOP test 120_ OOP_3E. p. 412
Figure B.13. OOP test 120_ OOP_2E. p. 413
Figure B.14. IP test 120_IP+OOP_L. p. 414
Figure B.15. OOP test 120_IP+OOP_L. p. 415
Figure B.16a. IP test 120_IP+OOP_M (1st to 4th cycle). p. 416 Figure B.16b. IP test 120_IP+OOP_M (5th and 6th cycles). p. 417
Figure B.17. OOP test 120_IP+OOP_M. p. 418
Figure B.18a. IP test 120_IP+OOP_H (1st to 4th cycle). p. 419 Figure B.18b. IP test 120_IP+OOP_H (5th and 8th cycles). p. 420
Figure B.19. OOP test 120_IP+OOP_H. p. 421
Figure B.20a. OOP test 120_OOP_4E_cyclic (1st and 2nd cycles). p. 422 Figure B.20b. OOP test 120_OOP_4E_cyclic (3rd and 4th cycles). p. 423
Figure C.1. Instrumentation layout. p. 425
Figure C.2. Test 80_OOP_4E.The vertical axis refers to the displacement
read by the considered instrument, the horizontal axis refers to the OOP
central displacement. p. 426
Figure C.3. Test 80_OOP_3E. The vertical axis refers to the displacement
read by the considered instrument, the horizontal axis refers to the OOP
central displacement. p. 427
Figure C.4. Test 80_OOP_3Eb. The vertical axis refers to the displacement
read by the considered instrument, the horizontal axis refers to the OOP central displacement. Instruments B1, C1 and D1 reached the end of their
measurement range. p. 428
Figure C.5. Test 80_OOP_2E. The vertical axis refers to the displacement
read by the considered instrument, the horizontal axis refers to the OOP
central displacement. p. 429
Figure C.6. Test 80_IP+OOP_L. The vertical axis refers to the
displacement read by the considered instrument, the horizontal axis refers
Figure C.7. Test 80_IP+OOP_M. The vertical axis refers to the
displacement read by the considered instrument, the horizontal axis refers
to the OOP central displacement. p. 431
Figure C.8. Test 80_IP+OOP_H. The vertical axis refers to the
displacement read by the considered instrument, the horizontal axis refers
to the OOP central displacement. p. 432
Figure C.9. Test 120_OOP_4E. The vertical axis refers to the displacement
read by the considered instrument, the horizontal axis refers to the OOP
central displacement. p. 433
Figure C.10. Test 120_OOP_3E. The vertical axis refers to the
displacement read by the considered instrument, the horizontal axis refers
to the OOP central displacement. p. 434
Figure C.11. Test 120_OOP_2E. The vertical axis refers to the
displacement read by the considered instrument, the horizontal axis refers
to the OOP central displacement. p. 435
Figure C.12. Test 120_IP+OOP_L. The vertical axis refers to the
displacement read by the considered instrument, the horizontal axis refers
to the OOP central displacement. p. 436
Figure C.13. Test 120_IP+OOP_M. The vertical axis refers to the
displacement read by the considered instrument, the horizontal axis refers to the OOP central displacement. Instruments B1, C1 and D1 reached the
end of their measurement range. p. 437
Figure C.14. Test 120_IP+OOP_H. The vertical axis refers to the
displacement read by the considered instrument, the horizontal axis refers to the OOP central displacement. Instruments B1, C1 and D1 reached the
List of Tables
Table 1.1. OOP strength models based on one-way and two-way arching
action. p. 27
Table 2.1. Mechanical properties of the specimens by da Porto et al.
(2007). p. 49
Table 2.2. Summary of tests’ results by da Porto et al. (2007). p. 50
Table 2.3. Mechanical properties of specimen TA5 by Hak et al. (2014). p. 51
Table 2.4. Summary of test TA5 results by Hak et al. (2014). p. 52
Table 2.5. Mechanical properties for the specimens by Dawe and Seah
(1989). p. 53
Table 2.6. Summary of tests’ results by Dawe and Seah (1989). p. 55
Table 2.7. Mechanical properties for the specimens by Angel et al. (1994). p. 56
Table 2.8. Summary of tests’ results by Angel et al. (1994). p. 57
Table 2.9. Mechanical properties for the specimens by Flanagan and
Bennett (1999). p. 58
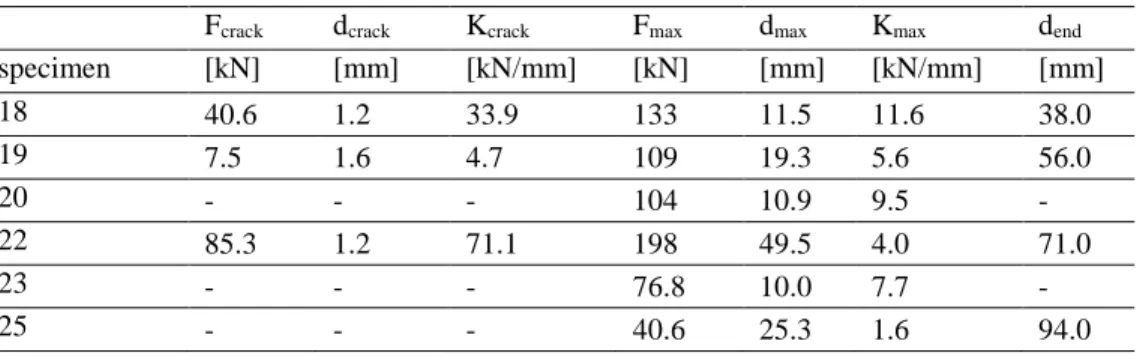
Table 2.10. Summary of tests’ results by Flanagan and Bennett (1999a). p. 60
Table 2.11. Mechanical properties for the specimens by Calvi and
Bolognini (2001). p. 61
Table 2.12. Summary of tests’ results by Calvi and Bolognini (2001). p. 62
Table 2.13. Mechanical properties for the specimens by Varela-Rivera et
al. (2012). p. 63
Table 2.14. Summary of tests’ results by Varela-Rivera et al. (2012). p. 63
Table 2.15. Mechanical properties for the specimens by Guidi et al.
(2013). p. 66
Table 2.16. Summary of tests’ results by Guidi et al. (2013). p. 67
Table 2.17. Mechanical properties of the specimens by Hak et al. (2014). p. 67
Table 2.18. Summary of tests’ results by Hak et al. (2014). p. 69
Table 2.19. Mechanical properties of the specimens by Furtado et al.
(2016). p. 69
Table 2.20. Summary of tests’ results by Furtado et al. (2016). p. 71
Table 3.1. Average RC frames mechanical properties. p. 84
Table 3.3. IP loading path defined by nominal target IP drifts and
displacements. p. 87
Table 3.4. Summary of test 80_OOP_4E results. p. 93
Table 3.5. Summary of test 120_OOP_4E results. p. 97
Table 3.6. Summary of the combined IP/OOP tests. p. 100
Table 3.7. Summary of test 80_IP+OOP_L (IP IDR=0.16%) results. p. 103
Table 3.8. Summary of test 80_IP+OOP_M (IP IDR=0.37%) results. p. 107
Table 3.9. Summary of test 80_IP+OOP_H (IP IDR=0.58%) results. p. 111
Table 3.10. Summary of test 120_IP+OOP_L (IP IDR=0.21%) results. p. 117
Table 3.11. Summary of test 120_IP+OOP_M (IP IDR=0.51%) results. p. 121
Table 3.12. Summary of test 120_IP+OOP_H (IP IDR=0.89%) results. p. 125
Table 3.13. Summary of the OOP tests on infills with different boundary
conditions. p. 129
Table 3.14. Summary of test 80_OOP_3E results. p. 131
Table 3.15. Summary of test 80_OOP_3Eb results. p. 135
Table 3.16. Summary of test 80_OOP_2E results. p. 137
Table 3.17. Summary of test 120_OOP_3E results. p. 141
Table 3.18. Summary of test 120_OOP_2E results. p. 145
Table 3.19. OOP loading path defined by nominal target OOP
displacements imposed by the actuator. p. 154
Table 3.20. Summary of test 120_OOP_4E_cyclic and test 120_OOP_4E
results. p. 156
Table 4.1. Experimental database of pure OOP tests. p. 164
Table 4.2. Experimental database of combined IP/OOP tests. p. 165
Table 4.3. Comparison of the experimental and predicted values of Kcrack
for 2E specimens. p. 167
Table 4.4. Comparison of the experimental and predicted values of Kcrack
for 4E specimens. p. 168
Table 4.5. Comparison of the experimental and predicted values of Kmax
for 2E specimens. p. 169
Table 4.6. Association of the specimens to the regularized and idealized
deformed shapes reported in Figure 4.2. p. 173
Table 4.7. Experimental strength, Fmax [kN], of infills bounded along
two edges compared to the predicted value by McDowell et al., Angel et
Table 4.8. Experimental strength, Fmax [kN], of infills bounded along two
edges compared to the predicted value by Dawe and Seah’s model under the hypothesis of stiff confining elements (stiff), of deformable confining elements with elastic stiffness (elastic) and of deformable confining elements with effective flexural stiffness equal to one-half the elastic one
(effective). p. 177
Table 4.9. Experimental strength, Fmax [kN], of infills bounded along four
edges to RC frames compared to the predicted value by Dawe and Seah
(empirical formula), Flanagan and Bennett and Bashandy et al. p. 178
Table 4.10. Experimental strength, Fmax [kN], of infills bounded along
four edges to steel frames compared to the predicted value by Dawe and
Seah (empirical formula), Flanagan and Bennett and Bashandy et al. p. 179
Table 4.11. Experimental strength, Fmax [kN], of infills bounded along
four edges to RC frames compared to the predicted value by Dawe and Seah mechanical model under the hypothesis of stiff confining elements (stiff), of deformable confining elements with elastic stiffness (elastic) and of deformable confining elements with effective flexural stiffness
equal to one-half the elastic one (effective). p. 181
Table 4.12. Experimental strength, Fmax [kN], of infills bounded along
four edges to steel frames compared to the predicted value by Dawe and Seah mechanical model under the hypothesis of stiff confining elements (stiff), of deformable confining elements with elastic stiffness (elastic) and of deformable confining elements with effective flexural stiffness
equal to one-half the elastic one (effective). p. 182
Table 4.13. Regression coefficients for Equation 9 for different load and
deformed shape, together with mean, median and CoV of the ratios of the OOP strength calculated for the “simulated” infills through Dawe and
Seah’s model and by applying the regression formulations (simplified). p. 191
Table 4.14. Experimental and predicted values of the deformability factor
Rd and of the OOP strength derived from the proposed simplified
approach for infills in RC frames. p. 193
Table 4.15. Experimental and predicted values of the deformability factor
Rd and of the OOP strength derived from the proposed simplified
Table 4.16. Comparison of the experimental and predicted values of Fcrack
for 4E specimens. p. 197
Table 4.17. Experimental values of the R factor (Fmax,dam/Fmax,und). p. 202 Table 4.18. Comparison of the experimental values of the R factor
(Fmax,dam/Fmax,und) with the value predicted by Angel et al.’s formulation. p. 202 Table 4.19. Comparison of the experimental values of the R factor
(Fmax,dam/Fmax,und) with the values predicted by Morandi et al.’s (stepwise
and linear) and by Verlato et al.’s formulations. p. 203
Table 4.20. Experimental values of the reduction factors for secant
stiffness and force at first macro-cracking and at peak load for the entire
database collected. p. 206
Table 4.21. Values of the coefficients of Equation 13 and mean, median
and CoV of the ratios between the experimental values of Kcrack, Fcrack,
Kmax and Fmax reduction factors and those predicted by means of Equation
13. p. 209
Table 4.22. Experimental results by Guidi et al. p. 211
Table 4.23. Formulations defining the seismic response of IP-undamaged
URM infills in a stiff confining frame adopted for the numerical analyses. p. 218
Table 4.24. Formulations defining the seismic response of IP-damaged
URM infills in a stiff confining frame adopted for the numerical analyses. p. 219
Table 5.1. Code provisions on the OOP safety check of URM infills. p. 219
Table 6.1. Materials’ properties used for the design and assessment of the
case-study buildings. p. 245
Table 6.2. Construction materials’ weight per unit volume. p. 249
Table 6.3. Design fundamental periods in the X and Z global directions
of the case-study bare buildings. p. 255
Table 6.4. Value of the design normalized axial load to use in columns’
dimensioning at first floor. p. 256
Table 6.5. Value of the design normalized axial load to use in columns’
dimensioning at last floor. p. 257
Table 6.6. Value of the maximum diameter of longitudinal bars to use in
columns’ dimensioning for design PGA at LS lower than 0.20 g. p. 257
Table 6.7. Value of the maximum diameter of longitudinal bars to use in
columns’ dimensioning for design PGA at LS equal to or greater than
Table 7.1. Elastic fundamental periods in the X and Z global directions of
the case-study infilled buildings. p. 274
Table 7.2. Geometric and mechanical properties of all infill layouts. p. 275
Table 7.3. Infills’ IP behaviour characteristic points. p. 276
Table 7.4. OOP infill properties for all layouts used for DA application. p. 276
Table 7.5. OOP infill properties for all layouts used for RA application. p. 280
Table 7.6. PGA at first OOP infill collapse for all case-study buildings
assessed by means of the Designer Approach (DA), Reference Approach
(RA) and Suggested Designer Approach (SDA). p. 294
Table 8.1. Infills’ geometric and masonry mechanical properties. p. 317
Table 8.2. Infills’ IP behaviour characteristic points. p. 318
Table 8.3. OOP-undamaged infills’ OOP behaviour characteristic points. p. 318
Table 8.4. Elastic fundamental periods in the X and Z global directions of
the case-study infilled buildings. p. 319
Table 8.5. Ground Motions selected for the Incremental Dynamic
Analyses. p. 320
Table 8.6. Selected Records’ scale factors (SF) and associated PGAs for
Incremental Dynamic Analyses. p. 322
Table 8.7. Values of PGAc [g] for all case-study buildings (W/O
models). p. 329
Table 8.8. Values of PGAc [g] for all case-study buildings (W/ models). p. 332 Table 8.9. Fragility curves parameters (PGAc) determined based on the
results of the non-linear time-history analyses. p. 335
Table 8.10. Values of IDRc [%] for all case-study buildings (W/O
models). p. 338
Table 8.11. Values of IDRc [%] for all case-study buildings (W/ models). p. 341 Table 8.12. Fragility curves parameters (PGAc) determined based on the
results of the non-linear time-history analyses. p. 343
Table 8.13. Values of the q-factor obtained through the non-linear
time-history analysis on the W/O models calculated by dividing the OOP seismic demand corresponding to the initial elastic stiffness of the
Table 8.14. Values of the q-factor obtained through the non-linear
time-history analysis on the W/ models calculated by dividing the OOP seismic demand corresponding to the initial elastic stiffness of the IP-damaged
infill by its strength. p. 353
Table 8.15. Values of the q-factor obtained through the non-linear
time-history analysis by calculating, for the W/ model, the OOP seismic demand corresponding to the initial elastic stiffness of the IP-undamaged infill and dividing the elastic force by the strength of the IP-undamaged
infill. p. 357
Table 8.16. Values of the effective stiffness Keff normalized with respect
to the elastic Kel stiffness of the IP-undamaged infill obtained through the
non-linear time-history analysis on the W/O models. p. 361
Table 8.17. Values of the q-factor obtained through the non-linear
time-history analysis on the W/O models calculated by dividing the OOP seismic demand corresponding to the effective period of the infill by its
strength. p. 363
Table 8.18. Values of the effective stiffness Keff normalized with respect
to the elastic Kel stiffness of the IP-undamaged infill obtained through the
non-linear time-history analysis on the W/ models. p. 366
Table 8.19. Values of the q-factor obtained through the non-linear
time-history analysis on the W/ models calculated by dividing the OOP seismic demand corresponding to the effective period of the IP-undamaged infill
by its strength. p. 368
Table 8.20. Average values of the effective stiffness for all infill layouts. p. 371
Table 8.21. Values of the q-factor for all infill layouts: 16th percentile. p. 372 Table 8.22. Values of the q-factor for all infill layouts: 50th percentile. p. 372 Table 8.23. Values of the q-factor for all infill layouts: 84th percentile. p. 372 Table D.1. Specimens’ geometric and mechanical properties (infill walls). p. 440
Table D.2. Specimens’ geometric and mechanical properties (confining
Introduction
Past and recent earthquakes showed that the seismic performance of buildings is strongly influenced by the presence and contribution of unreinforced masonry (URM) infills, which are usually considered as non-structural elements. Such enclosures are used – especially in Mediterranean countries – to provide buildings with thermic, visual and acoustic insulation.
On one hand, URM infills can stand significant lateral loads and, so, they contribute to the lateral strength capacity of structures. In addition, they are provided with a high in-plane stiffness. For this reason, the assessment of a construction modelled as bare frame can yield to a significant underestimation of its lateral strength and stiffness.
On the other hand, it is well-known that the high force demand that URM enclosures attract and then transfer to the confining elements can yield to unexpected failures of structural members designed without accounting for infills’ presence. For example, Reinforced Concrete (RC) columns (and beams, potentially) not designed addressing seismic and capacity design provisions sometimes exhibit brittle failures during strong earthquakes due to the so-called “frame-infill interaction”, i.e., due to the shear forces transferred by infills and not considered in the design. Moreover, the absence of infills at a certain storey of a building (typically, the first) produces a non-negligible stiffness variation of the structure lateral stiffness along its height, leading, in this way, to potential peaks of inelastic demand at that storey yielding to a sidesway collapse due to a soft-storey mechanism. In addition, infills’ damaging due to IP actions and their repair or refurbishment produces most of the financial losses consequent to earthquakes.
In other words, neglecting infills’ presence and their contribution to the seismic response of structures can be both conservative and unconservative. For these reasons, the interest in the characterization of the seismic response of URM infills has significantly grown in the engineering and research community in the last decades.
It should be noted that these bi-dimensional non-structural elements are subjected to the seismic action both in the in-plane (IP) and in the out-of-plane (OOP) direction. The expulsion or overturning from the confining frame due to OOP actions of URM infills is potentially highly detrimental for human life safety and amplifies the economic losses consequent to earthquakes. The OOP collapse of URM infills is promoted by the damage due to IP actions, which can reduce their OOP strength, stiffness and displacement capacity. This phenomenon is called IP/OOP interaction.
This PhD thesis is dedicated to the characterization and modelling of the OOP behaviour of URM infills and to the study of the effects of the IP/OOP interaction both at the level of the single (non-structural) component and at the level of the infilled structure seismic performance.
Chapter I is dedicated to the existing literature concerning this issue and investigating the definition of the OOP strength, stiffness and displacement capacity of URM infills. In addition, existing formulation for the prediction and reproduction of the IP/OOP interaction effects are addressed. Finally, existing URM infills’ modelling strategies accounting for their OOP behaviour and for the IP/OOP interaction effects are described in detail.
Chapter II constitute the second part of the previous literature recall, as it is dedicated to a detailed description of the experimental tests carried out in the past to investigate the OOP behaviour of URM infills and the IP/OOP interaction effects. It is observed that the experimental database allowing evaluating the effectiveness and robustness of literature formulations and models described in Chapter I is extremely poor.
For this reason, a comprehensive and extended experimental program has been carried out at the Department of Structures for Engineering and Architecture of University of Naples Federico II. The experimental program main aim is the characterization of the effects of the panel height-to-thickness slenderness ratio, of the boundary conditions at edges and of the IP/OOP interaction on the OOP strength, stiffness and displacement capacity of URM infills. A total of fifteen tests has been carried out to enrich the available experimental database. Chapter III is dedicated to a detailed description of the experimental program and of its results.
In Chapter IV, the experimental database collected in Chapter II and III is analysed and discussed, in order to compare the prediction of literature formulations and models aimed at assessing the OOP response of URM infills and/or its significant parameters, such as the force at first macro-cracking and at maximum, as well as their secant stiffness at the first macro-cracking and at maximum and the displacement capacity/ductility. The