Università Politecnica delle Marche
Scuola di Dottorato di Ricerca in Scienze dell’Ingegneria Curriculum in Ingegneria Civile, Ambientale, Edile e Architettura ---
Numerical analysis of traditionally
excavated shallow tunnels
Ph.D. Dissertation of:
Alessandra Paternesi
Advisor:
Prof. Ing. Giuseppe Scarpelli
Curriculum supervisor: Prof. Ing. Stefano Lenci
Università Politecnica delle Marche
Scuola di Dottorato di Ricerca in Scienze dell’Ingegneria Curriculum in Ingegneria Civile, Ambientale, Edile e Architettura ---
Analisi numeriche di gallerie
superficiali scavate in tradizionale
Ph.D. Dissertation of: Alessandra Paternesi
Advisor:
Prof. Ing. Giuseppe Scarpelli
Curriculum supervisor: Prof. Ing. Stefano Lenci
Acknowledgements
I wish to thank Professor Scarpelli not only for giving me the opportunity and all the means I needed for developing this thesis but also for trusting me and supporting all the choices I had to take during this period as well as all the activities that could be useful for my personal growth. I appreciated his willingness to discuss with me and my colleagues about all the topics he had to deal with from both the research and professional side. All the projects and academic activities I was involved in represented an essential part of my knowledge. A huge thanks to Professor Schweiger, who welcomed me in Graz and contributed to turn my period as visiting PhD student into an extremely positive experience. He also played a decisive role in the definition of the path I could follow to develop an organic work and encouraged me to challenge myself, sharing my work with the scientific and professional community. His availability to share his knowledge and to discuss with PhD students and colleagues, as well as his passion for his work, represent an example for all those who have the luck to work with him.
Thanks to my colleagues Viviene, Paolo, David, Alessandro, Evghenia and Antonio for taking part in many useful discussions and providing important suggestions for improving my work.
Thanks to my family for recognising and supporting my inclination for research, for helping me in chasing my dreams and pursuing this path despite the difficult moments.
Thanks to Emanuele who was always in the front line for remembering me that I could make it, no matter how hard it was, and for his capability to lighten my mood and remember me not to take everything too seriously. Despite the distance, I never felt alone in facing good and bad moments.
Abstract
Among the problems that civil engineers have to face, the design and verification of an underground construction is one of the most challenging. A tunnel engineer has to tackle with a complex three-dimensional soil-structure interaction problem where many factors and uncertainties come into play. This is the reason why professional experience and engineering judgment usually play a crucial role.
In recent years, numerical calculation techniques, which can provide an important basis for a better understanding of the problem, have strongly improved. They have become a fundamental resource for underground construction design, but they also entail some drawbacks:
- only engineers with a strong numerical background can handle complex soil-structure interaction problems;
- numerical calculations, especially if 3D, can be very time-consuming;
- material parameters should be carefully evaluated, according to the particular problem and adopted constitutive law;
- numerical models need to be validated with field monitoring data - it is not always clear how to tackle with numerical models in
combination with design codes.
The goal of this thesis is to investigate the main issues regarding the applicability of numerical analyses to the design and verification of traditionally excavated shallow tunnels. The term traditional refers to any excavation technique not involving the use of tunnelling boring machines. Despite the remarkable technological improvement in mechanised tunnelling, traditional techniques still represent, in some cases, the most suitable and convenient solution. The principal advantage of traditional techniques is the high flexibility in the choice of supports and reinforcement measures. However, design flexibility implies a deep understanding of the ground response to underground openings as well as a conscious use of
Riassunto
Lo scavo di gallerie rappresenta sicuramente una tra le sfide più impegnative che un ingegnere civile possa affrontare. Ciò è dovuto principalmente alla natura tridimensionale di questo problema di interazione terreno-struttura ma anche alle numerose incertezze che possono entrare in gioco nella progettazione. Come conseguenza di tali difficoltà, il giudizio ingegneristico e l’esperienza del progettista giocano spesso un ruolo forndamentale.
Recentemente, le tecniche di calcolo numeriche, che permettono una più ampia comprensione del problema, hanno subito un notevole sviluppo, diventando una risorsa fondamentale per la progettazione di scavi in sotterraneo. Tuttavia, è necessario valutare anche che:
- solo ingegneri con una buona preparazione numerica sono in grado di gestire la modellazione di problemi di interazione terreno-struttura così complessi;
- i calcoli numerici, in particolare quelli 3D, possono comportare un notevole dispendio di tempo, a volte non compatibile con le esigenze progettuali;
- i parametri del materiale devono essere calibrati accuratamente, tenendo in considerazione le peculiarità del problema analizzato e del legame costitutivo adottato;
- i modelli numerici devono essere validati con dati di monitoraggio; - l’applicazione dei comuni codici progettuali ad una progettazione
basata sulla modellazione numerica non è sempre chiara e lineare. Lo scopo di questa tesi è quello di analizzare alcune delle problematiche principali legate alla progettazione di gallerie superficiali scavate in tradizionale. Lo scavo in tradizionale comprende tutte le tecniche che non prevedono un processo di industrializzazione dello scavo stesso, come avviene con l’utilizzo di una TBM (Tunnelling Boring Machine).
Nonostante il notevole sviluppo tecnologico dello scavo meccanizzato, quello in tradizionale rappresenta ancora, in alcuni casi, la soluzione più vantaggiosa. Il vantaggio principale è legato alla maggiore flessibilità nella scelta dei rivestimenti e delle techniche di rinforzo del cavo e del fronte della galleria. Tuttavia, una maggiore flessibilità progettuale è necessariamente legata ad una profonda conoscenza del comportamento deformativo dell’ammasso, nonché ad un utilizzo consapevole delle
tecniche di modellazione numerica. Il presente lavoro è principalmente incentrato sulle seguenti tematiche:
- l’analisi della stabilità di fronti di scavo rinforzati e non rinforzati; - l’applicabilità degli Eurocodici ad una progettazione di gallerie
superficiali condotta mediante tecniche di modellazione numerica; - la calibrazione dei parametri del modello numerico e la sua
Contents
Chapter 1.The construction of shallow tunnels through
traditional techniques ... 4
1.1. Excavation techniques ... 4
1.2. Supporting and reinforcement measures in conventional tunnelling ... 9
1.3. Partialised vs. full face excavation ... 20
1.4. Monitoring devices and techniques ... 23
Chapter 2.
Numerical modelling of traditionally excavated
shallow tunnels: state of the art ... 28
2.1. Calculation methods in tunnelling ... 28
2.1.1. Empirical methods ... 29
2.1.2. Analytical methods ... 30
2.1.3. Bedded-beam-spring models ... 32
2.1.4. Limit equilibrium methods ... 34
2.1.5. Some considerations about simplified solutions ... 34
2.2. Numerically based design in combination with Eurocodes .. 36
2.2.1. Overview of Eurocode 7 ... 37
2.2.2. Current application of EC7 to tunnel design ... 39
2.2.3. Application of EC7 approaches to numerical calculation of underground excavations ... 40
2.3. Face stability calculations ... 42
2.3.1. Application of the limit equilibrium method for tunnel face stability 45 2.3.2. State of the art on numerical calculations of stability and face deformation behaviour ... 48
2.4. Numerical predictions and back-analyses ... 51
2.5. Concluding remarks ... 60
Chapter 3.
Eurocodes applicability to numerical calculation
of shallow tunnels: calculation examples ... 62
3.1. Calculation benchmark ... 62
3.1.1. Results and discussion ... 68
Chapter 4.
Analyses of reinforced and unreinforced
excavation face ... 80
4.1. LEM analyses ... 81
4.2. 3D FEM safety analyses ... 82
4.3. Deformation analyses ... 92
4.4. Concluding remarks ... 97
Chapter 5.
Case study: introduction
and
parameter
calibration 99
5.1. Calibration of the HSS model ... 1045.2. Tunnel stress paths ... 124
5.3. Concluding remarks ... 127
Chapter 6.
Numerical calculations and comparisons with
monitoring data ... 128
6.1. Trigoni tunnel ... 128
6.1.1. Numerical analysis ... 129
6.1.2. Results and comparison with monitoring data ... 133
6.1.3. Calibration of the stress release factor for 2D analyses ... 146
6.2. Pergola tunnel ... 152
6.2.1. Numerical analysis ... 153
6.2.2. Results and comparison with monitoring data ... 155
6.3. Concluding remarks ... 163
Final conclusions and recommendations ... 165
References ... 168
Appendix A.
Some details of the used FEM numerical code
(Plaxis)
179
A.1. FEM formulation ... 179A.2. Accuracy of the FEM calculation ... 184
Appendix B.
Hardening Soil Model ... 186
B.7. Small Strain Stiffness ... 199
Appendix C.
Sensitivity analyses ... 203
C.1. HSS parameters ... 205
C.2. Lining stiffness ... 208
List of Figures
Figure 1. Drill and blast cycle (from Heiniö 1999) ... 5
Figure 2. Excavator with attachment for multiple tasks (from Tatiya 2005) . 6 Figure 3. Crawler excavator equipped with mechanical shovel ... 6
Figure 4. Crawler excavator equipped with rotary cutters ... 6
Figure 5. Crawler excavator equipped with hammer ... 7
Figure 6. Crawler excavator equipped with ripper ... 7
Figure 7. Roadheader ... 7
Figure 8. Wheeled loader and dumper. ... 8
Figure 9. Support measures in conventional tunnelling (from Hoek 2001 and Lunardi 2000) ... 10
Figure 10. Tunnel deformation response (from Lunardi 2005) ... 11
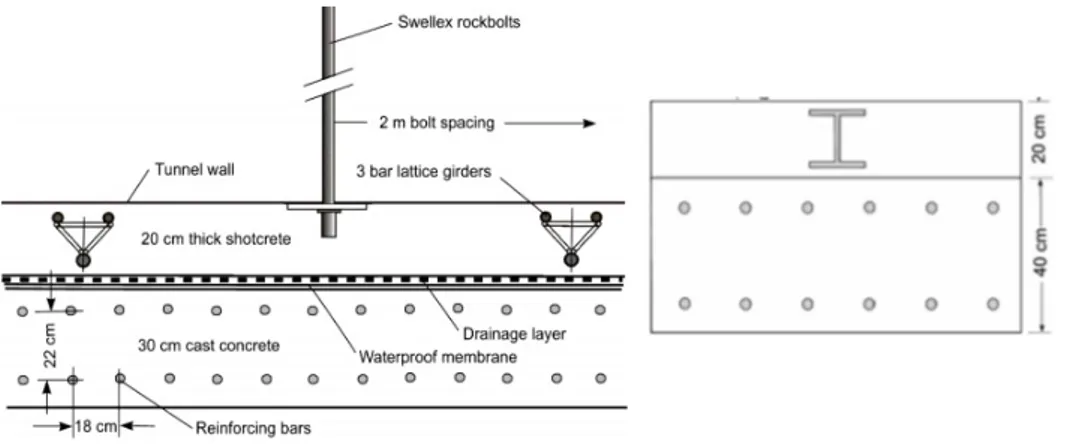
Figure 11. Sections of both primary and final tunnel support: shotcrete reinforced with lattice girders and cast in place concrete (left), shotcrete reinforced with steel ribs and cast in place concrete (right). Figures from (Hoek et al. 2008) ... 12
Figure 12. Case of open profile buckling (a, from Zenti & Perlo 2015), 2 coupled IPN profiles and tubular hollow profile (b, from Zenti & Perlo 2015), comparison between primary lining made of shotcrete reinforced with circular steel profiles on the left and shotcrete reinforced with coupled IPN on the right (c, from http://www.societaitalianagallerie.it) ... 13
Figure 13. Installation of the semi-automatic tubular steel arch support (from Zenti & Cullaciati 2016) ... 13
Figure 14. Longitudinal slots in the primary support (from Bernhard Maidl, Markus Thewes, Ulrich Maidl 2013) ... 14
Figure 15. Yielding supports (Schubert & Radoncic 2015) ... 14
Figure 16. Correct arrangement of anchors (a), end anchored bolts (b), grouted anchors (c), Swellex anchors (d); figures from Bernhard Maidl, Markus Thewes, Ulrich Maidl 2013 ... 15 Figure 17. Construction detail of the primary support foot: shotcrete
Figure 19. Longitudinal profile of the tunnel with jet-grouting reinforcements (left), detail of the columns on the tunnel crown (right); figures from Lunardi (2000) ... 18 Figure 20. Forepoling with steel tubes (figures from www.robit.fi) ... 19 Figure 21. Drainage pipe bearing water (a) and slotted tube detail (b), from Lunardi 2000; detail of the final drainage on the tunnel sidewall (c), from www.cosella-dorken.com ... 20 Figure 22. Examples of face partialisation and stabilisation through rock bolts: top heading-bench excavation on the left and side drift excavation on the right (after Bernhard Maidl, Markus Thewes, Ulrich Maidl 2013) ... 22 Figure 23. Reinforcement and protection techniques of the advance core (from Lunardi 2008) ... 22 Figure 24. Optical targets (left) and tape distometer (right); courtesy of Sisgeo ... 24 Figure 25. Details of optical targets installation on the primary lining ... 24 Figure 26. Multibase (a) and incremental extensometer (b) ... 25 Figure 27. Strain gauges on the flanges of a steel rib (a), load cell placed between the upper arch and the lower part of the coupled steel ribs (b), load cell under the foot of the steel support, pressure cells before installation in the final lining (d) (Courtesy of SISGEO) ... 26 Figure 28. Longitudinal and transversal layout of fibre optic cable in Thameslink tunnel (after Soga et al. 2008) ... 27 Figure 29. Stability numbers for a preliminary evaluation of face stability in cohesive soils (modified after Broere 2001) ... 30 Figure 30. Plain strain continuum model and distributions of displacements, radial stresses, normal forces and bending moments (after Duddeck & Erdmann 1983) ... 31 Figure 31. Convergence-confinement method with characteristic curves (after Oreste 2009) ... 32 Figure 32. Approaches for the contribution of the ground to load-bearing (after Bernhard Maidl, Markus Thewes, Ulrich Maidl 2013) ... 33 Figure 33. Example of bedded-beam-spring model for a shallow tunnel (H=4R), after (ITA 1988) ... 33 Figure 34. Failure mechanism for limit equilibrium analysis of face stability (left, after Broere 2001) and scheme for calculation of radial bolts (right, from www.rocscience.com) ... 34 Figure 35. 3D arching effects occurring around underground constructions (after Potts 2002) ... 35
Figure 36. Horn failure mechanism and forces involved in the calculation of
the safety factor ... 45
Figure 37. Silo’s theory and scheme for the calculation of face stability with LEM in the case of face reinforcements and unsupported span ... 47
Figure 38. FEM model of the calculation example ... 64
Figure 39. Schematic representation of the excavation sequence ... 64
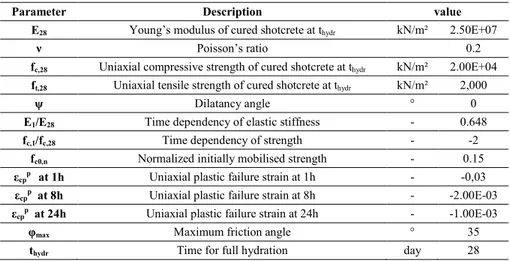
Figure 40. Time dependency of shotcrete stiffness and strength ... 66
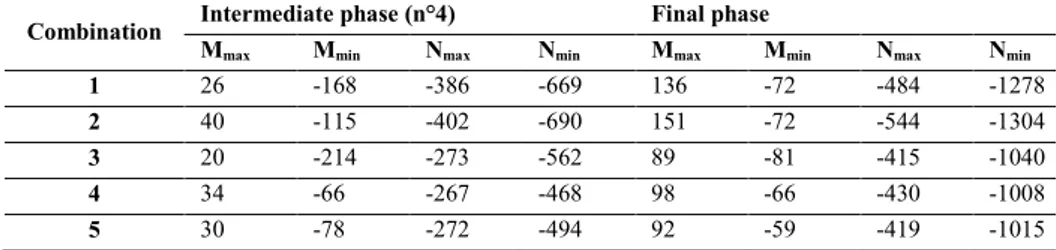
Figure 41. Bending moments from phase 4 (outer lining) ... 69
Figure 42. Normal forces from phase 4 (outer lining) ... 70
Figure 43. Bending moments from the final phase (outer lining) ... 71
Figure 44. Normal forces from the final phase (outer lining) ... 72
Figure 45. Bending moments from phase 4 (central support) ... 73
Figure 46. Normal forces from phase 4 (central support) ... 73
Figure 47. M-N check for the outer lining (phase 4) ... 75
Figure 48. M-N check for the central support (phase 4) ... 75
Figure 49. M-N check for the outer lining (final phase) ... 76
Figure 50. Plasticity distribution in both the soil and shotcrete (modelled with an advanced constitutive model) ... 77
Figure 51. Factors of safety for reinforced and unreinforced excavation faces from LEM calculations ... 82
Figure 52. Model dimensions, excavation cross-section and FEM mesh .... 84
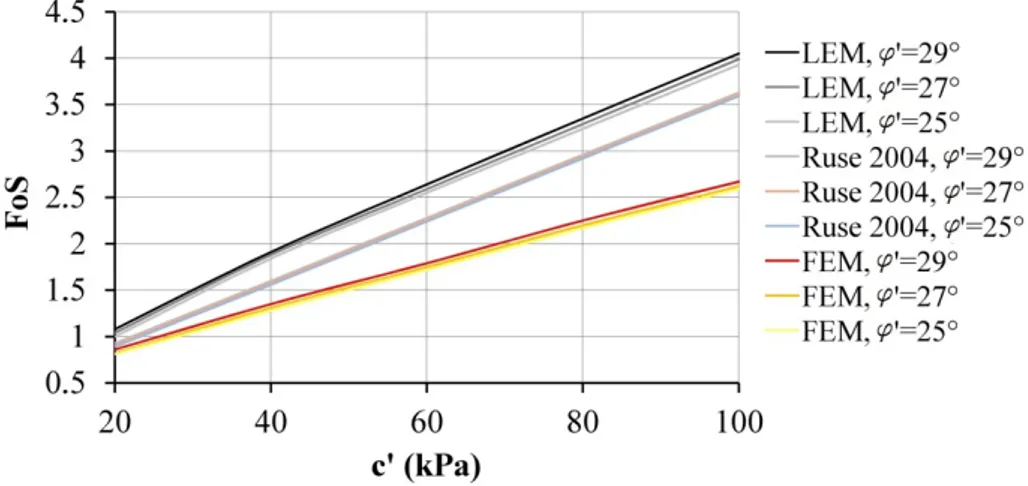
Figure 53. Factors of safety from LEM analyses, Ruse’s formula and FEM analyses for unreinforced excavation faces ... 85
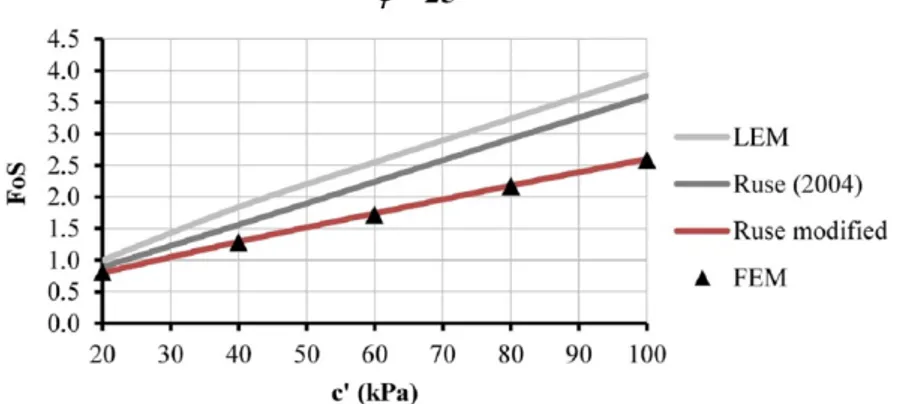
Figure 54. Comparison between the FoS obtained from LEM, Ruse’s equation, FEM and equation 12 ... 86
Figure 55. Displacements contours at failure (left) and plastic points (right) for the case φ'=25° and c’=40kPa, tensile stresses allowed ... 88
Figure 56. Displacements contours at failure (left) and plastic points (right) for the case φ'=25° and c’=40kPa, tensile stresses not allowed ... 88
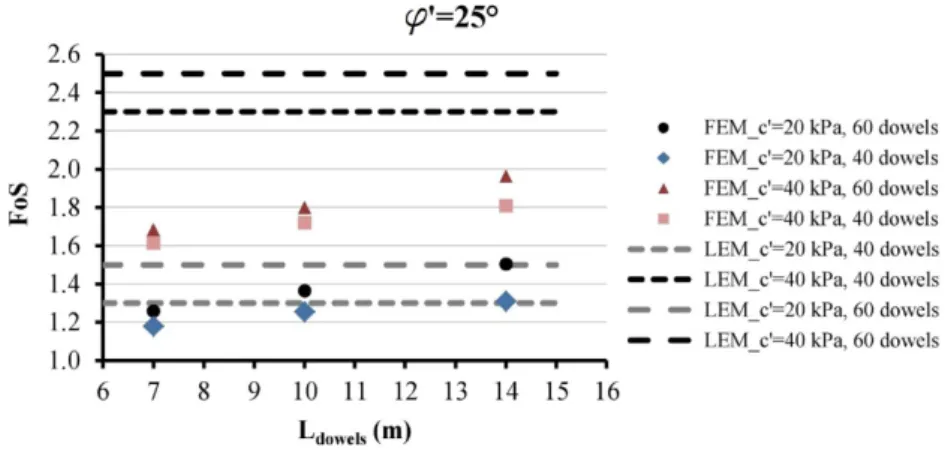
Figure 57. Factors of safety for a reinforced excavation face (comparison between FEM and LEM) according to different reinforcement lengths and densities ... 90
Figure 60. Extrusion profiles for reinforced and unreinforced excavation face; the curves representing reinforced faces refer to the case of φ'=25° and c’=40 kPa (upper graph) or c’=60kPa (lower graph) ... 94 Figure 61. Maximum face extrusion versus dowels length ... 95 Figure 62. Extrusion and surface settlements for an unreinforced (left and a reinforced excavation face (HSS model) ... 96 Figure 63. Geological map of the area (modified from Monaco et al., 1996), tunnel dimensions and road longitudinal profile (natural tunnels in yellow) ... 100 Figure 64. Grain size distribution curves ... 101 Figure 65. Casagrande plasticity chart ... 101 Figure 66. Tunnel face surveys (courtesy of Dott. Pasqualino Notaro). .... 102 Figure 67. Three-dimensional scheme of temporary and final lining (left); details of the temporary support (right) ... 103 Figure 68. Drainage system and umbrellas of drainage pipes ... 104 Figure 69. Failure envelope from drained triaxial tests on the invariants plane ... 105 Figure 70. Determination of E50,ref, Eoed,ref and stress dependency of the two
moduli ... 108 Figure 71. Deformability from pressuremeter tests carried out in the Trubi formation ... 109 Figure 72. Initial stress state from pressuremeter tests: OCR on the left and k0 on the right (from pressuremeter, CRS and Oedometric tests) ... 110
Figure 73. Calibration of the HSS parameters through the simulation of a triaxial test (Trigoni, z=40 m) ... 111 Figure 74. Calibration of the HSS parameters through the simulation of a CRS test (Trigoni, z=40 m) ... 111 Figure 75. Calibration of the HSS parameters through the simulation of an oedometric test (Limbia, z=19 m) ... 112 Figure 76. Calibration of the HSS parameters through the simulation of a triaxial test (Limbia, z=19 m) ... 112 Figure 77. Calibration of the HSS parameters through the simulation of a triaxial test (Limbia, z=8.5 m) ... 113 Figure 78. Calibration of the HSS parameters through the simulation of an oedometric test (Gerace, z=22 m) ... 113 Figure 79. Calibration of the HSS parameters through the simulation of an oedometric test (Gerace, z=19 m) ... 114
Figure 80. Calibration of the HSS parameters through the simulation of an oedometric test (Gerace, z=41 m) ... 114 Figure 81. Calibration of the HSS parameters through the simulation of an oedometric test (Gerace, z=26 m) ... 115 Figure 82. Calibration of the HSS parameters through the simulation of a CRS test (Gerace, z=22 m) ... 115 Figure 83. Calibration of the HSS parameters through the simulation of oedometric tests (Gerace) ... 116 Figure 84. Calibration of the HSS parameters through the simulation of a triaxial test (Limbia, z=41 m) ... 116 Figure 85. Calibration of the HSS parameters through the simulation of a triaxial test (Gerace, z=19 m) ... 117 Figure 86. Calibration of the HSS parameters through the simulation of a triaxial test (Gerace, z=22 m) ... 117 Figure 87. FEM model for the pressuremeter test simulation ... 118 Figure 88. Typical pressuremeter curves on the left, from Clarke (1994) (MPM: Ménard Pressuremeter test, SBP: Self-Bored pressuremeter, PIP: Pushed-In Pressuremeter). Influence of the soil disturbance on the shape of the pressuremeter curves (right, from S. Amar, B.G. Clarke, M.P. Gambin (1991)): 1. Ideal curve, 2.oversized borehole, 3 .too small borehole ... 119 Figure 89. Pressuremeter curve fitting through numerical simulation of pressuremeter tests with both loading and unloading curve ... 120 Figure 90. Pressuremeter curve fitting through numerical simulation of pressuremeter tests with only loading curve ... 122 Figure 91. Cross-hole test and void ratio ... 124 Figure 92. FEM model (left); considered section (center); points location (right) ... 125 Figure 93. Stress paths ... 126 Figure 94. Geological profile of the Trigoni tunnel (Northern carriageway) ... 129 Figure 95. 3D FEM mesh of the model generated for the first stretch (left); details of preliminary lining and invert arc (right) ... 130
Figure 99. Trigoni tunnel, model 1: a) Measured and calculated lining displacements and forces; b) plot of calculated values at the sidewalls; c) plot of calculated values at the crown (first tunnel stretch, first excavated tube) ... 138 Figure 100. Trigoni tunnel, model 2: a) Measured and calculated lining displacements and forces; b) plot of calculated values at the sidewalls; c) plot of calculated values at the crown (second tunnel stretch, first excavated tube) ... 139 Figure 101. Load cells: measurements and FEM results ... 140 Figure 102. Subsidence monitoring section at ch 12180: measured and calculated settlements. Photo from Google Earth ... 141 Figure 103. Subsidence monitoring section at ch 12580 and 12540: measured and calculated settlements. Photo from Google Earth ... 142 Figure 104. Incremental extensometer modelled as embedded pile (left); comparison between measured and computed vertical deformations (centre) and vertical displacements (vertical incremental extensometer at ch 15+140) ... 144 Figure 105. Numerical simulation of a reinforced excavation face instrumented with horizontal extensometer: calculation scheme and comparison between monitoring data and numerical results ... 146 Figure 106. 3D and 2D model used for calibrating the stress relaxation factors ... 147 Figure 107. Comparison between the surface settlements obtained from the 3D and 2D model ... 148 Figure 108. Comparison between axial forces from the 3D and 2D model (first tunnel) ... 149 Figure 109. Comparison between axial forces from the 3D and 2D model (second tunnel) ... 149 Figure 110. Comparison between vertical displacements from the 3D and 2D model (first tunnel arrival) ... 150 Figure 111. Comparison between vertical displacements from the 3D and 2D model (first tunnel completion) ... 150 Figure 112. Comparison between vertical displacements from the 3D and 2D model (second tunnel arrival) ... 151 Figure 113. Comparison between vertical displacements from the 3D and 2D model (second tunnel completion) ... 151 Figure 114. Geological profile of the Pergola tunnel (Northern carriageway) ... 152
Figure 115. 3D FEM mesh of the model generated for the first stretch (left) and second stretch (right) ... 154 Figure 116. Pergola tunnel: settlements of the temporary lining - measurements ... 156 Figure 117. Pergola tunnel: lateral convergences of the temporary lining - measurements ... 156 Figure 118. Pergola tunnel: normal forces from strain gauge measurements (compression is negative) ... 157 Figure 119. Pergola tunnel, model 1: a) Measured and calculated lining displacements and forces; b) plot of calculated values at the sidewalls; c) plot of calculated values at the crown (first tunnel stretch, first excavated tube) ... 158 Figure 120. Pergola tunnel, model 2: a) Measured and calculated lining displacements and forces; b) plot of calculated values at the sidewalls; c) plot of calculated values at the crown (second tunnel stretch, first excavated tube) ... 160 Figure 121. Subsidence monitoring sections at ch 14260 and 14270: measured and calculated settlements. Photo from Google Earth ... 161 Figure 122. Modelling of the horizontal incremental extensometer through an embedded pile ... 162 Figure 123. Comparison between measured and computed horizontal displacements (horizontal incremental extensometer at ch 14+520); the dashed lines represent the FEM results ... 163 Figure 124. Graphical representation of a return mapping algorithm (modified after Potts 2002) ... 182 Figure 125. Scheme of the global and local iteration procedures ... 183 Figure 126. Normal load control (left) and arc-length control (right), from Brinkgreve et al. (2014) ... 185 Figure 127. Hyperbolic relation between deviatoric stress and axial strain in drained triaxial loading and unloading, from Brinkgreve et al. (2014) ... 187 Figure 128. Delimitation of the areas associated with shear hardening, volumetric hardening, combined hardening and elastic behaviour in the q-p’
Figure 131. Definition of the cap yield surface and initial stress state for the case OCR>1 ... 193 Figure 132. Influence of the deviatoric modulus on a drained triaxial test 194 Figure 133. Influence of the oedometric modulus on a drained triaxial test ... 195 Figure 134. Influence of the cohesion on a drained triaxial test ... 195 Figure 135. Influence of the stress dependency coefficient on a drained triaxial test ... 196 Figure 136. Influence of the failure ratio on a drained triaxial test ... 196 Figure 137. Influence of the deviatoric modulus on an oedometric test .... 197 Figure 138. Influence of the oedometric modulus on an oedometric test .. 197 Figure 139. Influence of the unloading-reloading modulus on an oedometric test ... 198 Figure 140. Influence of the cohesion on an oedometric test ... 198 Figure 141. Influence of the stress dependency coefficient on an oedometric test ... 199 Figure 142. Typical soil stiffness degradation curve with strain ranges characterising the most common geotechnical problems or soil tests (after Obrzud & Eng 2010) ... 200 Figure 143. Small strain behaviour cut-off (after Benz 2007) ... 202 Figure 144. Behaviour of the HSS model under triaxial loading/unloading (from (Brinkgreve et al. 2013) ... 202 Figure 145. Location of nodes and stress points used for the sensitivity analyses ... 204 Figure 146. Sensitivity analysis (HSS parameters – vertical displacement, node A) ... 206 Figure 147. Sensitivity analysis (HSS parameters – vertical displacement, node B) ... 206 Figure 148. Sensitivity analysis (HSS parameters –horizontal displacement, node C) ... 207 Figure 149. Sensitivity analysis (HSS parameters – vertical displacement, node D) ... 207 Figure 150. Sensitivity analysis (HSS parameters – vertical stress of point K) ... 208 Figure 151. Sensitivity analysis (HSS parameters –horizontal stress of point L) ... 208 Figure 152. Sensitivity analysis (Lining stiffness – vertical displacement of node A) ... 209
Figure 153. Sensitivity analysis (Lining stiffness – vertical displacement of node B) ... 209 Figure 154. Sensitivity analysis (Lining stiffness – vertical displacement of node C) ... 210 Figure 155. Sensitivity analysis (Lining stiffness – vertical displacement of node D) ... 210 Figure 156. Sensitivity analysis (Lining stiffness – vertical stress of point K) ... 211 Figure 157. Sensitivity analysis (Lining stiffness –horizontal stress of point L) ... 211 Figure 158. Subsidence for different sets of stress relaxation factors ... 212
List of Tables
Table 1. General indications about the suitability of different conventional
excavation techniques according to the matrix UCS (from Lunardi 2000) ... 8
Table 2. Methods for monitoring of convergence (from Kolymbas 2005) .. 23
Table 3. Summary of Eurocodes design approaches. ... 37
Table 4. Traditional methods used for geotechnical stability analysis: main features (from Sloan 2013) ... 43
Table 5. Soil parameters ... 65
Table 6. Material parameters adopted for the non-linear shotcrete model. .. 66
Table 7. Calculation phases performed ... 68
Table 8. Design calculations performed ... 68
Table 9. Maximum and minimum values of the lining forces from phase 4 and from the final phase (outer lining) ... 72
Table 10. Maximum and minimum values of the lining forces from phase 4 (central support) ... 74
Table 11. Characteristics of the fibreglass reinforcement system. ... 82
Table 12. Analysed cases for an unreinforced excavation face... 85
Table 13. Factors of safety for the case of unreinforced face from different analysis methods (case φ'=25°) ... 87
Table 14. Factors of safety for the case of unreinforced face from different analysis methods (case φ'=27°) ... 87
Table 15. Factors of safety for the case of unreinforced face from different analysis methods (case φ'=29°) ... 87
Table 16. Analysed cases for a reinforced excavation face... 89
Table 17. Properties of the fibreglass bars considered in the FEM calculations ... 89
Table 18. Material properties for the HSS model. ... 96
Table 19. Maximum surface settlements and face extrusion (HSS model) . 97 Table 20. Suggested soil parameters according to soil type and plasticity (after Soos, 2001) ... 106
Table 21. Analytical expressions for the coefficient function f(e) and reference values for the coefficient S ... 123
Table 22. Soil parameters used for the stress path analysis ... 126
Table 23. Steel shotcrete homogenization ... 132
Table 25. Simulation of the excavation sequence through the 2D model and
stress relaxation factors adopted for each phase ... 148
Table 26. Mathematical formulation of yield surface, plastic potential and hardening law for shear and compression hardening ... 190
Table 27. Input parameters of the HS model ... 193
Table 28. Hyperbolic law for the secant shear modulus ... 200
Table 29. Phase description and stress relaxation factor for the reference analysis ... 204
Table 30. Criteria adopted for the sensitivity analyses ... 204
Table 31. Soil parameters for the reference analysis ... 205
Table 32. Lining stiffness parameters for the reference analysis ... 205
Table 33. Calculated values of the maximum displacements and axial forces ... 212
Introduction
Traditionally excavated tunnels are underground openings built without the use of tunnelling boring machines. In these cases, the human intervention plays a major role and therefore, the workmanship skills and experience can have a significant influence on the construction process. The tunnel supporting techniques involve mainly sprayed concrete, steel ribs and grouted bolts. A further support made of reinforced or unreinforced concrete is usually cast at a certain distance from the tunnel face. Unlike mechanised tunnelling, traditional excavation allows for greater flexibility in the choice of structural supports and section geometries. The possibility to carry out face surveys while advancing leads to a deeper knowledge of the local geology and geomechanical properties. A greater awareness of the mechanical behaviour of the excavated ground can also be achieved by monitoring stresses and deformations of the tunnel support and the surrounding mass. The flexibility in defining the supporting techniques and the excavation sequence allows for on-going design evaluations and modifications, which might result in actual improvements only when based on an extensive monitoring and accurate back-analyses.
Regarding shallow tunnels (overburden lower than 3-5 tunnel diameters), they often involve soils or weathered rocks. This aspect raises the problem of guaranteeing face stability and workmanship safety, avoiding excessive deformations or the activation of failure mechanisms that could potentially cause important subsidence phenomena and building damages. The three-dimensionality of the problem and the frequent need to design face reinforcements require complex numerical calculations.
Nowadays, the development of user-friendly numerical codes and the growing computational capacity make possible to simulate complex geometries and excavation sequences both in two and three dimensions. Therefore, stress-deformation calculations, as well as safety analyses, can be easily performed by tunnel engineers both in the design phase and when updating the original design. Nevertheless, without a proper model parameter calibration carried out through laboratory and in situ tests, even the most accurate model would fail in providing reliable predictions. By back-analysing monitoring data, it is theoretically possible to reach a further refinement of the ground geotechnical properties.
Regarding numerical methods applied to tunnel construction analyses, no standard code currently regulates and define the most suitable procedure to ensure a safe design. Therefore, geotechnical engineers have to refer to other codes, defined for above structures or conventional geotechnical structures such as Eurocodes.
Given the previously mentioned issues, this thesis focuses on three principal aspects regarding traditionally excavated shallow tunnel:
• Eurocodes applicability to a numerically-based design of shallow tunnels;
• stability of reinforced and unreinforced excavation faces;
• parameter calibration and numerical validation through comparison with monitoring data concerning a specific case study.
The monitoring data considered for the present study refer to construction works of a new highway in Southern Italy.
All the previously mentioned issues were tackled using both 2D and 3D numerical calculations in combination with traditional or advanced constitutive models, depending on the final goal and on the specific problem to be analysed.
A comprehensive study of the state of the art regarding numerical analyses of underground constructions provided the basis for a more conscious definition of the numerical models. The literature review is included in the first two chapters.
Chapter 1 provides an overview of traditional excavation techniques and support measures.
Chapter 2 focuses on the design and verification methods commonly used in tunnelling with particular attention to numerical models. This part of the literature review covers each of the main topics that are analysed in the following chapters (face stability, Eurocodes based design and numerical predictions).
Chapter 3 deals with the application of Eurocodes to the design of shallow tunnels. A benchmark example, analysed through a 2D numerical model, enables some specific considerations.
Chapter 6 shows the model validation through field data, which are compared to numerical results.
Chapter 1.
The
construction
of
shallow
tunnels through traditional techniques
The need to improve the transport network in increasingly congested urban areas, as well as the demand of new highway and motorway networks in hilly areas, often requires the construction of shallow tunnels. Despite tunnelling boring machines have become more flexible and reliable in the recent years, traditional excavation techniques are still widely used. In some cases, if the tunnel cover is thin (lower than 1-2 tunnel diameters), it can be built with the cut and cover method, which consists of trench excavation, tunnel construction and soil covering of the excavated tunnel. However, only mined tunnels will be considered in the following chapters.
1.1. Excavation techniques
Tunnel design includes, besides the definition of the supporting and reinforcement measures, the choice of the most appropriate excavation method and sequence. This choice is related to the characteristics of the tunnel itself as well as to the those of the surrounding environment (presence of pre-existing buildings and infrastructures, geomechanical and hydrological conditions). Irrespective of the context and the specific project, tunnel designers have to guarantee field safety conditions during both excavation and support installation. Regarding the excavation methods, it is often distinguished between traditional heading and mechanised heading. Both Kolymbas (2005) and Lunardi (2000) presented a comprehensive overview of the available excavation systems together with a discussion of the main factors involved in the selection of a particular method.
Mechanised tunnelling usually refers to the use of big machines allowing for a continuous and industrialised excavation process and therefore capable of reaching the fastest advance rates (up to 20 m/day).
reinforcement measures in conventional tunnelling will be addressed in the next paragraph.
The technique of drill and blast involves the detonation of explosive material placed in horizontal boreholes drilled by percussion or rotary-percussive means, according to a particular blasting sequence.
Figure 1. Drill and blast cycle (from Heiniö 1999)
When drill and blast is uneconomic or is not possible due to the ground mechanical properties or to the proximity to urban areas, the excavation may be carried out through mechanical or hydraulic tools, such as crawler excavators equipped with shovels, rippers, hammers, rotary cutters or roadheaders.
Figure 2. Excavator with attachment for multiple tasks (from Tatiya 2005)
Figure 5. Crawler excavator equipped with hammer
Figure 6. Crawler excavator equipped with ripper
Figure 7. Roadheader
Wheel or crawler loaders and dumper are subsequently used to transfer the excavated material outside of the tunnel.
Figure 8. Wheeled loader and dumper.
The choice of the excavation tool or technique is strictly related to the ground properties and to the presence of pre-existing structures in the surroundings of the underground opening. Mechanical shovels are usually suitable for soils or weak rocks, whereas rippers can be used when hard rock inclusions are encountered and when RMR varies from 30 to 60 or P-waves vary from 1 to 2 km/s (Kolymbas 2005). Roadheaders and hammers can be used for moderate rock strengths, but their efficiency decreases with the increase of rock mass strength.
Table 1. General indications about the suitability of different conventional excavation techniques according to the matrix UCS (from Lunardi 2000)
As well as traditional tunnelling, also mechanised tunnelling involves excavation, mucking and support installation but the adopted tunnel machines can deal with all these three phases almost simultaneously, speeding up the construction process and requiring less workmanship. The choice between conventional and mechanised heading depends on several factors: ground conditions, tunnel length, shape and dimensions of
• possibility to excavate according to various shapes of the cross section;
• low installation costs.
On the other hand, traditional tunnelling usually requires workmanship operating close to the excavation face, advance rates do not exceed 5 meters/day and installation of the final support (after the primary lining) is often required.
However, despite the remarkable technological development regarding tunnel boring machines and the availability of very flexible and reliable TBMs, traditional excavation is still preferred when highly varying ground conditions are expected, for short tunnels and for tunnels with variable cross section shape.
The higher flexibility and adaptability to different ground types of conventional tunnelling lies in the possibility of changing excavation tool as well as other design characteristics such as:
• the strength and stiffness of the cavity support (shotcrete type and thickness, use of steel ribs or lattice girders, steel profile, ribs spacing);
• the length of the unsupported span;
• the primary support closure to form a closed ring (by installing providing the primary or temporary support with an invert);
• the distance of casting of the final concrete invert from the tunnel face;
• the adoption of partialised or full face section;
• the magnitude of face reinforcement (fibreglass bars, pipe umbrella, jet grouting, and so forth);
• radial reinforcement (bolts).
These variables can be defined and adjusted according to the encountered ground conditions and according to the deformation behaviour monitored while excavating (observational design method).
1.2. Supporting
and
reinforcement
measures
in
conventional tunnelling
Supporting and reinforcement techniques aim at guaranteeing the stability of the excavation face and the cavity during the construction works and after
the excavation is completed. Figure 9 depicts the main supporting and reinforcement techniques employed in conventional tunnelling.
Figure 9. Support measures in conventional tunnelling (from Hoek 2001 and Lunardi 2000)
Supporting methods can be classified as temporary, primary or final linings. Temporary and primary supports are supposed to guarantee the tunnel stability while completing the construction works, whereas final lining aims at guaranteeing the long-term stability of the cavity. Temporary lining refers to those supports which are supposed to be removed before the tunnel completion (such as temporary inverts or central walls in partialised
Thanks to the ground deformation and consequent stress relaxation occurring before and after lining installation (pre-convergence, Figure 10), the primary support is never loaded with the full initial stress the ground was subjected to. In fact, ground deformation implies the occurrence, in the zone surrounding the cavity, of the phenomenon called arching. It can be described as the stress redistribution caused by the tunnel excavation thanks to which the ground itself act as a cavity support.
Figure 10. Tunnel deformation response (from Lunardi 2005)
Shotcrete, which is basically concrete projected at high velocity on the tunnel walls, is the main element constituting the primary or temporary lining. Its mechanical properties are similar as those of normal concrete. It is particularly suitable for tunnel construction because it can fit any shape of surface undergoing displacement and compaction at the same time. Furthermore, thanks to its deformability at early stages, it allows for ground deformation and stress redistribution.
As depicted in Figure 11, shotcrete can be reinforced with lattice girders or steel arches such as open steel profiles (IPN, HE, IPE). However, one of the major structural problems of these profiles is buckling (Figure 12, a). This is the reason why, in recent years, tubular hollow steel profiles (Figure 12, b) were tested and installed in some construction sites (Zenti & Perlo 2015). These closed profiles, having the same moment of inertia in any direction, are more efficient in case of eccentric loads acting along a different axis. Both laboratory and in-situ tests proved the better performances of circular profiles compared to open profiles with the same cross section area.
Moreover, the concrete filling the hollow profile collaborates to the structural capacity of the section, which can, therefore, be assumed as a composite section. The circular shape also eliminates the shadow effects when projecting the shotcrete caused by the flanges of the open profile (Zenti & Perlo 2015). Recently, a further technological innovation regarding the tubular steel profile allowed to improve the workmanship safety during tunnel construction, by introducing a semi-automatic installation procedure. The new steel rib is provided with automatically unfolding hinges and a special telescopic foot, enabling the arch installation entirely by machinery and avoiding the presence of workers close to the tunnel face (Figure 13).
Figure 11. Sections of both primary and final tunnel support: shotcrete reinforced with lattice girders and cast in place concrete (left), shotcrete reinforced with steel ribs and cast in place concrete (right). Figures from (Hoek et al. 2008)
Figure 12. Case of open profile buckling (a, from Zenti & Perlo 2015), 2 coupled IPN profiles and tubular hollow profile (b, from Zenti & Perlo 2015), comparison between primary lining made of shotcrete reinforced with circular steel profiles on the left and shotcrete reinforced with coupled IPN on the right (c, from
http://www.societaitalianagallerie.it)
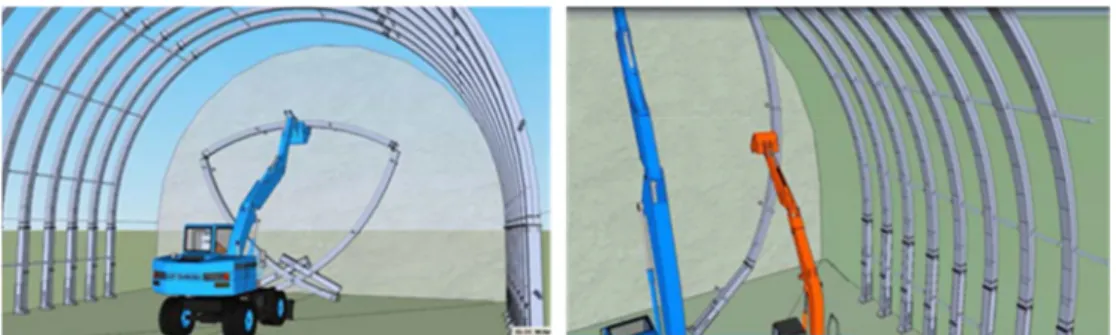
Figure 13. Installation of the semi-automatic tubular steel arch support (from Zenti & Cullaciati 2016)
In some cases, the shotcrete lining, due to significant radial displacement, can exceed the maximum compression deformation (around 1%) and reach failure. When significant convergences are expected (squeezing grounds), and damages to the primary support must be avoided, longitudinal slots in the shotcrete shell can be left open. The slots width can be up to 40 cm. In
this way, the cavity closure will deform only the steel reinforcement of the primary lining. These gaps can also be closed with special yielding joints, which represents predetermined failure points and enable a higher control of the final deformation as well as the redistribution of the ground pressure around the cavity (Figure 14). One of the first yielding element (Figure 15, left) was made of a group of steel tubes, installed with the axis in the circumferential direction (Schubert 1996). Later, some improvements (Figure 15, right) eliminated the problem of buckling affecting the tubes (Schubert & Moritz 1998).
Figure 14. Longitudinal slots in the primary support (from Bernhard Maidl, Markus Thewes, Ulrich Maidl 2013)
Figure 15. Yielding supports (Schubert & Radoncic 2015)
A further support of the ground cavity can be provided through radial anchors, mainly used in rocky or very stiff soils. These reinforcements allow
(active) or left untensioned (passive, activated after cavity convergence starts to occur).
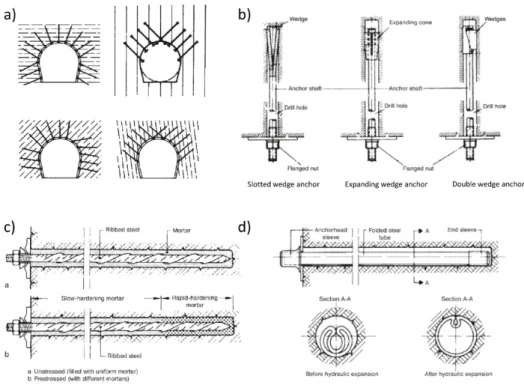
Fully bonded anchors, also called nails, are bars or tubes made of steel or fibreglass bonded to the wall for their whole length. They can, therefore, be used in poor quality rocks. The stress transfer between ground and bar can occur through the cement mortar used for filling the hole or through the tube itself as for Swellex bolts. They work both in shear and in tension and can significantly increase the cohesion of the reinforced material.
Figure 16. Correct arrangement of anchors (a), end anchored bolts (b), grouted anchors (c), Swellex anchors (d); figures from Bernhard Maidl, Markus Thewes, Ulrich Maidl 2013
When the primary lining is an open arch, an important construction detail that allows controlling vertical deformation is the thickening or the reinforcement of the lining foot (Figure 17). This structural detail enables to reduce the lining settlements providing an immediate bearing capacity to the primary support. It is particularly important in shallow tunnels, where limiting subsidence phenomena represents an important issue.
In any case, in soft grounds and urbanised areas, a fast ring closure either through a temporary or a permanent invert is very important for controlling deformations.
Figure 17. Construction detail of the primary support foot: shotcrete reinforced with lattice girder on the left (Bernhard Maidl, Markus Thewes, Ulrich Maidl 2013) and steel rib on the right.
Besides shotcrete or reinforced shotcrete linings, aimed at limiting the convergence of the tunnel cavity, other techniques can be implemented to provide further stability and limit ground deformations even before the face arrival.
Especially when the tunnel is excavated full face or with large unsupported spans, the surrounding ground may require some improvement to guarantee stability. When the final goal is to reinforce the tunnel face, limiting extrusion and pre-convergenge (Figure 10) and preserving the integrity of the advance core, the most common techniques implemented in traditional tunnelling are
• soil nailing; • freezing; • jet/grouting;
the excavation profile in order to improve the stress redistribution capacity around the cavity. They remain unstressed until soil deformation occurs, causing the tensile stresses to be transferred to the nail through the lateral borehole surface. The properties that make fibreglass nails suitable for tunnel core reinforcement are:
• high tension strength; • low weight;
• high fragility (easy to break during excavation).
This technique is mostly used in cohesive or semi-cohesive soils.
Recently, a new kind of fibreglass pipe characterised by an external corrugated profile was tested, developed and successfully used in tunnel construction works. The further improvement in this technology consisted in equipping the bar with an external textile sheath aimed at containing the injected cement grout (Figure 18, e). Furthermore, the bar was also provided with a coaxial drain designed to reduce the pore water pressures occurring at the tunnel face (Pressure Element Reinforcement Ground or PERGround®, Elas Geotecnica S.r.L.).
Figure 18. Drilling machine and reinforcement scheme (a, b; from Lunardi 2000); bar lateral surface (c), new corrugated profile (d) and P.E.R. Ground (e), from Zenti et al. 2012).
In granular or pseudo-cohesive soils, jet grouting is preferred to reinforce the advance core and to create a reinforced shell around the tunnel cavity (Figure 19). The only treatment used for horizontal injections in tunnels is normally the monofluid system, which consists of the injection, at high pressure (300 to 600 bar), of the cement suspension only. The high
pressures cause hydrofracturing (claquage) in the soil and create volumes of improved soil having the shape of columns. When very coarse soil is treated, the strength properties of the improved material are comparable to those of concrete. Injections can also be performed from the surface (for shallow tunnels) or from a pilot tunnel.
Figure 19. Longitudinal profile of the tunnel with jet-grouting reinforcements (left), detail of the columns on the tunnel crown (right); figures from Lunardi (2000)
In loose ground below the groundwater table, ground freezing is a convenient technique to temporary stabilise the ground surrounding the excavation. In contrast with jet grouting, it only alters the hydraulic conditions during the construction period.
Another application, mostly used to reinforce the tunnel roof in fractured rock or stiff soil is the so-called forepoling (Figure 20). It consists in the drilling, ahead of the face, of an umbrella of steel tubes, which are subsequently injected with grout. However, contrary to the reinforcement methods previously seen, forepoling does not contribute to arch effects because the structural elements are not connected to each other and therefore there is no collaboration between them.
Figure 20. Forepoling with steel tubes (figures from www.robit.fi)
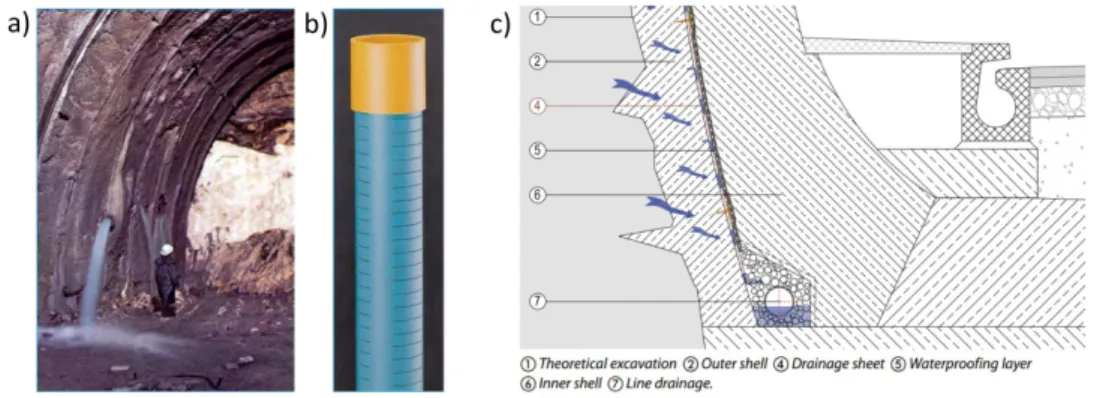
To avoid water inflow into the tunnel during the excavation phase, umbrellas of drainage pipes are usually installed, especially when the tunnel is below the water table. The slotted tubes are launched ahead of the face and create a zone of higher permeability around the tunnel to be excavated (Figure 21 a, b). This technique, when drained conditions take place, also has a positive effect on the mechanical properties of the surrounding ground. In fact, lowering the pore water pressures means increasing the effective stresses too. The drainage should be extended ahead of the tunnel face as deep as possible so that construction works are not interrupted too often. The drainage pipes consist of slotted hard PVC tubes installed into 35 to 100 mm diameter holes.
Regarding the final hydraulic conditions, the tunnel can be either drained (Figure 21, c) or sealed (waterproofed). An intermediate solution consisting in limiting the pressure to a prescribed value (through special valves) is also possible. This solution might be the best option when on the one hand it is necessary to reduce the disturbance to the surrounding soil and aquifer, but on the other hand, it would not be economically convenient to design the tunnel support to bear the full water pressure.
Figure 21. Drainage pipe bearing water (a) and slotted tube detail (b), from Lunardi 2000; detail of the final drainage on the tunnel sidewall (c), from www.cosella-dorken.com
1.3. Partialised vs. full face excavation
Conventional tunnelling allows the designer to choose between partial and full face excavation. However, it is largely debated, among tunnelling experts, whether tunnels should be driven full face or partialising the excavation face and which is the most suitable and economical solution with respect to different ground conditions. Furthermore, this topic is commonly associated with different construction methods, namely A.DE.CO-RS (acronym for Analysis of COntrolled Deformation in Rocks and Soils) and NATM (New Austrian Tunnelling Method).
The NATM, developed between the fifties and the sixties from the Austrian tunnelling specialists Rabcewicz, Pacher, Müller-Salzburg, entails that the tunnel is sequentially excavated and supported and the excavation face is partialised (Figure 22). The excavation sequences can be adapted to different ground conditions. The primary support is provided by shotcrete reinforced with fibres, welded-wire meshes or steel arches. Soil nails can be additionally used to improve the arching effect around the tunnel cavity. The fundamental principles are:
The exploitation of the load-bearing ring formed by the ground around the opening and the systematic measurements, leading to a construction process tailored to specific geotechnical conditions are, therefore, the pillars of NATM.
The ADECO-RS approach, developed more recently (1980s-1990s) from Lunardi, introduced some innovations. The philosophy behind this method is to act not only on the deformations occurring after the arrival of the advance face (namely the so-called convergence) but also on the pre-convergence and extrusion phenomena. Acting on these portions of the total deformation entails the adoption of reinforcement techniques aimed at improving or protecting the advance core (Figure 23), which represents the ground volume ahead of the face.
Unfortunately, since the number of the projects where both construction methods were used under similar conditions is low, it is very difficult to compare them through field data. However, it is possible to run numerical calculations as well as to make some general considerations aimed at comparing the two methods.
Marcher & Jiřičný (2005) carried out 3D numerical analyses of tunnel originally designed the NATM method, also with a plausible excavation sequence according to the ADECO RS approach. By comparing the results regarding crown settlements and subsidence, it turned out that the two methods yield comparable results, at least for the considered range of ground parameters. According to the same authors, if on the one hand the ADECO RS approach enables a faster and industrialised full face excavation, on the other hand it entails higher costs due to the use of face reinforcements and stiffer supports. However, in markedly poor geotechnical conditions, the advantages of the ADECO RS method can potentially increase. In fact, in these cases, preconfinement of the advance face, as well as the possibility of rapidly closing the arch supporting the cavity, can significantly contribute to minimize the deformations. This aspect could make the difference in shallow tunnels involving soils or weak rocks, especially in urban areas where surface settlements have to be minimised.
The minimization of displacements can also be pursued through the NATM by further partializing the advance face and adopting a temporary closure of the partial section (i.e. temporary invert). However, this method would increase the construction time, reducing the design cost-effectiveness.
Figure 22. Examples of face partialisation and stabilisation through rock bolts: top heading-bench excavation on the left and side drift excavation on the right (after Bernhard Maidl, Markus Thewes, Ulrich Maidl 2013)
1.4. Monitoring devices and techniques
In conventional tunnelling, field monitoring plays an important role. In fact, it is not only used for checking the goodness of the design but also for updating it whenever some adjustments of cavity supports, reinforcements or construction sequence are required. When the monitoring data are carefully back-analysed, they enable a more accurate definition of the geotechnical parameters and therefore an increase in the knowledge of the ground mechanical behaviour. Furthermore, monitoring also allows an early detection of unforeseen conditions and, when observation periods are sufficiently extended, the investigation of the long-term behaviour. If lining stress state is directly measured or back-calculate from deformation or displacement measurements, an evaluation of the structural safety is also possible.
The measurements normally carried out are:
- displacements of 5 points of the primary lining in 3 dimensions; - displacements occurring in the surrounding ground;
- stress state on the primary and final lining; - stress state on the anchors;
- tilt and cracks opening in surface structures (for shallow tunnels in urbanised areas)
Lining displacements, representing the standard monitoring, are usually measured through optical surveying. Monitoring sections can be 10-30 meters spaced and are installed at least at 1 m from the excavation face. Measurements are initially acquired every day, whereas the survey interval can be increased when the measured value show a stabilisation trend. Most of the times the measurement points are optical targets mounted on the primary lining (Figure 24, Figure 25). However, the measurement of distances between prescribed points would be more precise if carried out through invar wires or steel tapes (Kolymbas 2005, Table 2).
Figure 24. Optical targets (left) and tape distometer (right); courtesy of Sisgeo
Figure 25. Details of optical targets installation on the primary lining
The monitoring of deformations and displacements in the ground surrounding the tunnel cavity is performed mainly by instrumenting boreholes with extensometers, sliding micrometres, inclinometers and extenso-inclinometers.
Extensometers and sliding micrometres allow for an estimation of deformations along the borehole axis, inclinometers provide horizontal displacements and finally extenso-inclinometers enables both measurements. Extensometers can be incremental, single or multipoint. The axial deformation profile is obtained by measuring the relative displacement of a prescribed point fixed to the ground respect to a reference point. Single
between the different pairs of magnetic rings fixed to an inclinometer tube cemented into the borehole (Figure 26, b).
These instruments can be installed either around the cavity or from the surface. Incremental extensometer horizontally installed into the tunnel core are also used to measure face extrusion and deformation of the advance core along the tunnel axis. In fact, the incremental extensometer tube can be partially demolished enabling extrusion measurements of the core during tunnel advance.
Figure 26. Multibase (a) and incremental extensometer (b)
Tunnels in urban areas also require subsidence measurements, normally carried out through precision levelling and monitoring of pre-existing structures through tiltmeters, DSM level measurement system (Differential Settlement Monitoring), crackmeters and jointmeters
Most of the times, traditional monitoring systems in underground excavations involve only displacements of the tunnel lining and of the surrounding ground at predefined monitoring sections. However, since tunnel design also includes the definition of the structural supports, the verification of the predictions regarding forces and stresses on the lining should also play an important role in the observational method. A
significant number of publications dealing with the interpretation of lining displacements and the consequent rock mass behaviour prediction are already present in the literature (e.g. Schubert et al. 2004, Schubert & Moritz 2011). However, attempts aimed at interpreting and determining stresses or pressure recorded directly on the shotcrete lining are limited (Clayton et al. 2002). Some tools are available in practice to obtain a good estimate of the degree of utilisation of the shotcrete based on measured displacements (Rokahr & Zachow 1997, Hellmich et al. 2001,
www.tunnelmonitor.com). However, the degree of utilisation of the
primary lining can also be investigated through direct methods, such as strain gauges or load cells (Figure 27).
Strain gauges can be welded on steel sets, and they are usually coupled to provide a stress distribution along the section of the steel profile.
Load cells measure the pressure of a fluid within two steel plates and can be embedded in the shotcrete or between shotcrete and surrounding ground. When steel ribs are installed, these cells can also be placed under the ribs foot or between two components of the steel arch. Special load cells enable the measurements of anchors load.
Figure 27. Strain gauges on the flanges of a steel rib (a), load cell placed between the upper arch and the lower part of the coupled steel ribs (b), load cell under the foot of the steel support, pressure cells before installation in the final lining (d) (Courtesy of SISGEO)
The technology of optical fibres (Figure 28) is also spreading rapidly, especially in construction sites that require an extended monitoring. This technology is based on the principle that when the light travels through an
Figure 28. Longitudinal and transversal layout of fibre optic cable in Thameslink tunnel (after Soga et al. 2008)
Chapter 2.
Numerical
modelling
of
traditionally excavated shallow tunnels: state of
the art
Analyses of underground constructions are aimed either at designing the tunnel supports and verifying the deformation behaviour or at validating design models through field data. In any case, both the ground deformations and the stress state on tunnel supports have to be determined or verified. Difficulties in tunnel calculations arise from the fact that the ground is simultaneously loading and load-bearing medium. Moreover, this load is not prescribed from the outside and therefore its characteristics can be determined only through an accurate geological and geotechnical survey. Many are the solutions for evaluating the stress-deformation behaviour associated with this complex soil-structure interaction problem. However, they do not have the same degree of accuracy, and they are not suitable for all the possible geometric and geotechnical conditions.
The following paragraphs include an overview of the calculation methods used in tunnelling. After a very general first paragraph (§2.1), summarising all the principle calculation methods, the focus of the chapter is on numerical modelling of traditionally excavated shallow tunnels. In particular §2.2 deals with a numerically based design according to Eurocodes, §2.3 summarises the state of the art regarding tunnel face stability and §2.4 reviews the previous works involving back-analysis of case studies.
2.1. Calculation methods in tunnelling
First of all, it should be distinguished between tunnels in rock and soft soil. Hard rocks frequently present discontinuities such as faults, joints and bedding planes. Therefore tunnel designers should take them into account when evaluating failure modes and lining loads. Soft rock and stiff soils may also present discontinuities that are likely to influence the overall behaviour, especially if the average stress state is low due to a low degree of
A further distinction has to be made between shallow and deep tunnels. In shallow tunnels, the most likely failure mechanism involves both the ground surrounding the cavity and the ground to be excavated up to the surface. On the contrary, in deep tunnels, the global failure mechanism can be seen instead as an excessive convergence of the cavity. It may happen that the ground surrounding shallow tunnels, especially when characterised by low cohesion and H<D, cannot form a load bearing ring and have a very low stand-up time. In these cases, the tunnel can be driven cut-and-cover, by excavating an open trench first and building the tunnel afterwards.
Peculiarities of shallow tunnels are low confinement stresses, fewer possibilities to form the arching in the ground surrounding the cavity and ground types varying, most of the times, between soils and weak rocks. The analysis of shallow tunnels can be carried out through simplified models, numerical models and physical models. Some of these methods are also used for deep tunnels.
In this paragraph, they are briefly overviewed to show both their advantages and shortcomings. Afterwards, only the state of the art regarding numerical models applied to shallow tunnels will be considered and discussed. The only exception is face stability where simplified models (such as limit equilibrium models), widely used in practice, will be considered for comparison with the results of numerical models.
The principal calculation methods used in tunnel engineering can be classified as follow:
• Empirical methods; • Analytical methods;
• Limit equilibrium methods; • Bedded-beam-spring models; • Numerical models.
2.1.1. Empirical methods
Empirical methods are based on previous experience and field observations. An example is represented by the design charts based on the RMR (Rock Mass Rating) or the Q system. These methods have proven to be successful when used by experienced engineers.
The most common method used to estimate the surface settlement trough, which is based on the Gaussian distribution function (Schmidt 1969, Peck 1969) can also be classified as empirical. Similarly, the simple methods
commonly adopted for a preliminary assessment of face stability, such as those based on the stability ratio (Broms & Bennermark 1967) associated with threshold values deriving from laboratory tests (e.g. centrifuge tests) and field observations are empirical design methods (Figure 29).
Figure 29. Stability numbers for a preliminary evaluation of face stability in cohesive soils (modified after Broere 2001)
2.1.2. Analytical methods
Analytical design tools entail strong initial hypotheses such as the schematization of the tunnel into a two-dimensional model, infinite medium, circular shape, homogeneous ground and elastic or elastoplastic behaviour. These features are usually more suitable for representing deep tunnels. Closed form solutions were derived both for continuum models and for the so-called Convergence-Confinement Method applied through the characteristic curves. An overview of solutions derived for continuum models (Figure 30) was provided by Duddeck & Erdmann (1983).