UNIVERSITY
OF TRENTO
DIPARTIMENTO DI INGEGNERIA E SCIENZA DELL’INFORMAZIONE
38123 Povo – Trento (Italy), Via Sommarive 14
http://www.disi.unitn.it
OPTIMIZATION OF THE DIRECTIVITY OF A MONOPULSE
ANTENNA WITH A SUBARRAY WEIGHTING BY AN HYBRID
DIFFERENTIAL EVOLUTION METHOD
A. Massa, M. Pastorino, and A. Randazzo
January 2011
1
Optimization of the directivity of a monopulse
antenna with a subarray weighting by an hybrid
differential evolution method
Andrea Massa, Matteo Pastorino, and Andrea Randazzo
.
Abstract—The optimization of the directivity of the difference patterns in monopulse array antennas is considered. A subarray
configuration is used in order to avoid the need for the implementation of two separate feed networks. An hybrid differential evolution method is applied to contemporarily determinates the weights of the subarrays and the group membership of the elements. Some numerical results are provided together with a validation comparison with data previously published in the literature.
Index Terms—Array antennas, Monopulse antennas, Evolutionary algorithm, Sum and difference patterns.
I. INTRODUCTION
onopulse antennas require that the sum and difference patterns be generated by the same array configuration. In order to avoid the need for completely independent implementations of two feed networks, several methods have been proposed in which the two patterns are generated starting by partially common feed networks [1]-[3]. In [3], Lopez et al. proposed an interesting approach based on a subarray configuration. One of the excitation sets (for the sum or difference pattern) is assumed to be known (and optimum) and the other set is synthesized by using a subarray configuration to reduce the feeding complexity. The optimization in [3] has been performed by considering a cost function constituted by a single term penalizing a maximum side lobe level (SLL) exceeding a prescribed value. A standard binary genetic algorithm [4] has been used to determinate the weights of the subarrays.
M
A similar approach has been followed by the present authors in [5], where the same synthesis problem has been faced by applying a differential evolution (DE) method [6]-[8], in which hybrid chromosomes (constituted by real and integer genes) are used to avoid the need for coding and decoding the real variables (weights of the subarrays). However, as specified in [5], the considered problem is only one of the possible synthesis problems. In many cases, the antenna design requires the optimization of the directivity of one of the patterns [1][9][10]. Accordingly, in this letter, the approach in [5] is extended to the optimization of the directivity of the difference pattern. The mathematical formulation of the approach is briefly outlined in Section II, whereas Section III reports some numerical results and comparisons.
II. MATHEMATICAL FORMULATION
Let us consider a linear array constituted by 2N elements. The monopulse antenna requires the generation of a sum and a difference patterns. The sum pattern Fs
( )
θ is obtained starting by a set of excitation coefficients, , n = –N,…,−1,1,…,N, which are assumed to be symmetric (i.e., , n = 1,…,N) and fixed. It results [11]s n a s n s n a a− =
( )
∑
(
)
= ⎥⎦ ⎤ ⎢⎣ ⎡ − = N n s n s a n kd F 1 cos 1 2 2 1 cos θ θ , (1) where k is the wavenumber of the propagation medium, d is the distance between the elements and θ defines the angle at which F is calculated with respect to a direction orthogonal to the array. Analogously, the difference pattern is obtained by using a set of antisymmetric excitation coefficients, i.e. d, n = 1,…,N. In this case, the array space factor is given byn d
n a
a− =−
A. Massa is with the Department of Information and Communication Technology, University of Trento, I-38050, Trento, Italy (e-mail: [email protected]).
M. Pasotrino and A. Randazzo are with with the Department of Biophysical and Electronic Engineering, University of Genoa, Via Opera Pia 11A, 16145 Genova, Italy. (phone: +390103532242; fax: +390103532245; e-mail: [email protected], [email protected]).
( )
∑(
)
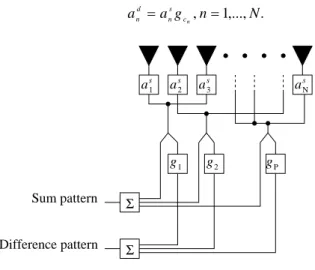
= ⎥⎦ ⎤ ⎢⎣ ⎡ − = N n d n d a n kd F 1 cos 1 2 2 1 sin θ θ . (2) Due to the problem symmetry, only one half of the array is considered in the synthesis problem.The sum and difference patterns are achieved by means of a subarray structure, as shown in Fig. 1. In particular, the elements of the array are grouped in P subarrays. As described in [5], an integer cn (1 ≤ cn ≤ P ) is associated to each element of the array
and denotes the related subarray. In particular, if cn = p, the n-th element belongs to the p-th subarray. Moreover, the excitations
of the difference pattern are obtained by
. (3) ,..., 1 ,n N g a a cn s n d n = = a2s a3s aNs a1s g2 g1 gP Sum pattern Difference pattern Σ Σ
Fig. 1 – Array configuration.
The weights of the subarrays, gp, p = 1,..,P, and the group membership of the antennas must be optimized in order to create a
difference pattern with maximum directivity.
To this end, following the approach in [5], the following fitness function is constructed (directivity)
d d t d d d t d f a B a a A a 2 = (4) where Ad and Bd are N × N matrices whose elements are given by
(
)
(
)
(
)
(
)
(
(
)
)
, ,..., 1 , , 1 c sin c sin , cos 1 2 2 1 sin cos 1 2 2 1 sin N j i kd i j kd i j b kd j kd i a ij ij = − + − − = ⎟ ⎠ ⎞ ⎜ ⎝ ⎛ − ⎟ ⎠ ⎞ ⎜ ⎝ ⎛ − = θ θ (5)being and . It should be stressed that it is possible to add other terms to the fitness function (e.g., terms related to bounds on the SLL or to the width of the central zero.)
x x x sin / c sin =
(
d N d d d = a1,a2,...,a a)
The maximum of the cost function is obtained by applying the DE algorithm, which is a method that belongs to the class of global optimization techniques [6][7]. In the initialization phase of the DE, a population of NP trial solutions is randomly
generated. For the considered problem, the i-th element of the population at the k-th iteration is indicated by uk(i), i =
1,…,NP, and has the following hybrid structure (it includes real and integer variables)
( ) (
)
tN P
k i = g1,...,g ,c1,...,c
u . (6) The population evolves iteratively by means of some "reproduction rules" reported in details in [5]. These rules are governed by some parameters, i.e., a weighting factor F and a probability CR, which control the crossover operator. CR and F should be accurately chosen in order to avoid a premature convergence to local minima or a slow convergence rate. Some criterions for the choice of these parameters, together with a discussion about the main features of the DE, can be found in [6]-[8].
3 Finally, the iterative algorithm stops when the current directivity do not change significantly or if a maximum number of iterations, kmax, is reached.
III. NUMERICAL SIMULATIONS
In order to validate the proposed approach, some numerical simulations have been performed.
In the first simulation, an array of 2N = 40 elements with spacing d = 0.7λ has been considered. The sum pattern excitations , n = 1,…,N, have been obtained by using the Taylor design procedure [11] with
s n
a n = 6 and a side lobe level SLL = −30 dB. The difference pattern has been computed by using the DE algorithm. In particular, the DE/rand/1/exp strategy [6] has been adopted. Following the suggestions given in the literature [5][6], the crossover ratio has been set equal to CR = 0.8, whereas the weighting parameter F has been randomly chosen in the range [0.5, 2]. The population size has been set equal to ten times the number of unknowns, i.e., Np = 10NP. Moreover, the maximum number of generations has been set equal to kmax = 2000. The
number of subarrays has been changed in the range [1, 20].
The behavior of the directivity obtained by the proposed approach versus the number of subarrays is reported in Fig. 2.
18 20 22 24 26 28 30 32 34 1 3 5 7 9 11 13 15 17 19 Directivity Number of subarrays, P
Fig. 2 – Directivity of the difference pattern obtained by using the DE algorithm versus the number of subarrays. Taylor sum pattern (n,¯ = 6 and SLL = −30 dB).
As can be seen, the obtained values of the directivity approximate very well, as far as P grows, the expected maximum directivity value for a difference array of discrete elements [9]. Comparing with the expected value, the obtained directivity is less than 2% for P > 6 and less than 1% for P > 15.
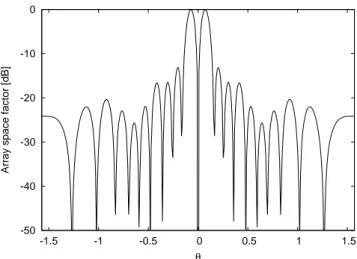
Finally, Fig. 3 shows the behavior of the fitness function versus the number of iterations for the case in which P = 10 (the mean computation time of a single iteration has been equal to 0.17 s on a 1.5 GHz PC with 512MB of RAM) and Fig. 4 reports the corresponding array space factor at the end of the optimization procedure.
20 22 24 26 28 30 32 34 0 500 1000 1500 2000 Fitness function, f Iteration number, k
-50 -40 -30 -20 -10 -1.5 -1 -0.5 0 0.5 1 1.5
Array space factor [dB]
θ
Fig. 4 – Array space factor of the difference pattern for a Taylor sum pattern with n,¯ = 6, SLL = −30 dB, and P = 10.
As a second case, the sum pattern excitations have been obtained by considering a Dolph-Tschebyscheff array with 2N = 20 elements of spacing d = λ/2 and SLL = −20 dB.
The control parameters of the DE algorithm have been set equal to the ones used in the previous simulations. The number of subarrays has been changed in the range [1, 10]. Again, the population size has been set equal to ten times the number of unknowns.
Fig. 5 shows the calculated directivity versus the number of subarrays used in the synthesis procedure. In this case, the best directivity is D = 12.19 [9][12], and the values obtained by the proposed approach compare very well with this optimum value, providing that P > 5 (the differences are less than 1%).
8.5 9 9.5 10 10.5 11 11.5 12 12.5 1 3 5 7 9 Directivity Number of subarrays, P
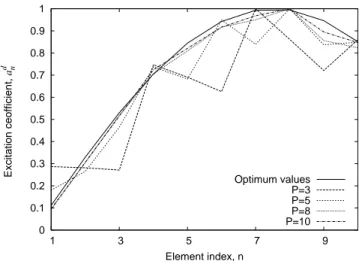
5 0 0.1 0.2 0.3 0.4 0.5 0.6 0.7 0.8 0.9 1 1 3 5 7 9 Excitation ceofficient, a d n Element index, n Optimum values P=3 P=5 P=8 P=10
Fig. 6 – Excitation coefficients for the difference pattern for several values of P. The optimum values are also reported.
This fact is also confirmed by Fig. 6, which shows the values of the excitation coefficients (joined by straight-line segments) obtained for P equal to 3, 5, 8, and 10, respectively. Moreover, in the same figure, the optimum excitation coefficients, derived in [9] for a similar configuration, are also provided for comparison purposes. It is worth noting that these excitations have been calculated by considering an independent feed network. As can be seen, the agreement is very good when P → 10.
As an example, Table I reports the values of the subarray weights and the group memberships of the array elements for the case in which P = 8. As expected, most of the elements are not grouped with any other and only two subarrays have more than one member.
For the same case, Fig. 7 shows the behavior of the fitness function versus the iteration number and Fig. 8 reports the array space factor related to the best individual of the population at the last iteration.
10.6 10.8 11 11.2 11.4 11.6 11.8 12 12.2 0 200 400 600 800 1000 Fitness function, f Iteration number, k
-50 -40 -30 -20 -10 -1.5 -1 -0.5 0 0.5 1 1.5
Array space factor [dB]
θ
Fig. 8 – Array space factor of the difference pattern for a Dolph- Tschebyscheff sum pattern with SLL = −30 dB and P = 8.
TABLE I–SUBARRAY WEIGHTS AND GROUP MEMBERSHIPS
OF THE MONOPULSE ANTENNA ELEMENTS FOR P=8.
Coefficients cn (N = 10) c1 c2 c3 c4 c5 c6 C7 c8 c9 c10 8 5 4 6 3 3 7 2 1 6 Subarray weights g1 g2 g3 g4 g5 g6 g7 g8 2.52 2.38 1.48 0.76 0.41 1.11 1.88 0.12 IV. CONCLUSIONS
In this letter, the directivity of the difference pattern of a monopulse antenna has been optimized by means of an hybrid real/integer differential evolution algorithm. In particular, a subarray configuration has been used for the monopulse antenna. It has been shown, by means of some numerical results and comparisons, that a proper choice of the weighting coefficients of the subarrays and an effective group membership of the antenna elements allow to obtain good directivity values even by using the simplified subarray configuration. It is worth noting that the approach could be extended by introducing further terms (related to other possible design requirements) in the fitness function to be optimized.
REFERENCES
[1] D. A. McNamara, “Synthesis of sum and difference patterns for two-section monopulse arrays,” Inst. Elect. Eng. Proc., vol. 135, pt. H, no. 6, pp. 371–374, Dec. 1988.
[2] D. A. McNamara, “Syntesis of sub-arrayed monopulse linear arrays through matching of independently optimum sum and difference excitations,” Inst.
Elect. Eng. Proc., vol. 135, pt. H, no. 5, pp. 293–296, Oct. 1988.
[3] P. Lòpez, J. A. Rodrìguez, F. Ares, and E. Moreno, “Subarray weighting for the difference patterns of monopulse antennas: Joint optimization of subarray configurations and weights,” IEEE Trans. Antennas Propagat., vol. 49, no. 11, pp. 1606–1608, Nov. 2001.
[4] J. M. Johnson and Y. Ramat-Samii, “Genetic algorithms in engenering electromagnetics,” IEEE Antennas Propagat. Mag., vol. 39, no. 4, pp. 7–21, Aug. 1997.
[5] S. Caorsi, A. Massa, M. Pastorino, and A. Randazzo, "Optimization of the difference patterns for monopulse antennas by an hybrid real/integer-coded differential evolution method," IEEE Trans. Antennas Propagat., vol. 53, no. 1, pp. 372–376, Jan. 2005.
[6] K. Price, "An introduction to differential differential evolution," in: D. Corne, M. Dorigo, and F. Glover, New Ideas in Optimization, McGraw-Hill, New York, 1999.
[7] R. Storn and K. Price, "Differential evolution - a simple and efficient heuristic for global optimization over continuous spaces," J. Global Optimization, Kluwer Academic Publishers, vol. 11, pp. 341–359, 1997.
[8] K. A. Michalski, “Electromagnetic imaging of elliptical-cylindrical conductors and tunnel using a differential evolution algorithm,” Microwave Opt.
Technol. Lett., vol. 28, no.3, pp. 164–169, Feb. 2001.
[9] D. A. McNamara, “Excitations providing maximum directivity for difference arrays of discrete elements,” Electronic Letters, vol. 23, no. 15, pp. 780–781, July. 1987.
[10] O. Einarsson, “Optimisation of planar arrays,” IEEE Trans. Antennas Propagat., vol. 27, no. 1, pp. 86-92, Jan. 1979. [11] C. A. Balanis, Antenna theory: analysis and design, New York, Wiley, 1982.